Article

Potato Non-Specific Lipid Transfer Protein StnsLTPI.33 Is Associated with the Production of Reactive Oxygen Species, Plant Growth, and Susceptibility to Alternaria solani

1
Department of Botany and Plant Pathology, Oregon State University, Corvallis, OR 97331, USA
2
Department of Molecular and Cellular Biology, University of Guelph, Guelph, ON N1G 2W1, Canada
*
Author to whom correspondence should be addressed.
Plants 2023, 12(17), 3129; https://doi.org/10.3390/plants12173129
Submission received: 1 August 2023 / Revised: 21 August 2023 / Accepted: 29 August 2023 / Published: 31 August 2023
(This article belongs to the Special Issue Exploring Plant Responses to Stress and Disease)

Abstract

:
Plant non-specific lipid transfer proteins (nsLTPs) are small proteins capable of transferring phospholipids between membranes and binding non-specifically fatty acids in vitro. They constitute large gene families in plants, e.g., 83 in potato (Solanum tuberosum). Despite their recognition decades ago, very few have been functionally characterized. Here, we set out to better understand the function of one of the potato members, StnsLTPI.33. Using quantitative polymerase chain reaction, we show that StnsLTPI.33 is expressed throughout the potato plant, but at relatively higher levels in roots and leaves compared to petals, anthers, and the ovary. We also show that ectopically-expressed StnsLTPI.33 fused to green fluorescent protein colocalized with an apoplastic marker in Nicotiana benthamiana leaves, indicating that StnsLTPI.33 is targeted to the apoplast. Constitutive overexpression of the StnsLTPI.33 gene in potato led to increased levels of superoxide anions and reduced plant growth, particularly under salt stress conditions, and enhanced susceptibility to Alternaria solani. In addition, StnsLTPI.33-overexpressing plants had a depleted leaf pool of pipecolic acid, threonic acid, and glycine, while they accumulated putrescine. To our knowledge, this is the first report of an nsLTP that is associated with enhanced susceptibility to a pathogen in potato.

1. Introduction

Plant nsLTPs are small proteins (usually below 10 kDa) capable of transferring phospholipids between membranes and binding non-specifically fatty acids in vitro [1,2,3,4]. They have a conserved eight cysteine motif (8CM) with the general pattern C-Xn-C-Xn-CC-Xn-CXC-Xn-C-Xn-C [1,2,5]. They also possess four or five α-helices that are stabilized by four conserved disulphide bridges [3,5,6,7]. Genome analysis shows that they constitute large families of proteins in plants, e.g., 49 in Arabidopsis, 52 in rice, and 83 in potato, and are classified into different types according to the spacing pattern between cysteines of the 8CM, the amino acid sequence identity, the presence and position of introns, and glycosylphosphatidylinositol modification site [8,9,10,11]. Most plant nsLTPs have a predicted signal peptide for targeting to the extracellular space, and several studies have proven experimentally their extracellular, cell wall, or plasma membrane localization (for review, see [11]). They also can accumulate in high amounts in plant tissues; e.g., they constitute 4% of soluble proteins extracted from maize seedlings [12].
Although the function(s) of most plant nsLTPs remain unknown, in large part due to the absence of a phenotype in knock-out or knock-down mutants, several studies have shown their involvement in plant growth and development, as well as roles in plant resistance to abiotic and biotic stresses [11], whereby they are often referred to as pathogenesis-related (PR) proteins of the PR-14 family [13]. nsLTPs also have antimicrobial activities against bacteria and fungi [14,15,16] and play a role in long-distance systemic acquired resistance (SAR) signaling against bacterial infections [17,18]. Notably, the constitutive overexpression of pepper nsLTPs CaLTP1 and CaLTP2 in tobacco enhanced resistance to the oomycete pathogen Phytophthora nicotianae and the bacterial pathogen Pseudomonas syringae pv tabaci [19]. Similarly, overexpression of StLTP10 in potato resulted in increased resistance to P. infestans [20].
nsLTPs are also involved in responses to abiotic stresses. T-DNA mutants of the Arabidopsis Disease-Related Nonspecific Lipid Transfer Protein 1 (DRNA1) gene have decreased tolerance to salt stress [21]. Likewise, a T-DNA mutant of the Lipid Transfer Protein 3 (LTP3) gene has increased sensibility to freezing, drought, and oxidative stress [22]. Conversely, overexpression of LTP3 enhanced tolerance to freezing and drought [22]. Likewise, overexpression of the Arabidopsis Azelaic Acid-Induced 1 (AZI1) nsLTP gene in Arabidopsis [23], the Oryza sativa Drought-Induced LTP (OsDIL) gene in rice [24], the pepper CaLTP1 gene in Arabidopsis [25], and the NtLTP4 gene in tobacco and potato [26,27] enhanced tolerance to drought and salt stresses.
In a previous study, we investigated by RNA-seq the molecular response of potato (S. tuberosum) to Potato Virus Y (PVY) inoculation [28]. PVY is one of the most devastating pathogens in potato production worldwide [29]. We identified several genes, including StnsLTPI.33, whose expression was strongly repressed in response to PVY inoculation (Goyer et al., 2015). Here, we investigated the role of StnsLTPI.33, which encodes a putative nsLTP, and showed that the overexpression of StnsLTPI.33 increases susceptibility to A. solani and decreases tolerance to salt stress.

2. Results

2.1. The Gene PGSC0003DMG400031236 Encodes a Putative nsLTP

We previously reported that the expression of the gene PGSC0003DMG400031236 (Soltu.DM.10G018670.1) in the potato variety Premier Russet was downregulated in response to PVY [28]. This gene is annotated as an nsLTP in Spud DB (http://spuddb.uga.edu/index.shtml [accessed on 1 June 2023]). We subsequently cloned and sequenced its cDNA, which encodes a 114-amino-acid-long protein (Figure 1a) that contains the 8CM C-Xn-C-Xn-CC-Xn-CXC-Xn-C-Xn-C, which is characteristic of plant nsLTPs. Based on the spacing pattern between cysteines, Li et al. [30] classified the protein encoded by this gene as a type I nsLTP, a group of 36 members in potato, and named it StnsLTPI.33. We used this denomination in this paper henceforth. A scan of the StnsLTPI.33 amino acid sequence in InterPro showed that the protein contains the Pfam domain PF00234 that is characteristic of LTPs and associated the protein with the InterPro GO terms ‘lipid transport’ (GO:0006869) and ‘lipid binding’ (GO:0008289). The SignalP5.0 software predicts an N-terminal 24-amino-acid-long signal peptide (Figure 1a) with a likelihood score of a secretory pathway localization of 0.9993. The mature protein has a predicted molecular weight of 9.1 kDa and an isoelectric point of 8.9. Further, the protein structure homology-modelling server SWISS-MODEL predicts a protein that comprises five α-helices (Figure 1b).

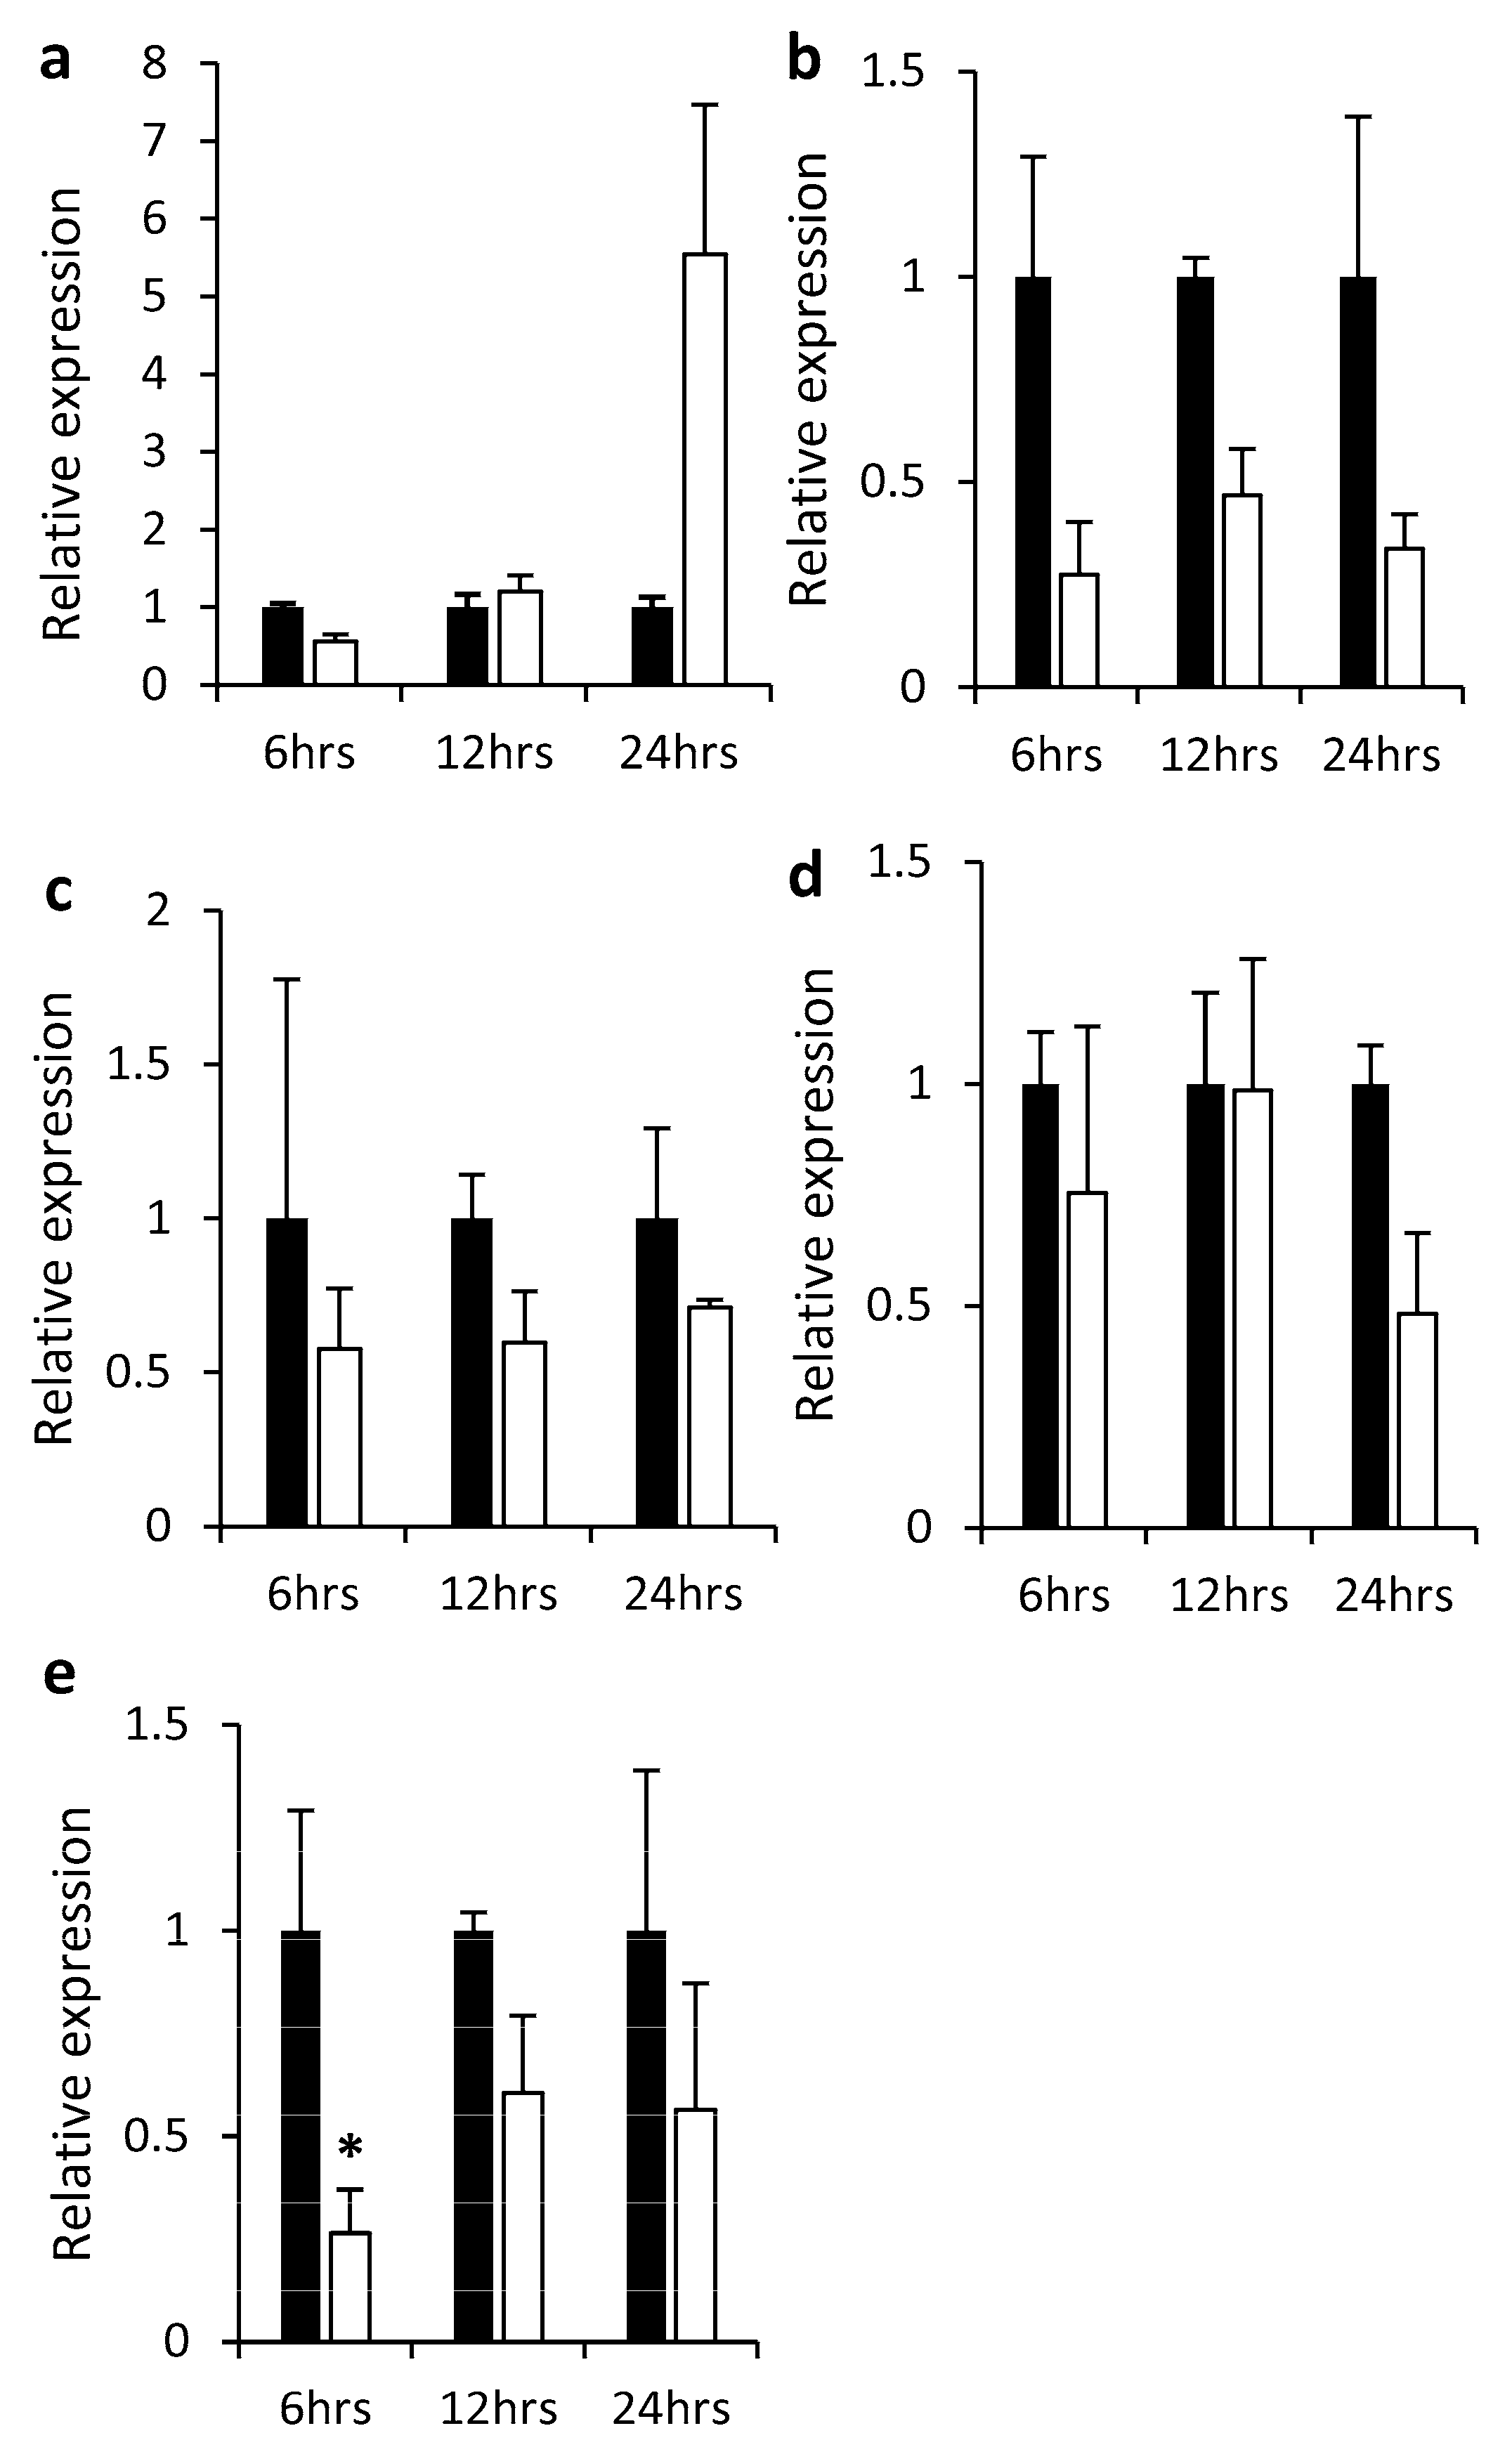
2.2. Gene Expression in Different Plant Tissues and in Response to Hormones

We analyzed the expression of StnsLTPI.33 by qPCR in different organs in the variety Premier Russet (Figure 2). StnsLTPI.33 transcripts were at the highest relative levels in the roots and the leaves. They were also detected in stolon, tubers, petals, and stigma, but were at low levels in anthers and ovary.
To obtain more information on the functions of StnsLTPI.33, we searched for cis-regulatory elements in the 1000 bp promoter region of StnsLTPI.33 using PlantCARE. We found cis-acting regulatory elements that are responsive to auxin and methyl jasmonate (Me-JA) (Table S1). Me-JA is a precursor of jasmonic acid, an important player in plant defense responses. This suggests that StnsLTPI.33 might be responsive to Me-JA treatment. Consistent with this hypothesis, StnsLTPI.33 transcripts accumulated over five-fold 24 h after Me-JA treatment (Figure 3a), although the difference with the mock was not statistically significant. We also checked the expression of StnsLTPI.33 in response to the other hormones salicylic acid (SA), aminocyclopropanecarboxylic acid (ACC), the precursor of ethylene, abscisic acid (ABA), and gibberellic acid (GA). All these hormones reduced the expression of the StnsLTPI.33 at the time points tested (Figure 3b–e), although the differences between treated and control samples were not statistically significant, except for GA 6 h after treatment (Figure 3e). It is noteworthy that StnsLTPI.33 is a low-expressed gene in general, and that changes in its expression are somewhat difficult to detect even with a sensitive method like qPCR.

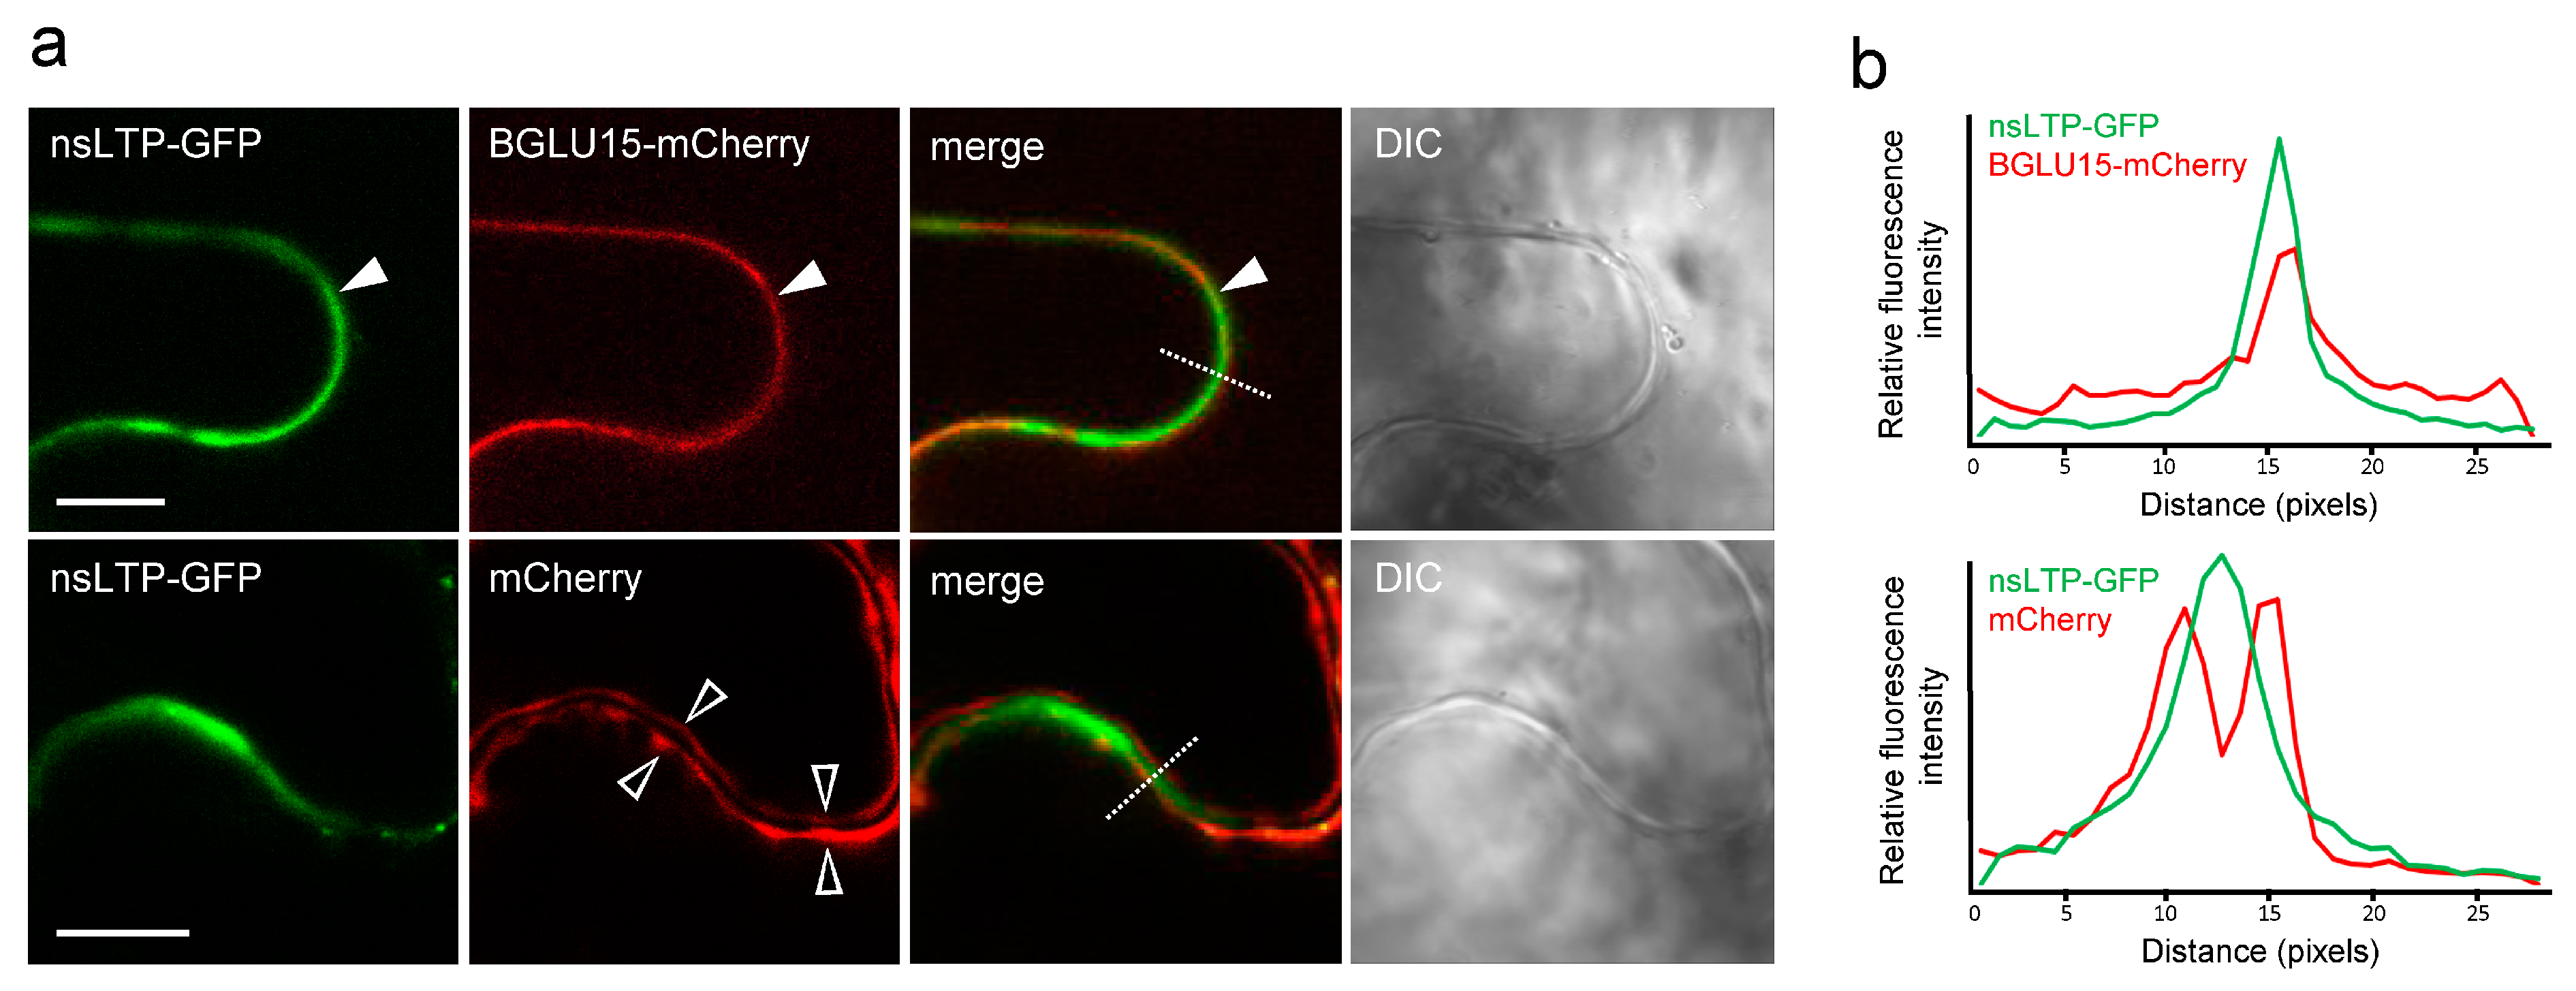
2.3. Subcellular Localization of StnsLTPI.33

As mentioned above, the StnsLTPI.33-encoded protein is predicted to be localized in the secretory pathway and, thus, possibly the apoplast. To verify this, we cloned the full coding sequence of StnsLTPI.33 upstream of the green fluorescent protein (nsLTP-GFP). We then used Agrobacterium to transiently express nsLTP-GFP in N. benthamiana leaves [31]. To identify subcellular compartments, we co-expressed nsLTP-GFP with either mCherry alone, which served as cytosolic marker protein, or BGLU15-mCherry, which served as an apoplastic marker protein [32]. As shown in Figure 4, nsLTP-GFP was adjacent to, but did not colocalize with, mCherry in the cytosol (Figure 4). By contrast, nsLTP-GFP consistently colocalized with the apoplastic marker BGLU15-mCherry (Figure 4), indicating that StnsLTPI.33 is localized in the apoplast.

2.4. Phenotypic Characterization of Transgenic Lines Overexpressing StnsLTPI.33

Next, we generated plants that express the StnsLTPI.33 cDNA under the CaMV35S promoter by stable transformation with A. tumefaciens. We obtained 15 independent transgenic plants and used qPCR to determine the expression levels of StnsLTPI.33 in leaf tissues of plants grown in magenta boxes (Figure 5). The expression of StnsLTPI.33 increased from ~1.2 to ~317 times that of the control. Based on these results, we selected two independent lines with different levels of expression for further characterization: nsLTP10, which expressed the transgene at the highest level (nsLTP9 died and could not be used), and nsLTP11, which showed a mid-range expression level of the transgene.
Line nsLTP10 grew smaller than the control in tissue culture (smaller shoots and roots), while nsLTP11 was not statistically different from the control (Figure 6a,b and Figure S1). These differences between the two overexpression lines might be due to the different levels of expression of the transgene in these two lines, although we did not check the corresponding protein levels. Under greenhouse conditions, the smaller phenotype of StnsLTPI.33-overexpression lines was still visible but was attenuated (Figure S2).

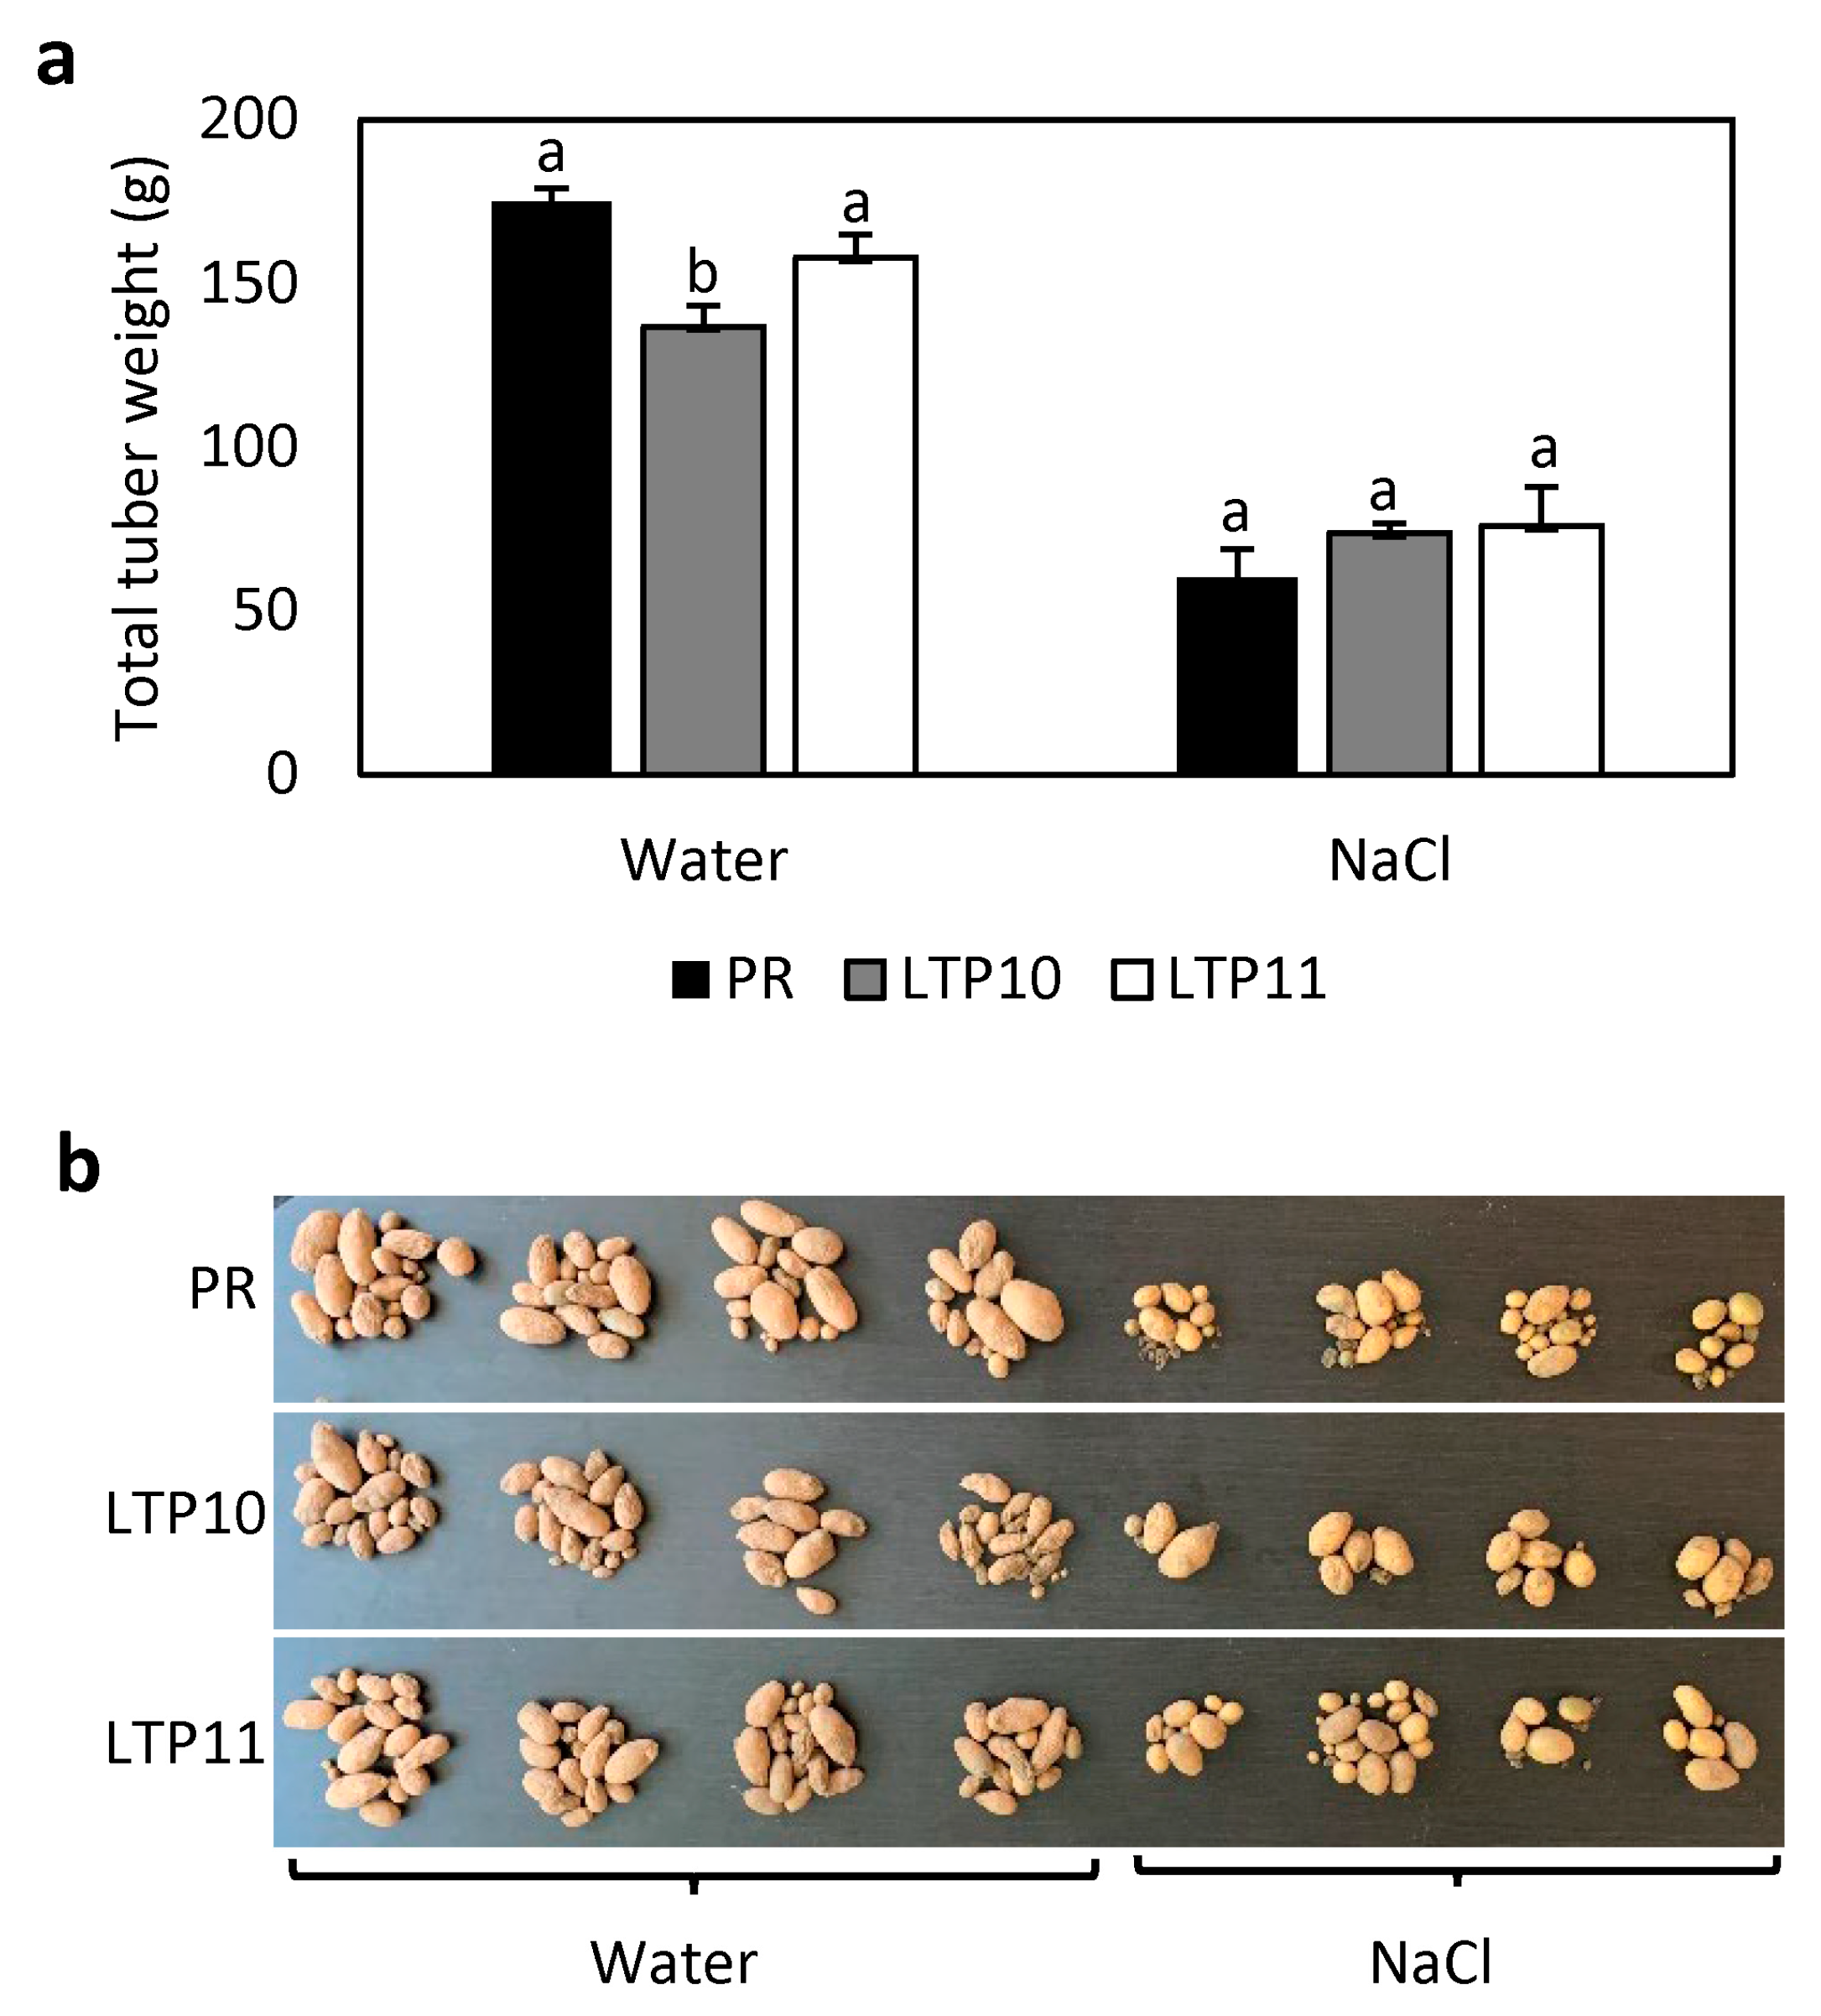
2.5. Response of StnsLTPI.33-Overexpression Lines to Salt Stress

Because plant nsLTPs have been involved in the response to abiotic stress [22,26,33,34], we checked whether StnsLTPI.33 was involved in plants’ response to abiotic stress. For this, we grew StnsLTPI.33-overexpressing lines on MS medium containing 100 mM NaCl. The short shoots and roots phenotype of the StnsLTPI.33-overexpressing line nsLTP10 grown on MS medium was further exacerbated when plants were grown on MS medium with 100 mM NaCl compared to the control Premier Russet (Figure 6a,b). Shoots of line nsLTP11 were also significantly shorter than those of the control under salt stress conditions. Length of shoots of lines nsLTP10 and nsLTP11 were 10% and 40%, respectively, of that of the control Premier Russet when grown on MS with 100 mM NaCl, compared to 29% and 85% when grown on MS medium. Likewise, the length of the roots of lines nsLTP10 and nsLTP11 were 4% and 61%, respectively, of that of the control Premier Russet when grown on MS with 100 mM NaCl, compared to 39% and 103% when grown on MS medium. We also grew plants in pots in a greenhouse and irrigated them with water or a 100 mM NaCl solution. Under water irrigation, the tuber yield of line nsLTP10 was slightly affected, while that of nsLTP11 was not (Figure 7). Under salt irrigation, the yield of all genotypes decreased evenly, and there was no difference between StnsLTPI.33-overexpressing lines and control plants. These results show that the overexpression of StnsLTPI.33 further exacerbated the growth phenotype when plants were grown in tissue culture but had little effect on tuber yield when plants were grown in a greenhouse and whether plants were irrigated with water or salt.

2.6. Response of StnsLTPI.33-Overexpression Lines to PVY

Because StnsLTPI.33 was one of the most responsive genes to PVY inoculation [28], we tested the response of the StnsLTPI.33-overexpressing lines compared to the control Premier Russet to three different strains of PVY (PVYO, PVYNTN, and PVYN-Wilga). Premier Russet contains a strain-specific Ny resistance gene that confers resistance against PVYO and PVYN-Wilga, while it is susceptible to PVYNTN [35]. Thus, we might expect decreased resistance to PVYO and PVYN-Wilga if StnsLTPI.33 is a negative regulator of resistance, or increased resistance to PVYNTN if StnsLTPI.33 is a positive regulator of resistance. To test this, we inoculated leaflets mechanically and evaluated the systemic spread of the virus in non-inoculated leaves (i.e., in-season infection) and in progeny tubers (i.e., seed-borne infection) by RT-PCR. We repeated the experiment three times (Table 1).
In general, leaf and tuber infection rates of the control Premier Russet with PVYO and PVYN-Wilga were low, which is consistent with the presence of a strain-specific Ny resistance gene in Premier Russet against PVYO and PVYN-Wilga, while infection rates with PVYNTN were high. However, infection rates with PVYO, PVYN-Wilga, and PVYNTN in StnsLTPI.33-overexpressing lines were similar to those in Premier Russet. These results suggest that StnsLTPI.33 does not play a major role in the response to PVY.

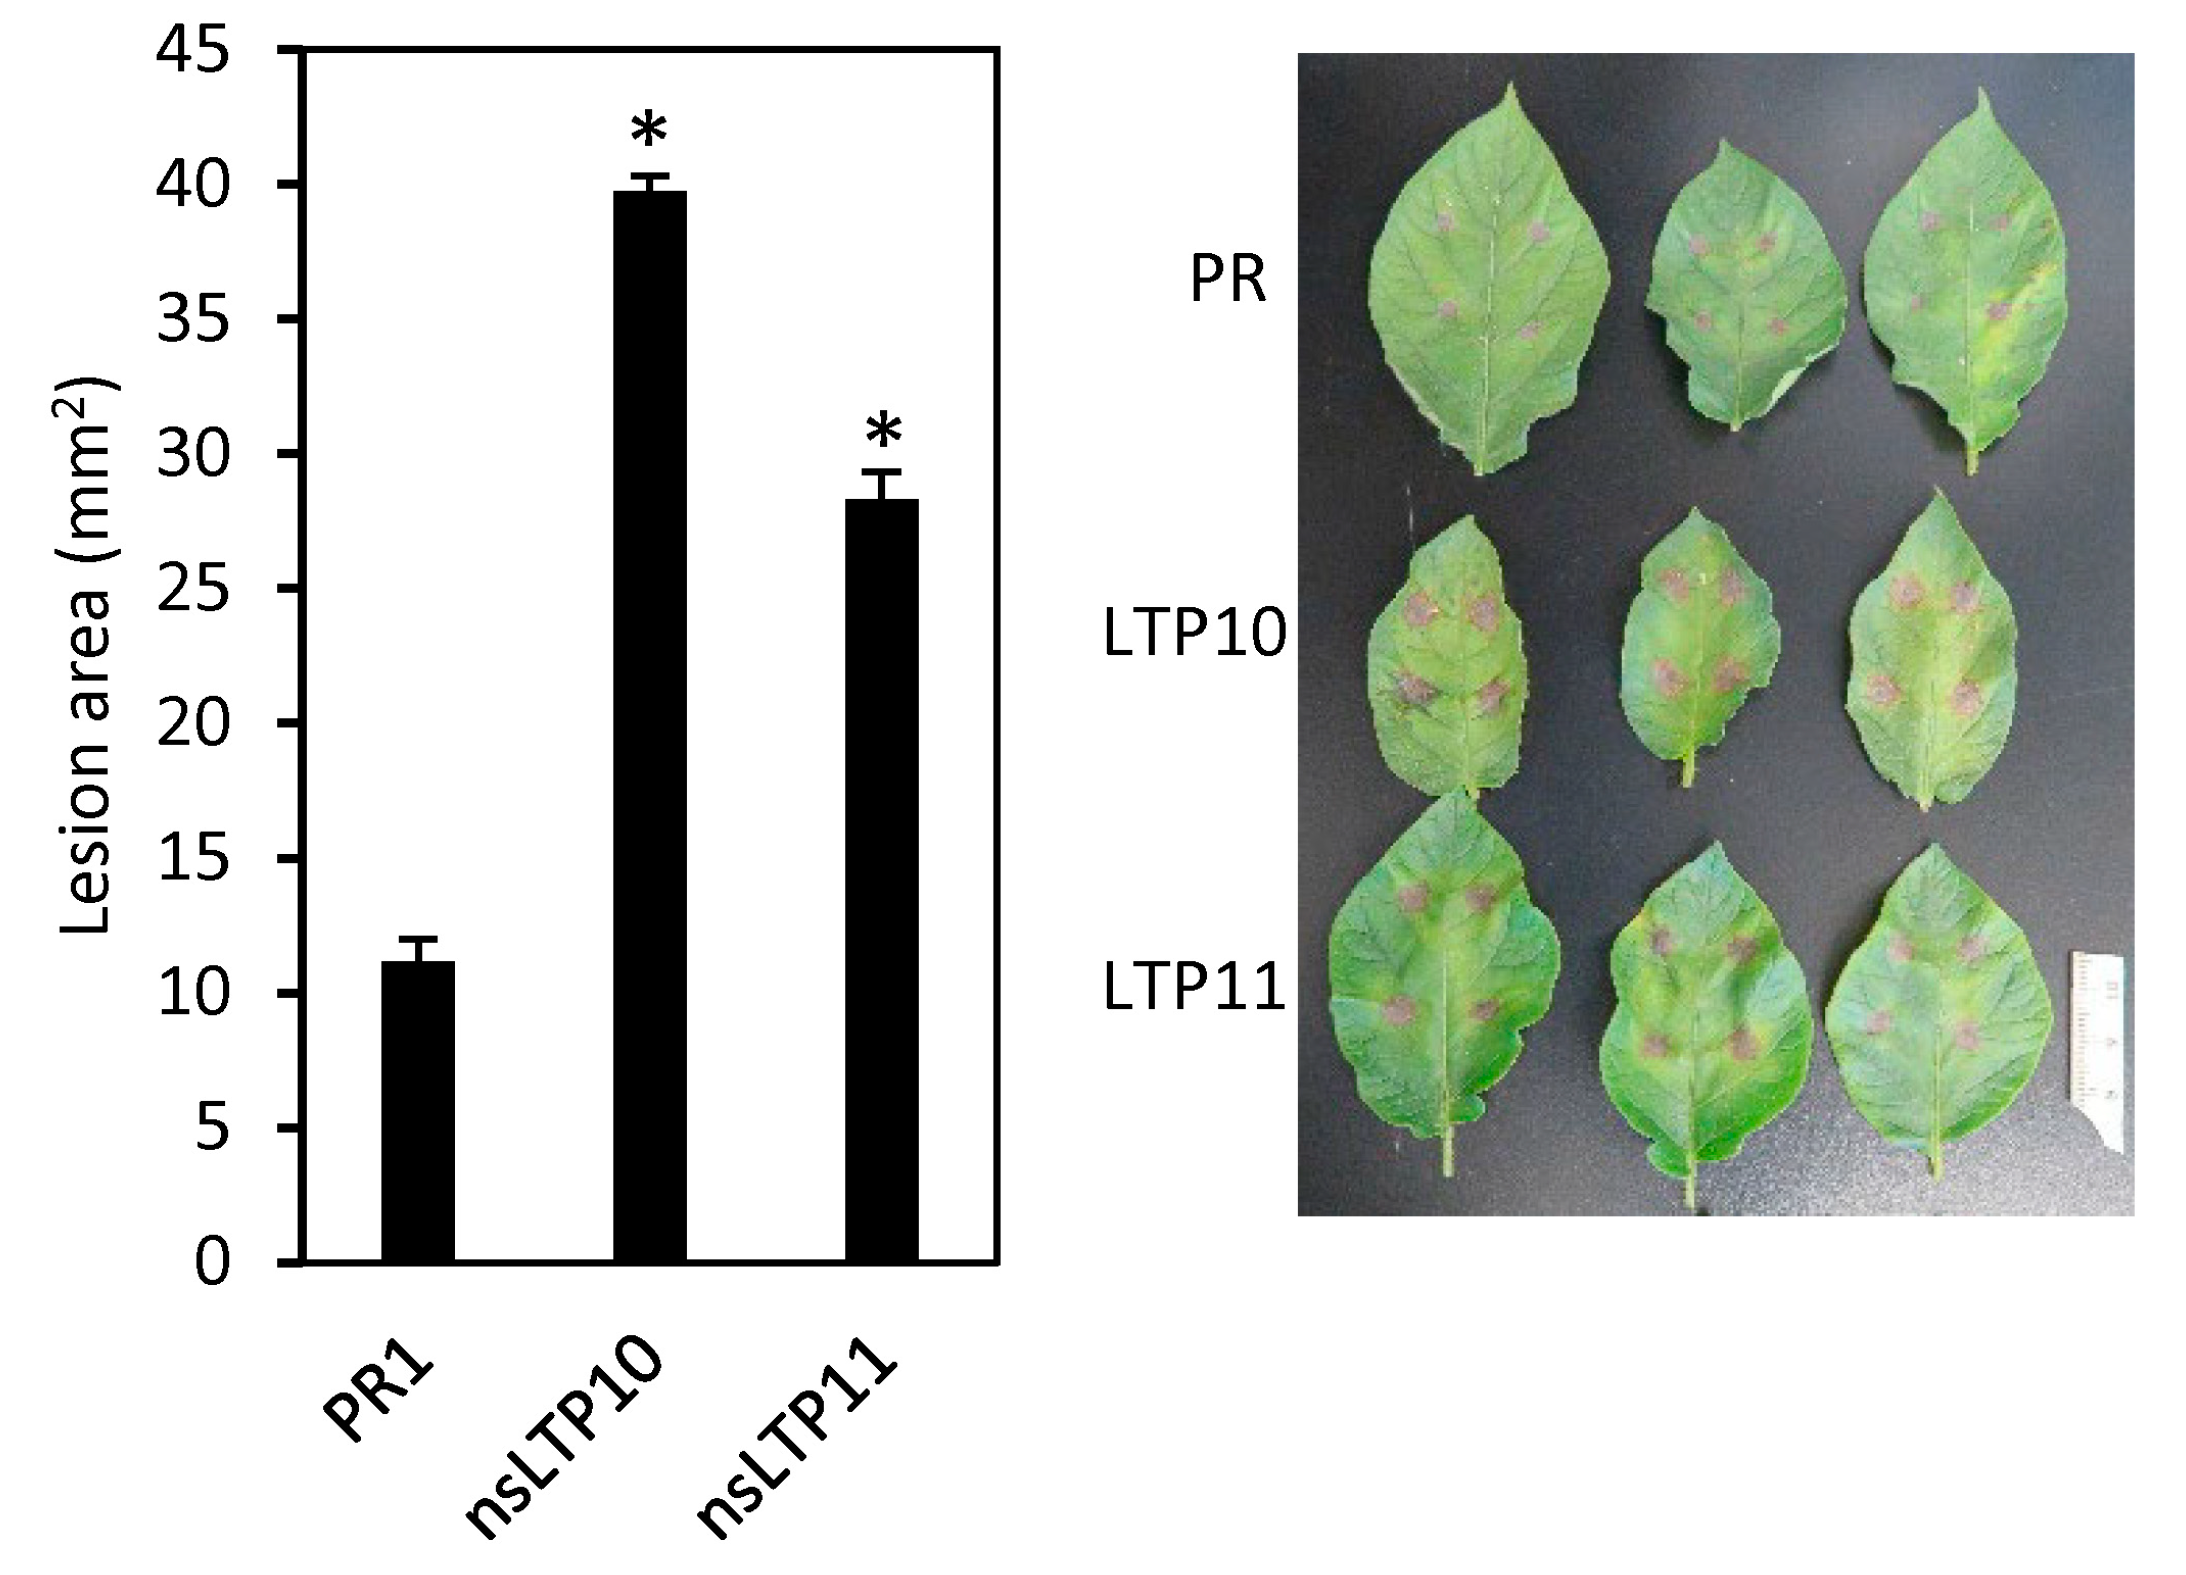
2.7. Response of StnsLTPI.33-Overexpression Lines to Alternaria Solani

Several studies have shown an association between nsLTPs and plant defense response against fungal, bacterial, and oomycete pathogens [19,20,26,36]. This prompted us to evaluate the response of StnsLTPI.33-overexpressing lines against the fungal pathogen A. solani. Necrotic lesions caused by A. solani were significantly larger on leaves of StnsLTPI.33-overexpressing lines than on those of the Premier Russet control (Figure 8), showing that StnsLTPI.33-overexpressing lines were more susceptible to A. solani.

2.8. StnsLTPI.33-Overexpression Lines Accumulate Superoxide Anions

To investigate the molecular changes in StnsLTPI.33-overexpressing lines that might explain the smaller size phenotype and the higher susceptibility to A. solani, we stained leaves of the line nsLTP10 with Nitro Blue Tetrazolium (NBT) and 3,3′-diaminobenzidine (DAB). NBT is an indicator of the level of superoxide anions, while DAB is an indicator of the level of hydrogen peroxide. We observed a heavier blue coloration in all leaf tissues of nsLTP10 compared to the control Premier Russet (Figure 9), indicating an overaccumulation of superoxide anions in this line. Conversely, staining of leaves with DAB showed a slightly lighter coloration in veins of nsLTP10 compared to the control Premier Russet, indicating a lower accumulation of hydrogen peroxide in vascular tissues of this line.
We also used GC-MS to examine general metabolic changes in the StnsLTPI.33-overexpressing line nsLTP10 and the Premier Russet control. A heatmap analysis of the top 50 leaf metabolites shows that samples were grouped by genotype (Figure 10), indicating good reproducibility between biological replicates. In general, more metabolites were lower in abundance in nsLTP10 compared to the control Premier Russet (Figure 10 and Tables S2 and S3). By restricting our analysis to metabolites whose changes were significantly different at a p-value < 0.05, fifteen metabolites accumulated at different levels in nsLTP10 compared to Premier Russet (Table S3). Among these, only one, putrescine, accumulated in larger amounts in nsLTP10 compared to Premier Russet. Pipecolic acid was the metabolite found in the lowest relative amount in nsLTP10 compared to Premier Russet, followed by threonic acid and glycine. Other metabolites that accumulated differentially included sugars, sugar alcohols, organic acids, and amino acids. Two compounds with retention times 20.84 min and 15.86 min were also found in lower amounts in nsLTP10 compared to Premier Russet, but they could not be identified by our methods.

3. Discussion

In this study, we investigated the role of StnsLTPI.33, one member of the large nsLTP gene family in potato. This family member first caught our interest because it is one of the most strongly differentially expressed genes in response to PVY inoculation in potato [28]. Several studies have previously reported the involvement of plant nsLTPs in virus resistance. Pepper CaLTP1 expression was induced by an incompatible strain of tobacco mosaic virus [37], and suppression of its expression enhanced pepper plants’ susceptibility to mosaic mottle virus [19]. The effect of its constitutive overexpression on virus resistance was not reported [19]. Potato StLTP6 expression was induced by PVY and potato virus S, and overexpression of StLTP6 promoted accumulation of viral mRNAs, while silencing it reduced viral mRNAs accumulation [38]. In the case of StnsLTPI.33, we observed a decrease of its transcripts in an incompatible interaction with PVY [28]. Therefore, we hypothesized that StnsLTPI.33 might also play a role in the response to a viral pathogen and expected changes in infection rates in StnsLTPI.33-overexpression plants. However, our data show that constitutive overexpression of StnsLTPI.33 had no effect on the infection rate of plants inoculated with either compatible or incompatible strains of PVY, suggesting that this gene may not play a major role in susceptibility or resistance to PVY. Another possibility is that changes in susceptibility or resistance to PVY can only be observed if the StnsLTPI.33 protein levels reach a certain threshold. Therefore, it would be interesting to verify the accumulation level of the StnsLTPI.33 protein in StnsLTPI.33-overexpressing plants.
Most studies have investigated the function of plant nsLTPs in the context of non-viral pathogens and have reported that overexpression of nsLTP genes enhances resistance to fungal, bacterial, and oomycete pathogens [19,20,25,39,40,41,42,43]. Surprisingly, our work shows that plants that constitutively overexpress StnsLTPI.33 are more susceptible to A. solani, indicating that StnsLTPI.33 is a susceptibility gene in the response of potato plants to this fungal pathogen. The accumulation of superoxide anions in StnsLTPI.33-overexpressing plants might explain the higher susceptibility of these plants to A. solani. Indeed, a burst of reactive oxygen species increased susceptibility to the early blight disease caused by A. solani in potato [44]. Conversely, this burst conferred resistance to the late blight pathogen P. infestans [44]. Therefore, it would be interesting to test the resistance of StnsLTPI.33-overexpressing plants to other pathogens to determine whether StnsLTPI.33 is a susceptibility gene specific to A. solani. If it is, then hyperaccumulation of superoxide anions likely accelerated cell death and benefited the necrotrophic lifestyle of A. solani. Previous studies have shown that necrotrophic pathogens often highjack defense signaling to promote the accumulation of reactive oxygen species and accelerate cell death to their benefit [44,45,46]. If StnsLTPI.33 is a susceptibility gene to a broader range of pathogens, then the molecular mechanism of susceptibility might be related to other factors, pipecolic acid being a potential candidate. Indeed, the level of this non-protein amino acid was more than eight times lower in the StnsLTPI.33-overexpressing plant nsLTP10 compared to the control Premier Russet, indicating that StnsLTPI.33 negatively regulates the levels of pipecolic acid, directly or indirectly. Pipecolic acid is essential in the activation of local resistance and systemic acquired resistance to bacterial and fungal pathogens [47,48,49,50].
StnsLTPI.33-overexpressing plants also had a shorter shoot and root phenotype, in particular when plants were grown in tissue culture. LTPs are associated with plant growth, although the exact molecular mechanism remains unclear. It could be through cell wall loosening and/or lipid deposition [5,10,51]. However, this function of LTPs in cell expansion does not explain the shorter phenotype of StnsLTPI.33-overexpressing plants. Hence, it is more likely that StnsLTPI.33 has an indirect association with plant growth via metabolic changes triggered by its overexpression. For instance, reactive oxygen species are important signaling molecules for plant growth and development [52]. An imbalance of reactive oxygen species such as that seen in StnsLTPI.33-overexpressing plants likely has an effect on the normal growth and development of these plants. That StnsLTPI.33 is localized in the apoplast where superoxide anions are produced by NADPH oxidases [53,54] reinforces the idea of a relationship between StnsLTPI.33 and the production of reactive oxygen species. Putrescine was another metabolite whose content significantly changed in StnsLTPI.33-overexpressing plants. It accumulated 2.7-fold in the nsLTP10 line compared to the control. Putrescine is one of the main polyamines found in plants [55]. Polyamines play important roles in plant growth and development and oxidative stress. Whether putrescine plays a role in the growth phenotype of StnsLTPI.33-overexpressing plants remains unclear.
In conclusion, this work shows that StnsLTPI.33 is an apoplastic protein whose gene is associated with plant growth and susceptibility to A. solani, and likely plays a role in the production of superoxide anions. It illustrates a new role for nsLTPs. However, future investigations that include StnsLTPI.33 protein quantification are needed to better understand the molecular mechanisms involved.

4. Materials and Methods

4.1. Phylogenetic Analysis

Amino acid sequences of nsLTPs from potato (S. tuberosum), tobacco (Nicotiana tabacum), tomato (S. lycopersicon), and Arabidopsis thaliana were aligned using Muscle version 3.8.31 [56] using default settings for multiple pairwise alignments. Potato nsLTP amino acid sequences were retrieved from SpudDB (http://solanaceae.plantbiology.msu.edu/index.shtml, [accessed on 24 August 2020]). Tobacco and tomato nsLTP amino acid sequences were obtained from the Solanaceae Genomics Network (https://solgenomics.net/, [accessed on 24 August 2020]).

4.2. Plant Growth Conditions

Potato plantlets variety Premier Russet were propagated on Murashige and Skoog (MS) medium (4.41 g L−1 MS modified BC potato salts, 3% sucrose, 100 mg L−1 myo-inositol, 2 mg L−1 glycine, 0.5 mg L−1 nicotinic acid, 0.5 mg L−1 pyridoxine, 0.1 mg L−1 thiamin, 20 µg L−1 1-naphthaleneacetic acid, 0.5 g L−1 2-(N-morpholino)ethanesulfonic acid, 8 g L−1 phytoagar, pH 5.6) under a 10 h photoperiod at 22 °C and 36% relative humidity.
For salt stress assays in tissue culture, we made new cuttings from four-week-old plantlets and placed them in magenta boxes containing 50 mL MS agar medium with 0 or 100 mM NaCl. In these experiments, we omitted myo-inositol from the medium. Each magenta box contained six plantlets (one genotype per box per treatment). After 17 days under the growth conditions above, we gently uprooted each plantlet to measure shoot and root length. This experiment was repeated three times.
All other experiments with potato plants were conducted in a greenhouse. For this, three-week-old plantlets from tissue culture were transferred into soil (four parts potting mix, one part sand) with slow-release fertilizer (Osmocote Plus) in 4 L pots in a greenhouse. Greenhouse temperature conditions were set at 21 °C at day and 15 °C at night, and supplemental daylight was provided with 400 W high-pressure sodium lamps to maintain a 14 h photoperiod. For the salt stress assay, each genotype was grown in three to four replicates per treatment (salt or control) in a randomized complete block design. We watered plants every three to five days with 500 mL (drench) of a 100-mM NaCl solution or water for controls for one month starting five weeks after transfer to soil. We harvested tubers 20 days after the end of the salt treatment. N. benthamiana plants used in subcellular localization experiments were grown in soil with a 16 h/8 h day/night cycle at 22 °C and a light intensity of 50 µmol m−2 s−1.

4.3. Generation of StnsLTPI.33-Overexpressing Potato Plants

Total RNAs were extracted from leaves from the potato variety Premier Russet using the hot phenol method as previously described [57] and treated with DNase (Ambion® DNA-free™ kit, LifeTechnologies, Carlsbad, CA, USA). cDNAs were synthesized by M-MuLV Reverse Transcriptase (New England Biolabs, Ipswich, MA, USA) using an oligo(dT)18 primer, and the PGSC0003DMG400031236 (StnsLTPI.33)-encoded cDNA was amplified using PrimeSTAR Max DNA Polymerase (Takara Bio USA, San Jose, CA, USA) using the nsLTPfwd and nsLTPrev primers (Table S4). The 587-bp amplicon was directly cloned into pCRTM4Blunt TOPO® vector (ThermoFisher Scientific, Waltham, MA, USA), and the resulting construct was introduced into One Shot TOP10 E. coli cells (ThermoFisher Scientific). Eighteen kanamycin-resistant isolated colonies were then cultured in LB medium supplemented with 50 mg L−1 kanamycin. Plasmid DNA was extracted from each culture and sent for Sanger sequencing. Sequences alignment showed that PGSC0003DMG400031236 has four identical alleles in Premier Russet (one clone, 3b, had a 60 bp insertion that likely corresponds to an unspliced variant) (Figure S3). Clone 4-1 was used as a template to amplify a 361 bp amplicon using the nsLTPattFwd and nsLTPattRev primers (Table S4). The 361 bp amplicon was then ligated into pDONRTM/Zeo vector (ThermoFisher Scientific) using BP clonase following the manufacturer’s recommendations and then subcloned into the pMDC32 plant binary vector [58] by recombination using LR clonase. The final construct was verified by restriction digestion and Sanger sequencing. The DNA construct was introduced into the potato variety Premier Russet by A. tumefaciens (strain EHA105)-mediated stable transformation as previously described [59].

4.4. Quantitative Reverse Transcription PCR

Total RNAs were isolated as described above. cDNAs were synthesized from 1 µg RNA using M-MuLV reverse Transcriptase (New England Biolabs). RT-qPCR analysis was performed on an Mx3000P real-time PCR detection system (Stratagene, San Diego, CA, USA) using Brilliant III Ultra-Fast SYBR® Green QPCR Master Mix (Agilent, Santa Clara, CA, USA). Potato L2, 18S rRNA, and EF1-α genes were used as housekeeping genes for normalization. Three biological replicates sampled from three individual plants were used for each treatment, and two technical replicates for each biological replicate were assayed by qRT-qPCR. Expression levels were calculated by the 2-∆∆Ct method as described by Ref. [60]. Primer sets used for gene expression analysis are listed in Table S4.

4.5. Hormone Treatments

Plants grown in a greenhouse were treated with 1 mM ACC, 1 mM GA, 1 mM ABA, 1 mM Me-JA, or 1 mM SA. For Me-JA treatment, three plants were sprayed with a total of 100 mL of hormone solution or water as control until run-off and kept in covered translucent boxes. For the ACC, ABA, SA, and GA treatments, we harvested three leaves from each of the three plants for each treatment and dipped them in 50 mL of the hormone solution or water control in square petri dishes. Samples were collected at 6, 12, and 24 h after treatment and frozen in liquid nitrogen until analysis.

4.6. Subcellular Localization

Leaves of ~4-week-old N. benthamiana plants were transiently (co) transformed by infiltration with A. tumefaciens (strain LBA4404) carrying the selected binary vector (s). Detailed procedures for A. tumefaciens growth, transformation, infiltration, and processing of N. benthamiana leaf material for microscopy have been described previously [61,62].
To construct pMDC83/nsLTP-GFP (containing the two copies of the constitutive 35S Cauliflower Mosaic Virus promoter (CaMV35S) and encoding StnsLTPI.33 appended at its C terminus to the GFP), the open reading frame (ORF) of StnsLTPI.33 with attB1 and attB2 sequences in 5′ and 3′, respectively, was synthesized by GeneScript (Table S4) and cloned in the entry vector pDONRTM/Zeo using BP clonase. The cloned plasmid was transformed into E. coli and confirmed by restriction enzyme digestion. We then performed LR recombination reaction with the positive entry clone and the pMDC83 vector [58] to generate 2xCaMV35S::nsLTP::GFP expression clone. The expression clone was confirmed by restriction enzyme digestion and sequencing at the University of Guelph Genomics Facility.
To construct pMDC32/BGLU15-mCherry (containing the CaMV35S promoter and encoding Arabidopsis β-glucosidase 15 [AT2G44450] appended at its C terminus to the monomeric red fluorescent protein mCherry), the ORF of the BGLU15-mCherry fusion was amplified (via polymerase chain reaction [PCR]) using pRTL2/BGLU15-Cherry [32] as template and the primers BGLU15-mcherry pDONR Fp and BGLU15-mcherry pDONR Rp (Table S4). Oligonucleotide primers were custom synthesized by Sigma-Aldrich (St. Louis, MO, USA). Thereafter, the BGLU15-mCherry ORF was subcloned in pDONRTM/Zeo and then in the plant binary expression vector pMDC32/ChC [63] using Gateway cloning technology [58]. The sequence of pMDC32/BGLU15-mCherry plasmid was verified using automated DNA sequencing performed at the University of Guelph Genomics Facility. The construction of pMDC32/mCherry, encoding mCherry alone and serving in this study as a cytosolic marker protein, has been described elsewhere [64].
Imaging of transformed N. benthamiana leaves was carried out three days after infiltrations using a Leica SP5 CLSM equipped with a 63x glycerol-immersion objective (NA = 1.3) and five laser systems, including an argon-ion laser; green, orange, and red helium-neon lasers; and a Radius 405 nm laser (Leica Microsystems, Wetzlar, Germany). All images of leaf cells were acquired as single optical sections (i.e., z-sections) and saved as 512- × 512-pixel digital images. Excitations and emission signals for fluorescent fusion proteins (GFP 488/500-530 nm for GFP and 543/565-585 nm for mCherry) were collected sequentially as single optical sections in double-labeling experiments as described previously [65]. Single-labelling experiments showed no detectable crossover at the settings used for data collection. Micrographs of plant cells shown in individual figures are representative of at least three separate experiments, including > 20 transformed N. benthamiana leaf cells. Fluorescence intensity profiles of selected areas (i.e., lines) of micrographs were generated using the “Plot Profile” tool in ImageJ (v.1.43; https://imagej.nih.gov/ij, [accessed on 1 July 2022]) [66].

4.7. Detection of Hydrogen Peroxide and Superoxide Anion Radicals

We used DAB (Sigma-Aldrich) and NBT (Sigma-Aldrich) for staining analysis of hydrogen peroxide and superoxide anion radicals, respectively, using the methods described by Li et al. [67].

4.8. Metabolite Analysis by GC-MS

Leaf metabolites were analyzed by GC-MS (Agilent 7890B GC, Agilent 5977B MSD). Metabolites were extracted from 50 mg of leaf tissue in a solution of water:methanol:chloroform (1:2.5:1). Ribitol was added to each sample as an internal standard. Samples were placed on ice for 5 min on a shaking platform rotating at 130 rpm and then centrifuged at 4 °C for 2 min at 21,000× g to pellet cellular debris. The supernatant was transferred to a clean microcentrifuge tube and 280 µL of water was added to separate the aqueous phase from the organic phase. After a 2 min centrifugation at 21,000× g, the upper aqueous phase was collected and placed into a clean microcentrifuge tube. The samples were frozen at −80 °C, then placed into a centrifugal vacuum concentrator and lyophilized to dryness overnight. Dried samples were stored at −80 °C until further analysis. A no-tissue extraction control (i.e., reagent blank) was included to assess if detected peaks are plant tissue-specific.
For GC-MS analysis, the dry samples were derivatized in a two-step process. First, 40 µL of 20 mg mL−1 methoxamine HCl (CovaChem, Loves Park, IL, USA) dissolved in pyridine (Sigma-Aldrich) was added to each sample, and the samples were incubated at 37 °C for 90 min in a 1800 rpm shaking incubator. Second, 80 µL of N-methyl-N-trimethylsilyl-trifluoroacetamide with 1% chlorotrimethylsilane (CovaChem) was added to each sample, and the samples were incubated at 37 °C for 30 min in a shaking incubator at 1800 rpm. The derivatized samples were then transferred to autosampler vials, and one µL of each sample was injected with a 15:1 split into an Agilent 7890B GC system with a 30 m + 10 m Duraguard × 0.25 mm × 0.25 µm DB-5MS + DG Agilent column. The oven temperature was kept at 60 °C for 1 min, then ramped to 300 °C at a rate of 10 °C/min and held at 300 °C for 10 min. Analytes were detected with an Agilent 5977B MSD in EI mode scanning from 50 to 600 m/z. The injection order of the samples was randomized. The no-tissue extraction control was injected after every three injections of tissue sample to control for potential carry over from previous samples.
We used AMDIS [68] for mass spectrum analysis, component identification, and peak area quantification, and the Agilent Fiehn 2013 GC/MS Metabolomics RTL Library [69] for automated component identification. Matches to both retention time and mass spectrum were required for a positive identification, with AMDIS settings of a minimum match factor of 70, a retention time window of 0.2 min, strong match factor penalties, and maximum penalty of 60. Components identified in the no-tissue extraction controls were removed from the data set.
To determine relative abundance, peak areas of components were first normalized to the respective measured fresh weight of extracted tissue. The normalized peak areas were then normalized to the peak area of the internal standard ribitol. Statistical analyses were performed with Metaboanalyst 5.0 (https://www.metaboanalyst.ca/ [accessed on 21 June 2023]) using the following settings: ‘replace missing values with 1/5 limit of detection’ and ‘normalization by reference feature ribitol’.

4.9. PVY Strains, Inoculation and Detection

Fresh tobacco (N. tabaccum var. Samsun NN) leaves inoculated with PVYO (no accession number, isolated from Aberdeen, Idaho, in 1999), PVYNTN (Genebank ID FJ204166), PVYN-wilga (Genebank ID HQ912863), or buffer (mock) were used as source of viral inoculum. Leaves of potato plants were inoculated as previously described [70]. The inoculation was repeated after seven days to ensure efficient viral inoculation. Potato plants were arranged in a randomized split-block design with six replications per treatment. Plants were inoculated three-to-four weeks after transfer from tissue culture to soil. To detect virus translocation to the tubers, three tubers were harvested from each plant, treated with 7 ppm gibberellic acid 3 (GA3) for three weeks at 27 °C to break dormancy. Tubers were then planted in 4 L pots with potting mix, and the grow outs were tested for the presence of PVY. We detected PVY by reverse transcription (RT)-PCR as previously described [35].

4.10. Alternaria Solani Disease Assays

A. solani was grown on V8 agar medium (10% clarified V8 juice, 1.5% CaCO3, and 12.7% agar) under continuous light. Spores were harvested after 10 days by flooding the plates with 10 mL sterile water and gently spreading it over the mycelium to dislodge the conidia using plastic hockey spreaders. The spore solution was filtered through four layers of cheesecloth to separate the spores from the mycelium. Spores were counted using a Neubauer chamber, and concentration was adjusted to 15,000–30,000 spores mL−1.
Potato plants were used four weeks after transfer to soil in all the assays. Four detached leaflets per plant from each of four plants per genotype were harvested and arranged in germination trays. The leaves were drop inoculated on the adaxial side with 10 µL of the spore inoculum and covered with clear humidity domes to maintain high humidity. Lesion area was measured at four days after inoculation using ImageJ [66].

4.11. Statistical Analysis of the Results

Data were analyzed for statistical significance using Student t-test or Analysis of Variance (ANOVA) in Excel or Vassarstats. For metabolite analysis, we used MetaboAnalyst 5.0 [71].

Supplementary Materials

The following supporting information can be downloaded at: https://www.mdpi.com/article/10.3390/plants12173129/s1, Figure S1: Phenotype of StnsLTPI.33-overexpressing lines nsLTP10 and nsLTP11 grown on MS media (pictures on the left with blue tape) or MS media containing 100 mM NaCl (pictures on the right with green tape) in magenta boxes; Figure S2: Phenotype of StnsLTPI.33-overexpressing lines nsLTP10 and nsLTP11 grown in pots in a greenhouse. The picture on the top comprises the control Premier Russet and the nsLTP10 line. The picture at the bottom comprises the control Premier Russet and the nsLTP11 line; Figure S3: Nucleotide sequence alignment of 18 cloned PGSC0003DMG400031236 cDNAs. The PGSC0003DMG400031236-encoded cDNA was amplified by PCR, cloned in pCRTM4Blunt TOPO® vector (ThermoFisher Scientific), and the resulting construct was introduced into One Shot TOP10 E. coli cells (ThermoFisher Scientific). Eighteen kanamycin-resistant isolated colonies were then cultured in LB medium supplemented with 50 mg/L kanamycin. Plasmid DNA was extracted from each culture and sent for Sanger sequencing. Sequences alignment showed that PGSC0003DMG400031236 has four identical alleles in Premier Russet (one clone, 3b, had a 60 bp insertion that likely corresponds to an unspliced variant); Table S1: The putative cis-acting regulatory elements in the promoter of the StnsLTPI.33 gene; Table S2: Amounts of leaf metabolites in the StnslTPI.33-overexpression line nsLTP10 and the control Premier Russet (PR). Values were normalized to both sample weight and internal standard. Prominent peaks in the chromatograms that were not identified by the automated search process are labelled with their retention time; Table S3: List of differentially accumulated metabolites in the StnslTPI.33-overexpression line LTP10 compared to the control Premier Russet (PR). This list was generated by Volcano plot analysis in MetaboAnalyst 5.0 with the following settings: FC > 2, raw p-value < 0.1, missing values: unchecked “Remove features with > 50% missing values”, checked “Replace by LoDs (1/5 of the minimum positive value of each variable)”; Table S4: Primers and sequences used in this study.

Author Contributions

Conceptualization, C.B. and A.G.; Methodology, C.B., A.G., K.H., Y.W., R.T.M., C.J.R. and J.C.A.; Validation, C.B., Y.W., R.T.M., C.J.R., J.C.A. and A.G.; Formal Analysis, C.B., A.G., Y.W., R.T.M., C.J.R. and J.C.A.; Investigation, C.B., K.H., Y.W., C.J.R. and A.G.; Writing—Original Draft Preparation, C.B. and A.G.; Writing—Review and Editing, R.T.M. and J.C.A.; Visualization, A.G. and R.T.M.; Supervision, A.G., R.T.M. and J.C.A.; Project Administration, A.G.; Funding Acquisition, A.G., R.T.M. and J.C.A. All authors have read and agreed to the published version of the manuscript.

Funding

This research was supported in part by a grant from the Natural Sciences and Engineering Research Council of Canada (RGPIN-2018-04629) to R.T.M. and a grant from the Northwest Potato Research Consortium to A.G. K.H. was partly supported by funds from the E.R. Jackman Friends and Alumni’s Beginning Researchers Support Program.

Data Availability Statement

All the data generated and analyzed in this study are included in this published article.

Acknowledgments

We thank Gail Bozzo (University of Guelph, Canada) for the plasmid pRTL2/BGLU15-mCherry and Hanjo Hellmann (Washington State University) for the plasmid pMDC83. We also thank Dennis Halterman (USDA-ARS) for the Alternaria solani strain. We thank Trenton Berrian for help with Alternaria solani lesion measurements.

Conflicts of Interest

The authors declare no conflict of interest.

References

  1. Kader, J.C. Lipid-transfer proteins in plants. Annu. Rev. Plant Physiol. Plant Mol. Biol. 1996, 47, 627–654. [Google Scholar] [CrossRef] [PubMed]
  2. Kader, J.C. Lipid-transfer proteins: A puzzling family of plant proteins. Trends Plant Sci. 1997, 2, 66–70. [Google Scholar] [CrossRef]
  3. Charvolin, D.; Douliez, J.P.; Marion, D.; Cohen-Addad, C.; Pebay-Peyroula, E. The crystal structure of a wheat nonspecific lipid transfer protein (ns-LTP1) complexed with two molecules of phospholipid at 2.1 angstrom resolution. Eur. J. Biochem. 1999, 264, 562–568. [Google Scholar] [CrossRef]
  4. Han, G.W.; Lee, J.Y.; Song, H.K.; Chang, C.S.; Min, K.; Moon, J.; Shin, D.H.; Kopka, M.L.; Sawaya, M.R.; Yuan, H.S.; et al. Structural basis of non-specific lipid binding in maize lipid-transfer protein complexes revealed by high-resolution X-ray crystallography. J. Mol. Biol. 2001, 308, 263–278. [Google Scholar] [CrossRef] [PubMed]
  5. Salminen, T.A.; Blomqvist, K.; Edqvist, J. Lipid transfer proteins: Classification, nomenclature, structure, and function. Planta 2016, 244, 971–997. [Google Scholar] [CrossRef]
  6. Gincel, E.; Simorre, J.P.; Caille, A.; Marion, D.; Ptak, M.; Vovelle, F. Three-dimensional structure in solution of a wheat lipid-transfer protein from multidimensional 1H-NMR data. Eur. J. Biochem. 1994, 226, 413–422. [Google Scholar] [CrossRef] [PubMed]
  7. Shin, D.H.; Lee, J.Y.; Hwang, K.Y.; Kim, K.K.; Suh, S.W. High-resolution crystal structure of the non-specific lipid transfer protein from maize seedlings. Structure 1995, 3, 189–199. [Google Scholar] [CrossRef] [PubMed]
  8. Boutrot, F.; Chantret, N.; Gautier, M.F. Genome-wide analysis of the rice and arabidopsis non-specific lipid transfer protein (nsLtp) gene families and identification of wheat nsLtp genes by EST data mining. BMC Genom. 2008, 9, 19. [Google Scholar] [CrossRef]
  9. Wang, N.J.; Lee, C.C.; Cheng, C.S.; Lo, W.C.; Yang, Y.F.; Chen, M.N.; Lyu, P.C. Construction and analysis of a plant non-specific lipid transfer protein database (nsLTPDB). BMC Genom. 2012, 13, 9. [Google Scholar] [CrossRef]
  10. Edqvist, J.; Blomqvist, K.; Nieuwland, J.; Salminen, T.A. Plant lipid transfer proteins: Are we finally closing in on the roles of these enigmatic proteins? J. Lipid Res. 2018, 59, 1374–1382. [Google Scholar] [CrossRef]
  11. Liu, F.; Zhang, X.B.; Lu, C.M.; Zeng, X.H.; Li, Y.J.; Fu, D.H.; Wu, G. Non-specific lipid transfer proteins in plants: Presenting new advances and an integrated functional analysis. J. Exp. Bot. 2015, 66, 5663–5681. [Google Scholar] [CrossRef] [PubMed]
  12. Sossountzov, L.; Ruizavila, L.; Vignols, F.; Jolliot, A.; Arondel, V.; Tchang, F.; Grosbois, M.; Guerbette, F.; Miginiac, E.; Delseny, M.; et al. Spatial and temporal expression of a maize lipid transfer protein gene. Plant Cell 1991, 3, 923–933. [Google Scholar] [CrossRef] [PubMed]
  13. Sels, J.; Mathys, J.; De Coninck, B.M.A.; Cammue, B.P.A.; De Bolle, M.F.C. Plant pathogenesis-related (PR) proteins: A focus on PR peptides. Plant Physiol. Biochem. 2008, 46, 941–950. [Google Scholar] [CrossRef] [PubMed]
  14. Wang, S.Y.; Wu, J.H.; Ng, T.B.; Ye, X.Y.; Rao, P.F. A non-specific lipid transfer protein with antifungal and antibacterial activities from the mung bean. Peptides 2004, 25, 1235–1242. [Google Scholar] [CrossRef]
  15. Molina, A.; Segura, A.; Garciaolmedo, F. Lipid transfer proteins (nsLTPs) from barley and maize leaves are potent inhibitors of bacterial and fungal plant pathogens. FEBS Lett. 1993, 316, 119–122. [Google Scholar] [CrossRef] [PubMed]
  16. Cammue Bruno, P.A.; Thevissen, K.; Hendriks, M.; Eggermont, K.; Goderis, I.J.; Proost, P.; Vandamme, J.; Osborn, R.W.; Guerbette, F.; Kader, J.C.; et al. A potent antimicrobial protein from onion seeds showing sequence homology to plant lipid transfer proteints. Plant Physiol. 1995, 109, 445–455. [Google Scholar] [CrossRef] [PubMed]
  17. Cecchini, N.M.; Steffes, K.; Schlappi, M.R.; Gifford, A.N.; Greenberg, J.T. Arabidopsis AZI1 family proteins mediate signal mobilization for systemic defence priming. Nat. Commun. 2015, 6, 7658. [Google Scholar] [CrossRef]
  18. Champigny, M.J.; Shearer, H.; Mohammad, A.; Haines, K.; Neumann, M.; Thilmony, R.; He, S.Y.; Fobert, P.; Dengler, N.; Cameron, R.K. Localization of DIR1 at the tissue, cellular and subcellular levels during Systemic Acquired Resistance in Arabidopsis using DIR1:GUS and DIR1:EGFP reporters. BMC Plant Biol. 2011, 11, 125. [Google Scholar] [CrossRef]
  19. Sarowar, S.; Kim, Y.J.; Kim, K.D.; Hwang, B.K.; Ok, S.H.; Shin, J.S. Overexpression of lipid transfer protein (LTP) genes enhances resistance to plant pathogens and LTP functions in long-distance systemic signaling in tobacco. Plant Cell Rep. 2009, 28, 419–427. [Google Scholar] [CrossRef]
  20. Wang, C.C.; Gao, H.J.; Chu, Z.H.; Ji, C.Q.; Xu, Y.; Cao, W.L.; Zhou, S.M.; Song, Y.Z.; Liu, H.M.; Zhu, C.X. A nonspecific lipid transfer protein, StLTP10, mediates resistance to Phytophthora infestans in potato. Mol. Plant Pathol. 2021, 22, 48–63. [Google Scholar] [CrossRef]
  21. Dhar, N.; Caruana, J.; Erdem, I.; Raina, R. An Arabidopsis DISEASE RELATED NONSPECIFIC LIPID TRANSFER PROTEIN 1 is required for resistance against various phytopathogens and tolerance to salt stress. Gene 2020, 753, 144802. [Google Scholar] [CrossRef] [PubMed]
  22. Guo, L.; Yang, H.B.; Zhang, X.Y.; Yang, S.H. Lipid transfer protein 3 as a target of MYB96 mediates freezing and drought stress in Arabidopsis. J. Exp. Bot. 2013, 64, 1755–1767. [Google Scholar] [CrossRef]
  23. Pitzschke, A.; Datta, S.; Persak, H. Salt stress in Arabidopsis: Lipid Transfer Protein AZI1 and its control by Mitogen-Activated Protein Kinase MPK3. Mol. Plant 2014, 7, 722–738. [Google Scholar] [CrossRef]
  24. Guo, C.K.; Ge, X.C.; Ma, H. The rice OsDIL gene plays a role in drought tolerance at vegetative and reproductive stages. Plant Mol. Biol. 2013, 82, 239–253. [Google Scholar] [CrossRef] [PubMed]
  25. Jung, H.W.; Kim, K.D.; Hwang, B.K. Identification of pathogen-responsive regions in the promoter of a pepper lipid transfer protein gene (CALTPI) and the enhanced resistance of the CALTPI transgenic Arabidopsis against pathogen and environmental stresses. Planta 2005, 221, 361–373. [Google Scholar] [CrossRef] [PubMed]
  26. Peng, C.N.; Xing, Y.; Wang, Q.B.; Wang, C.C.; Zhang, X.Y.; Chen, D.Y.; Song, Y.Z.; Zhu, C.X. Expression of tobacco Lipid Transfer Protein NtLTP4 enhances tolerance to abiotic and biotic stresses in transgenic potato lines. Potato Res. 2022, 65, 631–647. [Google Scholar] [CrossRef]
  27. Xu, Y.; Zheng, X.X.; Song, Y.Z.; Zhu, L.F.; Yu, Z.P.; Gan, L.M.; Zhou, S.M.; Liu, H.M.; Wen, F.J.; Zhu, C.X. NtLTP4, a lipid transfer protein that enhances salt and drought stresses tolerance in Nicotiana tabacum. Sci. Rep. 2018, 8, 8873. [Google Scholar] [CrossRef] [PubMed]
  28. Goyer, A.; Hamlin, L.; Crosslin, J.M.; Buchanan, A.; Chang, J.H. RNA-Seq analysis of resistant and susceptible potato varieties during the early stages of Potato Virus Y infection. BMC Genom. 2015, 16, 472. [Google Scholar] [CrossRef] [PubMed]
  29. Karasev, A.V.; Gray, S.M. Continuous and emerging challenges of Potato virus Y in potato. Annu. Rev. Phytopathol. 2013, 51, 571–586. [Google Scholar] [CrossRef]
  30. Li, G.J.; Hou, M.L.; Liu, Y.X.; Pei, Y.; Ye, M.H.; Zhou, Y.; Huang, C.X.; Zhao, Y.Q.; Ma, H.L. Genome-wide identification, characterization and expression analysis of the non-specific lipid transfer proteins in potato. BMC Genom. 2019, 20, 14. [Google Scholar] [CrossRef]
  31. Sparkes, I.A.; Runions, J.; Kearns, A.; Hawes, C. Rapid, transient expression of fluorescent fusion proteins in tobacco plants and generation of stably transformed plants. Nat. Protoc. 2006, 1, 2019–2025. [Google Scholar] [CrossRef]
  32. Roepke, J.; Gordon, H.O.W.; Neil, K.J.A.; Gidda, S.; Mullen, R.T.; Coutin, J.A.F.; Bray-Stone, D.; Bozzo, G.G. An apoplastic beta-glucosidase is essential for the degradation of flavonol 3-O-beta-glucoside-7-O-alpha-rhamnosides in Arabidopsis. Plant Cell Physiol. 2017, 58, 1030–1047. [Google Scholar] [CrossRef] [PubMed]
  33. Yubero-Serrano, E.M.; Moyano, E.; Medina-Escobar, N.; Munoz-Blanco, J.; Caballero, J.L. Identification of a strawberry gene encoding a non-specific lipid transfer protein that responds to ABA, wounding and cold stress. J. Exp. Bot. 2003, 54, 1865–1877. [Google Scholar] [CrossRef] [PubMed]
  34. Wu, G.H.; Robertson, A.J.; Liu, X.J.; Zheng, P.; Wilen, R.W.; Nesbitt, N.T.; Gusta, L.V. A lipid transfer protein gene BG-14 is differentially regulated by abiotic stress, ABA, anisomycin, and sphingosine in bromegrass (Bromus inermis). J. Plant Physiol. 2004, 161, 449–458. [Google Scholar] [CrossRef]
  35. Goyer, A.; Bvindi, C. Overexpression of VQ motif-containing gene does not affect infection rates of potato with Potato Virus Y. Am. J. Potato Res. 2023, 100, 233–239. [Google Scholar] [CrossRef]
  36. Gao, G.; Jin, L.P.; Xie, K.Y.; Qu, D.Y. The potato StLTPa7 gene displays a complex Ca-associated pattern of expression during the early stage of potato-Ralstonia solanacearum interaction. Mol. Plant Pathol. 2009, 10, 15–27. [Google Scholar] [CrossRef] [PubMed]
  37. Park, C.J.; Shin, R.; Park, J.M.; Lee, G.J.; Youl, J.S.; Paek, K.H. Induction of pepper cDNA encoding a lipid transfer protein during the resistance response to tobacco mosaic virus. Plant Mol. Biol. 2002, 48, 243–254. [Google Scholar] [CrossRef]
  38. Shang, K.J.; Xu, Y.; Cao, W.L.; Xie, X.Y.; Zhang, Y.R.; Zhang, J.F.; Liu, H.M.; Zhou, S.M.; Zhu, X.P.; Zhu, C.X. Potato (Solanum tuberosum L.) non-specific lipid transfer protein StLTP6 promotes viral infection by inhibiting virus-induced RNA silencing. Planta 2022, 256, 54. [Google Scholar] [CrossRef]
  39. Molina, A.; GarciaOlmedo, F. Enhanced tolerance to bacterial pathogens caused by the transgenic expression of barley lipid transfer protein LTP2. Plant J. 1997, 12, 669–675. [Google Scholar] [CrossRef]
  40. Subhankar, R.B.; Sautter, C.; Chattoo, B.B.; Sautter, C. Expression of the lipid transfer protein Ace-AMP1 in transgenic wheat enhances antifungal activity and defense responses. Transgenic Res. 2006, 15, 435–446. [Google Scholar] [CrossRef]
  41. Patkar, R.N.; Chattoo, B.B. Transgenic indica rice expressing ns-LTP-Like protein shows enhanced resistance to both fungal and bacterial pathogens. Mol. Breed. 2006, 17, 159–171. [Google Scholar] [CrossRef]
  42. Yang, X.Y.; Xiao, Y.H.; Wang, X.W.; Pei, Y. Expression of a novel small antimicrobial protein from the seeds of motherwort (Leonurus japonicus) confers disease resistance in tobacco. Appl. Environ. Microbiol. 2007, 73, 939–946. [Google Scholar] [CrossRef] [PubMed]
  43. Jia, Z.C.; Gou, J.Q.; Sun, Y.M.; Yuan, L.; Tang, Q.A.; Yang, X.Y.; Pei, Y.; Luo, K.M. Enhanced resistance to fungal pathogens in transgenic Populus tomentosa Carr. by overexpression of an nsLTP-like antimicrobial protein gene from motherwort (Leonurus japonicus). Tree Physiol. 2010, 30, 1599–1605. [Google Scholar] [CrossRef]
  44. Kobayashi, M.; Yoshioka, M.; Asai, S.; Nomura, H.; Kuchimura, K.; Mori, H.; Doke, N.; Yoshioka, H. StCDPK5 confers resistance to late blight pathogen but increases susceptibility to early blight pathogen in potato via reactive oxygen species burst. New Phytol. 2012, 196, 223–237. [Google Scholar] [CrossRef]
  45. van Baarlen, P.; Woltering, E.J.; Staats, M.; van Kan, J.A.L. Histochemical and genetic analysis of host and non-host interactions of Arabidopsis with three Botrytis species: An important role for cell death control. Mol. Plant Pathol. 2007, 8, 41–54. [Google Scholar] [CrossRef]
  46. Achard, P.; Renou, J.P.; Berthome, R.; Harberd, N.P.; Genschik, P. Plant DELLAs restrain growth and promote survival of adversity by reducing the levels of reactive oxygen species. Curr. Biol. 2008, 18, 656–660. [Google Scholar] [CrossRef]
  47. Bernsdorff, F.; Doring, A.C.; Gruner, K.; Schuck, S.; Brautigam, A.; Zeier, J. Pipecolic acid orchestrates plant systemic acquired resistance and defense priming via salicylic acid-dependent and -independent pathways. Plant Cell 2016, 28, 102–129. [Google Scholar] [CrossRef]
  48. Zeier, J. New insights into the regulation of plant immunity by amino acid metabolic pathways. Plant Cell Environ. 2013, 36, 2085–2103. [Google Scholar] [CrossRef]
  49. Sharma, S.; Choudhary, B.; Yadav, S.; Mishra, A.; Mishra, V.K.; Chand, R.; Chen, C.; Pandey, S.P. Metabolite profiling identified pipecolic acid as an important component of peanut seed resistance against Aspergillus flavus infection. J. Hazard. Mater. 2021, 404, 124155. [Google Scholar] [CrossRef] [PubMed]
  50. Navarova, H.; Bernsdorff, F.; Doring, A.C.; Zeier, J. Pipecolic acid, an endogenous mediator of defense amplification and priming, is a critical regulator of inducible plant immunity. Plant Cell 2012, 24, 5123–5141. [Google Scholar] [CrossRef] [PubMed]
  51. Nieuwland, J.; Feron, R.; Huisman, B.A.H.; Fasolino, A.; Hilbers, C.W.; Derksen, J.; Mariani, C. Lipid transfer proteins enhance cell wall extension in tobacco. Plant Cell 2005, 17, 2009–2019. [Google Scholar] [CrossRef]
  52. Huang, H.L.; Ullah, F.; Zhou, D.X.; Yi, M.; Zhao, Y. Mechanisms of ROS regulation of plant development and stress responses. Front. Plant Sci. 2019, 10, 800. [Google Scholar] [CrossRef] [PubMed]
  53. Shapiguzov, A.; Vainonen, J.P.; Wrzaczek, M.; Kangasjarvi, J. ROS-talk—How the apoplast, the chloroplast, and the nucleus get the message through. Front. Plant Sci. 2012, 3, 292. [Google Scholar] [CrossRef]
  54. Mehdy, M.C. Active oxygen species in plant defense against pathogens. Plant Physiol. 1994, 105, 467–472. [Google Scholar] [CrossRef] [PubMed]
  55. Chen, D.D.; Shao, Q.S.; Yin, L.H.; Younis, A.; Zheng, B.S. Polyamine function in plants: Metabolism, regulation on development, and roles in abiotic stress responses. Front. Plant Sci. 2019, 9, 1945. [Google Scholar] [CrossRef]
  56. Edgar, R.C. MUSCLE: A multiple sequence alignment method with reduced time and space complexity. BMC Bioinform. 2004, 5, 113. [Google Scholar] [CrossRef] [PubMed]
  57. Xu, X.; Pan, S.K.; Cheng, S.F.; Zhang, B.; Mu, D.S.; Ni, P.X.; Zhang, G.Y.; Yang, S.; Li, R.Q.; Wang, J.; et al. Genome sequence and analysis of the tuber crop potato. Nature 2011, 475, 189–195. [Google Scholar] [CrossRef]
  58. Curtis, M.D.; Grossniklaus, U. A gateway cloning vector set for high-throughput functional analysis of genes in planta. Plant Physiol. 2003, 133, 462–469. [Google Scholar] [CrossRef]
  59. Combest, M.M.; Moroz, N.; Tanaka, K.; Rogan, C.J.; Anderson, J.C.; Thura, L.; Rakotondrafara, A.M.; Goyer, A. StPIP1, a PAMP-induced peptide in potato, elicits plant defenses and is associated with disease symptom severity in a compatible interaction with Potato virus Y. J. Exp. Bot. 2021, 72, 4472–4488. [Google Scholar] [CrossRef]
  60. Taylor, S.C.; Nadeau, K.; Abbasi, M.; Lachance, C.; Nguyen, M.; Fenrich, J. The ultimate qPCR experiment: Producing publication quality, reproducible data the first time. Trends Biotechnol. 2019, 37, 761–774. [Google Scholar] [CrossRef]
  61. Cai, Y.Q.; Goodman, J.M.; Pyc, M.; Mullen, R.T.; Dyer, J.M.; Chapman, K.D. Arabidopsis SEIPIN proteins modulate triacylglycerol accumulation and influence lipid droplet proliferation. Plant Cell 2015, 27, 2616–2636. [Google Scholar] [CrossRef]
  62. McCartney, A.W.; Greenwood, J.S.; Fabian, M.R.; White, K.A.; Mullen, R.T. Localization of the tomato bushy stunt virus replication protein p33 reveals a peroxisome-to-endoplasmic reticulum sorting pathway. Plant Cell 2005, 17, 3513–3531. [Google Scholar] [CrossRef] [PubMed]
  63. Kretzschmar, F.K.; Doner, N.M.; Krawczyk, H.E.; Scholz, P.; Schmitt, K.; Valerius, O.; Braus, G.H.; Mullen, R.T.; Ischebeck, T. Identification of low-abundance lipid droplet proteins in seeds and Seedlings. Plant Physiol. 2020, 182, 1326–1345. [Google Scholar] [CrossRef]
  64. Pyc, M.; Cai, Y.Q.; Gidda, S.K.; Yurchenko, O.; Park, S.; Kretzschmar, F.K.; Ischebeck, T.; Valerius, O.; Braus, G.H.; Chapman, K.D.; et al. Arabidopsis lipid droplet-associated protein (LDAP) interacting protein (LDIP) influences lipid droplet size and neutral lipid homeostasis in both leaves and seeds. Plant J. 2017, 92, 1182–1201. [Google Scholar] [CrossRef]
  65. Gidda, S.K.; Park, S.; Pyc, M.; Yurchenko, O.; Cai, Y.Q.; Wu, P.; Andrews, D.W.; Chapman, K.D.; Dyer, J.M.; Mullen, R.T. Lipid Droplet-Associated Proteins (LDAPs) are required for the dynamic regulation of neutral lipid compartmentation in plant cells. Plant Physiol. 2016, 170, 2052–2071. [Google Scholar] [CrossRef]
  66. Schneider, C.A.; Rasband, W.S.; Eliceiri, K.W. NIH Image to ImageJ: 25 years of image analysis. Nat. Methods 2012, 9, 671–675. [Google Scholar] [CrossRef] [PubMed]
  67. Li, J.B.; Luan, Y.S.; Liu, Z. SpWRKY1 mediates resistance to Phytophthora infestans and tolerance to salt and drought stress by modulating reactive oxygen species homeostasis and expression of defense-related genes in tomato. Plant Cell Tissue Organ. Cult. 2015, 123, 67–81. [Google Scholar] [CrossRef]
  68. Davies, A.N. The new Automated Mass Spectrometry Deconvolution and Identification System (AMDIS). Spectrosc. Eur. 1998, 10, 24–27. [Google Scholar]
  69. Kind, T.; Wohlgemuth, G.; Lee, D.Y.; Lu, Y.; Palazoglu, M.; Shahbaz, S.; Fiehn, O. FiehnLib: Mass spectral and retention index libraries for metabolomics based on quadrupole and time-of-flight gas chromatography/mass spectrometry. Anal. Chem. 2009, 81, 10038–10048. [Google Scholar] [CrossRef]
  70. Vinchesi, A.C.; Rondon, S.I.; Goyer, A. Priming potato with thiamin to control potato virus Y. Am. J. Potato Res. 2017, 94, 120–128. [Google Scholar] [CrossRef]
  71. Pang, Z.Q.; Chong, J.; Zhou, G.Y.; Morais, D.A.D.; Chang, L.; Barrette, M.; Gauthier, C.; Jacques, P.E.; Li, S.Z.; Xia, J.G. MetaboAnalyst 5.0: Narrowing the gap between raw spectra and functional insights. Nucleic Acids Res. 2021, 49, W388–W396. [Google Scholar] [CrossRef] [PubMed]
Figure 1. Protein sequence alignment and 3D model of StnsLTPI.33. (a) Amino acid sequence alignment of StnsLTPI.33 from the variety Premier Russet with another type I nsLTP from potato (St), tobacco (Nt), and tomato (Sl). Asterisks indicate conserved amino acids. Cysteines from the eight cysteines motif are highlighted in blue. (b) Three-dimensional model of StnsLTPI.33 generated by SWISS-PRO.
Plants 12 03129 g001
Figure 2. Relative StnsLTPI.33 transcript levels in various organs of potato. Organs were collected from the potato variety Premier Russet. Expression levels were determined by qPCR. Data were normalized with the housekeeping genes 18S rRNA and L2. Data are means ± SE of at least three biological replicates. Identical letters indicate that there was no significant difference between organs as determined by ANOVA (p < 0.05).
Plants 12 03129 g002
Figure 3. Relative expression of StnsLTPI.33 gene in response to hormones. (a) Methyl jasmonate (Me-JA). (b) Aminocyclopropanecarboxylic acid (ACC). (c) Salicylic acid (SA). (d) Abscisic acid (ABA). (e) Gibberellic acid (GA). Plants grown in a greenhouse were treated with 1 mM ACC, 1 mM gibberellic acid (GA), 1 mM methyl jasmonate (Me-JA), 1 mM abscisic acid (ABA), or 1 mM salicylic acid (SA). For the Me-JA treatment, three plants were sprayed with a total of 100 mL of hormone solution or water as control until run-off and kept in covered translucent boxes. For the ACC, ABA, SA, and GA treatments, we harvested three leaves from each of the three plants for each treatment and dipped them in 50 mL of the hormone solution or water control in square Petri dishes. Samples were collected at 6, 12, and 24 h after treatment and frozen in liquid nitrogen until analysis by qPCR. Data were normalized with the housekeeping genes 18S rRNA and L2. Data are means ± SE of at least three biological replicates. Asterisks indicate that there was a significant difference between treatments as determined by the Student’s t-test (p < 0.05). Black bars indicate the relative expression level in mock control samples normalized to 1, while white bars indicate the relative expression level in samples treated with hormones.
Plants 12 03129 g003
Figure 4. Localization of StnsLTPI.33 to the apoplast in N. benthamiana leaf cells. (a) Representative confocal laser-scanning microscope (CLSM) micrographs of portions of Agrobacterium-infiltrated leaf epidermal cells co-transformed (as indicated by panel labels) with nsLTP-GFP and either BGLU15-mCherry, serving as an apoplastic marker protein [32], or mCherry alone, serving as a cytosolic marker protein. Shown also are the corresponding merged and differential interference (DIC) images. Solid arrowheads in the top row indicate examples of the colocalization of nsLTP-GFP and BGLU15-mCherry in the apoplast/cell wall; open arrowheads in the bottom row indicate the localization of mCherry to the cytosol in the two neighboring leaf epidermal cells, with nsLTP-GFP localized in the shared apoplast/cell wall. Stippled lines in the merged images represent the regions of the cells that correspond to the fluorescence intensity profiles shown in the graphs in (b). Note in (b) that the fluorescence intensity profiles attributable to nsLTP-GFP and BLU15-mCherry mostly overlap, while those for nsLTP-GFP and mCherry are more distinct. Scale bars in (a) = 10 µm.
Plants 12 03129 g004
Figure 5. StnsLTPI.33 transcript levels in transgenic potato lines expressing the coding sequence of StnsLTPI.33 under the control of the CaMV35S promoter. Plantlets were grown on MS medium in magenta boxes. Leaf samples were used for RNA extraction and qPCR. Data were normalized with the housekeeping genes 18S rRNA and L2. Data are means ± SE of three biological replicates.
Plants 12 03129 g005
Figure 6. Shoot (a) and root (b) lengths of StnsLTPI.33-overexpressing lines grown on MS medium or MS medium with 100 mM NaCl. Data are means ± SE of six biological replicates. Asterisks indicate that there was a significant difference between StnsLTPI.33-overexpressing lines and the control Premier Russet (PR), as determined by the Student’ t-test. *, p < 0.1; **, p < 0.05.
Plants 12 03129 g006
Figure 7. Tuber yield of StnsLTPI.33-overexpressing lines nsLTP10 and nsLTP11 compared to the control Premier Russet (PR). (a) Total weight of harvested tubers. (b) Pictures of harvested tubers. Identical letters indicate that there was no significant difference between lines as determined by ANOVA (p < 0.05).
Plants 12 03129 g007
Figure 8. Disease response to Alternaria solani in StnsLTPI.33-overexpressing lines nsLTP10 and nsLTP11. Asterisks indicate that there was a significant difference between StnsLTPI.33-overexpressing lines and the control Premier Russet (PR) as determined by the Student’s t-test (p < 0.05).
Plants 12 03129 g008
Figure 9. NBT (a) and DAB (b) staining of leaflets of the StnsLTPI.33-overexpressing line nsLTP10.
Plants 12 03129 g009
Figure 10. Heatmap of the top 50 leaf metabolites in the StnsLTPI.33-overexpressing line LTP10 and the control Premier Russet. The top 50 differential metabolites between samples based on ANOVA are shown. Samples and metabolites were clustered based on Ward’s linkage.
Plants 12 03129 g010
Table 1. Rate of in-season and seed-borne infection of Premier Russet (PR) and lines overexpressing StnsLTPI.33 (LTP10 and 11) in three independent experiments.
Experiment 1Experiment 2Experiment 3
TreatmentPotato LineIn-Season aSeedborne bIn-Season aSeedborne bIn-Season aSeedborne b
MockPR0/60/60/60/60/60/5
LTP100/60/51/60/50/30/2
LTP110/50/50/50/50/50/4
PVYOPR0/60/60/60/61/60/6
LTP100/60/60/60/41/40/2
LTP110/50/50/50/52/50/5
PVYN-WilgaPR0/60/64/63/62/60/6
LTP100/40/42/54/50/40/4
LTP110/60/50/64/61/60/5
PVYNTNPR4/64/65/65/65/65/6
LTP105/65/65/65/54/52/3
LTP114/64/64/44/46/65/6
a Plants were mechanically inoculated with PVY on foliage (i.e., in-season infection). PVY detection was performed by RT-PCR on non-inoculated leaves. b Tubers were harvested, planted, and then tested for PVY infection by RT-PCR (i.e., seedborne infection) on foliage.
Disclaimer/Publisher’s Note: The statements, opinions and data contained in all publications are solely those of the individual author(s) and contributor(s) and not of MDPI and/or the editor(s). MDPI and/or the editor(s) disclaim responsibility for any injury to people or property resulting from any ideas, methods, instructions or products referred to in the content.

