Abstract
Primula filchnerae, an endangered plant endemic to China, has drawn people’s attention in recent years due to its ornamental value in flower. It was rarely recorded since being described in 1902, but it was rediscovered in 2009 and is now known from a limited number of sites located in Hubei and Shaanxi Provinces. Since the species is still poorly known, a number of unanswered questions arise related to it: How has P. filchnerae responded to past climate change and how might it respond in the future? Why was P. filchmerae so rarely collected during the past century? We assembled geographic coordinates for P. filchnerae through the field surveys and website searches, and then used a maximum entropy model (MaxEnt) to simulate its potential suitable distribution in six periods with varied carbon emission levels by combining bioclimatic and environmental factors. MaxEnt showed that Min Temperature of the Coldest Month (bio6) and Precipitation of the Coldest Quarter (bio19) affected P. filchnerae’s distribution most, with an aggregate contribution >60% and suitable ranges above −5 °C and below 40 mm, respectively. We also analyzed potential habitat distribution in various periods with differing impacts of climate change compared to today’s suitable habitats, and in most cases, Shaanxi and Sichuan remained the most stable areas and with possible expansion to the north under various carbon emission scenarios, but the 2050s SSP5-8.5 scenario may be an exception. Moreover, we used MaxEnt to evaluate population shifts, with various scenarios indicating that geometric center would be concentrated in Sichuan Province in China. Finally, conservation strategies are suggested, including the creation of protected areas, long-term monitoring, raising public awareness of plant conservation, situ conservation measures, assisted migration, and species introduction. This study demonstrates how P. filchnerae may have adapted to changes in different periods and provides a scientific basis for germplasm conservation and management.
1. Introduction
Over the past century, the global temperature has risen by close to 1 °C, and it has increased rapidly in the past 30 years. The climate is one of the most essential environmental factors that affects the distribution and geographic ranges of species [1]. Human activities also play a vital role in the geographic distribution of species [2]. In recent years, more and more attention has been paid to how plants adapt to climate change, and the study of the species spatial patterns has become a hot issue [3]. As global warming increases, the spatial distribution patterns of plants are expected to move to higher latitude [4]. Future climate change will alter the land surface temperature, precipitation pattern, and affect the geographical distribution patterns of plants under the condition of global warming. With climate changes, the distribution range of plants will alter in response to the climate oscillations, yet projections for various species show differing changes, in which some species’ distribution would expand but some would not. For instance, the suitable habitat range of Chinese Ziziphus jujuba, a deciduous shrub with economic value, would increase with climate warming [5], while the high suitable areas of Magnolia wufengensis under the RCP6.0 scenario is 39.14% lower than the current total of high suitability areas [2]. The global climate change has not only resulted in shifts in the habitats of various species, but also induced the extinction of some species [6,7]. So, it is necessary for us to focus on the response of species to climate change over the past years and in the future because the responses of plants to the climate change will not only help us to understand the historical causes of species formation and changes in the geographical distribution but also in formulating scientific management strategies [5].
It has been widely accepted that it is possible to understand changes in species adaptability and predict potential geographical distribution by simulating and predicting the geographical distribution of species under changing climate conditions. [8]. Species distribution models have been widely used to study the potential geographic distribution of species under various climate conditions [9]. Species distribution models (SDMs), also called ‘habitat’ models, can assess the distribution of a given species simply based on presence data and various environmental parameters. SDMs can also be used to estimate the spatial variation of species richness, look for the sources of changes, and determine possible migration directions [10]. As computer technology and geographic information systems (GIS) develop, numerous SDMs and SDM software packages have been explored, such as CLIMEX, BIOCLIM, GAPR, and MAXENT [11,12]. Each model has pros and cons due to their different principles and algorithms, and the performance of each model becomes unstable if the input data are changed [13]. Among them, the MaxEnt model, derived from statistical mechanics based on maximum entropy [14], relies on presence-only data and obtains better simulation results even with small samples [15,16]. The MaxEnt model has been considered as one of the most reliable SDMs by numerous researchers [17,18,19]. For instance, some researchers explored how rhesus macaques adapted to climate change by integrating ecological and genetic methods, applying species distribution models (SDMs) [20]. Other researchers integrated the habitat and saponin content of Panax notoginseng to assess its potential distribution by MaxEnt model [21]. The potential geographic distribution of endangered species has been the focus of attention in numerous studies, such as the effects of climate change on the spatial distribution of the threatened species Rhododendron in the Qinling-Daba mountains of central China [22]. Another example is the simulation of potential suitable distribution of the endangered medicinal of Paeonia rocii under climate change scenarios via maxent modelling [23].
Primula is one of the largest genera of Primulaceae including approximately 500 species, which are mainly distributed in the temperate and arctic regions of the northern hemisphere, with about 300 species native to China [24]. Some species, including P. malacoides, P. vulgaris, and P. veris ‘Sunset Shades’, are widely cultivated as garden plants and well-known for their early flowering period. Primula filchnerae is endemic to central China [25] and was evaluated as an Endangered species according to the IUCN (The International Union for Conservation of Nature) Red List Categories and Criteria [26]. It was first discovered at the beginning of the 20th century, but then disappeared from the wild for about 100 years. Its wild populations were rediscovered in 2009 in the Province of Hubei [27] and in 2015 in the province of Shaanxi [28,29]. Primula filchnerae is a biennial herb, with multiple clusters of oval leaves and umbels [25], feathery leaves, bell-shaped fruits, and brightly colored flowers, growing at an altitude of between 200 m and 900 m above sea level, specifically along roadsides or among the rocks. The most common companion plants from our field surveys were Anemone vitifolia, Glycine soja, Oplismenus undulatifolius, and Zanthoxylum armatum. In the past several years, the Xian Botanic Garden in Shaanxi Province expanded the population of P. filchnerae by collecting their seeds from the wild, translocating them to the garden, and returning cultivated seedings to wild sites. As an endangered species in China with a long period when it had been unnoticed, the appearance of P. filchnerae amazed numerous researchers who could not help keep asking why P. filchnerae had been missing for such a long time, how P. filchnerae has responded to past climate change and how it might respond in the future. Studying the potential geographic distribution of P. filchnerae under climate change is helpful to better understand the adaptation of P. filchnerae to climate change and take targeted measures for its further protection.
In this study, we collected distribution data through field surveys and website searches during the past two years, which were employed to analyze by ENMeval to reduce redundancy. MaxEnt model was employed to perform the relevant analysis based on the occurrence records. Our objectives this study were to: (1) analyze the contributions of environmental factors and explore the essential climatic factors limiting P. filchnerae’s distribution; (2) simulate and predict the potential spatial distributions and suitable habitats of P. filchnerae in different periods with varied emission level of carbon dioxide; (3) study the expansion and contraction in future compared with current distribution areas; and (4) model the migration route of population in different periods to determine the ideal areas for species conservation.
2. Results
2.1. Analysis of the Accuracy of the MaxEnt Model
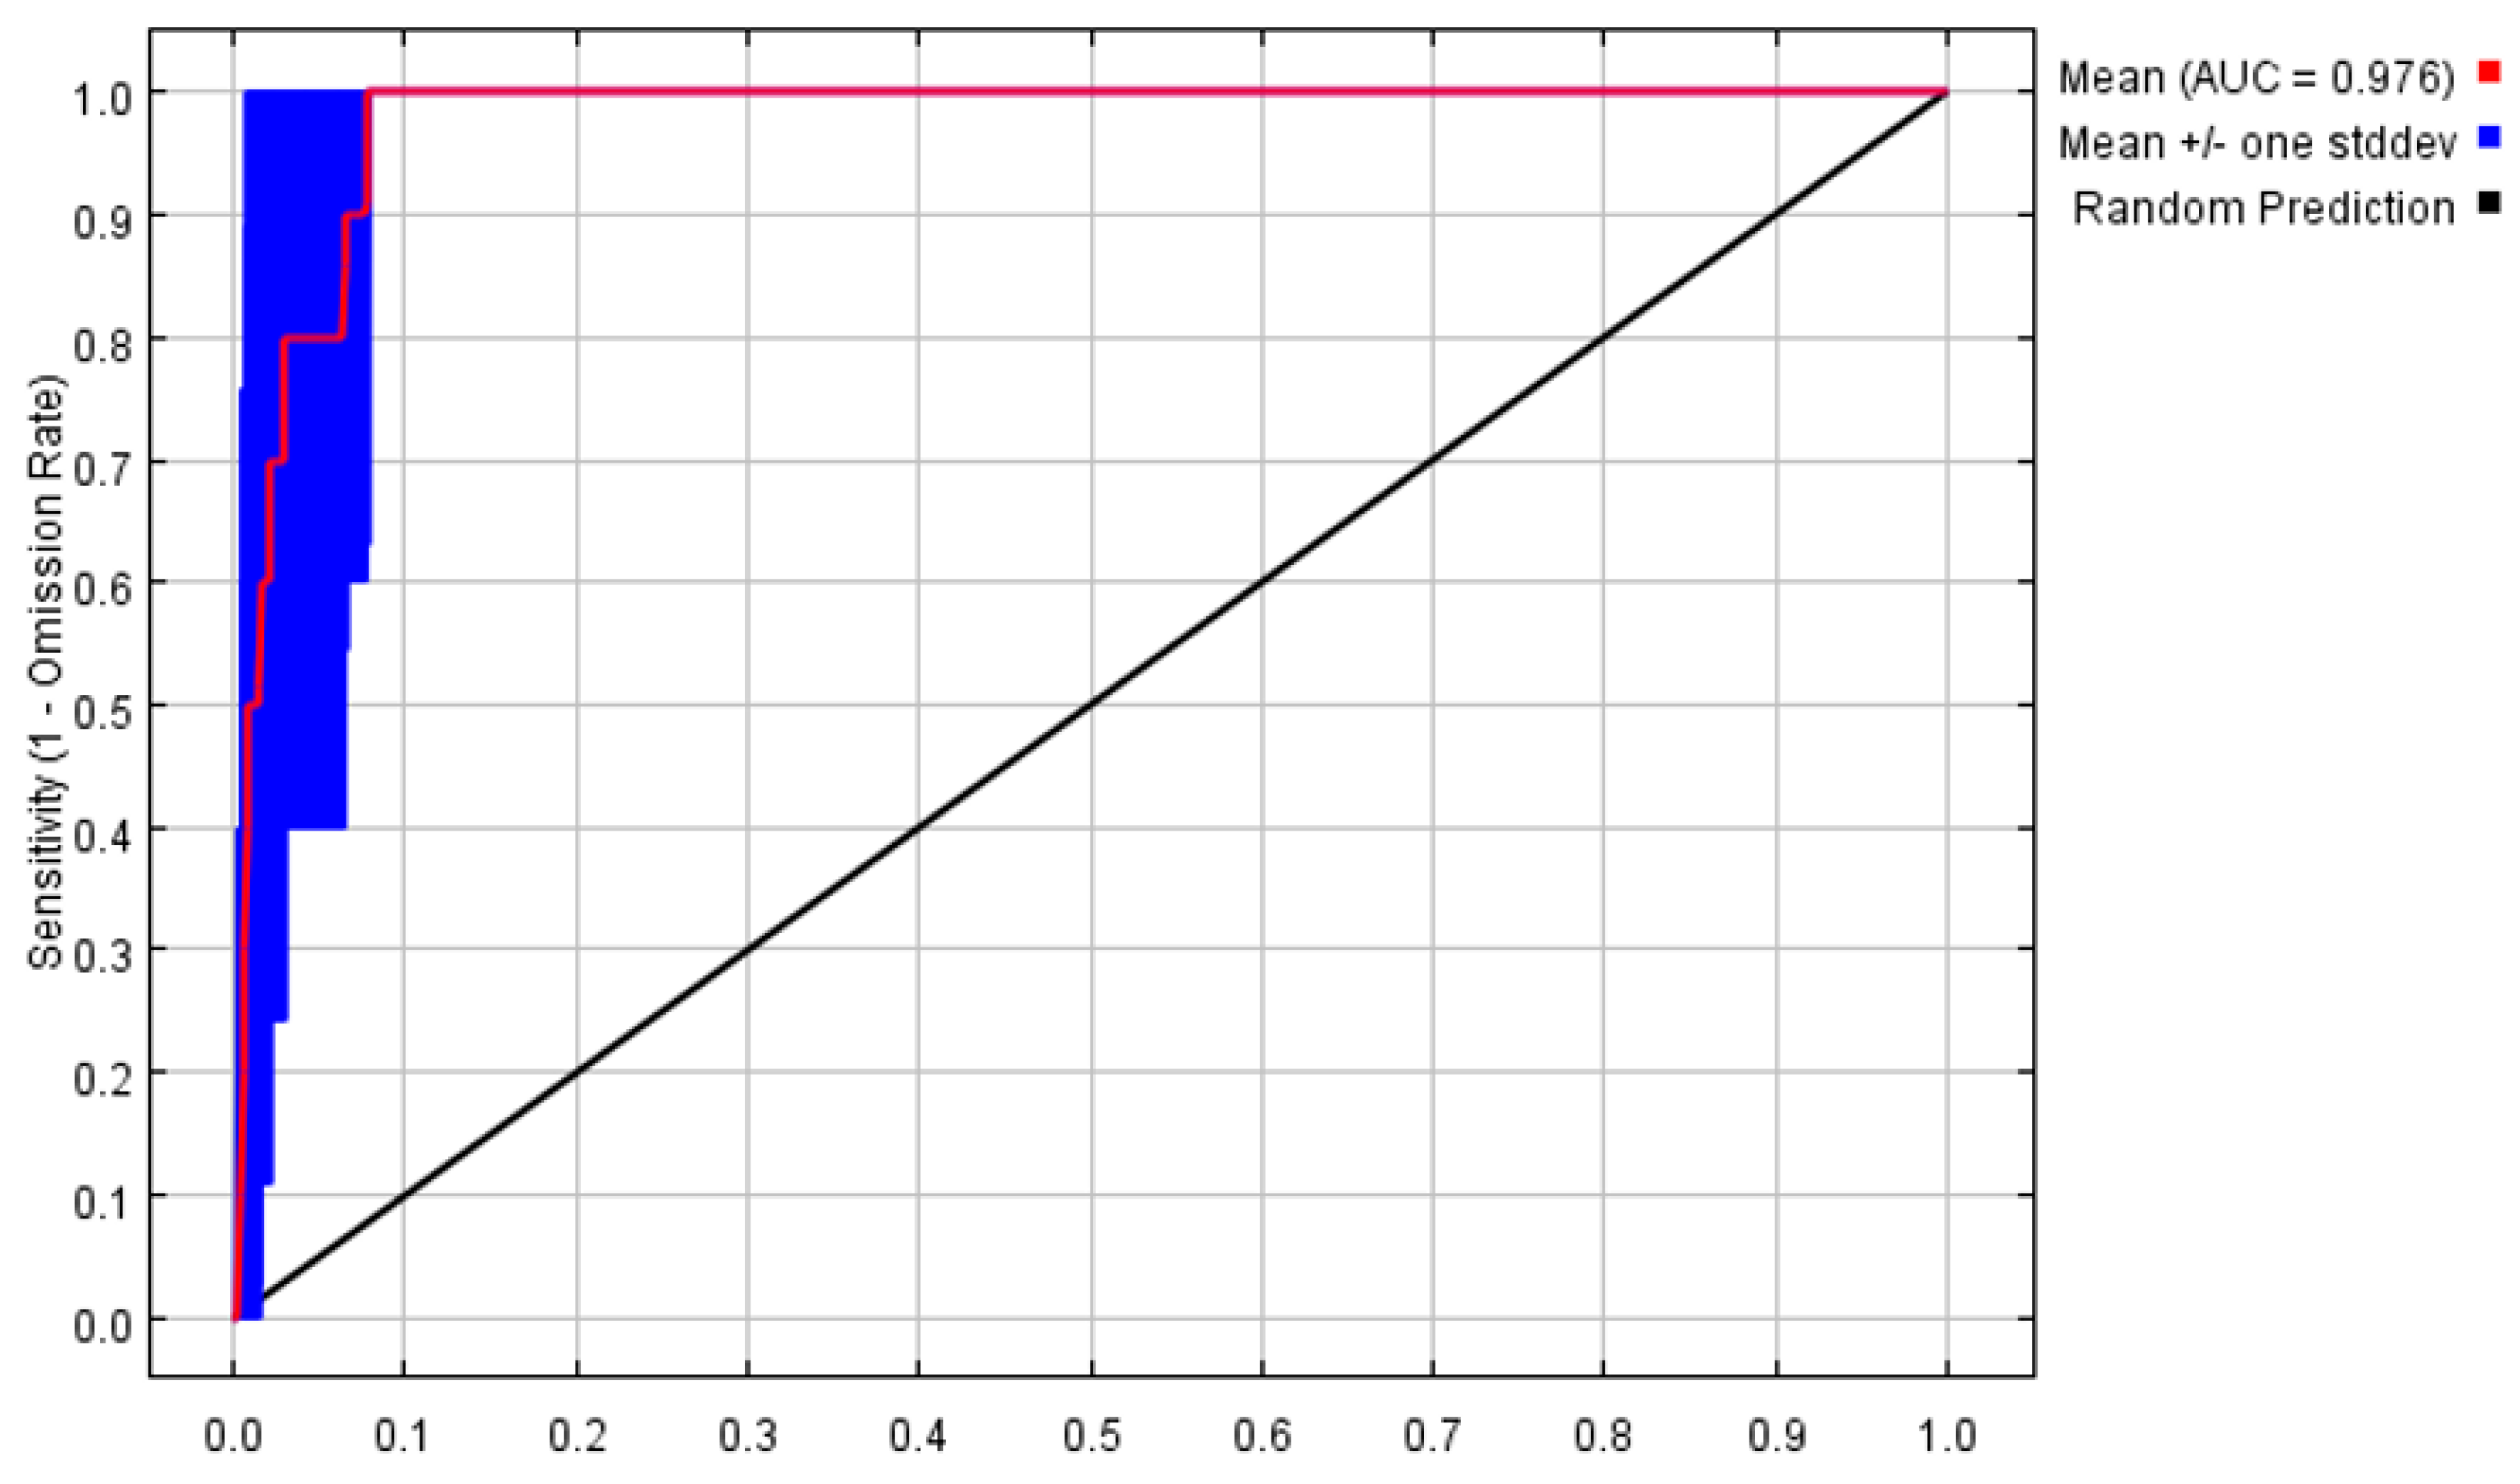
The MaxEnt model was used to predict the potentially suitable areas, and the results of AUC values are presented in (Figure 1). Its average test data of 10 times were 0.976 and the performance of the MaxEnt model was ‘excellent’, which could well predict the geographic distributions of P. filchnerae.

Figure 1.
Receiver operator characteristic curve tests the accuracy of MaxEnt model.
2.2. Evaluation of Environmental Variables and Analysis of Response Curve
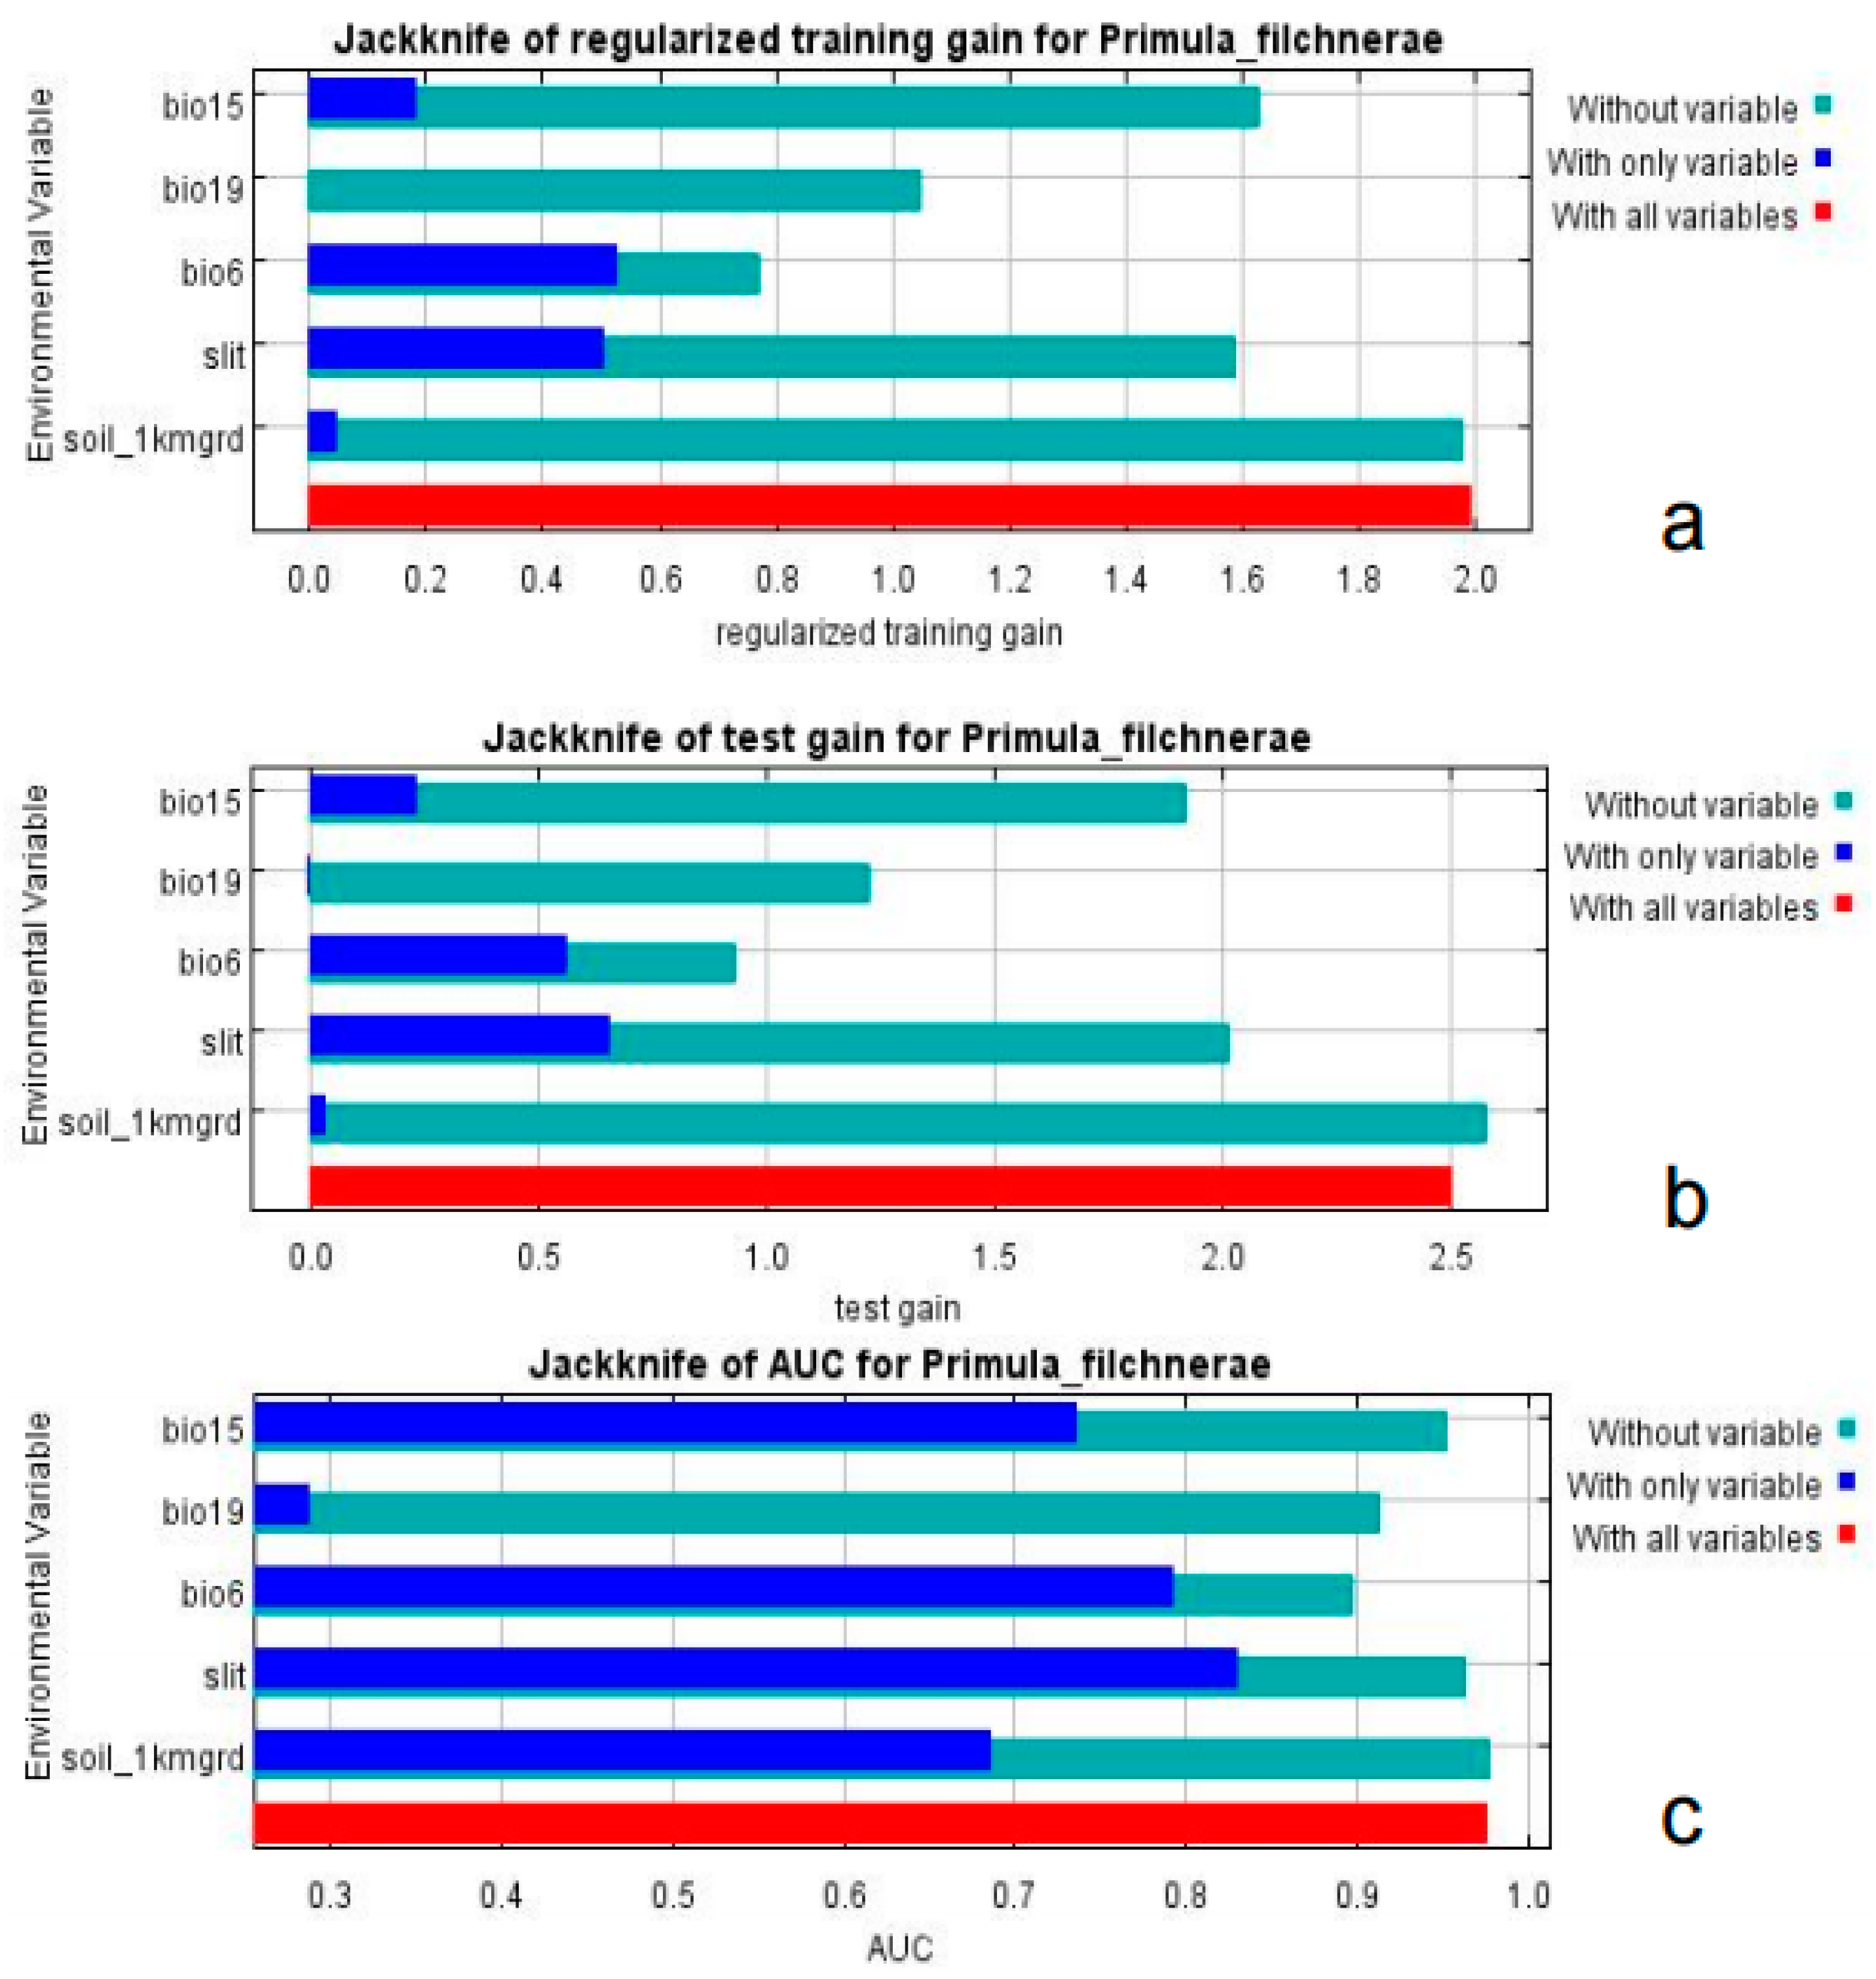
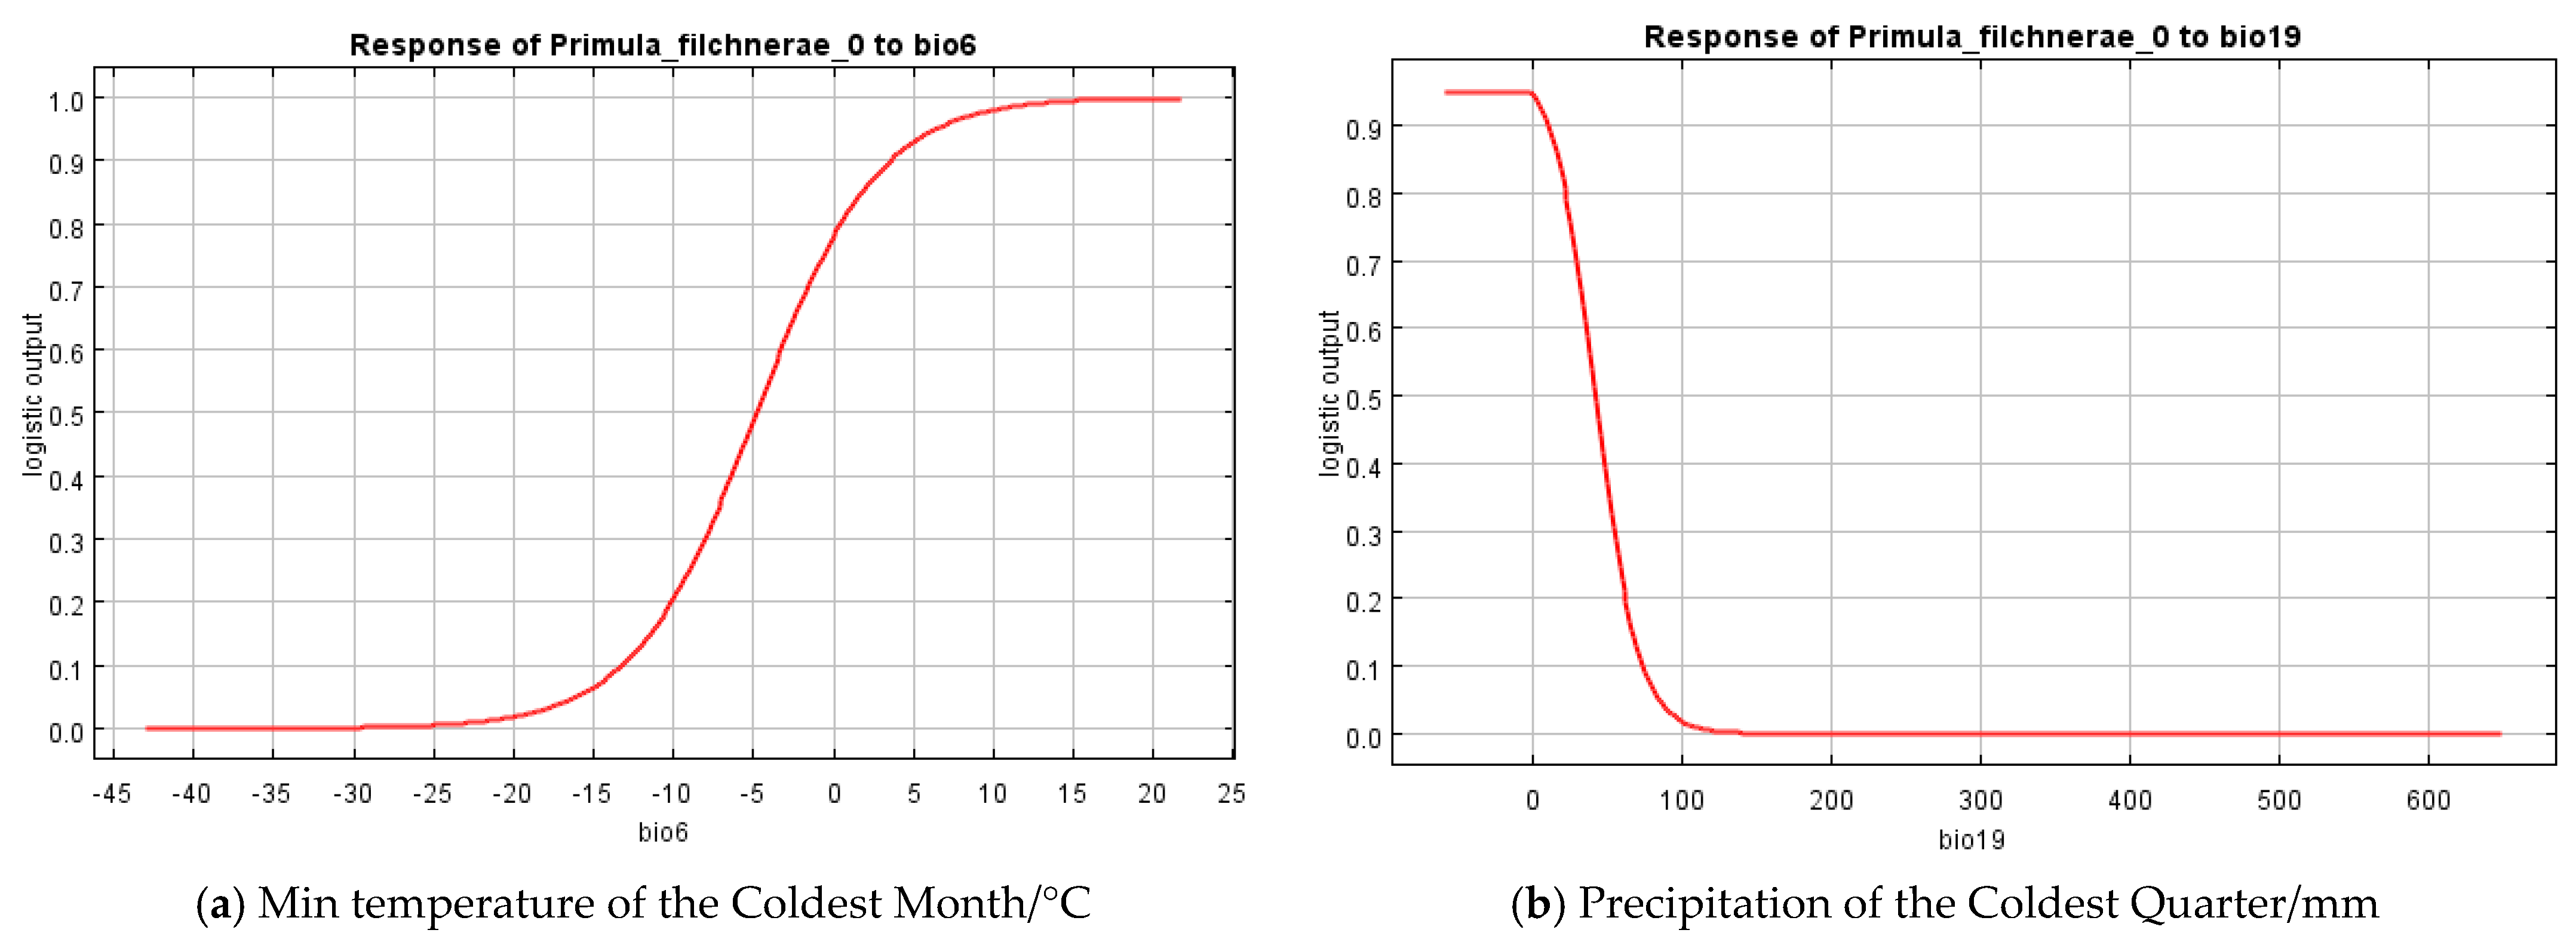
Based on the percent contribution of the results of the MaxEnt model, Min Temperature of the Coldest Month (bio6), Precipitation Seasonality (bio15), Precipitation of the Coldest Quarter (bio19), soil_1kmgrd, and silt (Figure 2) were the most influential environmental variables, in which Min Temperature of the Coldest Month (bio6) and Precipitation of the Coldest Quarter (bio19)’s percent contribution was more than 65%. Single-factor response curves were also draw by logistic regression in the MaxEnt model. The Min Temperature of the Coldest Month was above −5 °C (Figure 3) and the precipitation of the coldest quarter was below 40 mm (Figure 3) with a probability of presence >0.5.

Figure 2.
Jackknife test of importance of environmental variables. (a) Regularized training gain; (b) test gain; (c) AUC value.
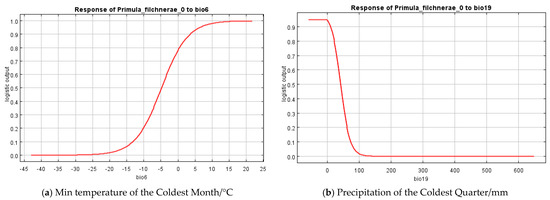
Figure 3.
Response curves of the most important variables in the ecological niche model for P. filchnerae. (a) Min temperature of the coldest month (bio6); (b) Precipitation of the coldest quarter (bio19).
2.3. Distribution Areas Predicted in China
2.3.1. Suitable Areas in the Past
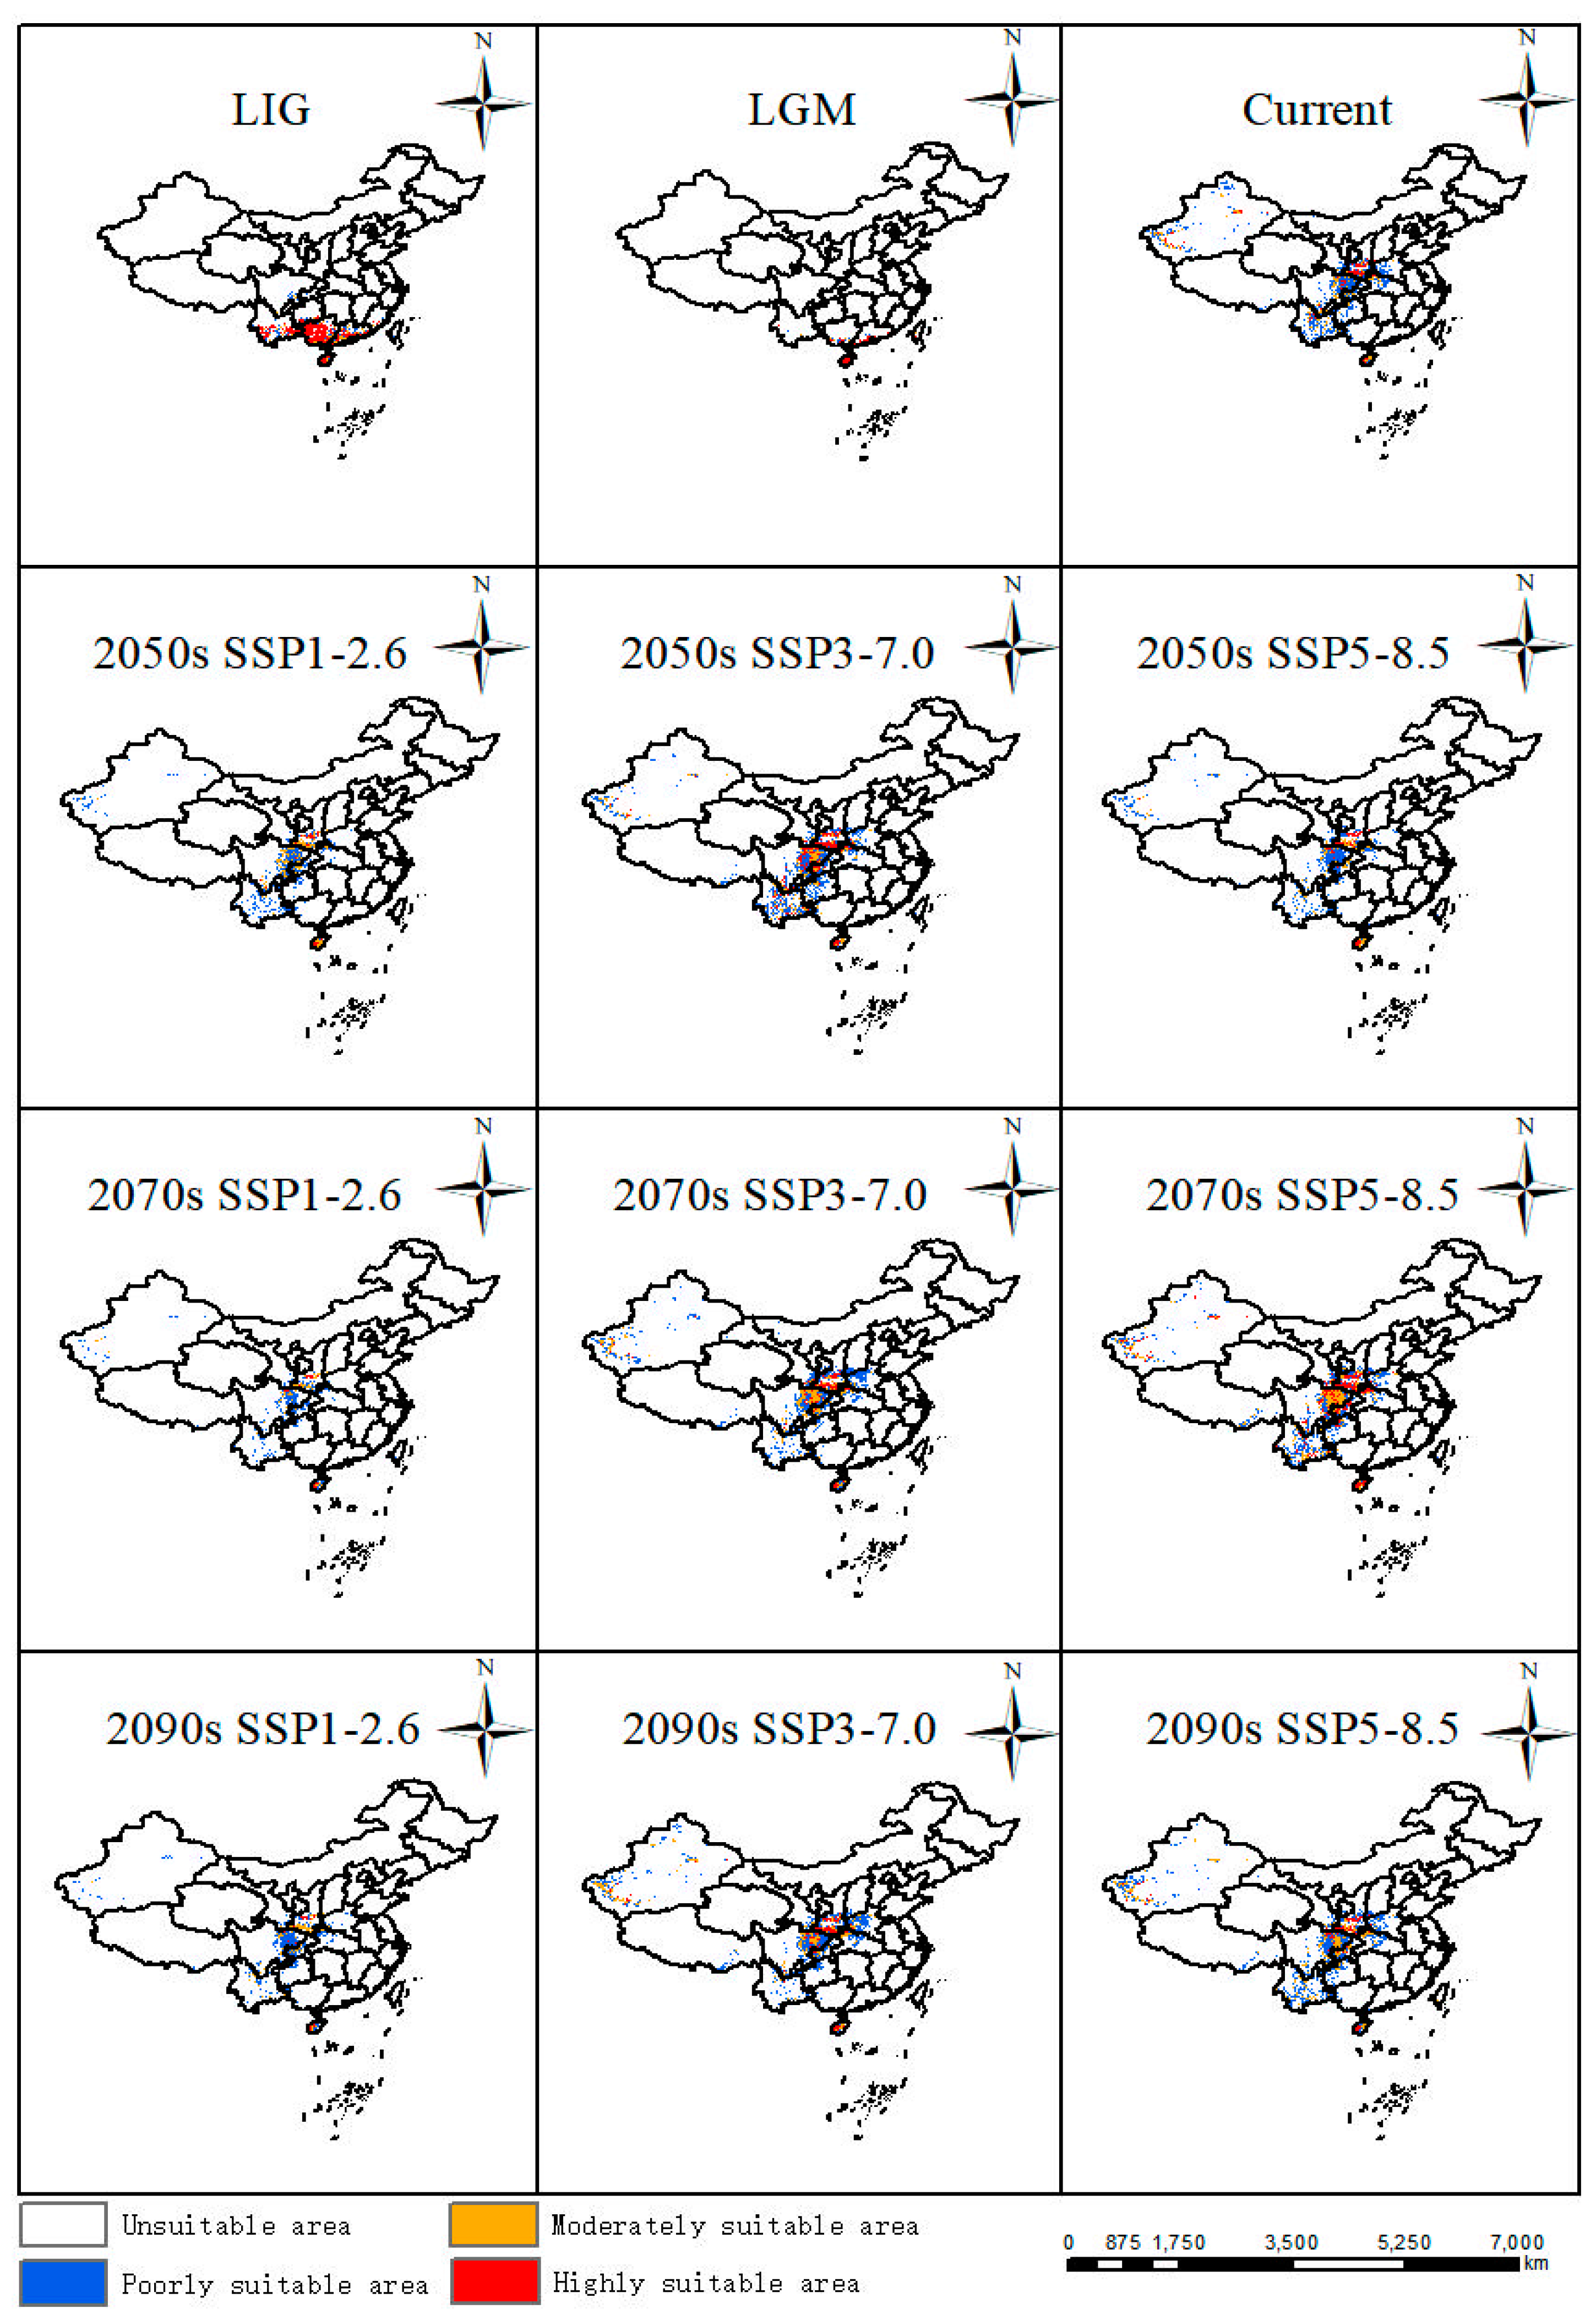
In comparison with the current distribution, suitable areas in the LIG (about 130 Ka BP, Kilion-anniversary Before Present) and LGM (about 21 Ka BP, Kilion-anniversary Before Present) showed a trend towards the north of China. In LIG, the largest areas were highly suitable areas mainly distributed in Yunnan Province, Hainan Province, Guangdong Province, and Guangxi Zhuang Autonomous Region in China (Figure 4). In LGM, its suitable habitats decreased a lot, especially in Yunnan Province and Guangxi Zhuang Autonomous Region, while suitable areas in Hainan Province remain stable from LIG to LGM (Figure 4).

Figure 4.
Potentially suitable areas of P. filchnerae in China under different climate scenarios in various periods.
2.3.2. Suitable Areas at the Present Time
The results showed that the suitable area was 70.86 km2 [Table 1], which accounted for 7.38% of China’s land area, mainly located in southern and central China (Figure 4). Among the highly suitable areas in China, Shaanxi covered the largest areas, which was in accordance with current occurrence records. Suitable areas were also distributed in Sichuan Province, Yunnan Province, Hainan Province, and Xinjiang Uygur Autonomous Region.

Table 1.
Suitable area for P. filchnerae under different climate change scenarios (104 km2).
2.3.3. Suitable Areas in the Future
Based on future habitat predictions, highly and moderately suitable areas displayed the largest expansions in the 2050s under the SSP3-7.0 scenario compared with other scenarios in the 2050s, while the suitable habitats showed an increasing trend from SSP1-2.6 to SSP5-8.5 in the 2070s and part of the suitable habitats were also distributed in Hubei Province, Chongqing City, and Guizhou Province. Similarly to the change patterns in the 2050s, suitable areas displayed the largest expansion in the 2090s under the SSP3-7.0 scenario (Figure 4).
2.4. Possible Climate Effect on the Habitat of P. filchnerae
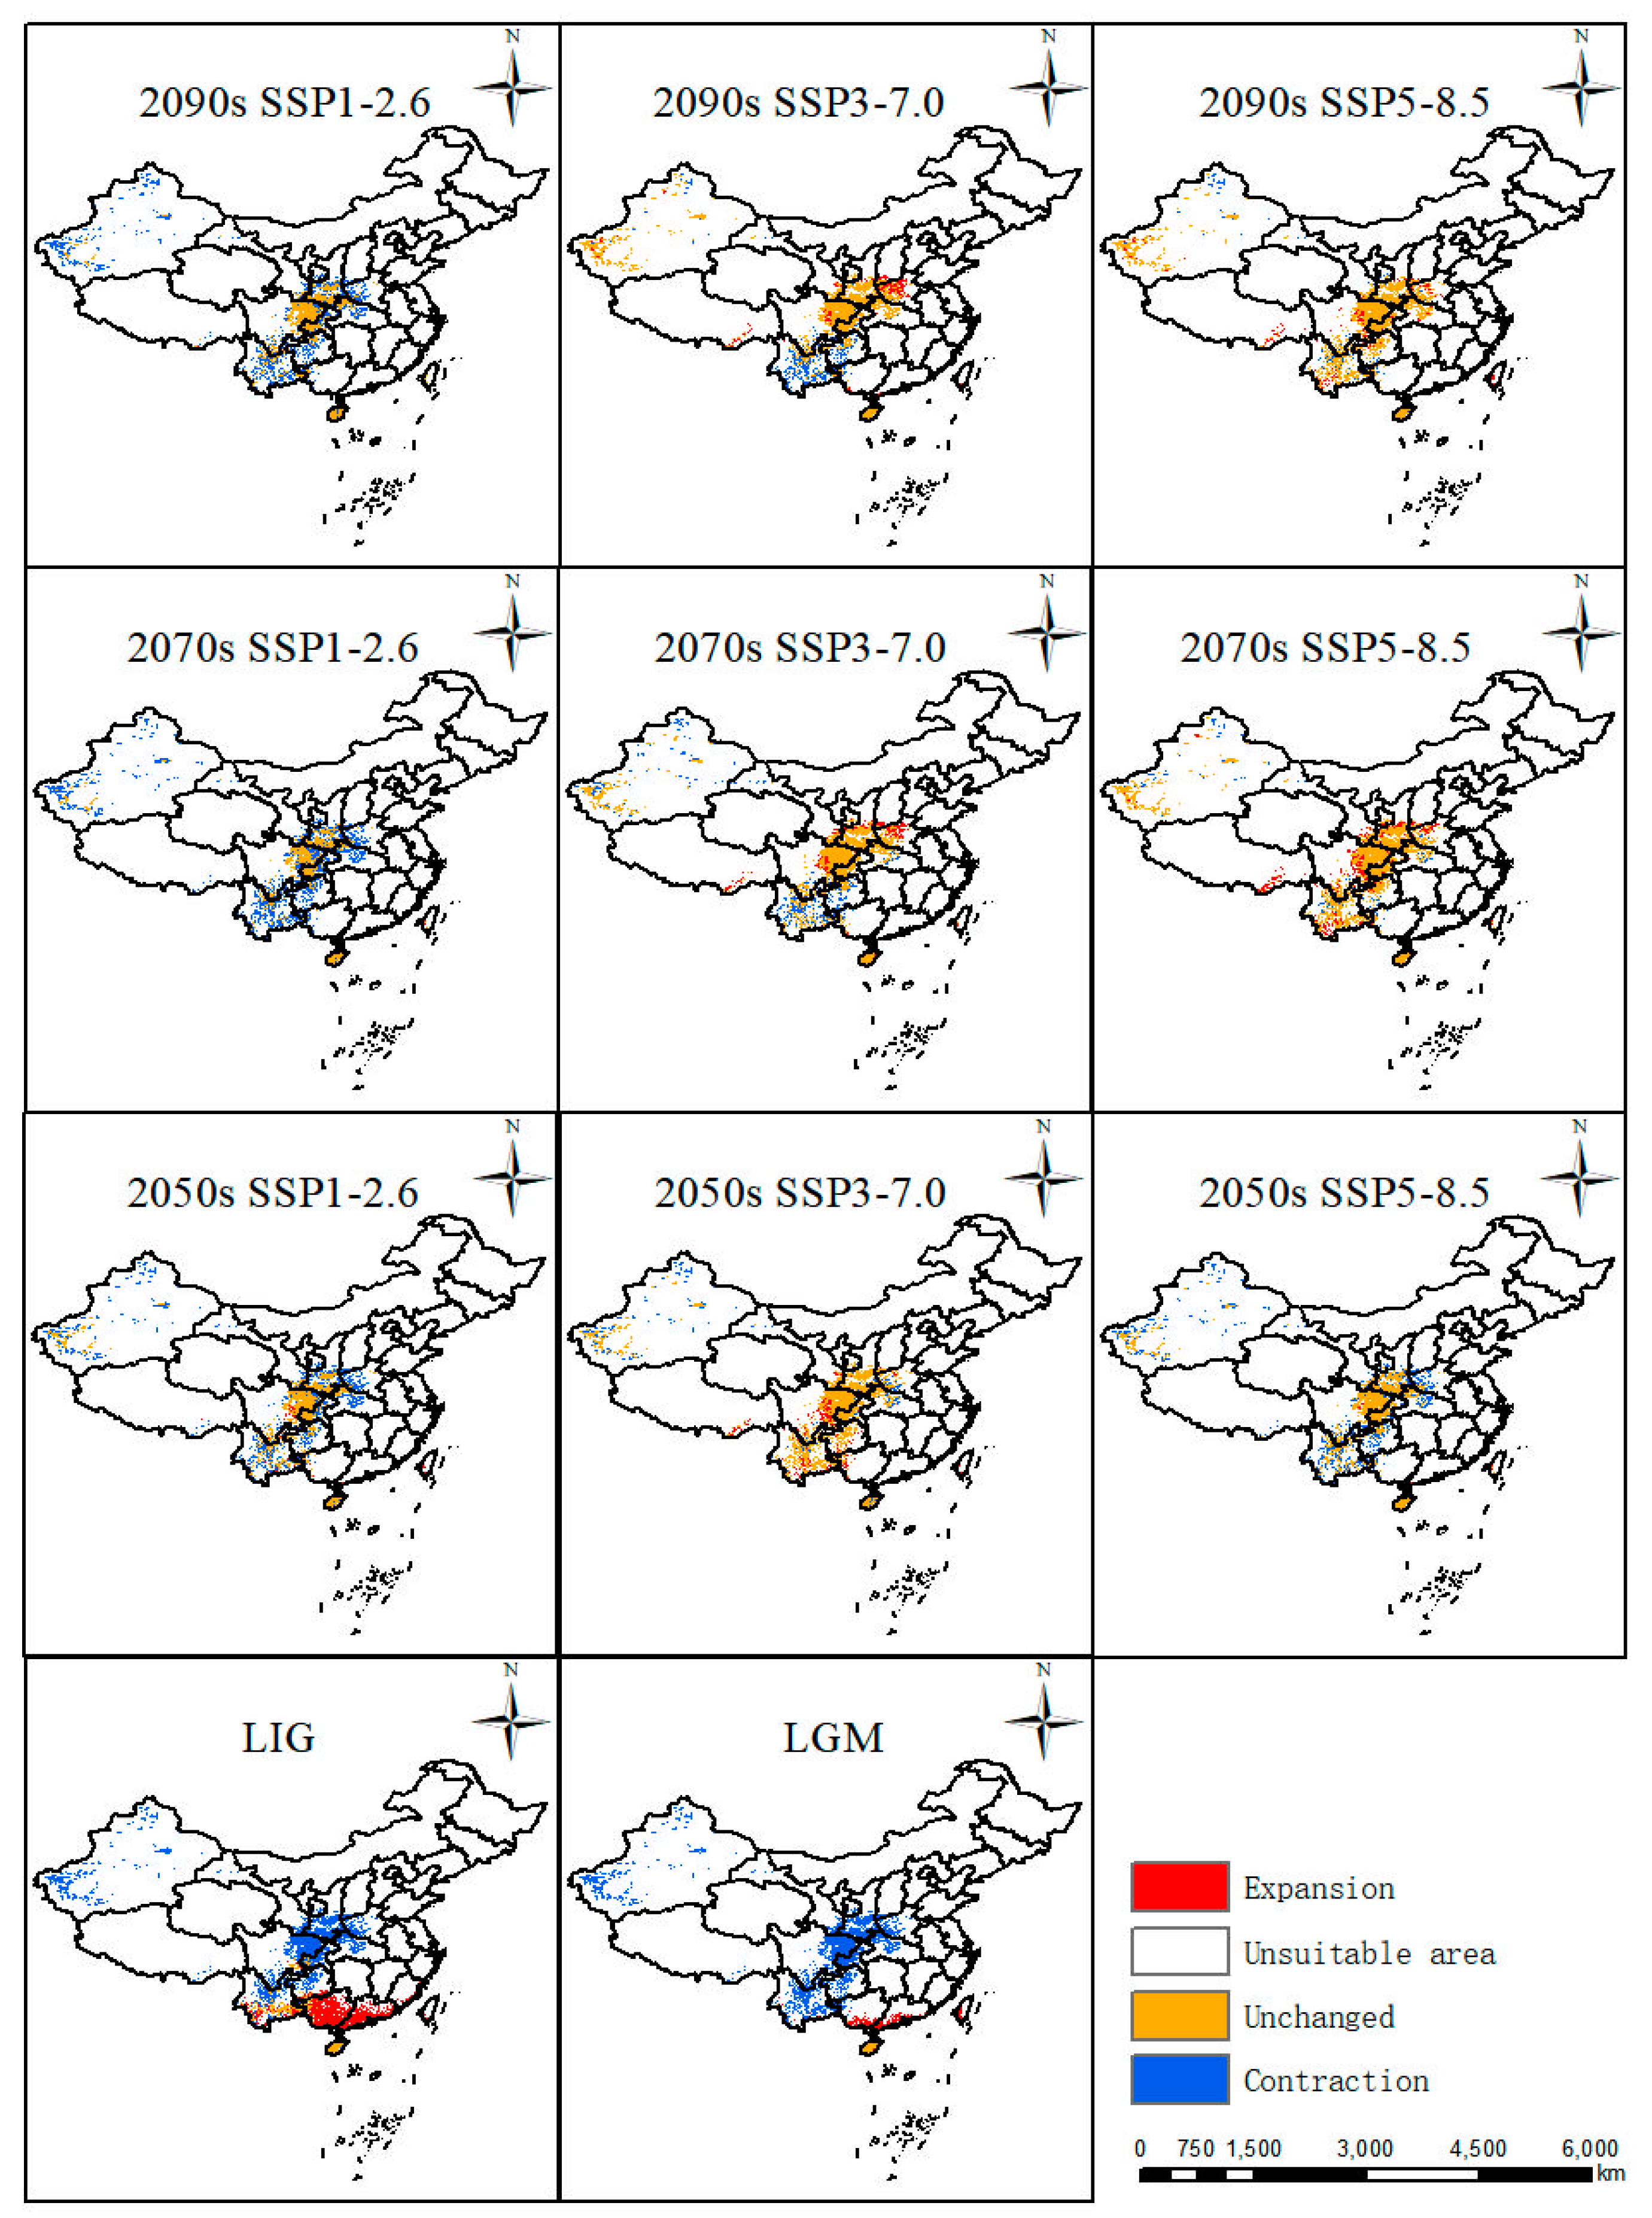
The predicted distribution patterns in various periods were compared with the current distribution (Figure 5), and its distribution in different periods under various scenarios witnessed different trends. From last interglacial period to the current, Guangxi and Guangdong experienced the largest increases in suitable habitat compared with changes in other periods. From the last glacial maximum to the present, it can be seen that Guangxi and Guangdong also experienced increases in suitable areas in their southern areas. From the 2050s, 2070s, and 2090s under three scenarios, they displayed almost the same distribution patterns. Under the SSP1-2.6 scenario, the most stable areas were Shaanxi Province and Sichuan Province, with the largest contraction areas in the Xinjiang Uygur Autonomous Region, Yunnan Province, Guizhou Province, Henan Province, and Hubei Province. Under the scenario SSP3-7.0 in the 2050s, the suitable distribution pattern displayed the most stable distribution compared with the 2070s and 2090s, and the major contraction areas were in Yunnan Province and Guizhou Province. Meanwhile, under the scenario SSP5-8.5, the distribution pattern showed a similar pattern in the 2090s and 2070s with a minor contraction in Xinjiang. Nevertheless, the 2050s covered more contraction areas in Xinjiang, Yunnan, Guizhou, Henan, and Hubei Provinces.
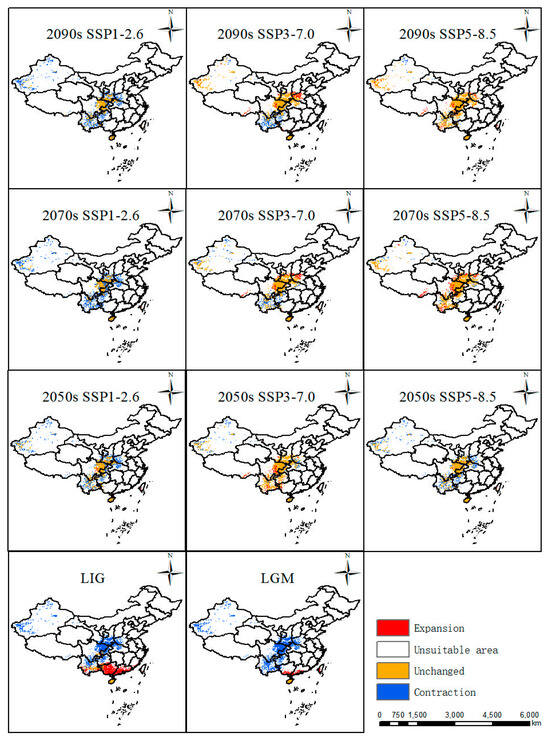
Figure 5.
Changes in suitable areas of P. filchnerae relative to the current climate change scenarios.
2.5. The Migratory Route of the Geometric Center of P. filchnerae
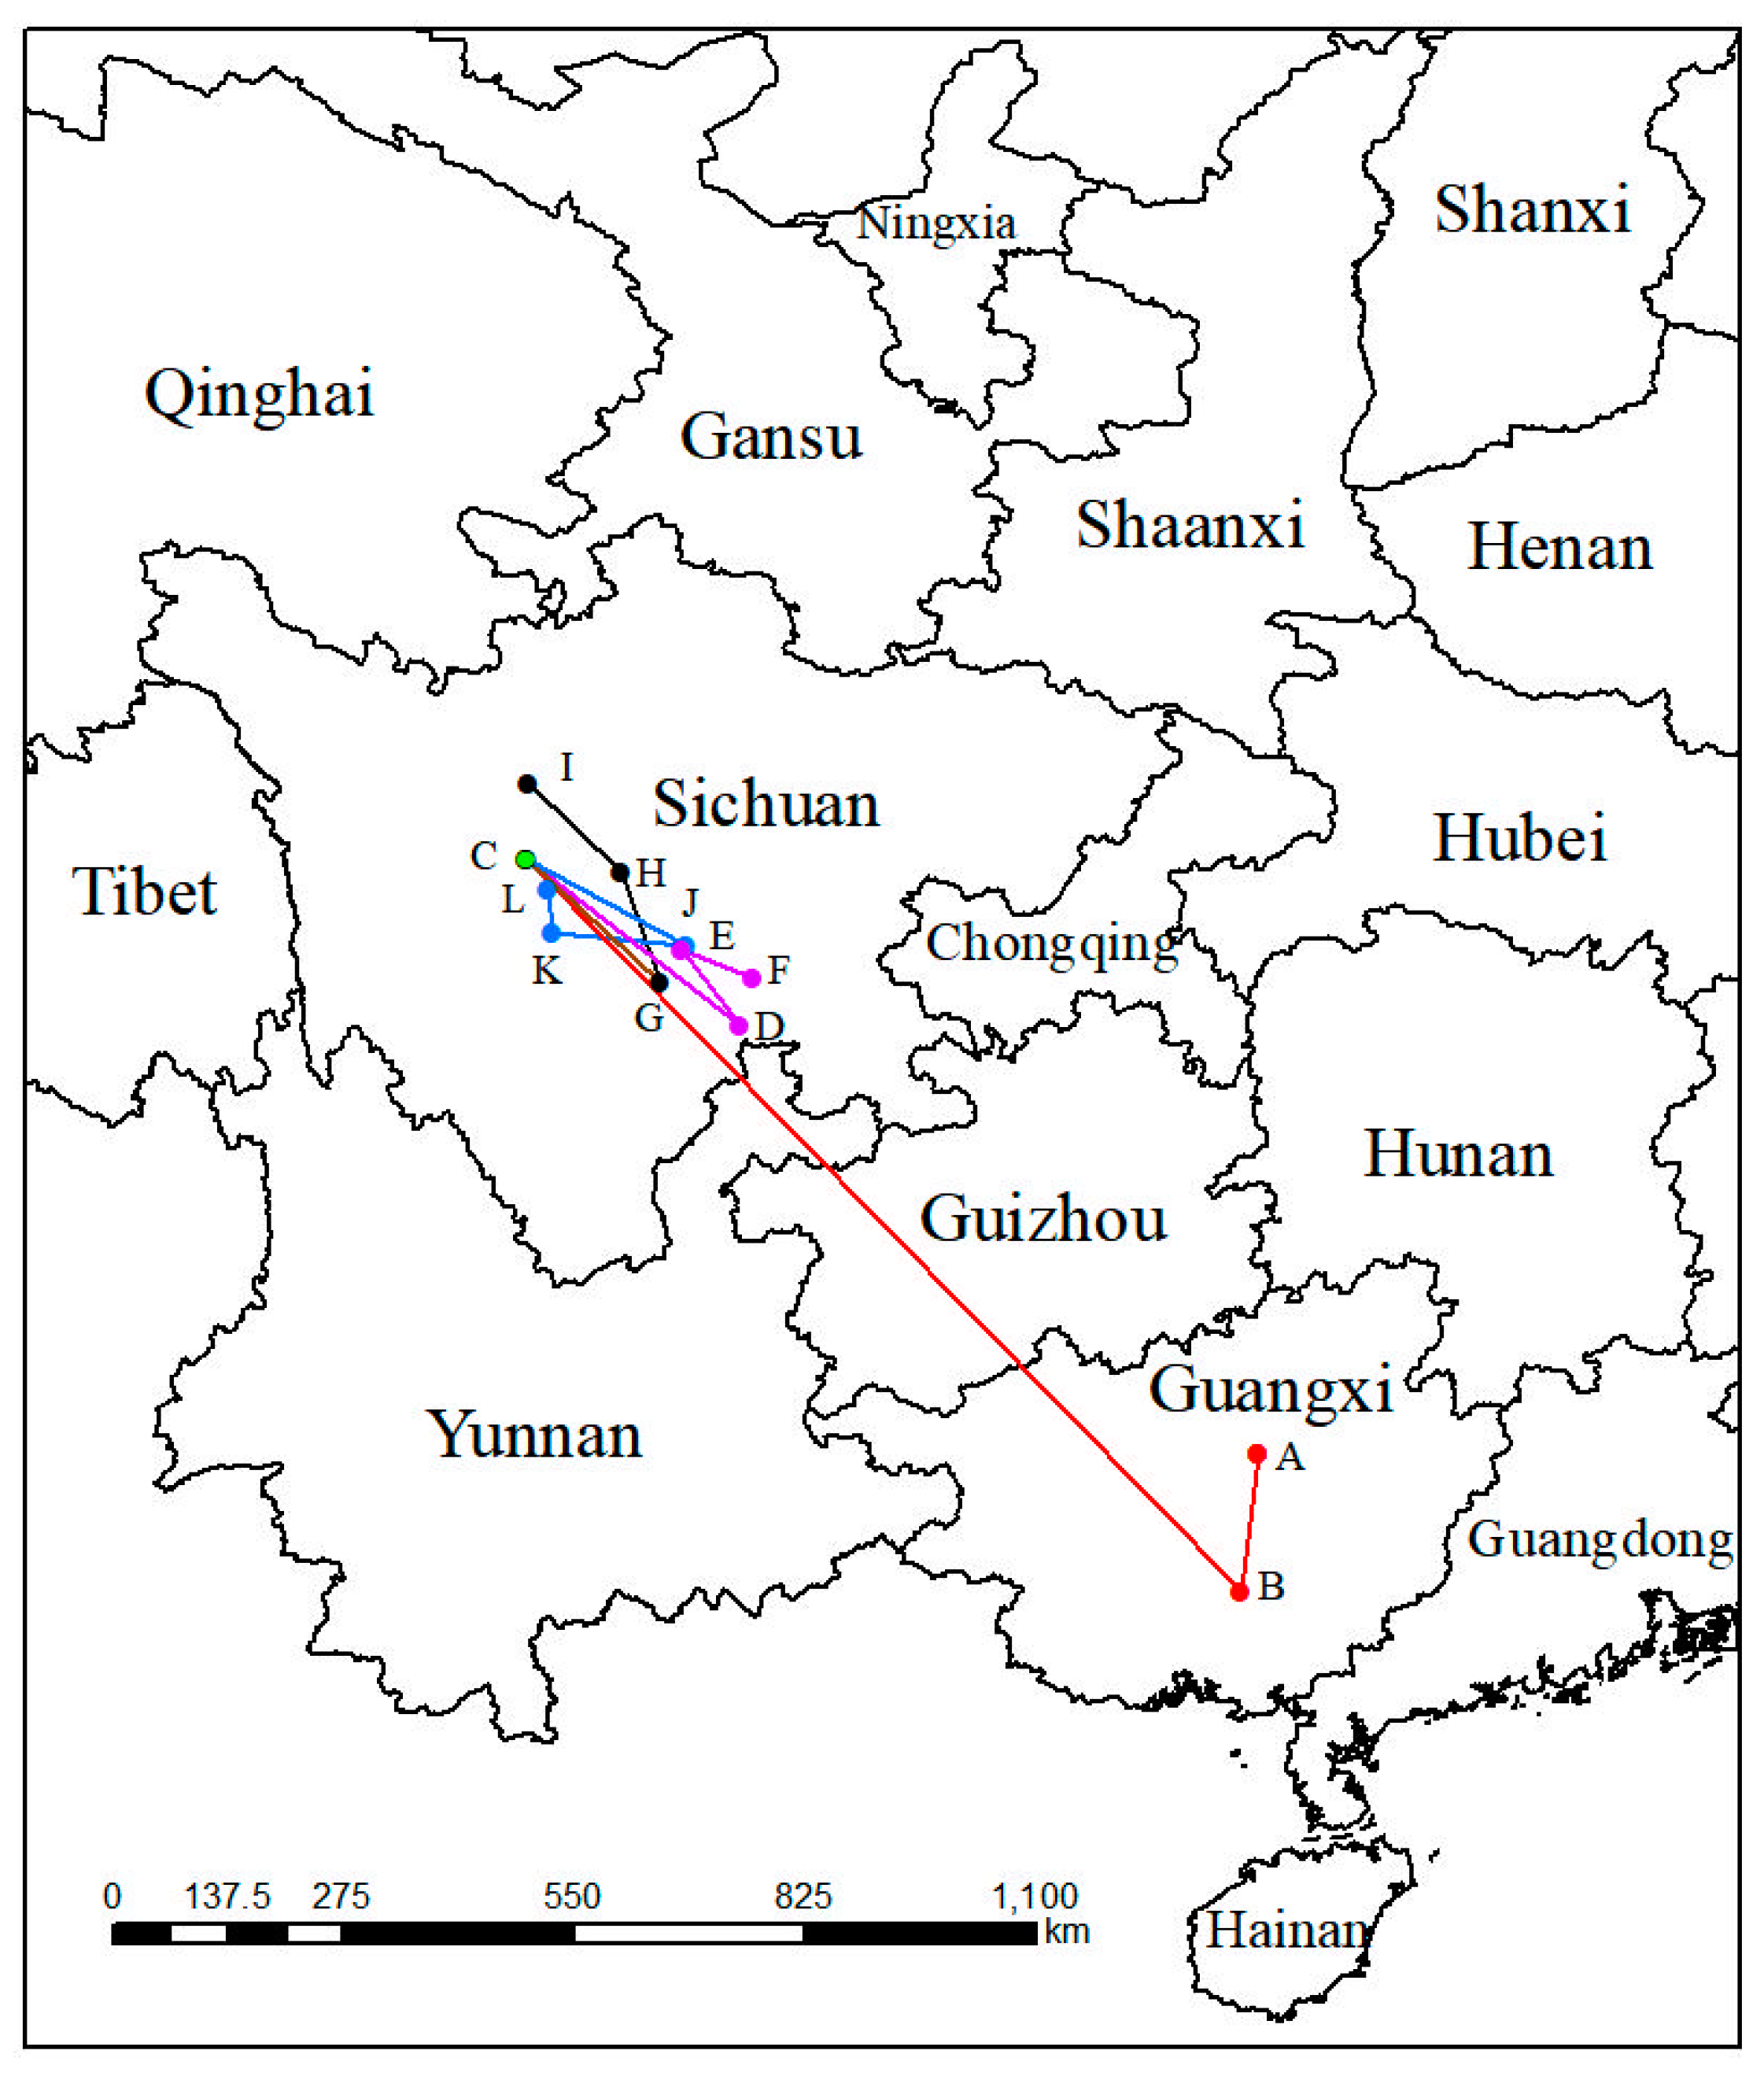
In the past, the geometric centers (point A and point B) of suitable areas for both of LIG and LGM were in the Guangxi Zhuang Autonomous Region (Figure 6). From the past to the present, the geometric center moved toward the southwest about 167.63 km, then kept moving toward the northwest 1217.62 km to the Sichuan Province, the geometric center of the suitable distribution in the modern period. Under SSP1-2.6 in various periods, the geometric center would move toward the southeast about 321.18 km at an average hypothetical speed of 6.42 km/year at first, then move to the northwest and southwest 111.36 km at an average hypothetical speed of 5.56 km/year and 89.21 km at an average hypothetical speed of 4.46 km/year, respectively. Nevertheless, the geometric center of migratory route of the suitable distribution under the SSP3-7.0 compared with the route under the SSP1-2.6, existed differences from the 2070s to the 2090s, when the route was toward the northwest of China. Under SSP5-8.5, unlike the migratory route under SSP3-7.0 from the 2050s to the 2070s, its direction was toward the northwest with a distance of 160.17 km (Table 2).
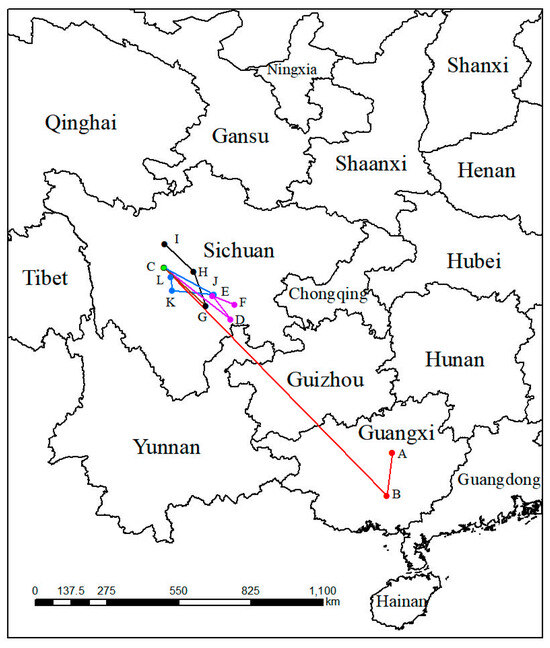
Figure 6.
Migration of the center of suitable habitat for P. filchnerae since the last interglacial period. The letters refer to (A) LIG, (B) LGM, (C) Current, (D) 2050s-SSP1-2.6, (E) 2070s-SSP1-2.6, (F) 2090s-SSP1-2.6, (G) 2050s-SSP3-7.0, (H) 2070s-SSP3-7.0, (I) 2090s-SSP3-7.0, (J) 2050s-SSP5-8.5, (K) 2070s-SSP5-8.5, and (L) 2090s-SSP5-8.5.
Table 2.
Geometric center of the P. filchnerae and its migration distance and speed between different climate scenarios.
3. Discussion
Results from MaxEnt showed that Min Temperature of the Coldest Month (bio6), Precipitation Seasonality (coefficient of variation) (bio15), Precipitation of the Coldest Quarter (bio19), silt, and soil_1kmgrd were the dominant factors affecting the suitable distribution for P. filchnerae. In terms of the percentage contribution of the variables, the total contribution of Min Temperature of the Coldest Month (bio6) and Precipitation of the Coldest Quarter (bio19) was more than 65%, while if we take the Jackknife test into consideration, Min Temperature of the Coldest Month (bio6) and silt were the most dominant factors affecting the distribution of P. filchnerae. In general, Min Temperature of the Coldest Month (bio6) (>−5 °C), Precipitation of the Coldest Quarter (bio19) (<40 mm), and silt were highly significant for the distribution of P. filchnerae. It is clear that climate factors are crucial determinants of species distributions at different scales [30]. Min Temperature of the Coldest Month (bio6) determines whether P. filchnerae could survive and this was consistent with previous similar research [31]. Researchers also found the precipitation of warmest and coldest quarters (bio18 and bio19) to be the highest weight cofactors for projecting the future potential distribution of high-value medical plants in Nepal [32]. Primula filchnerae has a flowering period from February to April, and its growth is closely related to temperature, especially the Min Temperature of the Coldest Month that determines whether P. filchnerae can survive the coldest weather in the winter. Moreover, our results also indicated that precipitation was also an important factor that restricted P. filchnerae’s suitable habitats. Water was reported to play an indispensable role in root growth, release of seed dormancy [33,34,35], and promotion of germination, which is consistent with our observations that seeds of P. filchnerae, when held in Petri dishes and covered with water, would germinate within several days.
Based on the results of the MaxEnt model, the suitable distribution habitats were mainly in Shaanxi Province, Sichuan Province, and Yunnan Province, among which Shaanxi Province was the sampling field of this study, or to be more exact, the central of the Qinglin Mountains and its adjacent areas, and was also the largest of the predicted areas from this model, a finding supported by many previous studies that predicted ranges that were consistent with the actual distribution of certain species [36,37]. The Qinling Mountains are home to many endangered species due to their unique geological environment and climate, among which local trees, and herbs, such as Notopterygium oviforme [38], Abies chensiensis [39], were usually employed to predict and simulate its geographic distribution in future under the impact of climate change. During the last interglacial period and the last glacial maximum period, compared with the current suitable distribution, the suitable distributions were mainly distributed in Yunnan Province, Guangxi Province, Hainan Province, and Guangxi Zhuang Autonomous Region, which indicated an obvious trend for a real reduction from LIG to LGM, more precisely from the north to the south. And this may be due to the climate during the last interglacial period being warm and humid, while the last glacial maximum was harsher, resulting in suitable area loss from LIG to LGM [40,41,42]. This was in line with the temperature profile of China, which tended to be warmer in the south than in the north, so as the climate changed, P. filchnerae may have migrated to warmer areas, such as Hainan Province during the LGM period. Under future climate change, Shaanxi Province and Sichuan Province should remain the most stable distribution areas; nevertheless, the northern part of the modern suitable habitat shows varying degrees of area increase, and the southern part of the modern suitable habitat is projected to shrink [5]. The contraction areas are greater than the increased areas in the future under climate change, except the scenarios SSP5-8.5 in the 2070s and 2090s, which was supported by a similar plant, Larix potaninii Batalin, whose suitable habitats would be reduced by 24.66 × 10⁴ km2 (9.59% of QTP) under the 2081-2100 SSP5-8.5 scenario [43]. Under the SSP1-2.6 scenario, the loss of suitable areas was larger than other scenarios in various periods, among which Yunnan Province, Guizhou Province, Hubei Province, and Henan Province were the main decreased areas. Under the SSP3-7.0 scenario, the decreased suitable areas are associated positively with time, while under the scenario in the 2050s (contraction > expansion), 2070s (contraction < expansion), and 2090s (contraction < expansion), the situations were a little different. Suitable habitats increased in different periods and scenarios, but did not cross the boundary of central Shaanxi Province, presumably because the Qinling Mountains act as a barrier to northward migration. Furthermore, climate change in the future would result in the geographical migration mainly caused by increased temperature and decreased precipitation [44]. From LIG to LGM, P. filchnerae had the longest migration distance, 1217.62 km, to the north, and this may be related to the dramatic climate change from LIG to LGM compared with climate change between other periods. Moreover, under these varying future scenarios, the migration routes of the center did not always keep the same direction, though overall, the center of suitable habitats kept migrating toward to the northwest of China. These results are consistent with other studies reporting that climate change, especially climate warming, resulted in species migration toward higher latitudes [45,46].
Climate change is one of the most significant drivers of plant distribution and is equally important in limiting plant dispersal [47], which determines whether plants can survive or reproduce in another location. Human activity is also an important factor in preventing the spread of plants [48], leading to ranges that are reduced and fragmented. In addition, other ecological variables also play an important role in the distribution and dispersal of species, such as specific soil composition, geographical barriers, and competition between native plants and newly invaded plants. For example, the ecological requirements of Primula sect. Auricula species vary in soil_1kmgrd (soil type), and most of them require basic soils with limestone or acid soils with granite, schist, or similar materials [49], which could possibly explain the importance of soil types for Primula species given habitats locations, but there are no detailed reports about soil composition requirements for P. filchnerae. Some of these environmental factors were not studied in this study due to limited information and methods.
However, some specific events can also affect the dispersal of plants, such as the flight of a dandelion fruit or animals consuming seeds, or the extreme events of seed release after burning or explosive ejection [50]. It is important to study the mechanisms of seed dispersal and link them with the environments, because they are essential to understand the population dynamics and distribution. Growing recognition of the importance of long-distance dispersal (LDD) of plant seeds for various ecological and evolutionary processes has led to an upsurge in research into the mechanisms underlying LDD [51]. Long-distance dispersal (LDD) events were typically rare, yet play a major role in determining large-scale processes such as population spread, the flow of individuals between populations, the colonization of unoccupied habitats, and the assembly of local communities from the metacommunity. Two types of LDD have been defined: one is a passive mechanism, including wind dispersal, animal dispersal (migratory animals), and explosive dispersal, and another was an informed mechanism. The informed mechanism has been largely referred to as animal dispersal whereby individuals can acquire information about their environment to make decisions about their movements [50]. However, there were also many cases that plants can exert control over dispersal by altering their development or responding to environmental conditions. For instance, the brassica Aethionema arabicum forms dehiscent fruits that open to release seeds directly into the nearby proximity, as well as indehiscent winged fruits via developmental plasticity that carry seeds further by wind. In addition, a greater proportion of the winged indehiscent fruits are produced that may disperse further, when they are at a higher altitude and a harsher, less predictable environment [52,53]. Based on our observations, fruits of P. filchenerae are bell-shaped, without an explosive dispersal mechanism, and are more likely to be transported by birds and mammals, and these migratory birds and mammals may have a considerably higher velocity than equivalent nonmigratory animals. And migratory animals were more likely to transport seeds across dispersal barriers, such as mountains and rivers. Moreover, the mature seeds were so small and light that wind dispersal could help. Some researchers found that seeds dispersed by wind had higher LDD in more open landscapes by mechanistic models [54]. Given the limited information on biological traits and the limitations of our knowledge, comprehensive research about the mechanism of P. filchnerae dispersal will be conducted in the future. Of course, the future of seed dispersal depends on the continuation of reliable seed production. Since many Primula species are self-incompatible, such as P. forbesii, P. vulgaris, and P. veris [55,56,57], studies to identify effective pollinators of P. filchnerae, their current distributions, and their ability to migrate should also be investigated.
Protecting plant diversity is of utmost importance for mitigating the impacts of climate change, as diverse plant communities contribute to carbon sequestration, soil stabilization, and regulation of local climates. Primula filchenerae has been classified as an endangered species [26] with highly ornamental value, so it is necessary to take conservation measures to protect this species. Based on our field surveys, we found that human activities (especially road construction), small populations, and fragmented habitats have significantly reduced the wild population of P. filchenerae [58,59]. However, specific management and conservation strategies were still lacking. To ensure the long-term conservation of P. filchenerae, in situ conservation measures can be implemented in the current suitable habitats of P. filchenerae [23]. Adaptive measures included improving the effectiveness of protected areas, long-term monitoring, and raising public awareness of plant conservation [60,61]. In addition, the predicted suitable habitats under future climate conditions should be considered as priority areas for assisted migration and species introduction [62]. Moreover, ex situ conservation measures, including botanical gardens and arboreta, can be used to conserve germplasm resources and expand the population. For example, the Xian Botanical Garden in Shaanxi Province has successfully cultivated P. filchenerae and conducted field regression experiments to expand its wild population [63].
4. Materials and Methods
4.1. Occurrence Data and Its Distribution
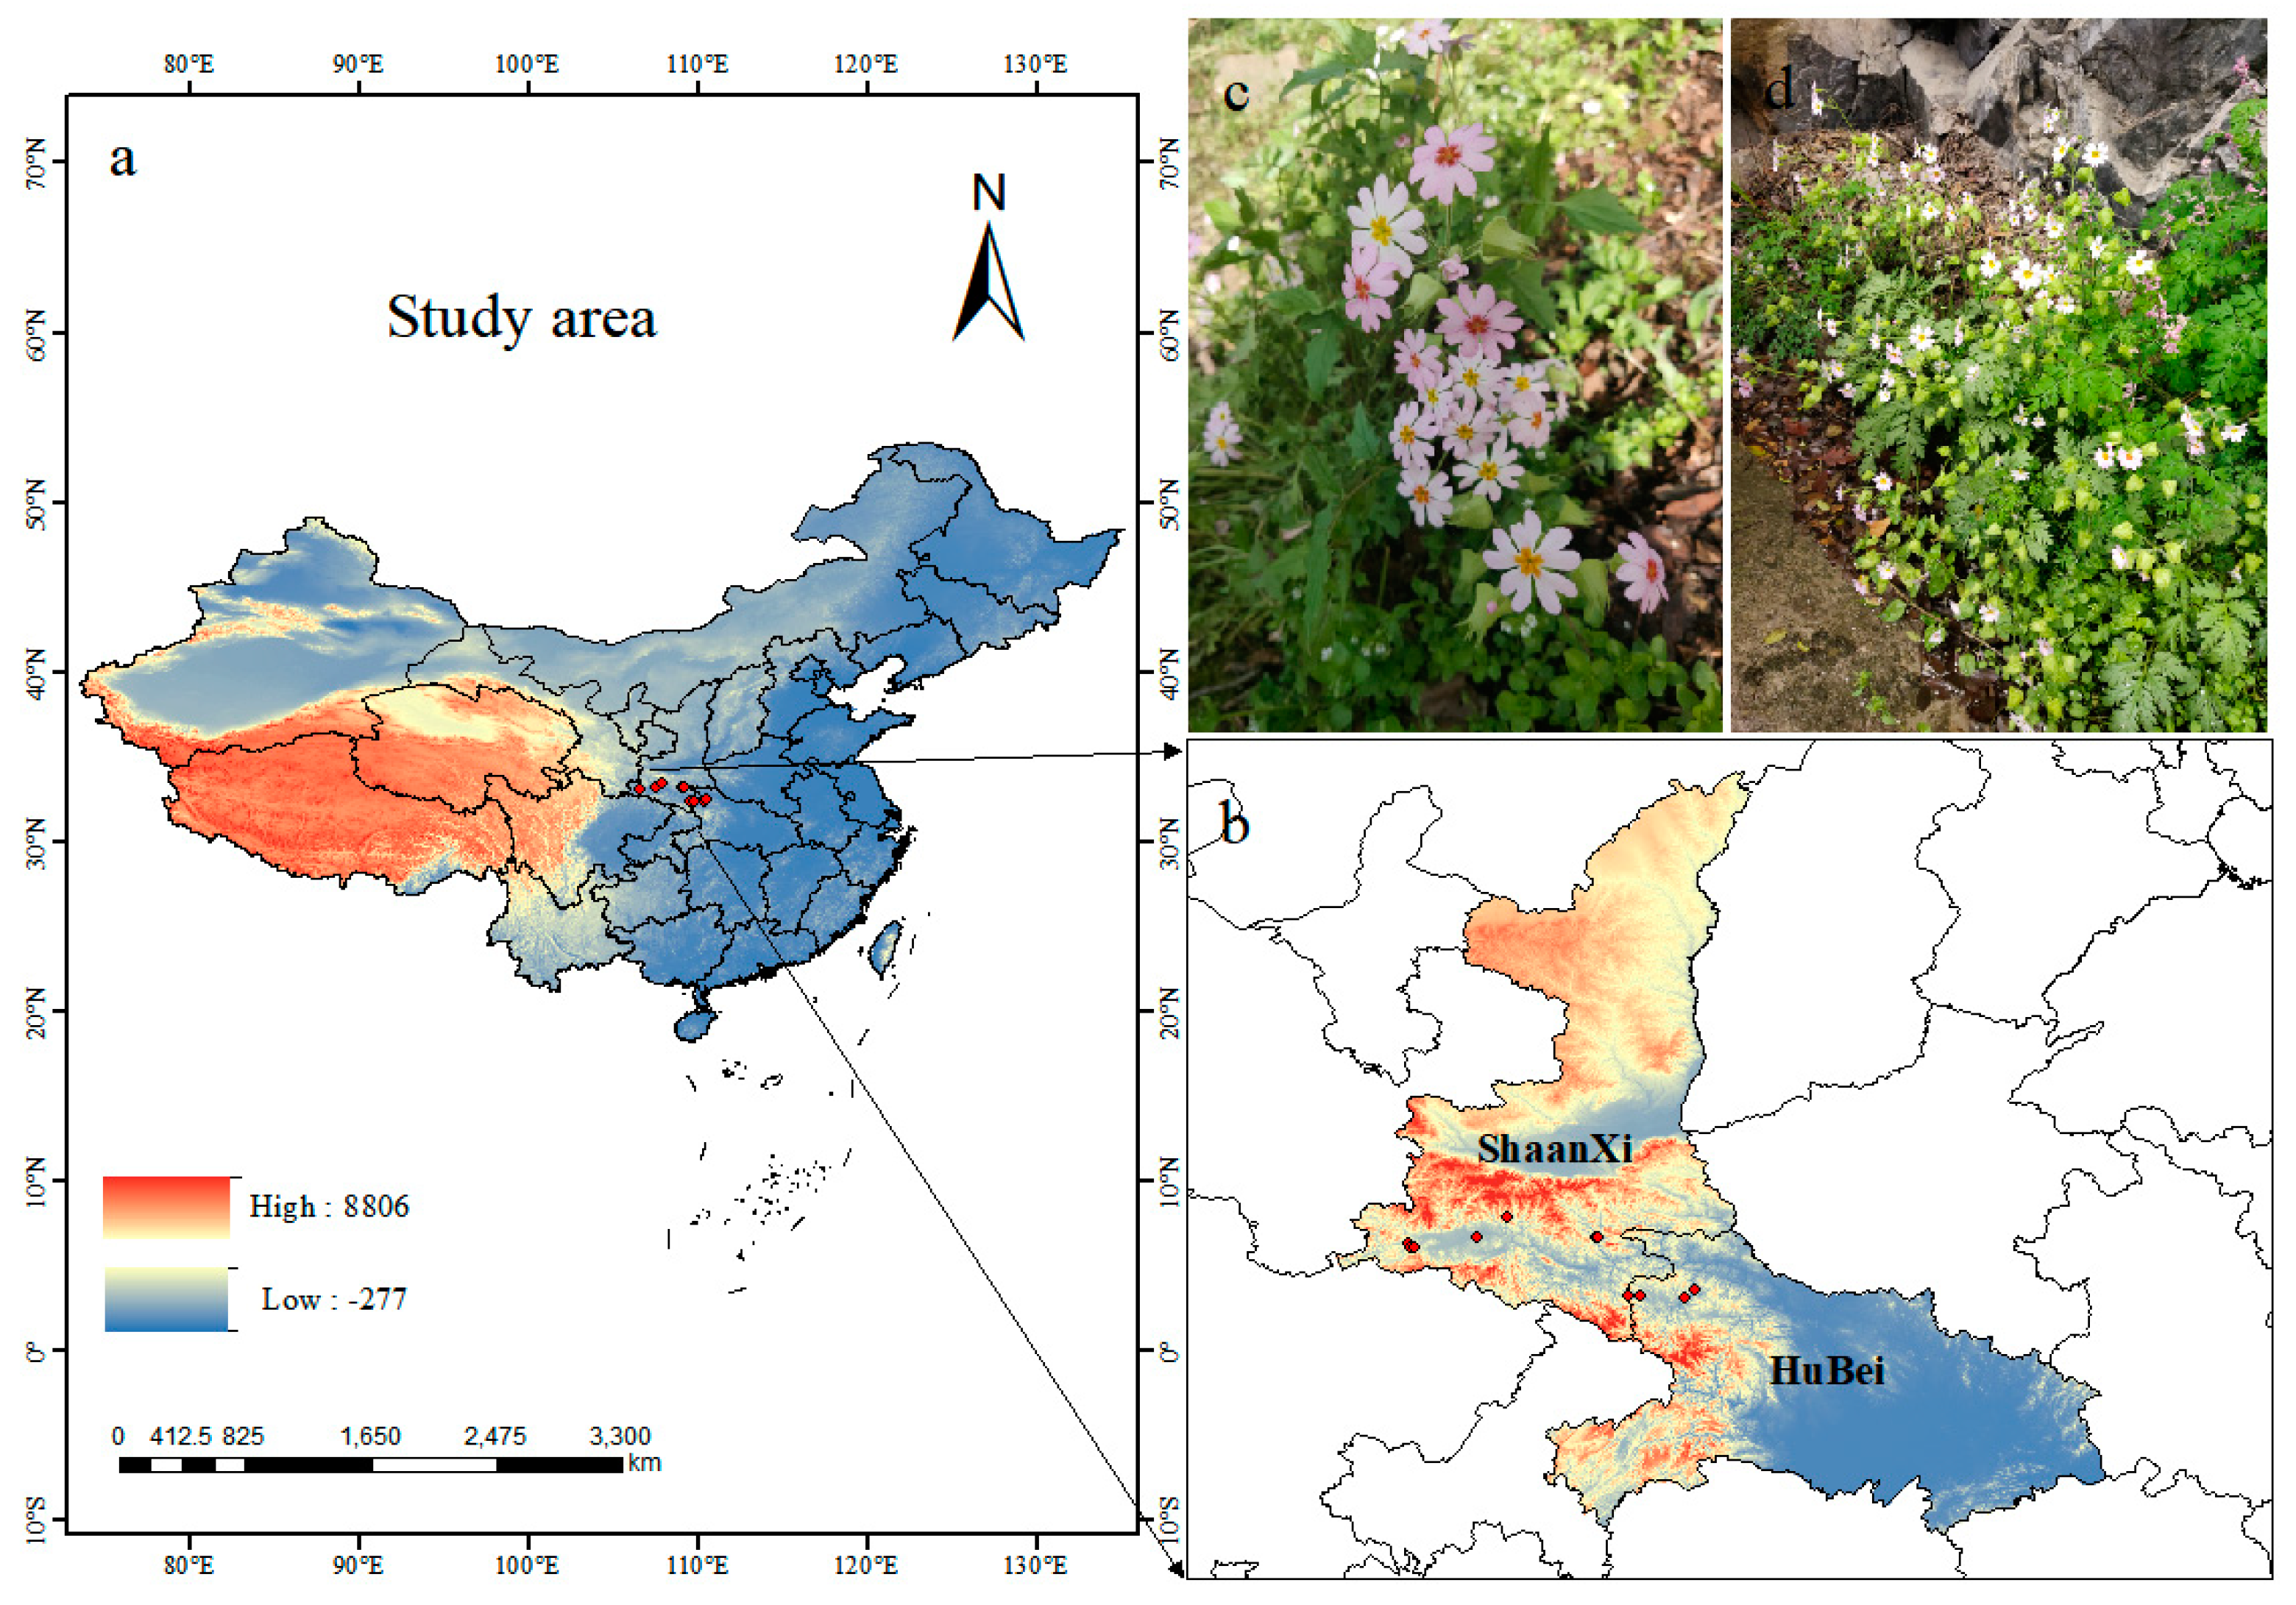
Fourteen location records of P. filchnerae were assembled from (1) field surveys of the natural populations of P. filchnerae in Shaanxi and Hubei in 2023, (2) the Global Biodiversity Information Facility (GBIF, http://v5.cvh.org.cn/ (accessed on 1 September 2023)), (3) the Chinese Virtual Herbarium (http://www.cvh.ac.cn (accessed on 1 September 2023)), and (4) a search of the published literature. ENMeval program was used to reduce the sampling deviation impact by deleting redundant data within 5 km2 on the ground. Consequently, 11 records were selected for display and further analysis by ArcGIS 10.8 (ESRI, Redlands, CA, USA) (Figure 7).
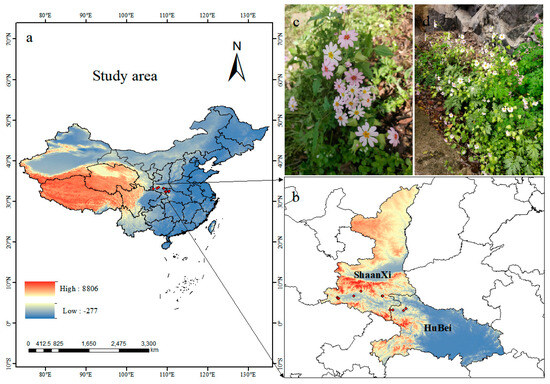
Figure 7.
(a,b) Spatial distribution of P. filchnerae occurrences recorded in China; (c,d) photos of P. filchnerae in field surveys.
4.2. Variable Selection
A total of 26 environmental factors (Table 1) with 2.5 arc-minute (~5 km2) resolution were initially used to construct the MaxEnt model, among which 19 bioclimatic variables and 3 topographical variables were downloaded from the model of BCC-CSM2-MR in the World Climate Database (WorldClaim, http://worldclim.org/ (accessed on 1 September 2023)) released by the Coupled Model Intercomparison Project Phase (CMIP6), including the last interglacial period, the last glacial maximum period, and four additional periods: Current (1970–2000), the future 2050s (2040–2060), the future 2070s (2060–2080), and the future 2090s (2080–2100), which include the four shared socioeconomic paths SSP1-2.6, SSP2-4.5 (exception), SSP3-7.0, and SSP5-8.5. They are employed to describe various socioeconomic paths in order to predict and understand the impact of climate change under different socio-economic conditions. They were used to construct MaxEnt model to predict P. filchnerae distribution in different periods and calculate its expansion and reduction under different climate change scenarios. Four environmental variables, clay, sand, silt, and soil_1kmgrd (representing various soil types), were obtained from the Institute of Geographic Sciences and Natural Resources Research, Chinese Academy of Sciences (http://www.resdc.cn (accessed on 1 September 2023)). In consideration of correlations between environmental variables, the contribution of environmental factors from MaxEnt and Spearman correlation analysis (Figure 8) were combined to select environmental variables. Then, pairs of variables that were correlated above |0.8| were singled out with the variable showing the lower contribution omitted. Finally, five variables (bold variables in Table 3) were used to establish the model. Environmental factors were set as continuous variables and the jackknife method employed to evaluate the importance of environmental variables. Response curves were generated to predict suitable conditions for species, with the test data set to 25%, and the model was run 1000 times and repeated 10 times. Other parameters were set to system default values.
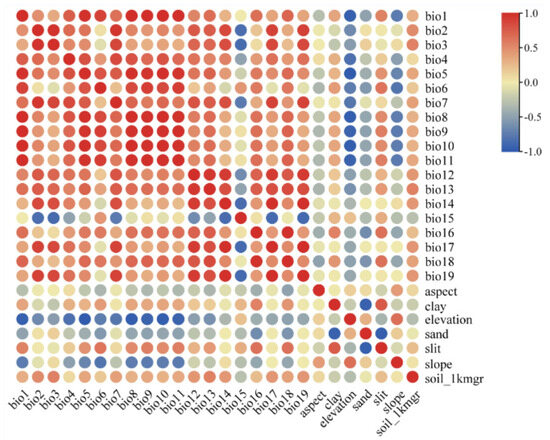
Figure 8.
Correlation analysis of various factors. The correlation coefficient values rise between two variables with the color becoming darker. Red means high correlation, and blue represents low correlations.
Table 3.
Twenty-six environmental variables were used in this study. The variables in bold were ultimately selected to build the model to predict the potentially suitable areas for P. filchnerae.
4.3. Analysis of MaxEnt Model Performance
The receiver operating characteristic (ROC) curve was used to evaluate model performance by determining the area under the ROC curve (AUC) because the AUC is less affected by sample and threshold [64,65,66].
AUC values range between 0 and 1, and the higher the value, the more accurate the model prediction results [67]. The evaluation criteria are as follows: values above 0.9, which means that the model is excellent; values between 0.8 and 0.9, which indicates that the model is good; values between 0.7 and 0.8, which shows that the model is moderate; values under 0.7, which means that the model is poor. The importance of variables on the distribution of P. filchnerae was measured via the ‘Jackknife test’, and the impact of environmental factors on the distribution of P. filchnerae was analyzed using response curves [68].
4.4. Division of Suitable Habitat
The output results of MaxEnt were selected as the prediction result of the study in different periods, and then they were reclassified using the Reclass tool in ArcGIS 10.8, after they were converted to raster file format from ASC file output in ArcGIS 10.8 [30]. The prediction areas of P. filchnerae were divided into four levels based on the probability (P) of species’ presence: highly suitable habitat (>0.7), moderate suitable habitat (0.5–0.7), low suitable habitat (0.3–0.5), and unsuitable habitat (0–0.3).
4.5. Analysis of Area and Distribution Center Route
Areas with different levels of suitability were calculated through spatial analysis module in the ArcGIS, and the changes in area in different periods were compared with the current suitable distribution. In addition, we also employed SDMtool to analyze the centroids of suitable habitats at different times. The migratory population route was drawn to illustrate the temporal and spatial evolution of P. filchnerae from the past to the future in ArcGIS.
5. Conclusions
In this study, we used MaxEnt to model the distribution of P. filchnerae since the last interglacial period. The results showed that Min Temperature of the Coldest Month (bio6), Precipitation of the Coldest Quarter (bio19), and silt played a decisive role in the distribution of P. filchnerae over time. The results of this study indicated that Central Qinling mountains and Southwestern Sichuan were the main suitable distribution areas, which is consistent with extant occurrence records. In addition, based on a shift in geometric centers, suitable habitats were predicted to move toward the northwest of China, coalescing in Sichuan Province over time. Under future climate scenarios (2070s, 2090s under the scenarios of SSP3-7.0, SSP5-8.5), Shaanxi and Sichuan will remain the most stable suitable areas, the northern part of modern suitable habitat will expand, while the southern part will shrink. Based on the current suitable habitats, adaptive measures, such as the establishment of protected areas, long-term monitoring, and raising public awareness of plant conservation can be implemented. Ex situ conservation measures at botanical gardens and arboreta can be undertaken based on projections of suitable distribution. Overall, this study provides a scientific basis for further survey into protection against climate change in the future.
Author Contributions
Conceptualization, X.J. and Z.-H.L.; Data curation, X.J., W.-J.L. and Y.-Z.Z.; Investigation, R.-W.J., C.-L.Y., Y.-T.C. and X.-M.Y.; Methodology, Z.-H.L.; Resources, X.J., W.-J.L., and Z.-H.L.; Software, X.-M.Y., Y.G., F.-J.Z. and R.-Q.S.; Visualization, Y.-T.C., X.-M.Y. and R.-Q.S.; Writing, X.J., W.-J.L., Y.-Z.Z. and Y.-Y.Z.; Writing—review and editing, X.J. and Z.-H.L. All authors have read and agreed to the published version of the manuscript.
Funding
This research was funded by the National Natural Science Foundation of China (31970359) and the Key Program of Research and Development of Shaanxi Province (2022ZDLSF06-02).
Data Availability Statement
Data available on request from the authors.
Acknowledgments
The authors thank the Editor and anonymous reviewers for constructive comments on the manuscript. The authors are grateful for Zhong-Hu Li and Chun-li Yan for field survey, Rui-Wen Jia for data collection and analysis, the Global Biodiversity Information Facility (GBIF, http://www.gbif.org (accessed on 1 September 2023)), the Chinese Virtual Herbarium (CVH, http://www.cvh.ac.cn (accessed on 1 September 2023)), and the WorldClim dataset (http://worldclim.org (accessed on 1 September 2023)).
Conflicts of Interest
The authors declare no conflict of interest.
Abbreviations
MaxEnt, a maximum entropy model; LIG, Last interglacial period; LGM, Last glacial maximum period; Bio6, Min Temperature of the Coldest Month; Bio15, Precipitation Seasonality (coefficient of variation); Bio19, Precipitation of the Coldest Quarter; SSP126, Shared socioeconomic pathway 126; this scenario with 2.6 W/m2 by the year 2100 is a remake of the optimistic scenario RCP2.6 and was designed with the aim of simulating a development that is compatible with the 2 °C target; SSP370, Shared socioeconomic pathway 370. As an update to scenario RCP4.5, SSP245 with an additional radiative forcing of 4.5 W/m2 by the year 2100 represents the medium pathway of future greenhouse gas emissions. This scenario assumes that climate protection measures are being taken; SSP585, shared socioeconomic pathway 585; with an additional radiative forcing of 8.5 W/m2 by the year 2100, this scenario represents the upper boundary of the range of scenarios described in the literature. RCP 6.0, representative Concentration Pathway 6.0.
References
- Manthey, M.; Box, E.O. Realized climatic niches of deciduous trees: Comparing western Eurasia and eastern North America. J. Biogeogr. 2007, 34, 1028–1040. [Google Scholar] [CrossRef]
- Shi, X.; Yin, Q.; Sang, Z.; Zhu, Z.; Jia, Z.; Ma, L. Prediction of potentially suitable areas for the introduction of Magnolia wufengensis under climate change. Ecol. Indic. 2021, 127, 107762. [Google Scholar] [CrossRef]
- Jump, A.S.; Peñuelas, J. Running to stand still: Adaptation and the response of plants to rapid climate change. Ecol. Lett. 2005, 8, 1010–1020. [Google Scholar] [CrossRef]
- Shen, Y.P.; Wang, G.Y. Key findings and assessment results of IPCC WGI fifth assessment report. J. Glaciol. Geocryol. 2013, 35, 1068–1076. [Google Scholar]
- Zhao, G.; Cui, X.; Sun, J.; Li, T.; Wang, Q.I.; Ye, X.; Fan, B. Analysis of the distribution pattern of Chinese Ziziphus jujuba under climate change based on optimized biomod2 and MaxEnt models. Ecol. Indic. 2021, 132, 108256. [Google Scholar] [CrossRef]
- Román-Palacios, C.; Wiens, J.J. Recent responses to climate change reveal the drivers of species extinction and survival. Proc. Natl. Acad. Sci. USA 2020, 117, 4211–4217. [Google Scholar] [CrossRef] [PubMed]
- Taheri, S.; Naimi, B.; Rahbek, C.; Araújo, M.B. Improvements in reports of species redistribution under climate change are required. Sci. Adv. 2021, 7, 2375–2548. [Google Scholar] [CrossRef]
- Momblanch, A.; Beevers, L.; Srinivasalu, P.; Kulkarni, A.; Holman, I.P. Enhancing production and flow of freshwater ecosystem services in a managed Himalayan river system under uncertain future climate. Clim. Chang. 2020, 162, 343–361. [Google Scholar] [CrossRef]
- Qin, M.X.; Gao, X.Y.; Feng, M.C.; Jin, N.; Wang, C.; Cheng, W.J. Modeling of the potential geographical distribution of naked oat under climate change. Front. Plant Sci. 2023, 13, 1009577. [Google Scholar] [CrossRef]
- Byeon, D.H.; Jung, S.; Lee, W.H. Review of CLIMEX and MaxEnt for studying species distribution in South Korea. J. Asia Pac. Biodivers. 2018, 11, 325–333. [Google Scholar] [CrossRef]
- Abedi-Tizaki, M.; Zafari, D. Geographic distribution of phylogenetic species of the Fusarium graminearum species complex and their 8-ketotrichothecene chemotypes on wheat spikes in Iran. Mycotoxin Res. 2017, 33, 245–259. [Google Scholar] [CrossRef]
- Deb, J.C.; Phinn, S.; Butt, N.; McAlpine, C.A. Climatic-Induced Shifts in the Distribution of Teak (Tectona grandis) in Tropical Asia: Implications for Forest Management and Planning. Environ. Manag. 2017, 60, 422–435. [Google Scholar] [CrossRef] [PubMed]
- Thuiller, W. BIOMOD—Optimizing predictions of species distributions and projecting potential future shifts under global change. Glob. Chang. Biol. 2003, 9, 1353–1362. [Google Scholar] [CrossRef]
- Phillips, S.T.; Anderson, R.P.; Schapire, R.E. Maximum entropy modeling of species geographic distributions, Ecological Modelling. Ecol. Modell. 2006, 190, 231–259. [Google Scholar] [CrossRef]
- Graham, C.H.; Elith, J.; Hijmans, R.J.; Guisan, A. The influence of spatial errors in species occurrence data used in distribution models. J. Appl. Ecol. 2008, 45, 239–247. [Google Scholar] [CrossRef]
- Merow, C.; Smith, M.J.; Silander, J.A., Jr. A practical guide to MaxEnt for modeling species’ distributions: What it does, and why inputs and settings matter. Ecography 2013, 36, 1058–1069. [Google Scholar] [CrossRef]
- Sørensen, M.V.; Tovaranonte, J.; Bøcher, P.K.; Balslev, H.; Barfod, A.S. Spatial distribution and environmental preferences of 10 economically important forest palms in western South America. For. Ecol. Manag. 2013, 307, 284–292. [Google Scholar] [CrossRef]
- Dyderski, M.K.; Paź, S.; Frelich, L.E.; Jagodziński, A.M. How much does climate change threaten European forest tree species distributions? Glob. Chang. Biol. 2018, 24, 1150–1163. [Google Scholar] [CrossRef]
- Wauchope, H.S.; Shaw, J.D.; Varpe, Ø.; Lappo, E.G.; Boertmann, D.; Lanctot, R.B.; Fuller, R.A. Rapid climate-driven loss of breeding habitat for Arctic migratory birds. Glob. Chang. Biol. 2017, 23, 1085–1094. [Google Scholar] [CrossRef]
- Wu, R.F.; Qi, J.W.; Li, W.B.; Wang, L.; Shen, Y.; Liu, J.W.; Teng, Y.; Roos, C.; Li, M. Landscape genomics analysis provides insights into future climate change-driven risk in rhesus macaque. Sci. Total Environ. 2023, 899, 165746. [Google Scholar] [CrossRef]
- Zhan, P.; Wang, F.Y.; Xia, P.G.; Zhao, G.H.; Wei, M.T.; Wei, F.G.; Han, R.L. Assessment of suitable cultivation region for Panax notoginseng under different climatic conditions using MaxEnt model and high-performance liquid chromatography in China. Ind. Crops Prod. 2022, 176, 114416. [Google Scholar] [CrossRef]
- Dong, H.; Zhang, N.N.; Shen, S.M.; Zhu, S.X.; Fan, S.B.; Lu, Y. Effects of Climate Change on the Spatial Distribution of the Threatened Species Rhododendron purdomii in Qinling-Daba Mountains of Central China: Implications for Conservation. Sustainability 2023, 15, 3181. [Google Scholar] [CrossRef]
- Ouyang, X.H.; Chen, A.L.; Strachan, G.B.; Mao, Y.J.; Zuo, L.Y.; Lin, H.P. Simulation of the Potential Suitable Distribution of the Endangered Cremastra appendiculata in China Under Global Climate Change. Front. Environ. Sci. 2022, 10, 878115. [Google Scholar] [CrossRef]
- Hao, G.; Hu, C.M.; Sook, L.N. Circumscriptions and Phylogenetic Relationships of Primula Sects. Auganthus and Ranunculoides: Evidence from nrDNA ITS Sequences. Acta Bot. Sin. 2002, 44, 72–75. [Google Scholar]
- Hu, C.M.; Hao, G. New and noteworthy species of Primula (Primulaceae) from China. Edinb. J. Bot. 2011, 68, 297–300. [Google Scholar] [CrossRef]
- Li, L.; Qin, H.; Nic Lughadha, E.; Zheng, Y.; Wan, H.; Plummer, J.; Howes, M.-J.R.; Liu, H.; Jiang, Y.; Wang, T.; et al. Red list assessments of Chinese higher plants. Int. J. Digit. Earth 2023, 16, 2762–2775. [Google Scholar] [CrossRef]
- Xie, J.; Li, X.W.; Gan, Q.L. Some new recorded plants of Pteridophyte and Spermatophtye from Hubei. Chin. Wild Plant Resour. 2009, 28, 83–91. [Google Scholar]
- Liu, Y.Q.; Zhang, L.; Wang, S.B.; Li, R.; Huang, Y. The complete chloroplast genome of Primula vialii (Primulaceae), an ornamental plant. Mitochondrial DNA Part B Resour. 2023, 8, 619–623. [Google Scholar] [CrossRef]
- Zhang, J.Q.; Dang, G.D.; Li, Z.J.; Ren, Y. Rediscovery of endangered plant Primula filchnerae Knuth in Shaanxi Province. Acta Bot. Boreali Occidentalia Sin. 2015, 35, 1913–1915. [Google Scholar]
- Jochum, G.M.; Mudge, K.W.; Thomas, R.B. Elevated temperatures increase leaf senescence and root secondary metabolite concentrations in the understory herb Panax quinquefolius (Araliaceae). Am. J. Bot. 2007, 94, 819–826. [Google Scholar] [CrossRef]
- Zhang, D.F.; Zhang, Q.; Guo, J.; Sun, C.Z.; Wu, J.; Nie, X.; Xie, C.X. Research on the global ecological suitability and characteristics of regions with Angelica sinensis based on the MaxEnt model. Acta Ecol. Sin. 2017, 37, 5111–5120. [Google Scholar]
- Kunwar, R.M.; Thapa-Magar, K.B.; Subedi, S.C.; Kutal, D.H.; Baral, B.; Joshi, N.R.; Adhikari, B.; Upadhyaya, K.S.; Thapa-Magar, S.; Ansari, A.S.; et al. Distribution of important medicinal plant species in Nepal under past, present, and future climatic conditions. Ecol. Indic. 2023, 146, 109879. [Google Scholar] [CrossRef]
- Sharma, M.; Singh, D.; Sasena, H.B.; Sharma, M.; Tiwari, A.; Aasthi, P.; Botta, H.K.; Shukla, B.N.; Laxmi, A. Understanding the Intricate Web of Phytohormone Signalling in Modulating Root System Architecture. Int. J. Mol. Sci. 2021, 22, 5508. [Google Scholar] [CrossRef] [PubMed]
- Sheppard, C.S.; Burns, B.R.; Stanley, M.C. Predicting plant invasions under climate change: Are species distribution models validated by field trials? Glob. Chang. Biol. 2014, 20, 2800–2814. [Google Scholar] [CrossRef] [PubMed]
- Jiang, R.; Zou, M.; Qin, Y.; Tan, G.; Huang, S.; Quan, H.; Zhou, J.; Liao, H. Modeling of the Potential Geographical Distribution of Three Fritillaria Species Under Climate Change. Front. Plant Sci. 2022, 12, 749838. [Google Scholar] [CrossRef]
- Mishra, S.N.; Gupta, H.S.; Kulkarni, N. Impact of climate change on the distribution of Sal species. Eol. Inform. 2021, 61, 101244. [Google Scholar] [CrossRef]
- Shi, X.; Wang, J.; Zhang, L.; Chen, S.; Zhao, A.; Ning, X.; Fan, G.; Wu, N.; Zhang, L.; Wang, Z. Prediction of the potentially suitable areas of Litsea cubeba in China based on future climate change using the optimized MaxEnt model. Ecol. Indic. 2023, 148, 110093. [Google Scholar] [CrossRef]
- Liu, M.L.; He, Y.L.; Pujol, J.L.; Jia, Y.; Li, Z.H. Complex population evolutionary history of four cold-tolerant Notopterygium herb species in the Qinghai-Tibetan Plateau and adjacent areas. Heredity 2019, 123, 242–263. [Google Scholar] [CrossRef]
- Dong, P.-B.; Wang, L.-Y.; Wang, L.-J.; Jia, Y.; Li, Z.-H.; Bai, G.; Zhao, R.-M.; Liang, W.; Wang, H.-Y.; Guo, F.-X.; et al. Distributional Response of the Rare and Endangered Tree Species Abies chensiensis to Climate Change in East Asia. Biology 2022, 11, 1659. [Google Scholar] [CrossRef]
- Dias, J.M.A.; Boski, T.; Rodrigues, A.; Magalhães, F. Coast line evolution in Portugal since the Last Glacial Maximum until present—A synthesis. Mar. Geol. 2000, 170, 177–186. [Google Scholar] [CrossRef]
- Tarasov, P.; Bezrukova, E.; Karabanov, E.; Nakagawa, T.; Wagner, M.; Kulagina, N.; Letunova, P.; Abzaeva, A.; Granoszewski, W.; Riedel, F. Vegetation and climate dynamics during the Holocene and Eemian interglacials derived from Lake Baikal pollen records. Palaeogeogr. Palaeoclimatol. Palaeoecol. 2007, 252, 440–457. [Google Scholar] [CrossRef]
- Turner, R.; Roberts, N.; Eastwood, W.J.; Jenkins, E.; Rosen, A. Fire, climate and the origins of agriculture: Micro-charcoal records of biomass burning during the last glacial–interglacial transition in Southwest Asia. J. Quat. Sci. 2009, 25, 371–386. [Google Scholar] [CrossRef]
- An, X.; Huang, T.S.; Zhang, H.Y.; Yue, J.J.; Zhao, B.J. Prediction of Potential Distribution Patterns of Three Larix Species on Qinghai-Tibet Plateau under Future Climate Scenarios. Forests 2023, 14, 1058. [Google Scholar] [CrossRef]
- Yan, X.; Wang, S.; Duan, Y.; Han, J.; Huang, D.; Zhou, J. Current and future distribution of the deciduous shrub Hydrangea macrophylla in China estimated by MaxEnt. Ecolo. Evol. 2021, 11, 16099–16112. [Google Scholar] [CrossRef] [PubMed]
- Zhong, X.; Zhang, L.; Zhang, J.; He, L.; Sun, R. Maxent Modeling for Predicting the Potential Geographical Distribution of Castanopsis carlesii under Various Climate Change Scenarios in China. Forests 2023, 14, 1397. [Google Scholar] [CrossRef]
- Chen, I.C.; Hill, J.K.; Ohlemüller, R.O.; Roy, D.B.; Thomas, C.D. Rapid Range Shifts of Species Associated with High Levels of Climate Warming. Science 2011, 333, 1024–1026. [Google Scholar] [CrossRef]
- Dieleman, C.M.; Branfireun, B.A.; McLaughlin, J.W.; Lindo, Z. Climate change drives a shift in peatland ecosystem plant community: Implications for ecosystem function and stability. Glob. Chang. Biol. 2015, 21, 388–395. [Google Scholar] [CrossRef]
- Zhou, D.M.; Zhang, R.Z.; Sun, W.C.; Zhang, J.; Wang, H.L. Evaluation of the suitability and influencing factors of winter rapeseed planting in Gansu Province. Chin. J. Eco-Agric. 2014, 22, 697–704. [Google Scholar]
- Zhang, L.B.; Kadereit, W.J. Classification of Primula sect. Auricula (Primulaceae) based on two molecular data sets (ITS, AFLPs), morphology and geographical distribution. Bot. J. Linn. Soc. 2004, 146, 1–26. [Google Scholar] [CrossRef]
- Seale, M.; Nakayama, N. Seale. From passive to informed: Mechanical mechanisms of seed dispersal. New Phytol. 2019, 225, 653–658. [Google Scholar] [CrossRef]
- Nathan, R.; Schurr, M.F.; Spiegel, O.; Steinitz, O.; Trakhtenbrot, A.; Tsoar, A. Mechanisms of long-distance seed dispersal. Trends Ecol. Evol. 2008, 23, 638–647. [Google Scholar] [CrossRef]
- Lenser, T.; Graeber, K.; Cevik, S.; Adigüzel, N.; Dönmez, A.A.; Grosche, C.; Kettermann, M.; Mayland-Quellhorst, S.; Mérai, Z.; Mohammadin, S.; et al. Developmental Control and Plasticity of Fruit and Seed Dimorphism in Aethionema arabicum. Plant Physiol. 2016, 172, 1691–1707. [Google Scholar] [CrossRef]
- Arshad, W.; Sperber, K.; Steinbrecher, T.; Nichols, B.; Jansen, A.A.V.; Metzer, L.G.; Mummenhoff, K. Dispersal biophysics and adaptive significance of dimorphic diaspores in the annual Aethionema arabicum (Brassicaceae). New Phytol. 2018, 221, 1434–1446. [Google Scholar] [CrossRef] [PubMed]
- Schurr, F.M.; Bond, W.J.; Midgley, G.F.; Higgins, S.I. A mechanistic model for secondary seed dispersal by wind and its experimental validation. J. Ecol. 2005, 93, 1017–1028. [Google Scholar] [CrossRef]
- Jia, Y.; Liu, C.L.; Li, Y.F.; Xiang, Y.F.; Pan, Y.Z.; Liu, Q.L.; Gao, S.P.; Yin, X.C.; Wang, Z.X. Inheritance of distyly and homostyly in self-incompatible Primula forbesii. Heredity 2023, 130, 259–268. [Google Scholar] [CrossRef] [PubMed]
- Brys, R.; Jacquemyn, H.; Endels, P.; Rossum, V.F.; Hermy, M.; Triest, L.; Bruyn, D.L.; Blust, D.E.G. Reduced reproductive success in small populations of the self-incompatible Primula vulgaris. J. Ecol. 2004, 92, 5–14. [Google Scholar] [CrossRef]
- Brys, R.; Jacquemyn, H. The impact of individual inaccuracy of reciprocal herkogamy on legitimate pollen deposition and seed set in a distylous self-incompatible herb. J. Ecol. 2019, 108, 81–93. [Google Scholar] [CrossRef]
- Zhang, N.; Qin, M.; Zhu, S.; Huang, Z.; Dong, H.; Yang, Y.; Yang, L.; Lu, Y. De-velopment and characterization of microsatellite markers for Rhododendron purdomii (Ericaceae) using next-generation sequenc-ing. Genes Genet. Syst. 2022, 96, 253–257. [Google Scholar] [CrossRef] [PubMed]
- Zhao, B.; Zhang, G.; Si, G.; Gu, X.; Zhang, Y. Investigation on Rhododendron Germplasm in Qinling Mountains. J. Northwest For. Coll. 2013, 28, 104–109. [Google Scholar]
- Ma, Y.; Nielsen, J.; Chamberlain, D.F.; Li, X.; Sun, W. The conservation of Rhododendrons is of greater urgency than has been previously acknowledged in China. Biodivers. Conserv. 2014, 23, 3149–3154. [Google Scholar] [CrossRef]
- Lu, Y.; Liu, H.; Chen, W.; Yao, J.; Huang, Y.; Zhang, Y.; He, X. Conservation planning of the genus Rhododendron in Northeast China based on current and future suitable habitat distributions. Biodivers. Conserv. 2021, 30, 673–697. [Google Scholar] [CrossRef]
- Aitken, S.N.; Bemmels, J.B. Time to get moving: Assisted gene flow of forest trees. Evol. Appl. 2016, 9, 271–290. [Google Scholar] [CrossRef] [PubMed]
- Ministry of Ecology and Environment of the People’s Republic of China. Available online: https://www.mee.gov.cn/ywgz/zrstbh/swdyxbh/202306/t20230612_1033462.shtml (accessed on 8 October 2023).
- Liu, L.; Wang, R.L.; Zhang, Y.Y.; Mou, Q.Y.; Gou, Y.S.; Liu, K.; Huang, N.; Ouyang, C.; Hu, J.; Du, B. Simulation of potential suitable distribution of Alnus cremastogyne Burk. In China under climate change scenarios. Ecol. Indic. 2021, 133, 108396. [Google Scholar] [CrossRef]
- Jayasinghe, S.L.; Kumar, L. Modeling the climate suitability of tea [Camellia sinensis (L.) O. Kuntze] in Sri Lanka in response to current and future climate change scenarios. Agric. For. Meteorol. 2019, 272–273, 102–117. [Google Scholar] [CrossRef]
- Valverde, A.J. Insights into the area under the receiver operating characteristic curve (AUC) as a discrimination measure in species distribution modelling. Glob. Ecol. Biogeogr. 2012, 21, 498–507. [Google Scholar] [CrossRef]
- Phillips, S.J.; Dudík, M. Modeling of species distributions with Maxent: New extensions and a comprehensive evaluation. Ecography 2008, 31, 161–175. [Google Scholar] [CrossRef]
- Wang, R.; Yang, H.; Wang, M.; Zhang, Z.; Huang, T.; Wen, G.; Li, Q. Predictions of potential geographical distribution of Diaphorina citri (Kuwayama) in China under climate change scenarios. Sci. Rep. 2020, 10, 9202. [Google Scholar] [CrossRef]

Disclaimer/Publisher’s Note: The statements, opinions and data contained in all publications are solely those of the individual author(s) and contributor(s) and not of MDPI and/or the editor(s). MDPI and/or the editor(s) disclaim responsibility for any injury to people or property resulting from any ideas, methods, instructions or products referred to in the content. |
© 2023 by the authors. Licensee MDPI, Basel, Switzerland. This article is an open access article distributed under the terms and conditions of the Creative Commons Attribution (CC BY) license (https://creativecommons.org/licenses/by/4.0/).