
Evidence of Xylella fastidiosa Infection and Associated Thermal Signatures in Southern Highbush Blueberry (Vaccinium corymbosum Interspecific Hybrids)


Abstract
:1. Introduction
2. Results
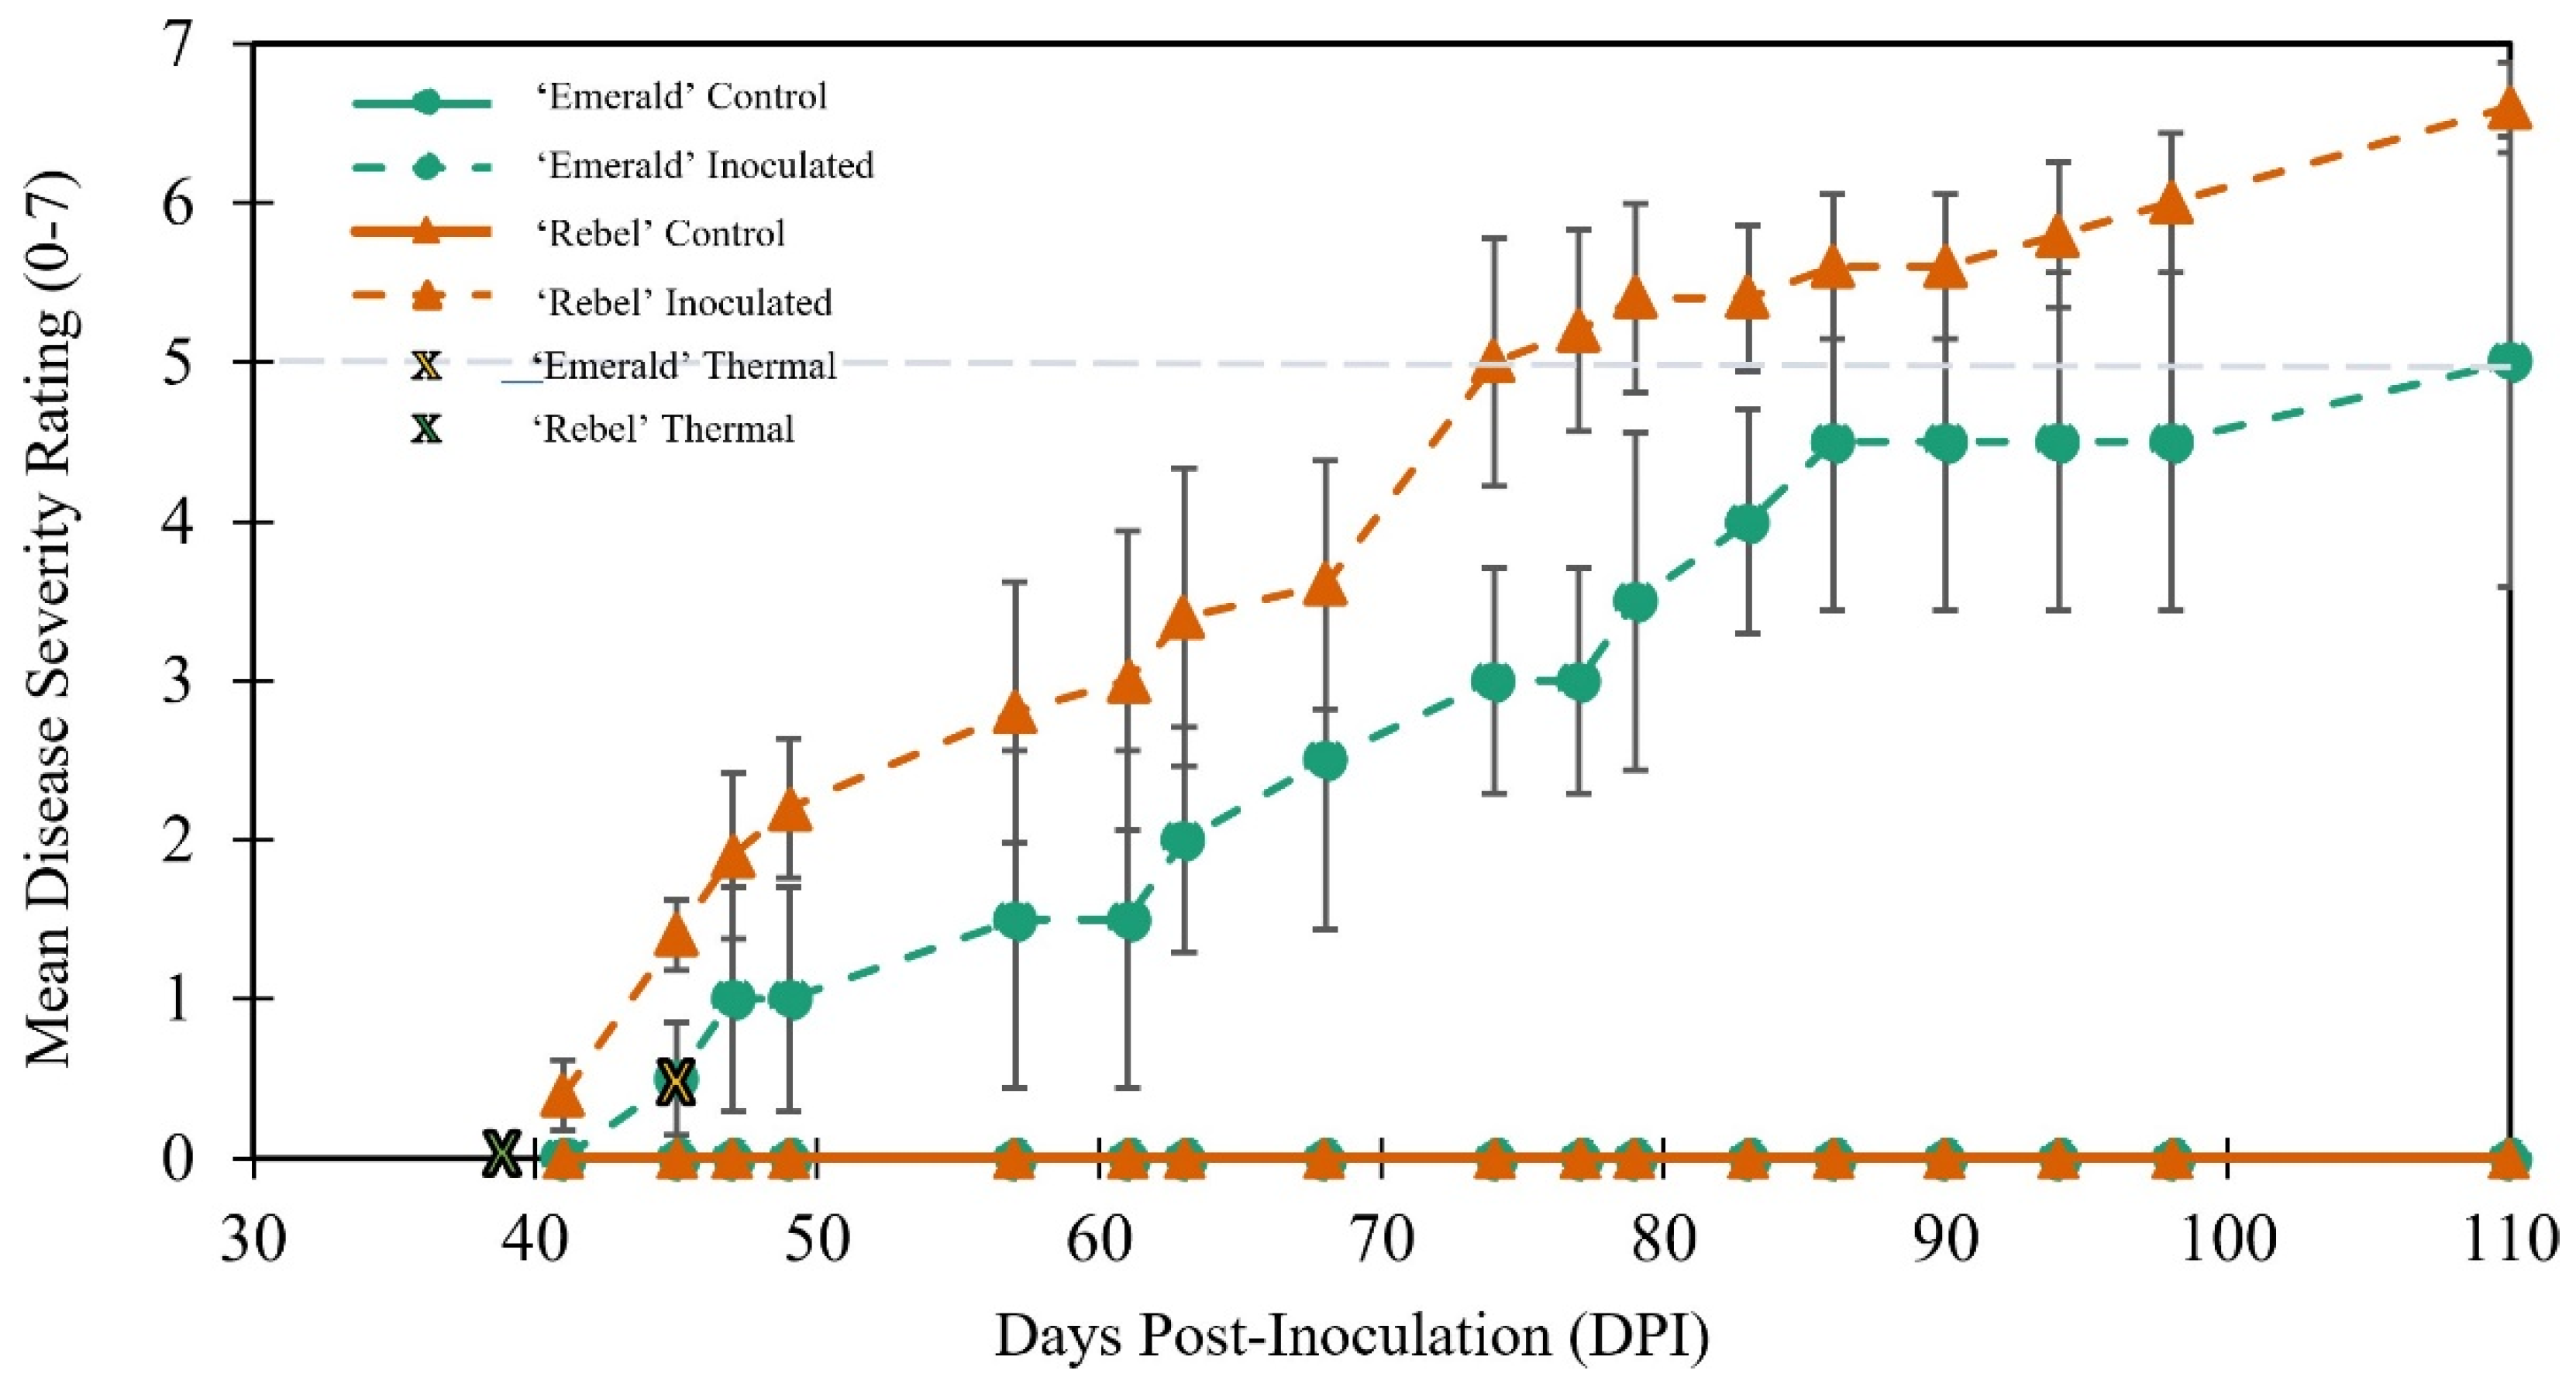
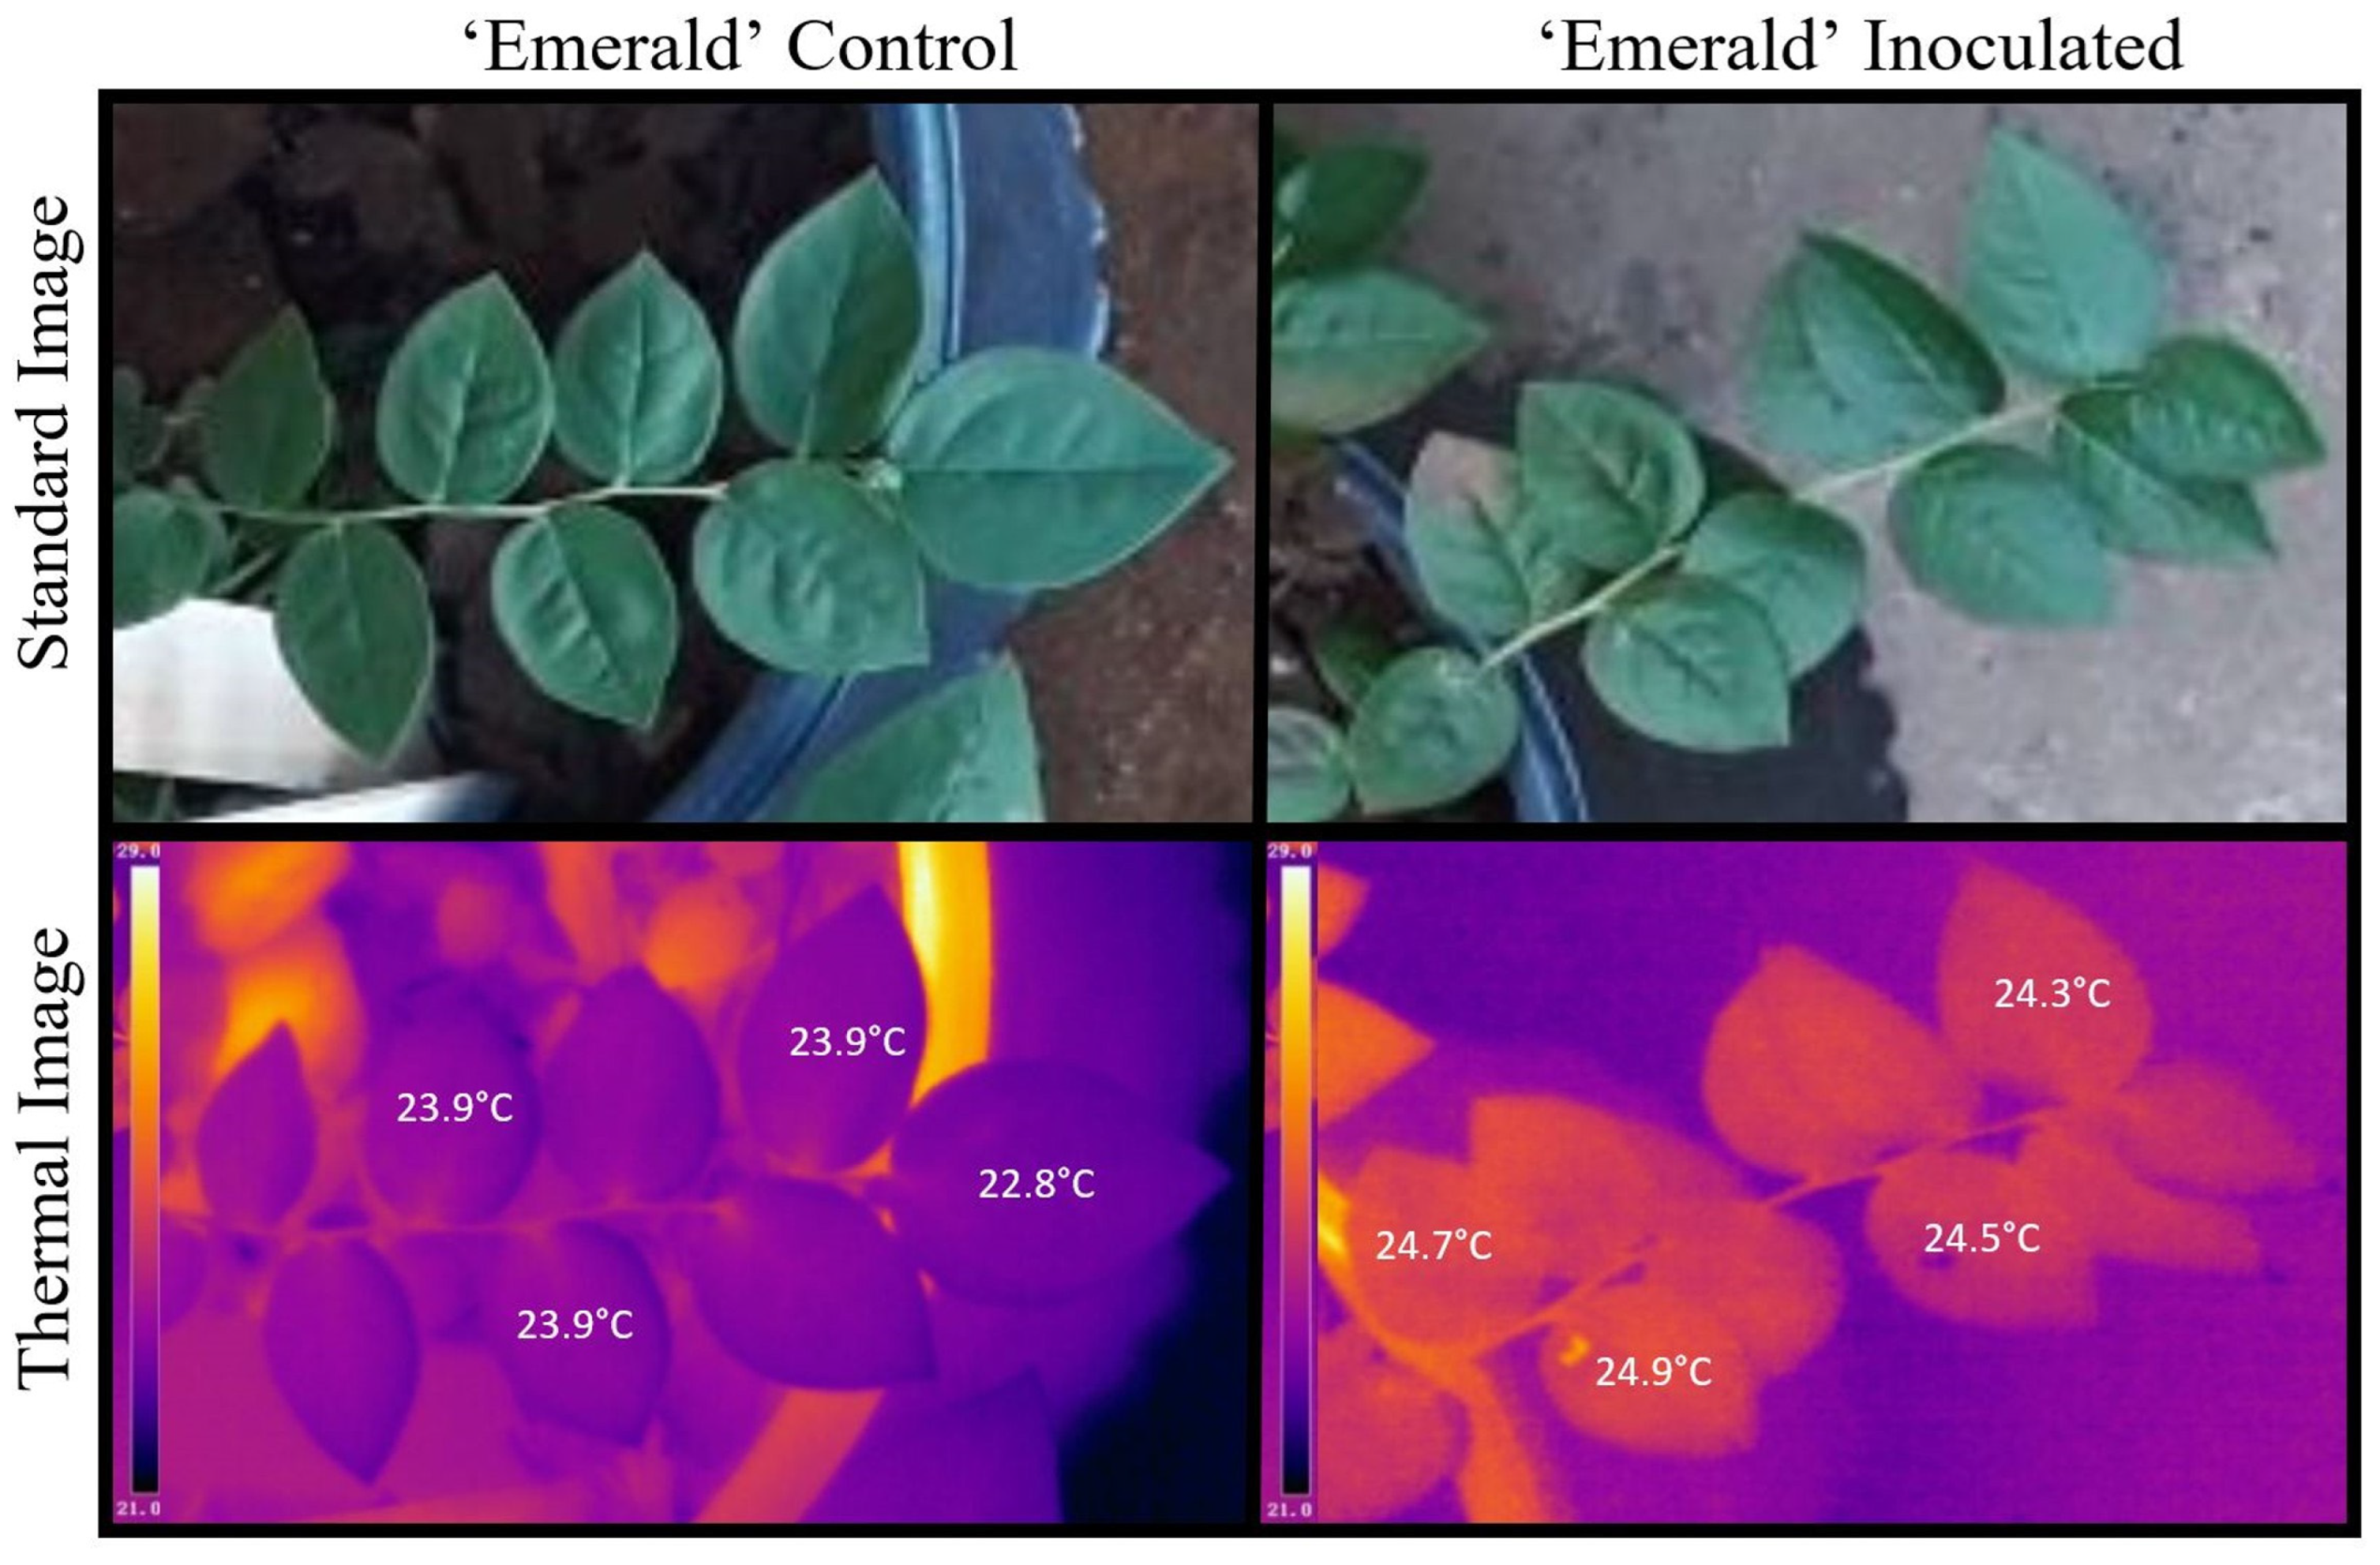
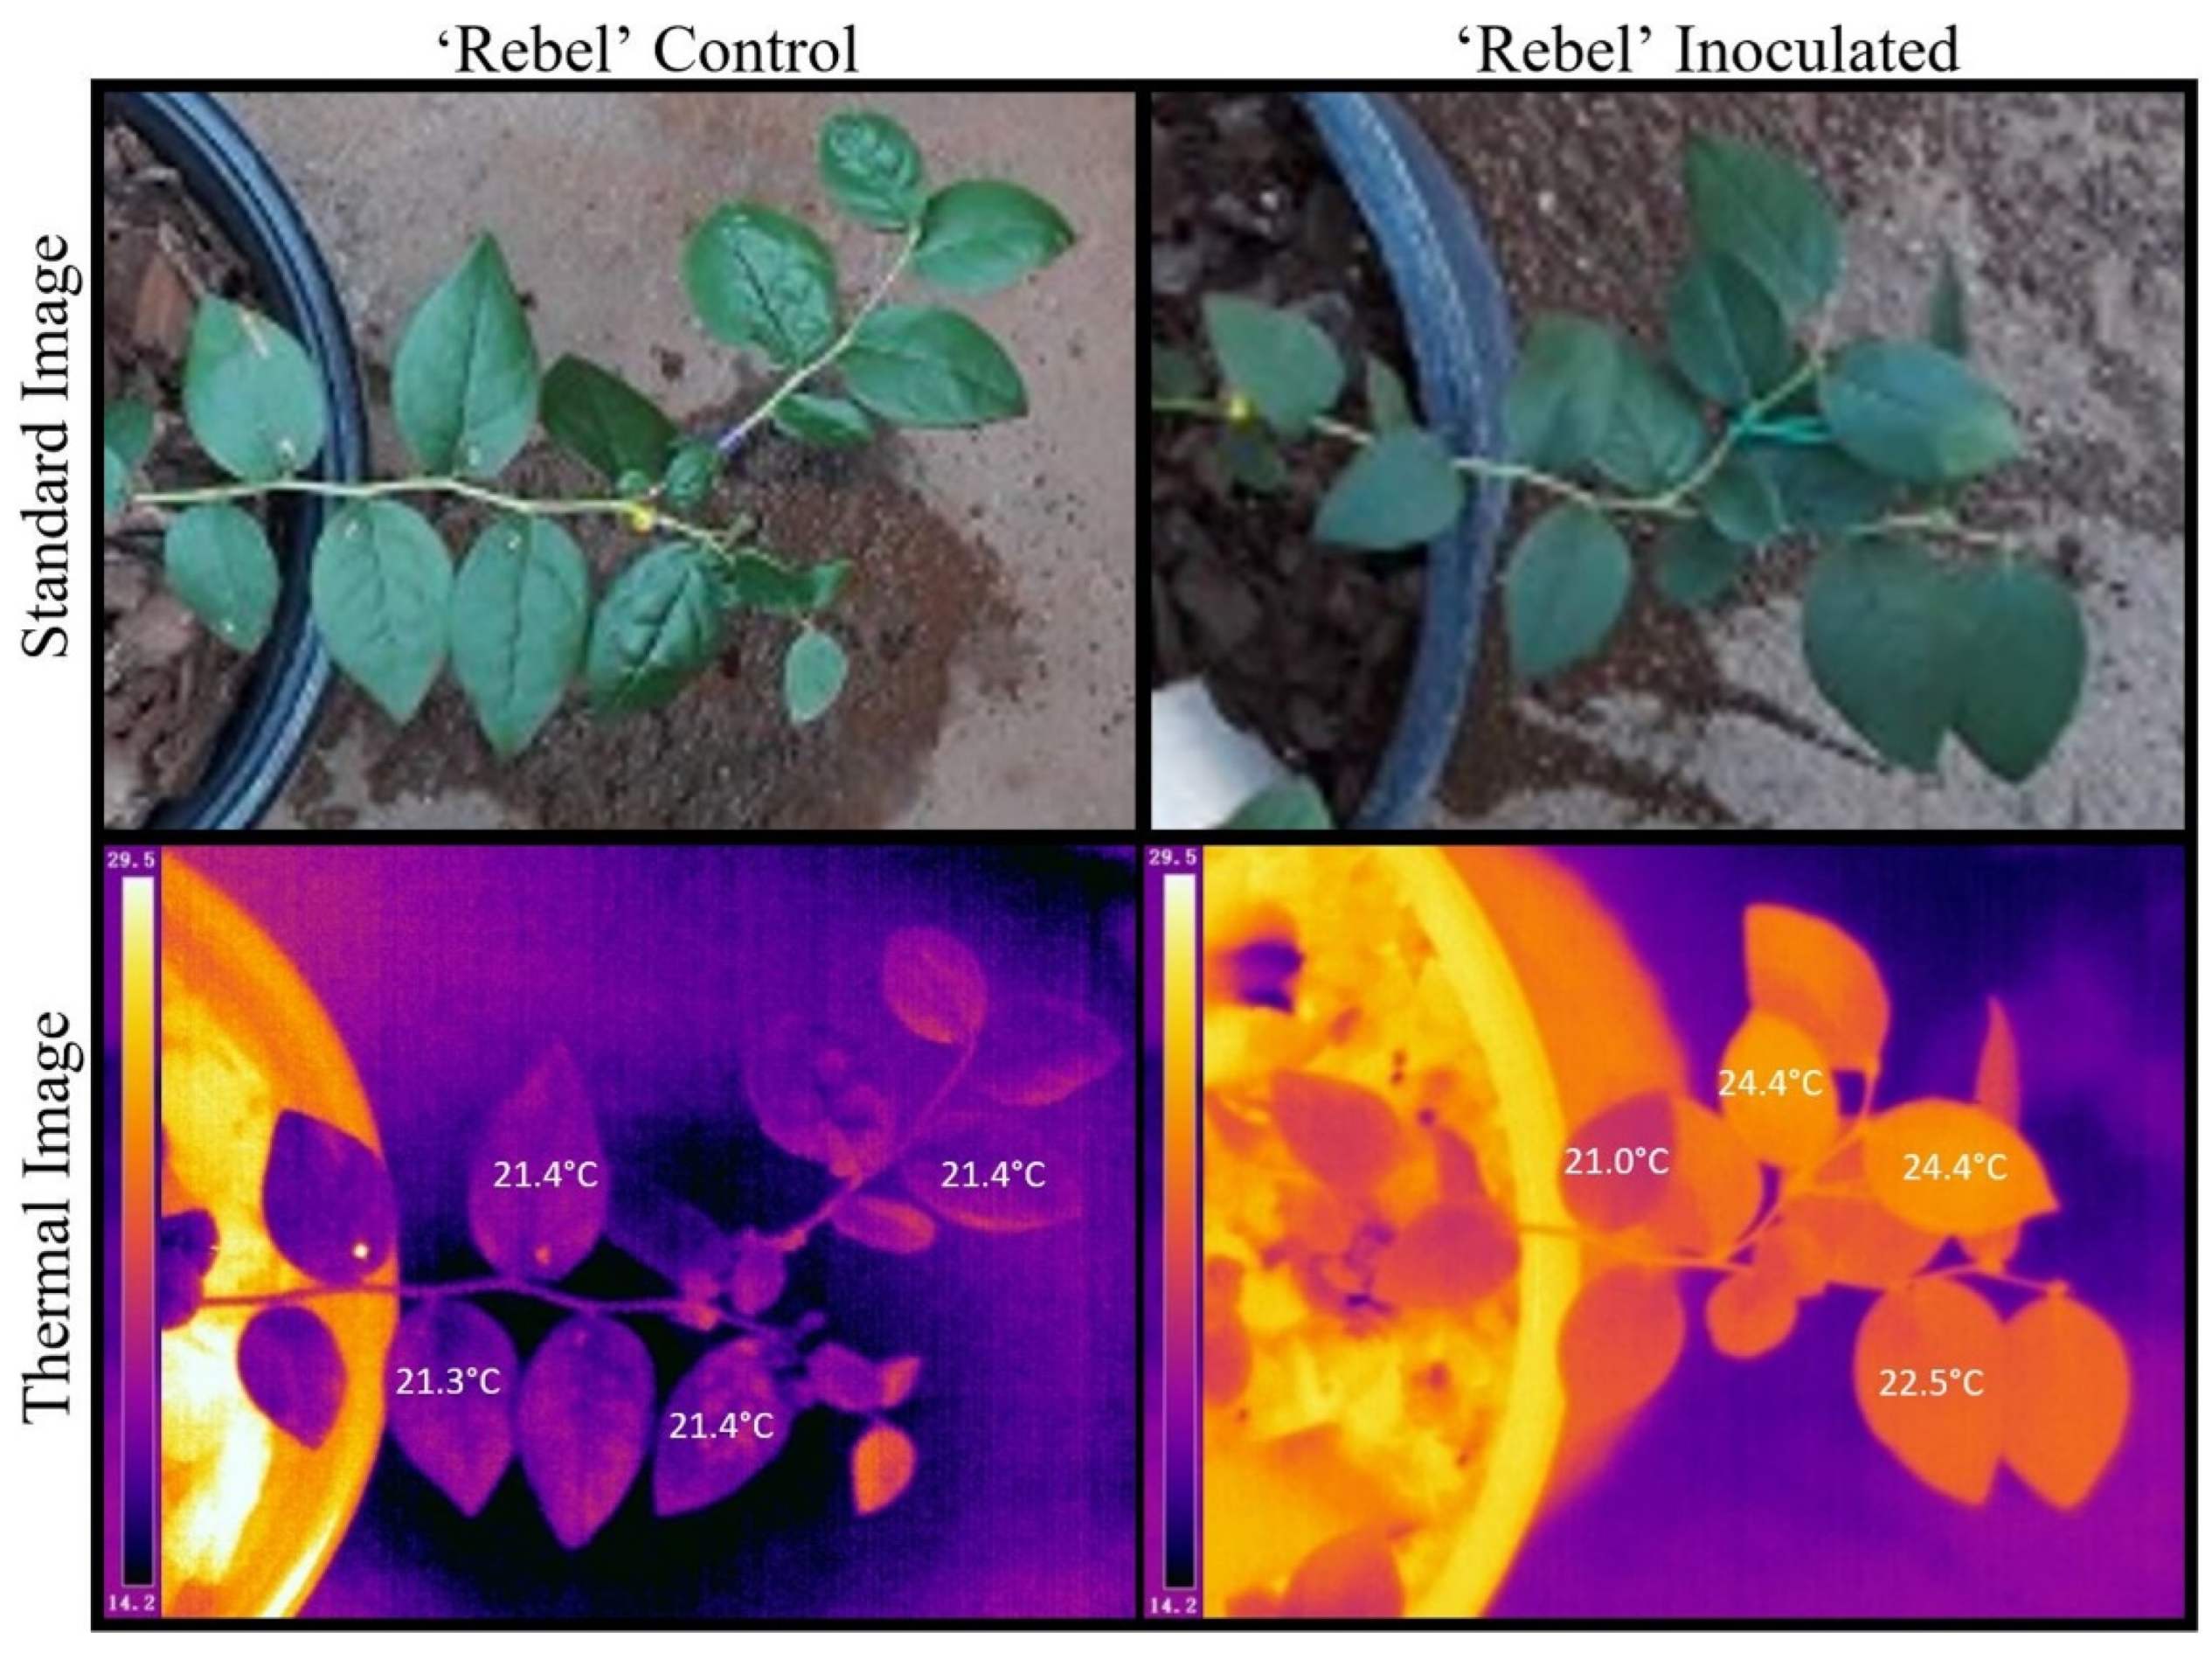
2.1. Traditional and Thermal Tracking of Disease Symptoms and Progression
2.2. Leaf Temperature Readings with Disease Severity Progression
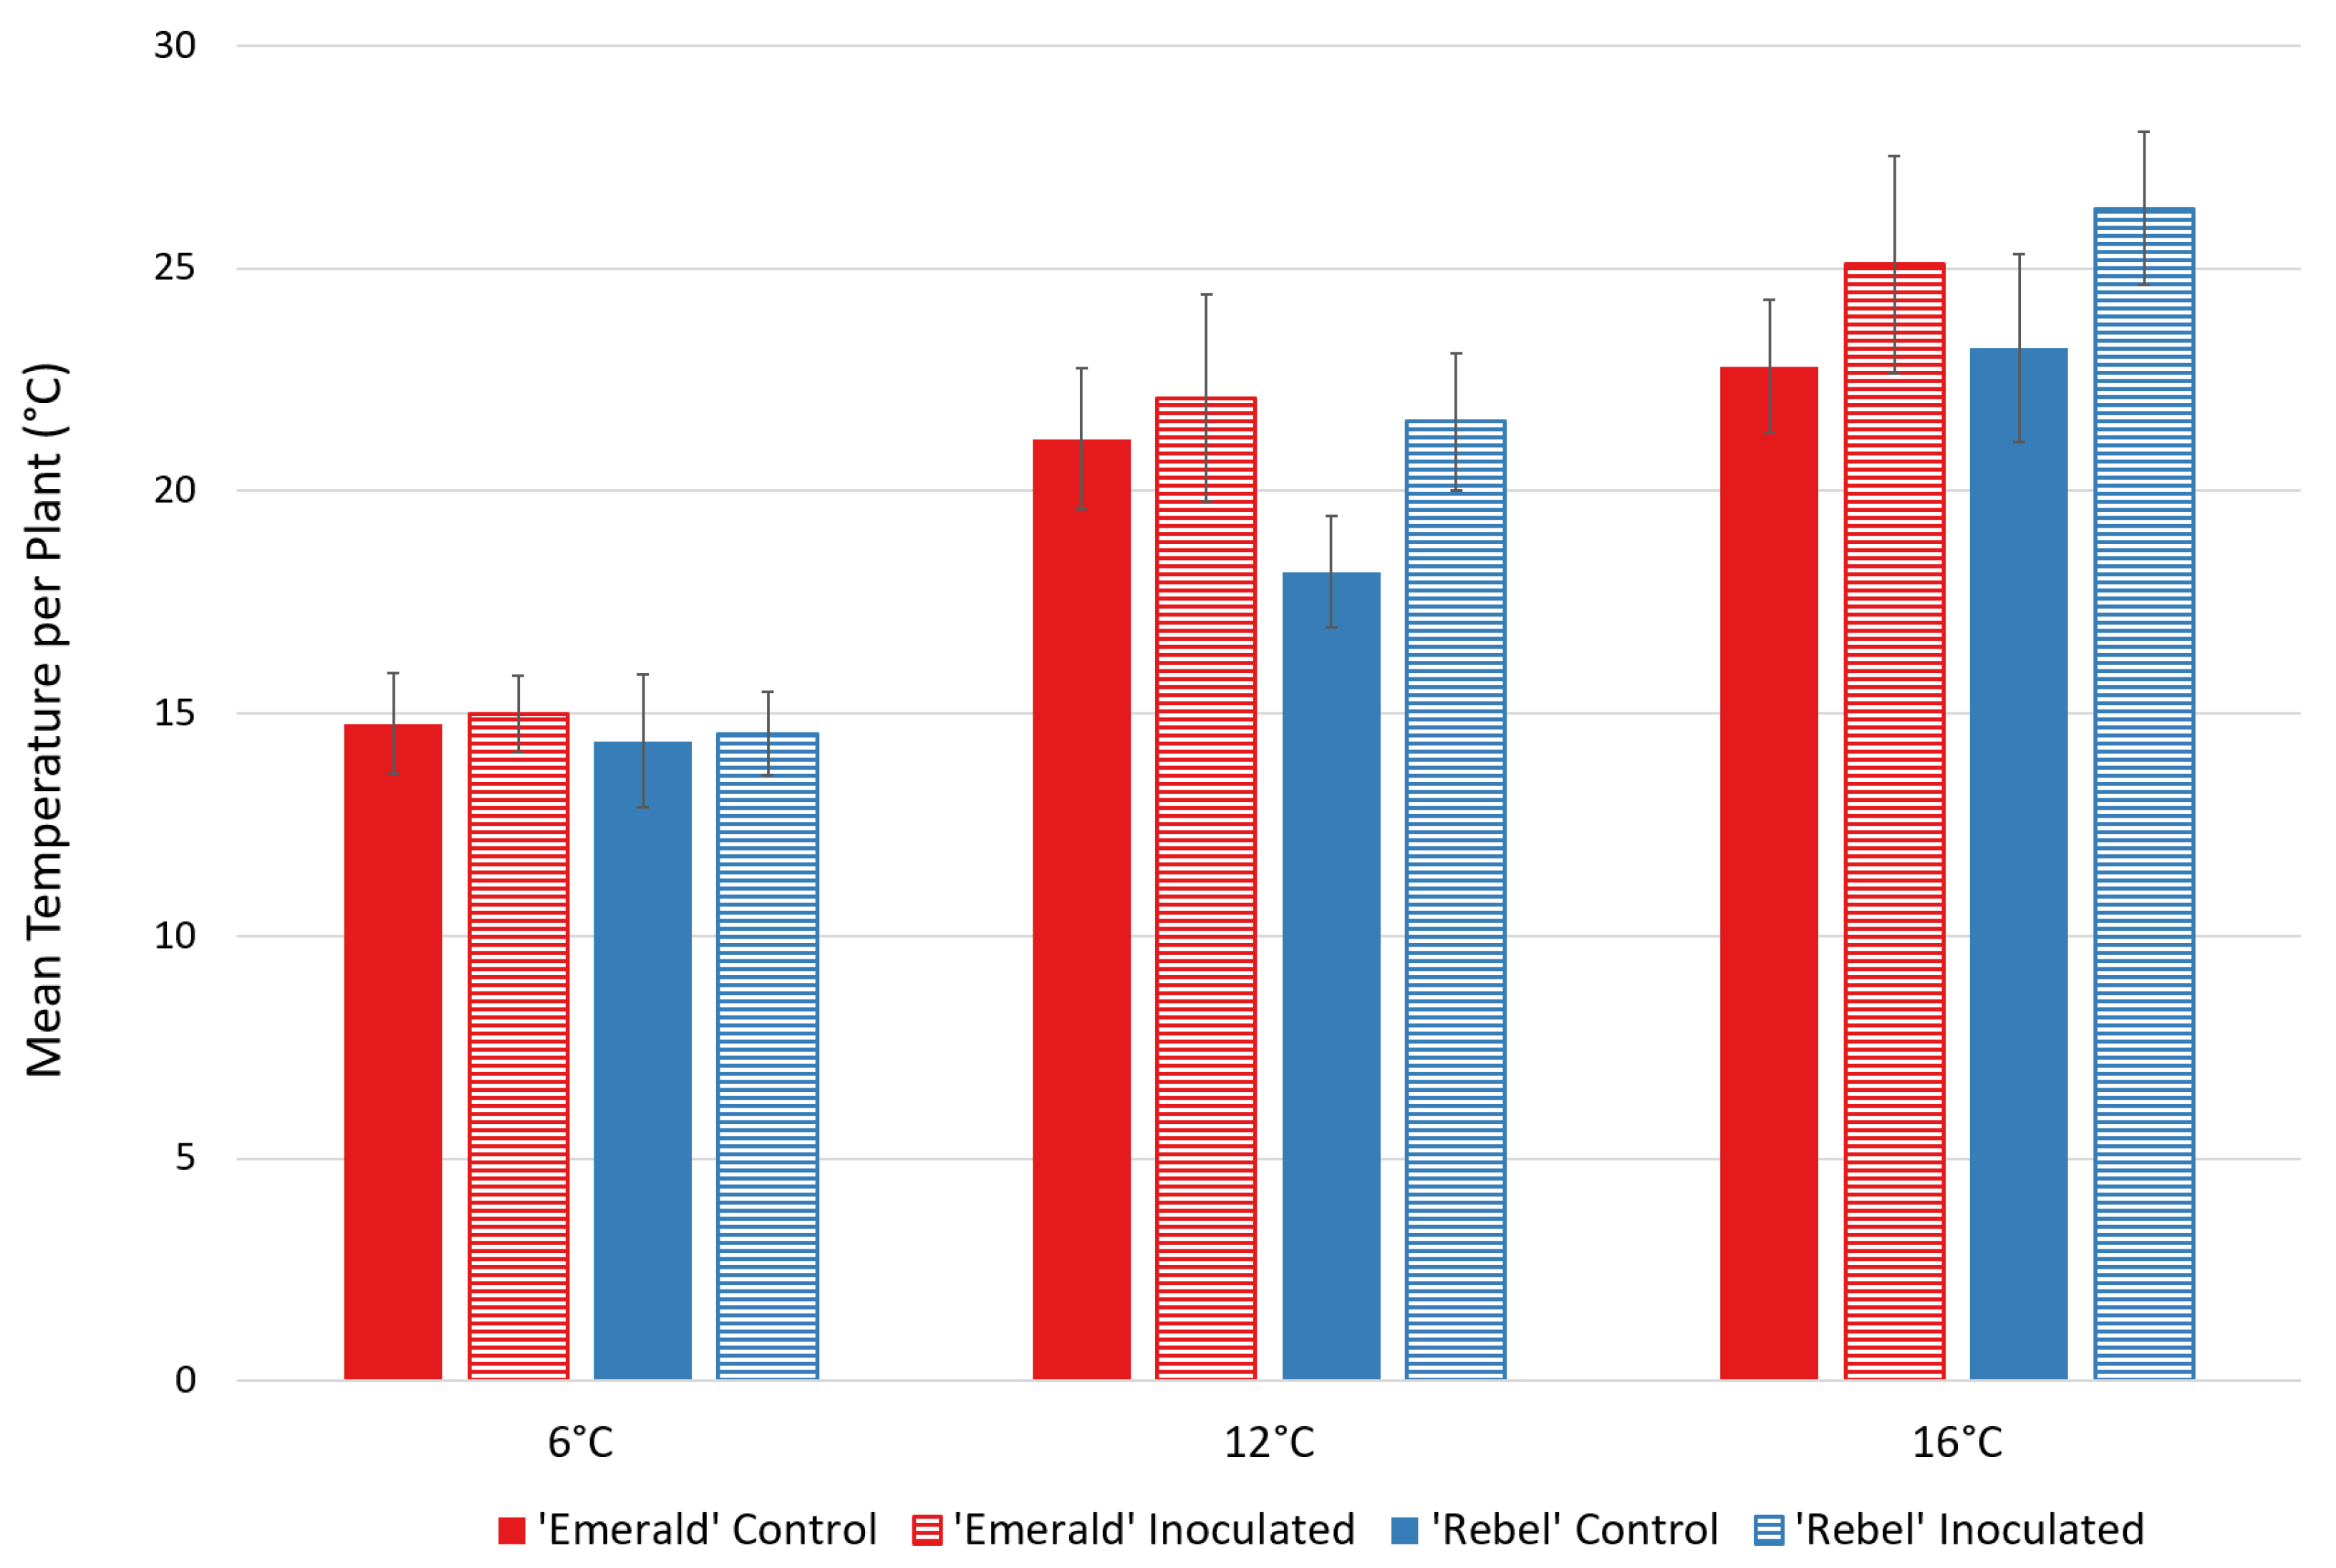
2.3. Thermal Disease Detection at Different Ambient Temperatures
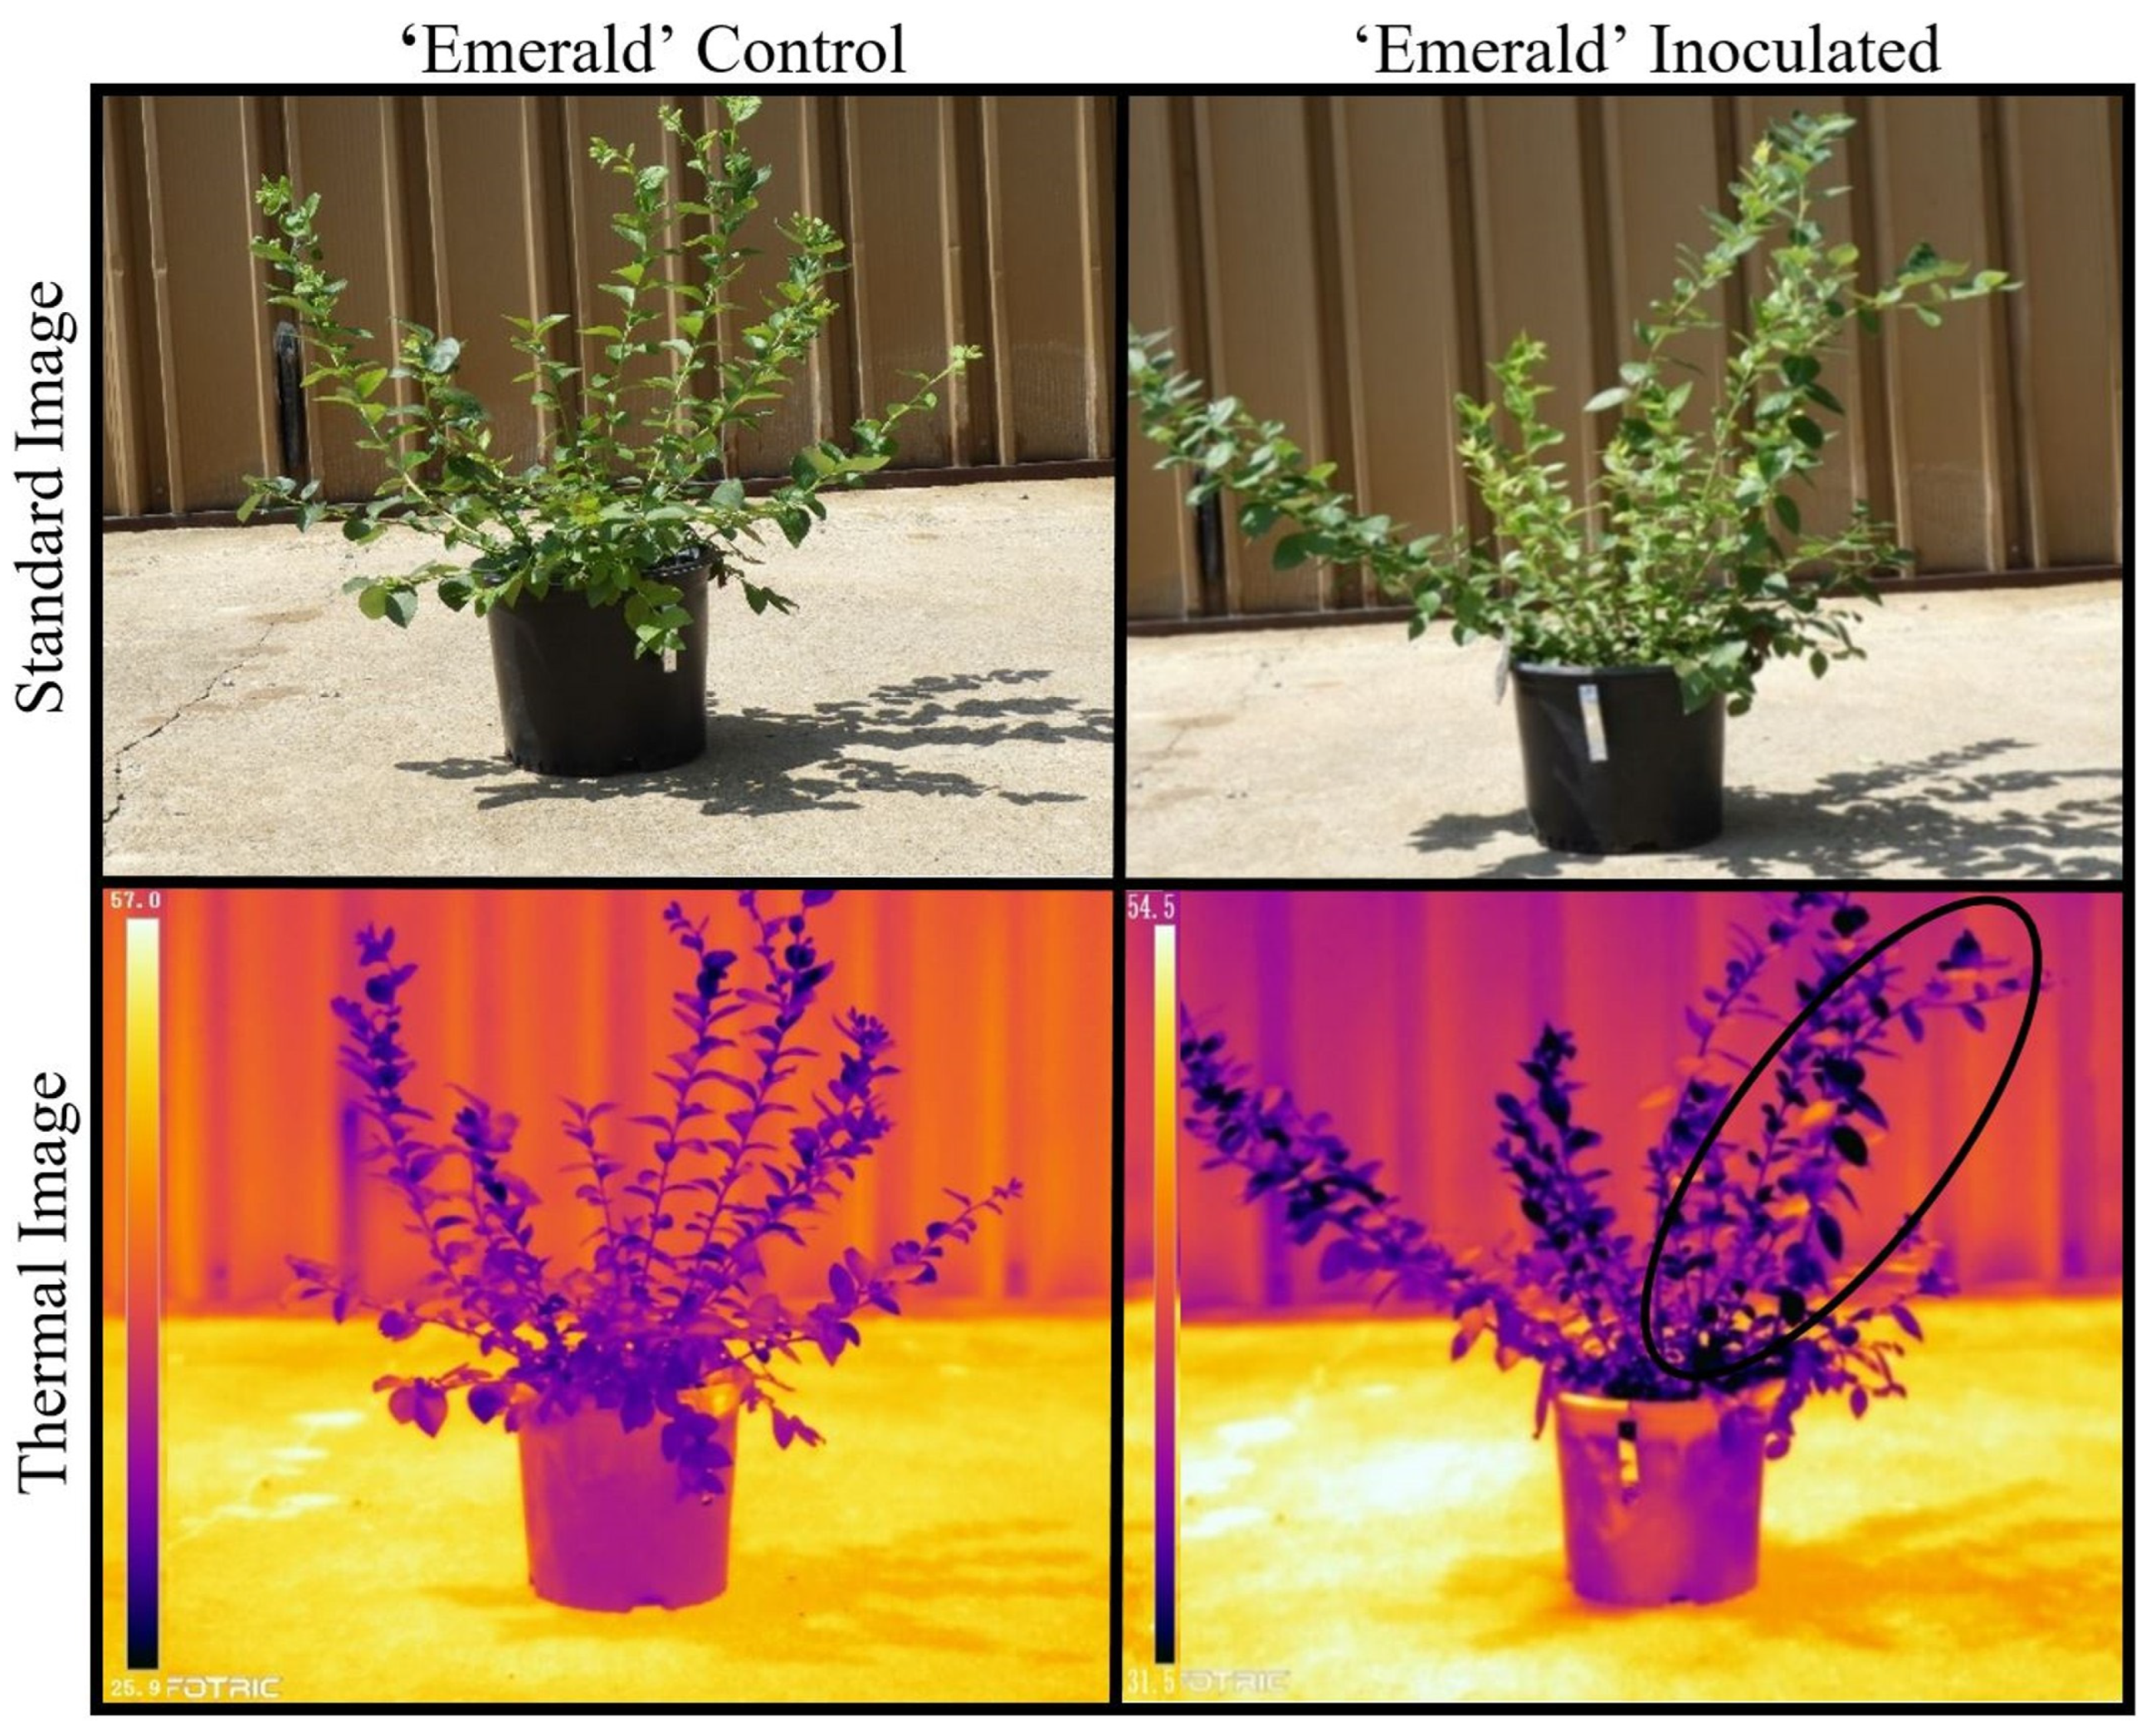
2.4. Whole Plant Temperature Distribution in Control and Xfm AR3 Inoculated Plants
2.5. Polymerase Chain Reaction (PCR)
3. Discussion
4. Materials and Methods
4.1. Experimental Design and Xylella fastidiosa Inoculation
4.2. Thermal Imaging Device
4.3. Traditional and Thermal Tracking of Disease Symptoms and Progression
4.4. Leaf Temperature Readings across Disease Severity Progression
4.5. Thermal Symptom Threshold Detection over a Range of Ambient Temperatures
4.6. Whole Plant Temperature Distribution of Aged Control and Xfm AR3 Inoculated Plants
4.7. Xfm AR3 Infection Verification through Genotyping
5. Conclusions
Author Contributions
Funding
Data Availability Statement
Acknowledgments
Conflicts of Interest
References
- Deom, C.M.; Brewer, M.T.; Severns, P.M. Positive selection and intrinsic disorder are associated with multifunctional C4 (AC4) proteins and geminivirus diversification. Sci. Rep. 2021, 11, 11150. [Google Scholar] [CrossRef]
- Bollmann-Giolai, A.; Malone, J.G.; Arora, S. Diversity, detection and exploitation: Linking soil fungi and plant disease. Curr. Opin. Microbiol. 2022, 70, 102199. [Google Scholar] [CrossRef]
- Gibbs, J.N. Intercontinental epidemiology of Dutch elm disease. Annu. Rev. Phytopathol. 1978, 16, 287–307. [Google Scholar] [CrossRef]
- Hansen, E.M.; Stone, J.K.; Capitano, B.R.; Rosso, P.; Sutton, W.; Winton, L.; Kanaskie, A.; McWilliams, M.G. Incidence and impact of Swiss needle cast in forest plantations of Douglas-fir in coastal Oregon. Plant Dis. 2000, 84, 773–778. [Google Scholar] [CrossRef]
- Rizzo, D.M.; Garbelotto, M. Sudden oak death: Endangering California and Oregon forest ecosystems. Front. Ecol. Environ. 2003, 1, 197–204. [Google Scholar] [CrossRef]
- Ray, C.; Rochefort, R.M.; Ransom, J.I.; Nesmith, J.C.; Haultain, S.A.; Schaming, T.D.; Boetsch, J.R.; Holmgren, M.L.; Wilkerson, R.L.; Siegel, R.B. Assessing trends and vulnerabilities in the mutualism between whitebark pine (Pinus albicaulis) and Clark’s nutcracker (Nucifraga columbiana) in national parks of the Sierra-Cascade region. PLoS ONE 2020, 15, e0227161. [Google Scholar] [CrossRef]
- Severns, P.M.; Guzman-Martinez, M. Plant pathogen invasion modifies the eco-evolutionary host plant interactions of an endangered checkerspot butterfly. Insects 2021, 12, 246. [Google Scholar] [CrossRef]
- Keeling, M.J.; Woolhouse, M.E.J.; May, R.M.; Davies, G.; Grenfell, B.T. Modelling vaccination strategies against foot-and-mouth disease. Nature 2003, 421, 136–142. [Google Scholar] [CrossRef]
- Filipe, J.A.; Cobb, R.C.; Meentemeyer, R.K.; Lee, C.A.; Valachovic, Y.S.; Cook, A.R.; Rizzo, D.M.; Gilligan, C.A. Landscape epidemiology and control of pathogens with cryptic and long-distance dispersal: Sudden oak death in northern Californian forests. PLoS Comput. Biol. 2012, 8, e1002328. [Google Scholar] [CrossRef]
- Di Lauro, F.; Kiss, I.Z.; Miller, J.C. Optimal timing of one-shot interventions for epidemic control. PLoS Comput. Biol. 2021, 17, e1008763. [Google Scholar] [CrossRef]
- Severns, P.M.; Mundt, C.C. Delays in Epidemic Outbreak Control Cost Disproportionately Large Treatment Footprints to Offset. Pathogens 2022, 11, 393. [Google Scholar] [CrossRef]
- Lucas, J.A.; Hawkins, N.J.; Fraaije, B.A. The evolution of fungicide resistance. Adv. Appl. Microbiol. 2015, 90, 29–92. [Google Scholar]
- Sykes, E.M.; Sackett, K.E.; Severns, P.M.; Mundt, C.C. Sensitivity variation and cross-resistance of Zymoseptoria tritici to azole fungicides in North America. Eur. J. Plant Pathol. 2018, 151, 269–274. [Google Scholar] [CrossRef]
- Ives, A.R.; Andow, D.A. Evolution of resistance to Bt crops: Directional selection in structured environments. Ecol. Lett. 2002, 5, 792–801. [Google Scholar] [CrossRef]
- Délye, C.; Jasieniuk, M.; Le Corre, V. Deciphering the evolution of herbicide resistance in weeds. Trends Genet. 2013, 29, 649–658. [Google Scholar] [CrossRef]
- Lupo, A.; Coyne, S.; Berendonk, T.U. Origin and evolution of antibiotic resistance: The common mechanisms of emergence and spread in water bodies. Front. Microbiol. 2012, 3, 18. [Google Scholar] [CrossRef]
- Stanton, I.C.; Murray, A.K.; Zhang, L.; Snape, J.; Gaze, W.H. Evolution of antibiotic resistance at low antibiotic concentrations including selection below the minimal selective concentration. Commun. Biol. 2020, 3, 467. [Google Scholar] [CrossRef]
- Agrios, G.N. Plant Pathol, 5th ed.; Elsevier: Gainseville, FL, USA, 2004; p. 952. [Google Scholar]
- Peterson, E.K.; Hansen, E.M.; Kanaskie, A. Temporal epidemiology of sudden oak death in Oregon. Phytopathology 2015, 105, 937–946. [Google Scholar] [CrossRef]
- Hyatt-Twynam, S.R.; Parnell, S.; Stutt, R.O.; Gottwald, T.R.; Gilligan, C.A.; Cunniffe, N.J. Risk-based management of invading plant disease. New Phytol. 2017, 214, 1317–1329. [Google Scholar] [CrossRef]
- Hill, B.L.; Purcell, A.H. Acquisition and retention of Xylella fastidiosa by an efficient vector, Graphocephala atropunctata. Phytopathology 1995, 85, 209–212. [Google Scholar] [CrossRef]
- Redak, R.A.; Purcell, A.H.; Lopes, J.R.; Blua, M.J.; Mizell Iii, R.F.; Andersen, P.C. The biology of xylem fluid–feeding insect vectors of Xylella fastidiosa and their relation to disease epidemiology. Annu. Rev. Entomol. 2004, 49, 243–270. [Google Scholar] [CrossRef] [PubMed]
- Elbeaino, T.; Yaseen, T.; Valentini, F.; Moussa, I.E.B.; Mazzoni, V.; D’Onghia, A.M. Identification of three potential insect vectors of Xylella fastidiosa in southern Italy. Phytopathol. Mediterr. 2014, 53, 328–332. [Google Scholar]
- Krugner, R.; Ledbetter, C.A.; Chen, J.; Shrestha, A.N.I.L. Phenology of Xylella fastidiosa and its vector around California almond nurseries: An assessment of plant vulnerability to almond leaf scorch disease. Plant Dis. 2012, 96, 1488–1494. [Google Scholar] [CrossRef] [PubMed]
- Cunty, A.; Legendre, B.; de Jerphanion, P.; Juteau, V.; Forveille, A.; Germain, J.F.; Ramel, J.M.; Reynaud, P.; Olivier, V.; Poliakoff, F. Xylella fastidiosa subspecies and sequence types detected in Philaenus spumarius and in infected plants in France share the same locations. Plant Pathol. 2020, 69, 1798–1811. [Google Scholar] [CrossRef]
- Baldi, P.; La Porta, N. Xylella fastidiosa: Host Range and Advance in Molecular Identification Techniques. Front. Plant Sci. 2017, 8, 1–22. [Google Scholar] [CrossRef]
- Almeida, R.P.; Nunney, L. How do plant diseases caused by Xylella fastidiosa emerge? Plant Dis. 2015, 99, 1457–1467. [Google Scholar] [CrossRef]
- Occhibove, F.; Chapman, D.S.; Mastin, A.J.; Parnell, S.S.; Agstner, B.; Mato-Amboage, R.; Jones, G.; Dunn, M.; Pollard, R.J.; Robinson, J.S.; et al. Eco-epidemiological uncertainties of emerging plant diseases: The challenge of predicting Xylella fastidiosa dynamics in novel environments. Phytopathology 2020, 110, 1740–1750. [Google Scholar] [CrossRef]
- Brannen, P.M.; Scherm, H.; Chang, C.J. Survey of cultivar differences in bacterial leaf scorch incidence among southern highbush blueberries. Dixie Blueberry News 2008, 8, 6–7. [Google Scholar]
- Di Genova, D.; Lewis, K.J.; Oliver, J.E. Natural infection of southern highbush blueberry (Vaccinium corymbosum Interspecific Hybrids) by Xylella fastidiosa subsp. fastidiosa. Plant Dis. 2020, 104, 2598–2605. [Google Scholar] [CrossRef]
- Saponari, M.; Boscia, D.; Altamura, G.; Loconsole, G.; Zicca, S.; D’attoma, G.; Morelli, M.; Palmisano, F.; Saponari, A.; Tavano, D.; et al. Isolation and pathogenicity of Xylella fastidiosa associated to the olive quick decline syndrome in southern Italy. Sci. Rep. 2017, 7, 17723. [Google Scholar] [CrossRef]
- Kyrkou, I.; Pusa, T.; Ellegaard-Jensen, L.; Sagot, M.F.; Hansen, L.H. Pierce’s disease of grapevines: A review of control strategies and an outline of an epidemiological model. Front. Microbiol. 2018, 9, 2141. [Google Scholar] [CrossRef] [PubMed]
- Di Genova, D. Characterizing Xylella fastidiosa, It’s Genetic Diversity and Virulence in Southern Highbush Blueberries. Master’s Thesis, University of Georgia, Athens, GA, USA, 2019. [Google Scholar]
- Alves, E.; Marucci, C.R.; Lopes, J.R.S.; Leite, B. Leaf symptoms on plum, coffee and citrus and the relationship with the extent of xylem vessels colonized by Xylella fastidiosa. J. Phytopathol. 2004, 152, 291–297. [Google Scholar] [CrossRef]
- Meng, Y.; Li, Y.; Galvani, C.D.; Hao, G.; Turner, J.N.; Burr, T.J.; Hoch, H.C. Upstream migration of Xylella fastidiosa via pilus-driven twitching motility. J. Bacteriol. 2005, 187, 5560–5567. [Google Scholar] [CrossRef] [PubMed]
- Oliver, J.E.; Cobine, P.A.; De La Fuente, L. Xylella fastidiosa isolates from both subsp. multiplex and fastidiosa cause disease on southern highbush blueberry (Vaccinium sp.) under greenhouse conditions. Phytopathology 2015, 105, 855–862. [Google Scholar]
- Chen, C.; Bock, C.H.; Brannen, P.M. Novel primers and sampling for PCR detection of Xylella fastidiosa in Peach. Phytopathology 2019, 109, 307–317. [Google Scholar] [CrossRef]
- Camino, C.; Araño, K.; Berni, J.A.; Dierkes, H.; Trapero-Casas, J.L.; León-Ropero, G.; Montes-Borrego, M.; Roman-Écija, M.; Velasco-Amo, M.P.; Landa, B.B.; et al. Detecting Xylella fastidiosa in a machine learning framework using Vcmax and leaf biochemistry quantified with airborne hyperspectral imagery. Remote Sens. Environ. 2022, 282, 113281. [Google Scholar]
- Harris, J.L.; Di Bello, P.L.; Lear, M.; Balci, Y. Bacterial leaf scorch in the District of Columbia: Distribution, host range, and presence of Xylella fastidiosa among urban trees. Plant Dis. 2014, 98, 1611–1618. [Google Scholar] [CrossRef]
- Krivanek, A.F.; Stevenson, J.F.; Walker, M.A. Development and comparison of symptom indices for quantifying grapevine resistance to Pierce’s disease. Phytopathology 2005, 95, 36–43. [Google Scholar] [CrossRef]
- Ingel, B.; Reyes, C.; Massonnet, M.; Boudreau, B.; Sun, Y.; Sun, Q.; McElrone, A.J.; Cantu, D.; Roper, M.C. Xylella fastidiosa causes transcriptional shifts that precede tylose formation and starch depletion in xylem. Mol. Plant Pathol. 2021, 22, 175–188. [Google Scholar] [CrossRef]
- Campanharo, J.C.; Lemos, M.V.F.; de Macedo Lemos, E.G. Growth optimization procedures for the phytopathogen Xylella fastidiosa. Curr. Microbiol. 2003, 46, 99–102. [Google Scholar] [CrossRef]
- Bextine, B.; Tuan, S.J.; Shaikh, H.; Blua, M.; Miller, T.A. Evaluation of methods for extracting Xylella fastidiosa DNA from the glassy-winged sharpshooter. J. Econ. Entomol. 2004, 97, 757–763. [Google Scholar] [CrossRef] [PubMed]
- Waliullah, S.; Hudson, O.; Oliver, J.E.; Brannen, P.M.; Ji, P.; Ali, M.E. Comparative analysis of different molecular and serological methods for detection of Xylella fastidiosa in blueberry. PLoS ONE. 2019, 14, e0221903. [Google Scholar] [CrossRef] [PubMed]
- Castro, C.; DiSalvo, B.; Roper, M.C. Xylella fastidiosa: A reemerging plant pathogen that threatens crops globally. PloS Pathog. 2021, 17, e1009813. [Google Scholar] [CrossRef] [PubMed]
- Minsavage, G.V.; Thompson, C.M.; Hopkins, D.L.; Leite, R.M.V.B.C.; Stall, R.E. Development of a polymerase chain reaction protocol for detection of Xylella fastidiosa in plant tissue. Phytopathology 1994, 84, 456–461. [Google Scholar] [CrossRef]
- Davis, M.J.; French, W.J.; Schaad, N.W. Axenic culture of the bacteria associated with Phony Disease of Peach and Plum Leaf Scald. Curr. Microbiol. 1981, 6, 309–314. [Google Scholar] [CrossRef]
- Fotric 228GRD. Available online: https://www.fotric.com/product-page/fotric-228GRD (accessed on 11 February 2021).

| n = No. Leaves/Plant | Min (°C) | Max (°C) | Mean (°C) | Median (°C) | sd | |
|---|---|---|---|---|---|---|
| 14 DPI | ||||||
| ‘Emerald’ | ||||||
| Control | 10 | 27.0 | 32.7 | 29.1 ± 0.59 | 28.7 (27.9,29.4) | 1.87 |
| Inoculated | 10 | 23.9 | 37.3 | 28.0 ± 1.23 | 27.0 (25.5,29.5) | 3.90 |
| ‘Rebel’ | ||||||
| Control | 10 | 24.9 | 29.8 | 27.2 ± 0.59 | 26.8 (25.6,28.6) | 1.88 |
| Inoculated | 10 | 24.4 | 30.4 | 27.5 ± 0.71 | 27.4 (25.6,29.2) | 2.25 |
| 34 DPI | ||||||
| ‘Emerald’ | ||||||
| Control | 10 | 27.2 | 28.6 | 27.9 ± 0.15 | 27.8 (27.5,28.2) | 0.47 |
| Inoculated | 10 | 26.3 | 29.9 | 27.5 ± 0.31 | 27.3 (27.0,27.6) | 0.99 |
| ‘Rebel’ | ||||||
| Control | 10 | 25.6 | 29.7 | 25.8 ± 0.75 | 26.0 (23.8,26.8) | 2.36 |
| Inoculated | 10 | 28.5 | 32.1 | 30.3 ± 0.37 | 30.2 (29.5,31.0) | 1.16 |
| 54 DPI | ||||||
| ‘Emerald’ | ||||||
| Control | 10 | 27.2 | 31.0 | 28.8 ± 0.36 | 28.5 (28.1,29.4) | 1.15 |
| Inoculated | 10 | 27.4 | 33.8 | 30.3 ± 0.64 | 30.4 (29.1,31.6) | 2.03 |
| ‘Rebel’ | ||||||
| Control | 10 | 21.6 | 26.7 | 24.5 ± 0.56 | 24.4 (23.5,26.1) | 1.76 |
| Inoculated | 10 | 26.7 | 33.6 | 29.8 ± 0.69 | 30.2 (28.1,30.9) | 2.17 |
| n = No. Leaves/Plant | Min (°C) | Max (°C) | Mean (°C) | Median (°C) | sd | |
|---|---|---|---|---|---|---|
| ‘Emerald’ | ||||||
| Control | 20 | 31.5 | 42.0 | 35.2 ± 0.71 | 34.6 (32.7,36.6) | 3.16 |
| Inoculated | 20 | 29.9 | 45.2 | 38.7 ± 1.01 | 37.6 (36.2,43.9) | 4.51 |
| ‘Rebel’ | ||||||
| Control | 20 | 33.0 | 42.9 | 37.3 ± 0.55 | 37.1 (35.5,38.5) | 2.46 |
| Inoculated | 20 | 35.0 | 46.2 | 39.5 ± 0.70 | 39.0 (36.8,41.6) | 3.15 |
| Severity Rating | Severity Definition | Visual References |
|---|---|---|
| 0 | No visible symptoms; green leaves only | 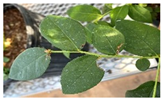 |
| 1 | One or two yellowing leaves between the leaf margin and the midrib | |
| 2 | One or two yellowing leaves with reddening areas | 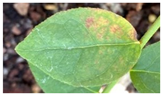 |
| 3 | >2 formerly yellowing leaves have begun to turn red, but <50% of the affected stem | |
| 4 | >2 yellow leaves have turned red with marginal necrotic areas on <50% of the affected stem | 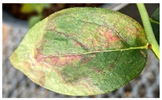 |
| 5 | >50% of leaves on the affected stem are partly yellow, with red interveinal areas and necrotic areas expanding | |
| 6 | >50% of leaves on the affected stem are red or brown with increased marginal necrosis | 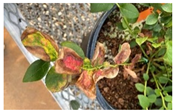 |
| 7 | All leaves of the affected stem have severe leaf scorching and necrosis |
Disclaimer/Publisher’s Note: The statements, opinions and data contained in all publications are solely those of the individual author(s) and contributor(s) and not of MDPI and/or the editor(s). MDPI and/or the editor(s) disclaim responsibility for any injury to people or property resulting from any ideas, methods, instructions or products referred to in the content. |
© 2023 by the authors. Licensee MDPI, Basel, Switzerland. This article is an open access article distributed under the terms and conditions of the Creative Commons Attribution (CC BY) license (https://creativecommons.org/licenses/by/4.0/).
Share and Cite
Guzman Martinez, M.; Oliver, J.E.; Severns, P.M. Evidence of Xylella fastidiosa Infection and Associated Thermal Signatures in Southern Highbush Blueberry (Vaccinium corymbosum Interspecific Hybrids). Plants 2023, 12, 3562. https://doi.org/10.3390/plants12203562
Guzman Martinez M, Oliver JE, Severns PM. Evidence of Xylella fastidiosa Infection and Associated Thermal Signatures in Southern Highbush Blueberry (Vaccinium corymbosum Interspecific Hybrids). Plants. 2023; 12(20):3562. https://doi.org/10.3390/plants12203562
Chicago/Turabian StyleGuzman Martinez, Melinda, Jonathan E. Oliver, and Paul M. Severns. 2023. "Evidence of Xylella fastidiosa Infection and Associated Thermal Signatures in Southern Highbush Blueberry (Vaccinium corymbosum Interspecific Hybrids)" Plants 12, no. 20: 3562. https://doi.org/10.3390/plants12203562
APA StyleGuzman Martinez, M., Oliver, J. E., & Severns, P. M. (2023). Evidence of Xylella fastidiosa Infection and Associated Thermal Signatures in Southern Highbush Blueberry (Vaccinium corymbosum Interspecific Hybrids). Plants, 12(20), 3562. https://doi.org/10.3390/plants12203562