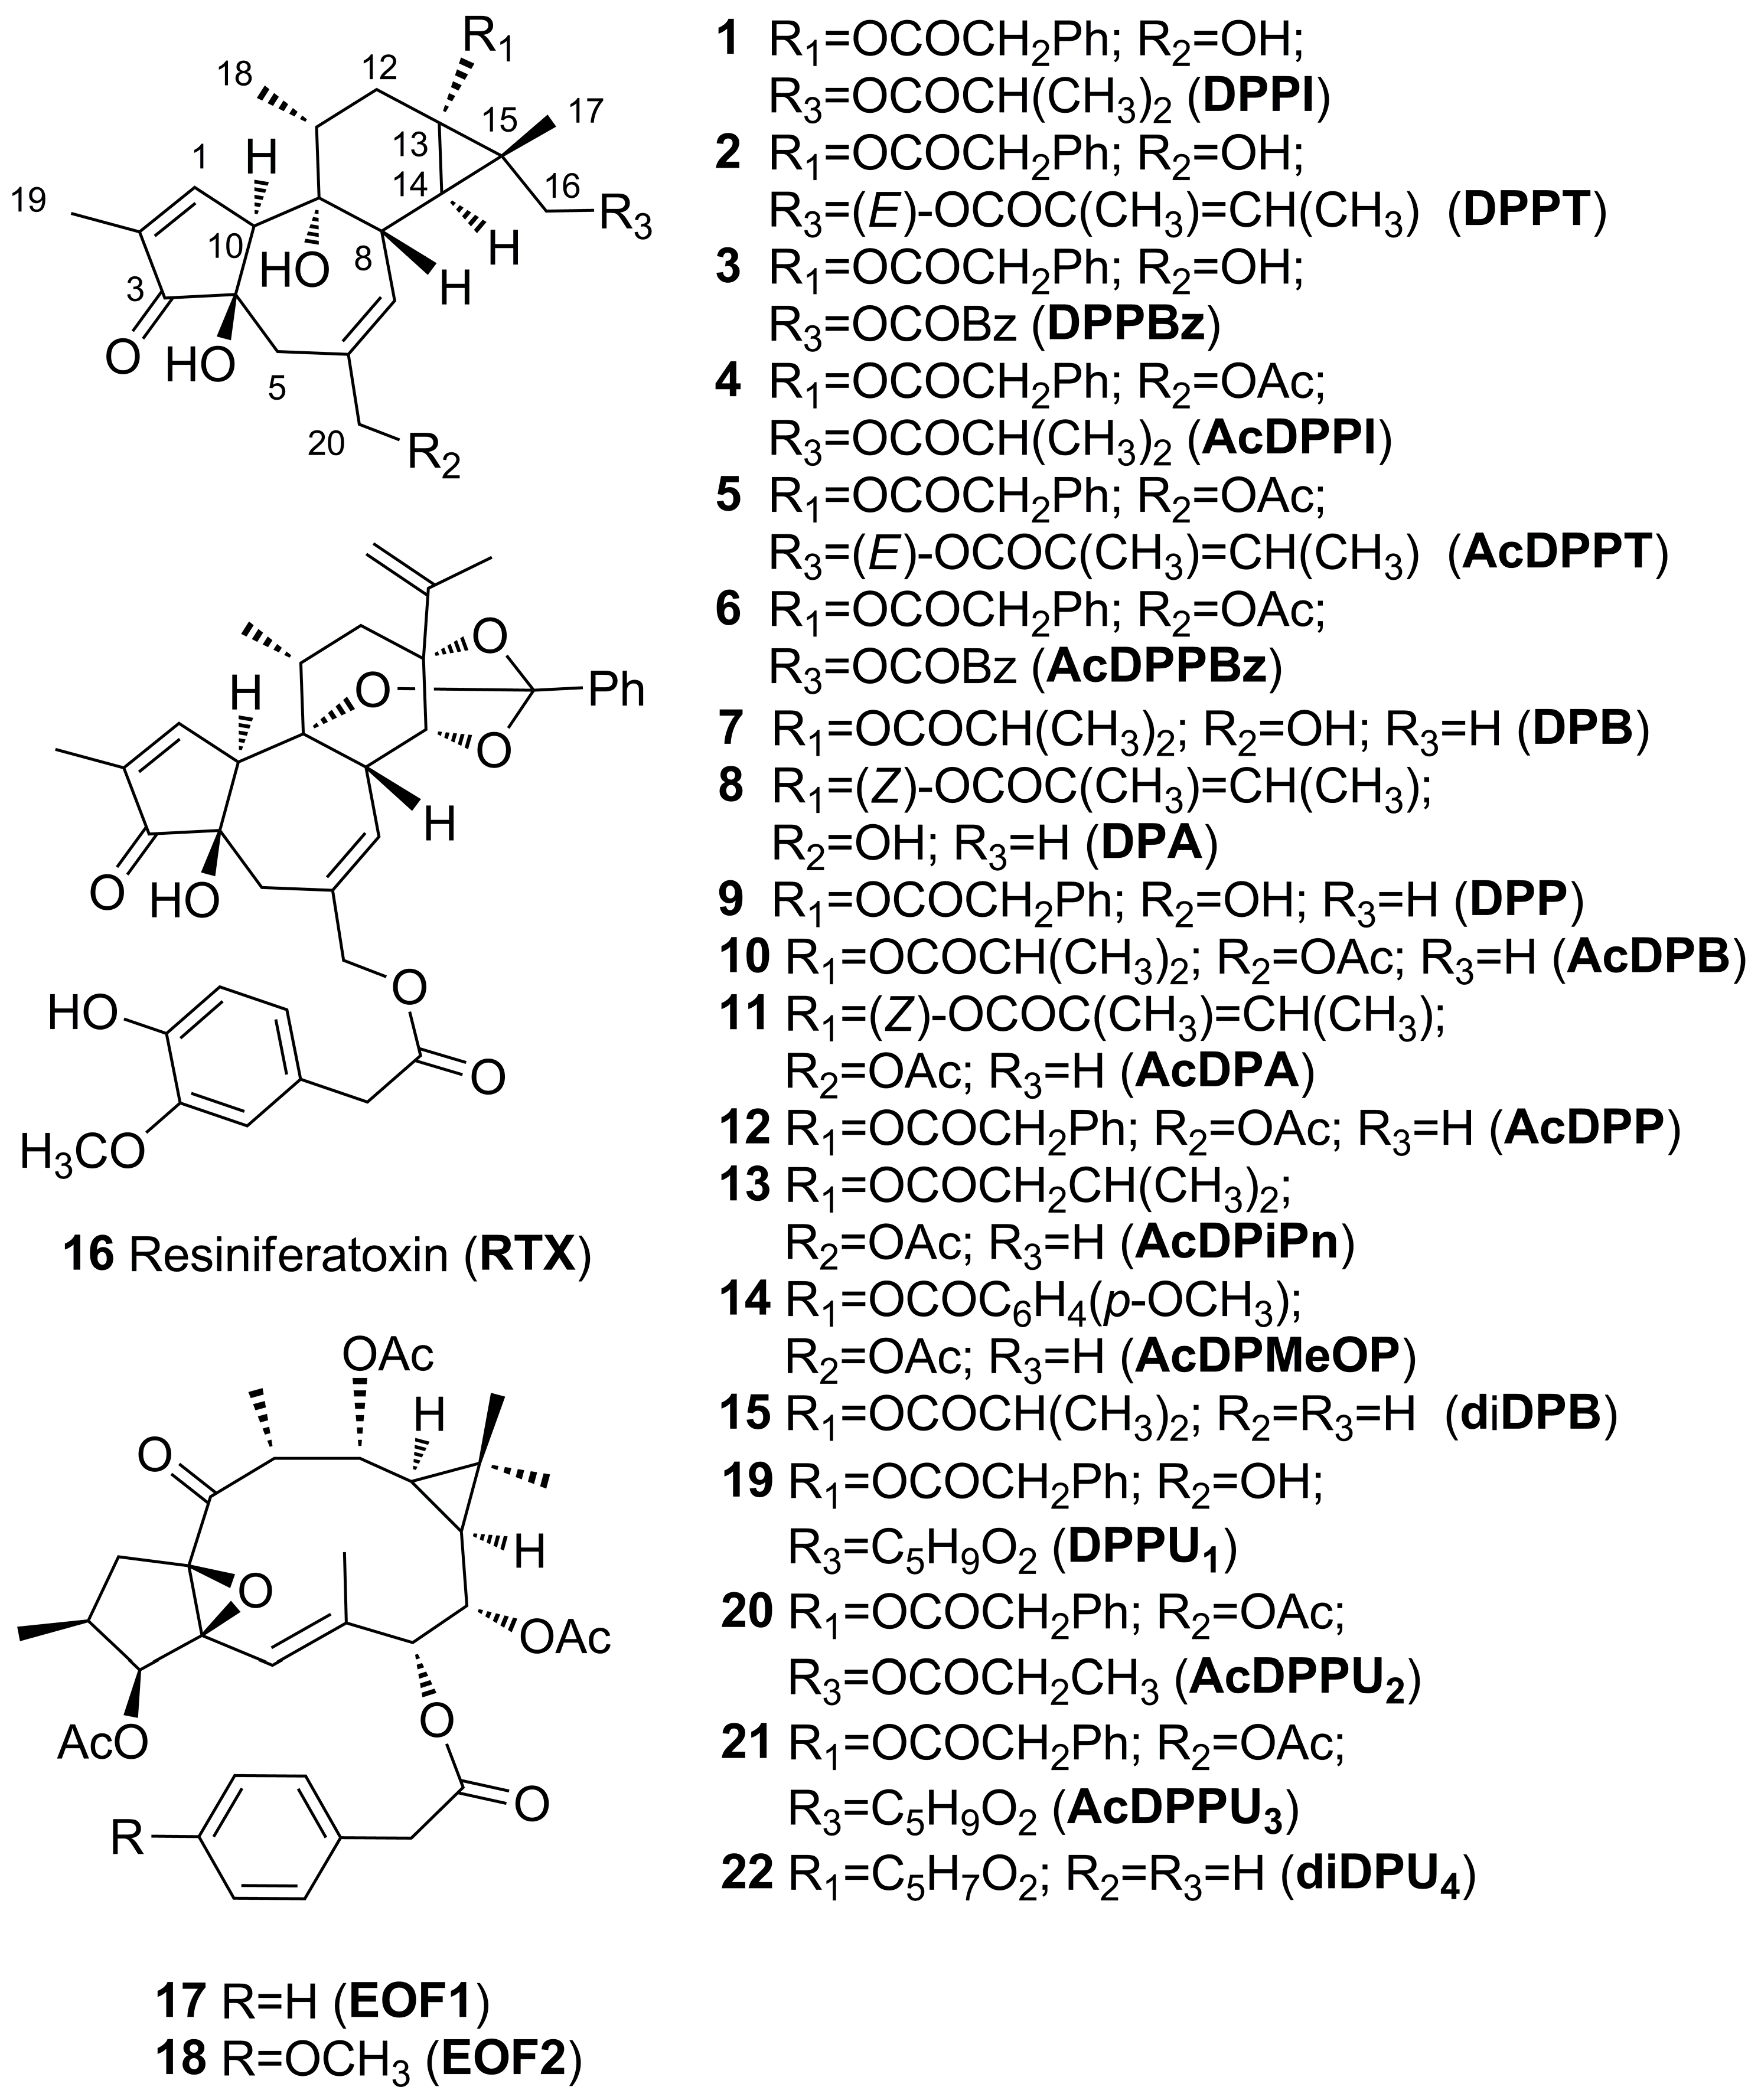
2.1. Structural Elucidation of Isolated Diterpenes
The maceration in ethyl acetate (EtOAc) of
E. resinifera Berg dried latex, evaporation of solvent from filtrate and trituration of the resulting solid residue with CH
3CN yielded an additional clear solution where most triterpenes have been removed. The evaporation of solvent (CH
3CN), column chromatography of the resulting crude mixture with increasing gradients of ethyl acetate in hexane and further purification of column chromatography fractions yielded compounds
1–
18 (
Figure 1).
The comparison of their spectroscopic and spectrometric data with those reported in the literature allowed for the identification of two known tetracyclic esters of 12-deoxy-16-hydroxyphorbol, 12-deoxy-16-hydroxyphorbol 16-isobutyrate-13-phenylacetate (DPPI (
1)) and 12-deoxy-16-hydroxy-phorbol 16-tigliate-13-phenylacetate (DPPT (
2)) [
8].
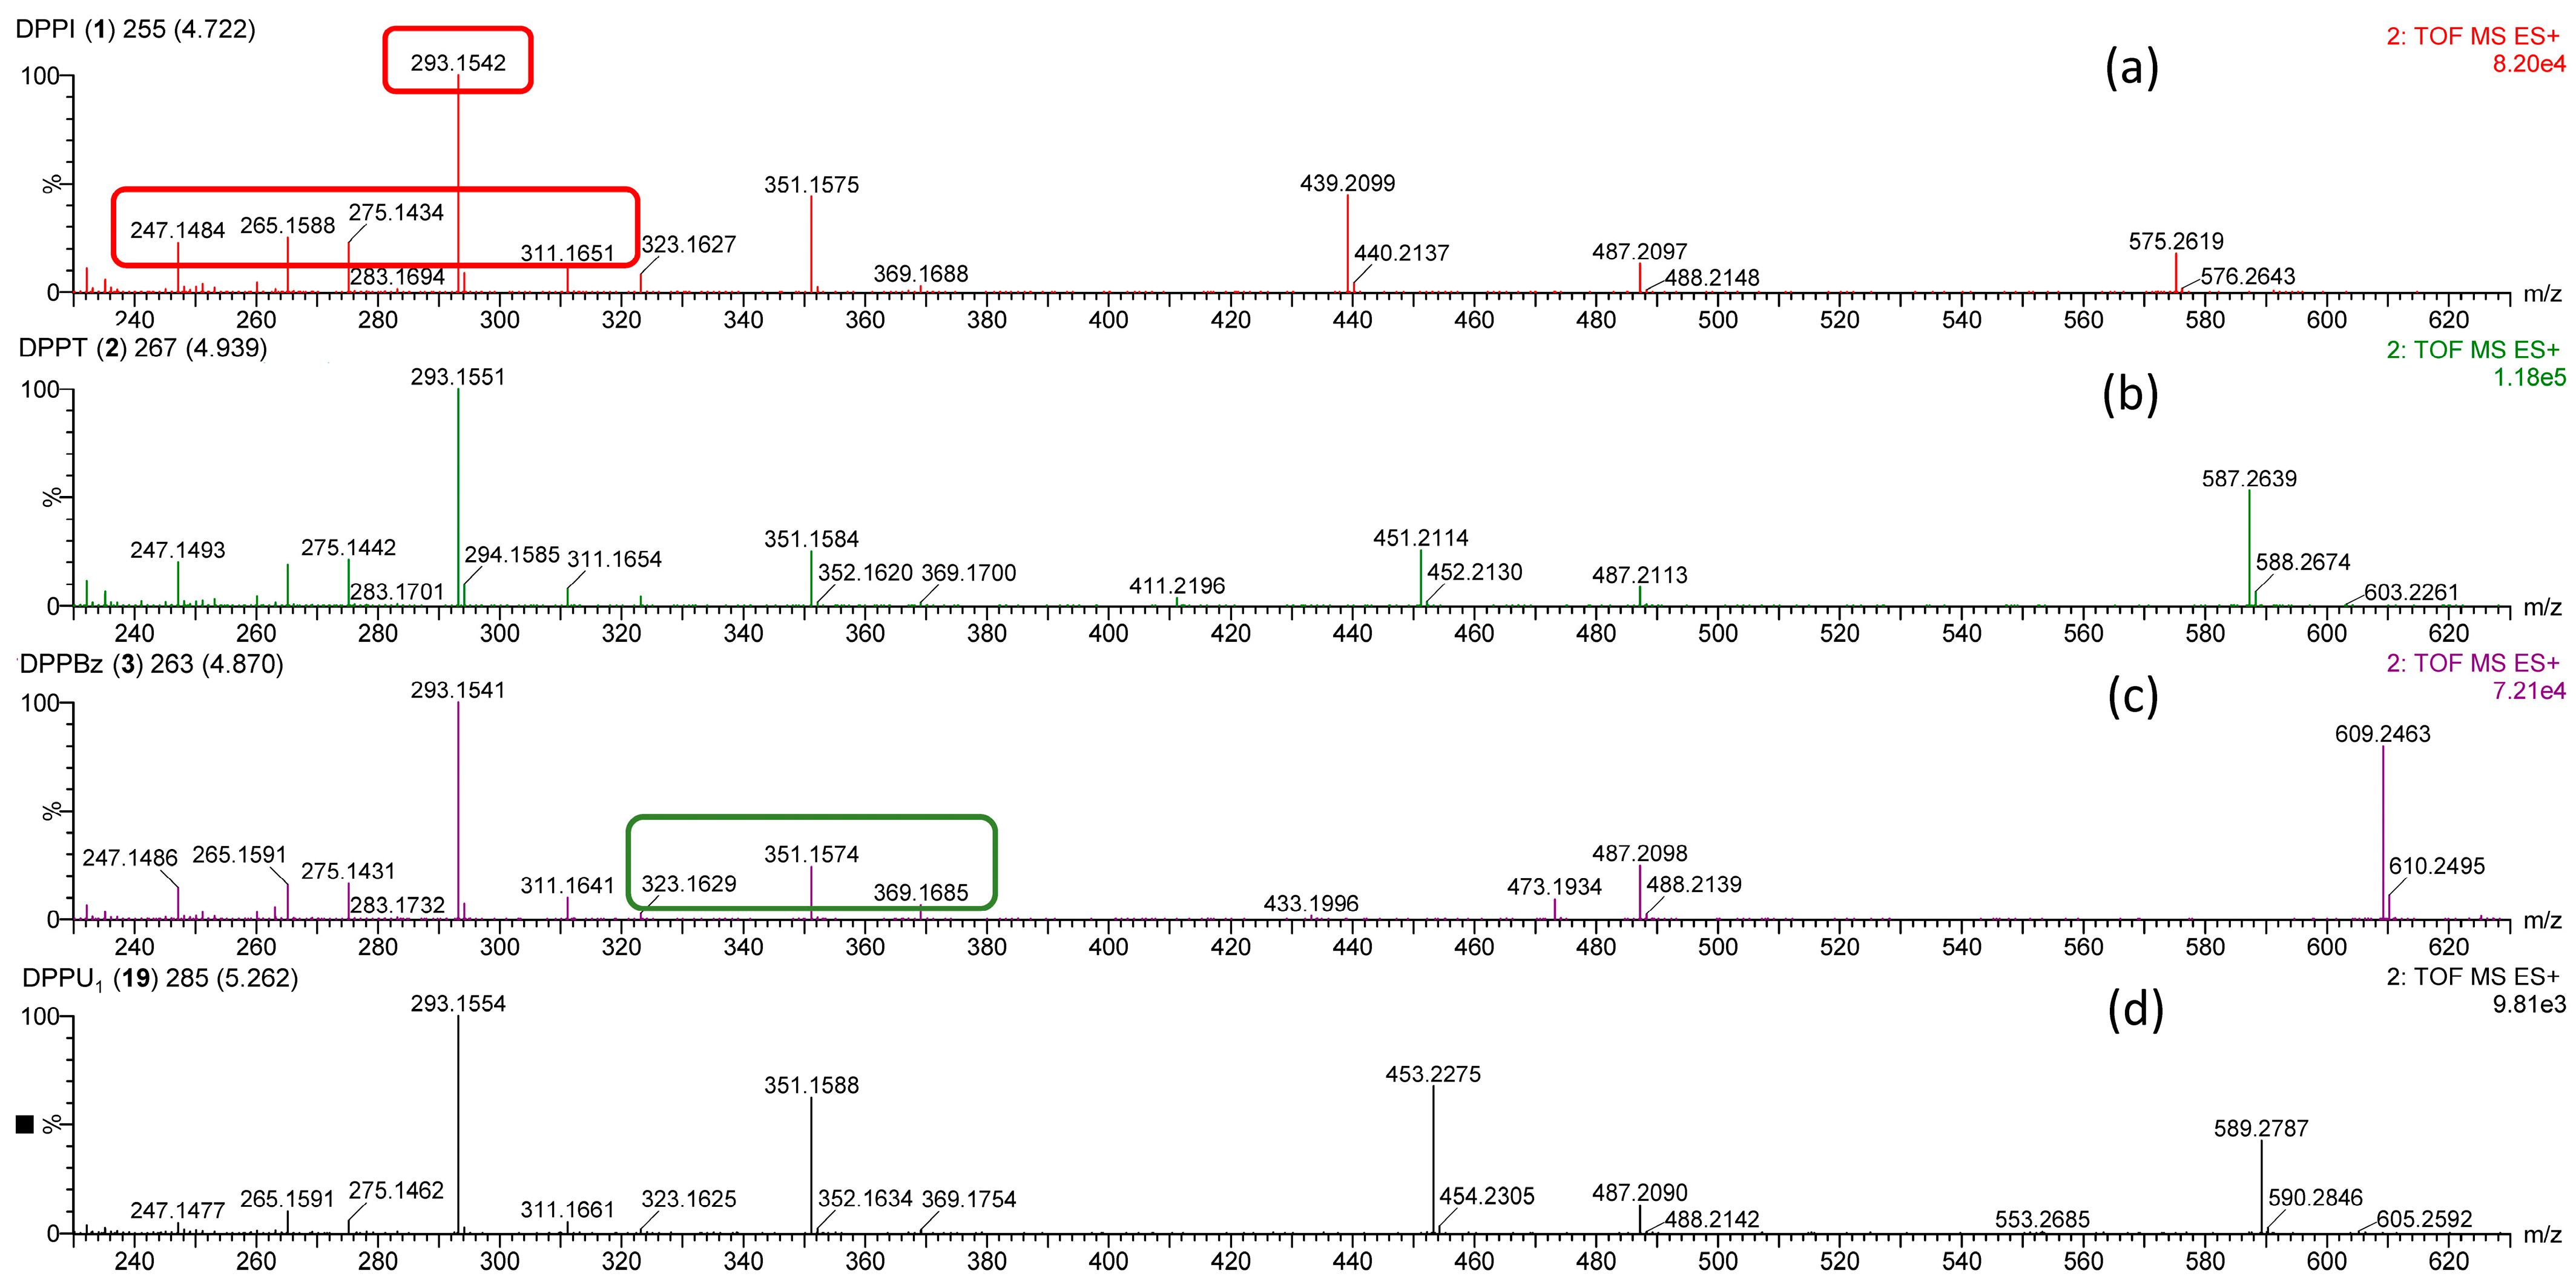
On the other hand, compound
3 was isolated as an amorphous solid and presented a [M + Na]
+ molecular ion in its HRMS
E spectrum at
m/
z 609.2463 (calcd for C
35H
38O
8Na, 609.2464) (
Table 1,
Figure 2c), which provides a molecular formula C
35H
38O
8. Daughter ions were observed in its HRMS
E spectrum at
m/
z 323.1629, 311.1641, 293.1541, 275.1431, 265.1591 and 247.1486, (
Table 1,
Figure 2c), which were also observed in similar mass spectra for DPPI (
1) and DPPT (
2) (
Table S1,
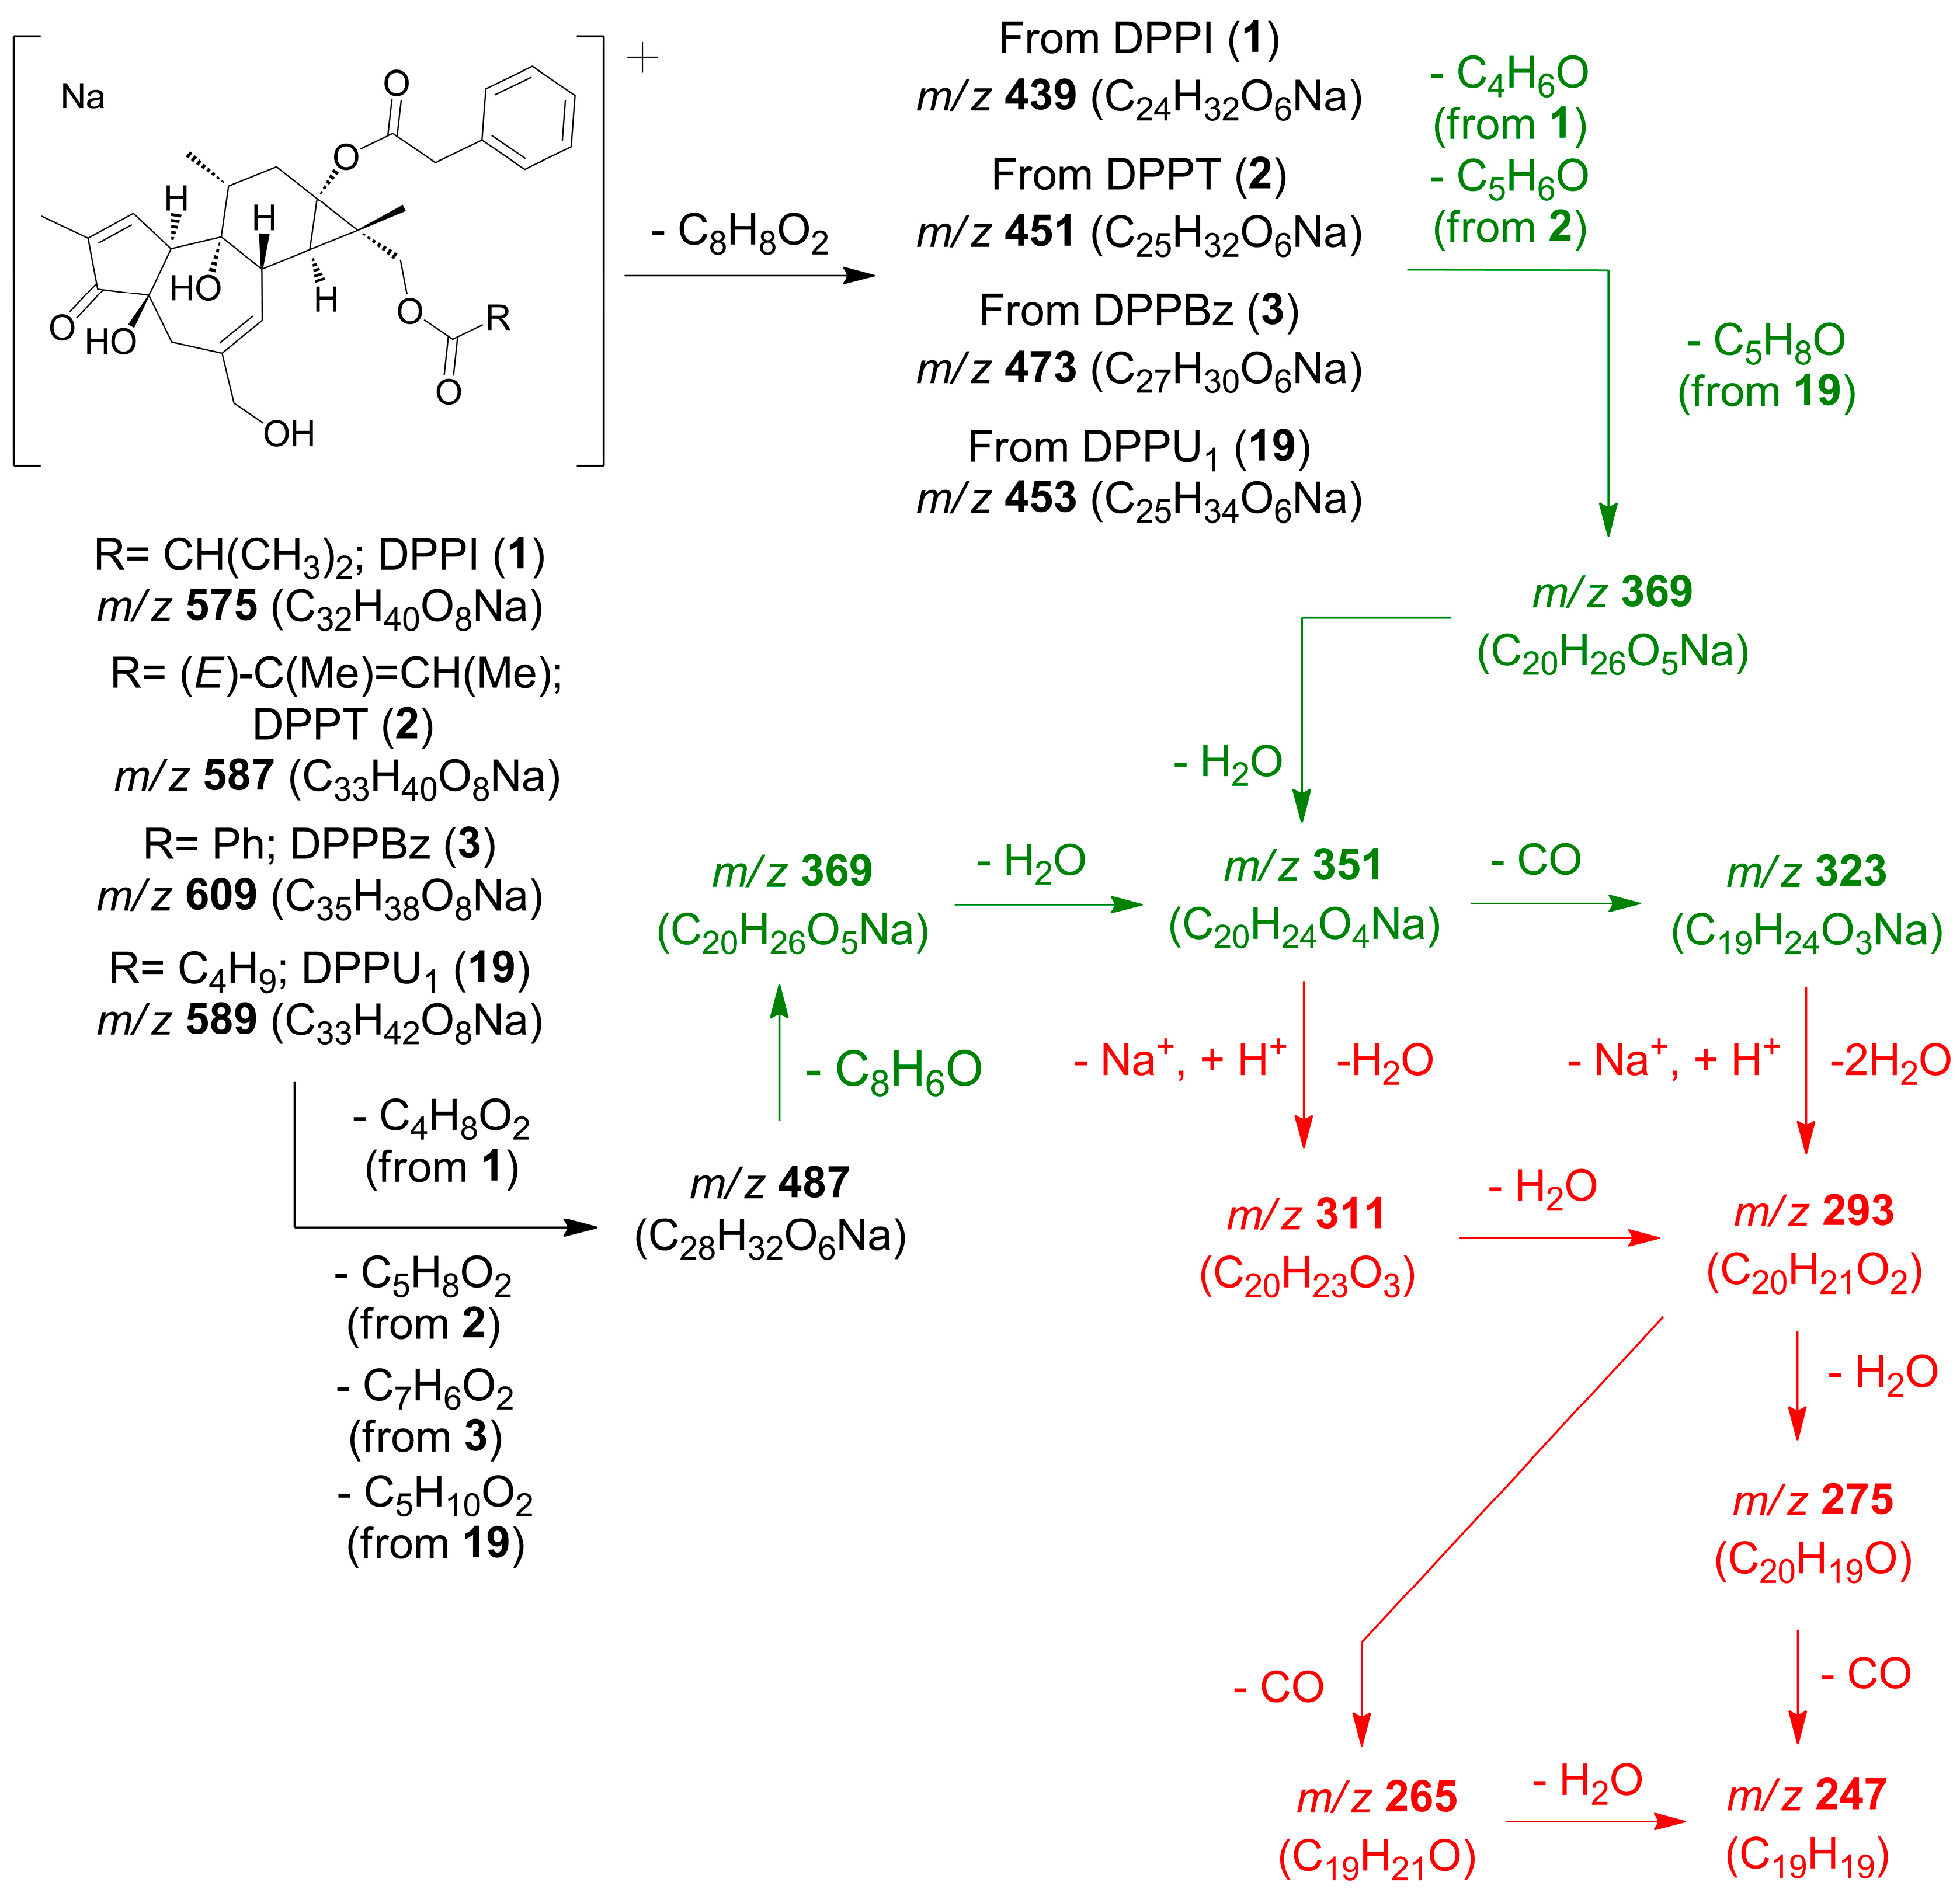
Figure 2a,b), and which are deemed characteristic of 13,16-diesters of 16-hydroxy-12-deoxyphorbol [
8]. These ions could be assigned to losses of CO, water (1, 2 and 3 molecules), 2 molecules of water and CO and, finally, 3 molecules of water and CO, from a precursor ion at
m/
z 351.1572 (calculated), in turn, originated from the loss of ester groups at C-13 and C-16 from the parent molecular ion. The proposed fragmentation pathways leading to the above-mentioned ions can be found in
Scheme 1 and
Figure S20 for DPPI (
1), DPPT (
2) and compound
3.
Furthermore, compound
3 showed similar
1H and
13C NMR data to those of DPPI (
1) and DPPT (
2) but displayed the presence of signals characteristic of a benzoate ester group (
Table 2 and
Table 3), whose carbonyl group was correlated in the HMBC experiment with the H
2-16 signals (
Figure S3g,h). These data, together with previously discussed HRMS
E data and the observation of an ion at
m/
z 473.1934 (calcd 473.1940, C
27H
30O
6Na), consistent with a loss of phenylacetic acid from the parent molecular ion (
Table 1,
Figure 2c), pointed out that a structure of 12-deoxy-16-hydroxyphorbol 16-benzoate 13-phenylacetate (DPPBz) could be assigned for compound
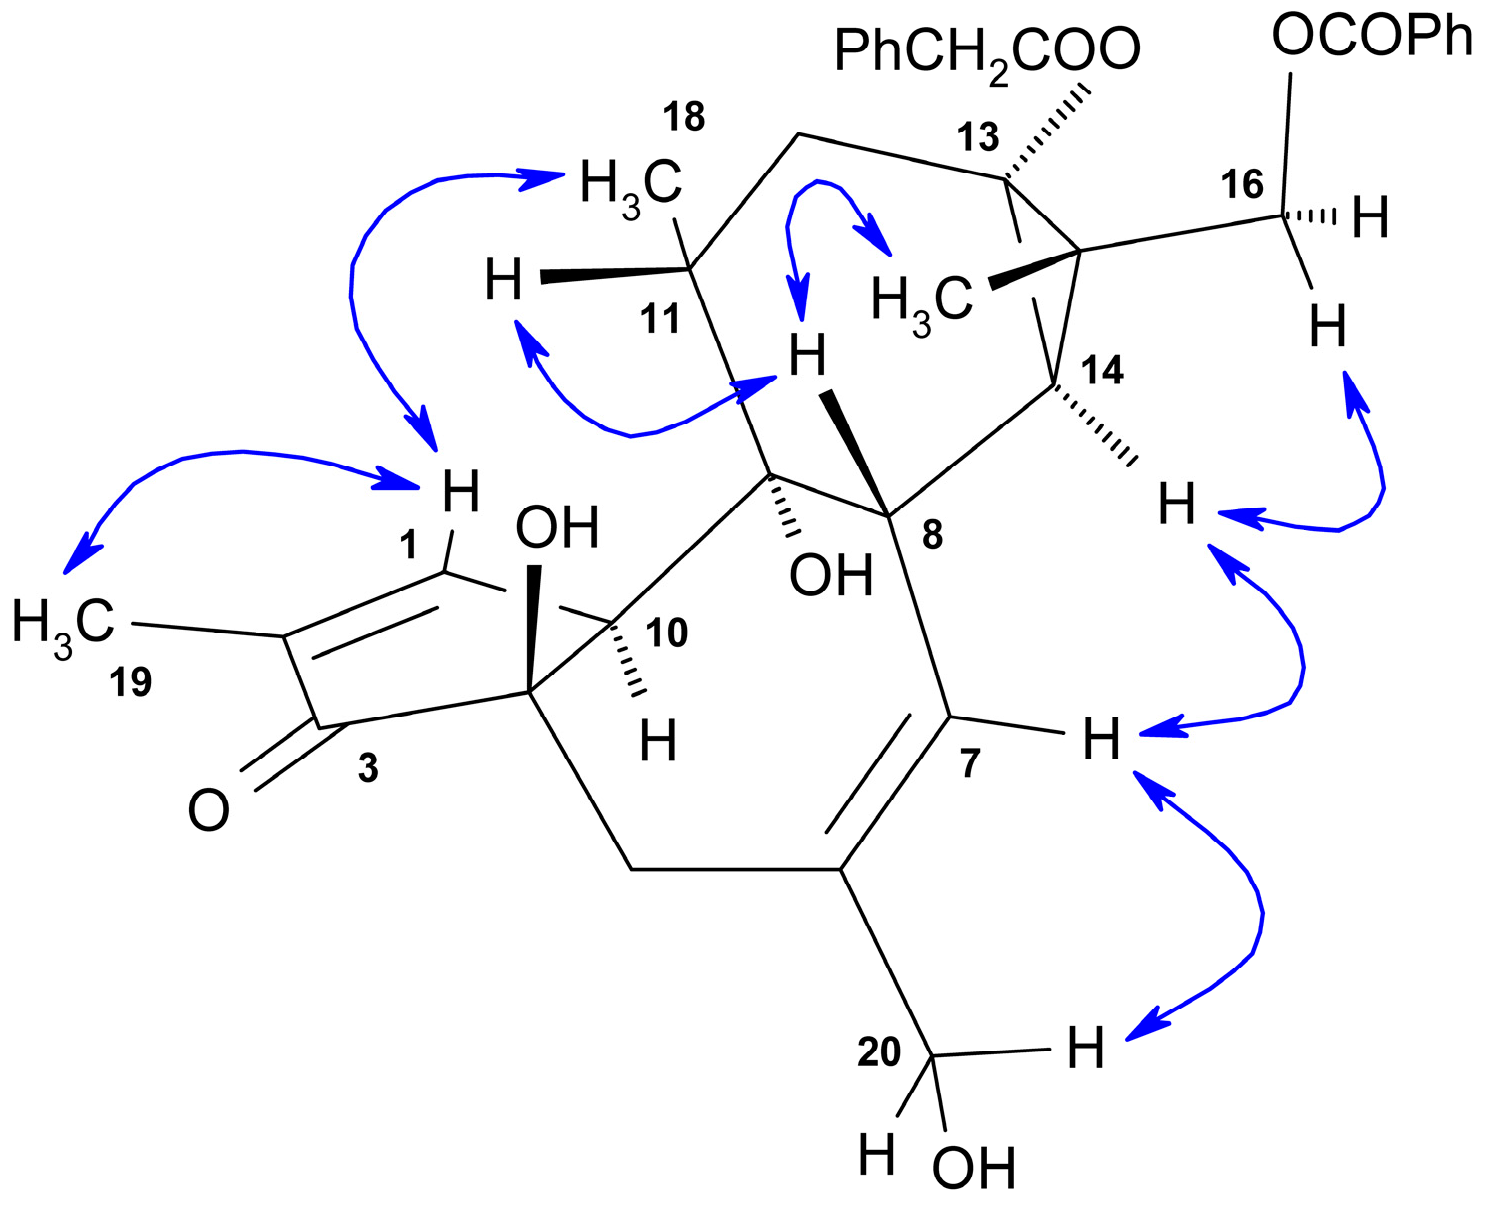
3. On the one hand, NOESY correlations observed between H
2-16 and H-14α located a benzoate group on C-16; on the other hand, NOESY correlations observed between H-8β, H-11β and H
3-17 (
Figure 3) confirmed the location of a phenylacetate group at C-13 and suggested that the relative configuration for DPPBz (
3) was identical to the one previously observed for
1 (DPPI) and
2 (DPPT).
Compound
3 (DPPBz) was previously identified by Hergenhahn et al. as a component of
E. resinifera latex (RL22) [
27], but no spectroscopic or spectrometric data supporting this assignment could be found in the literature.
Compounds
4,
5 and
6 were isolated as amorphous solids and presented [M + Na]
+ molecular ions in their HRMS
E spectra at
m/
z 617.2755 (calcd for C
34H
42O
9Na, 617.2727),
m/
z 629.2745 (calcd for C
35H
42O
9Na, 629.2727) and at
m/
z 651.2601 (calcd for C
37H
40O
9Na, 651.2570) (
Table 4,
Figure S21b–d), which provides the molecular formulas C
34H
42O
9 for compound
4, C
35H
42O
9 for compound
5 and C
37H
40O
9 for compound
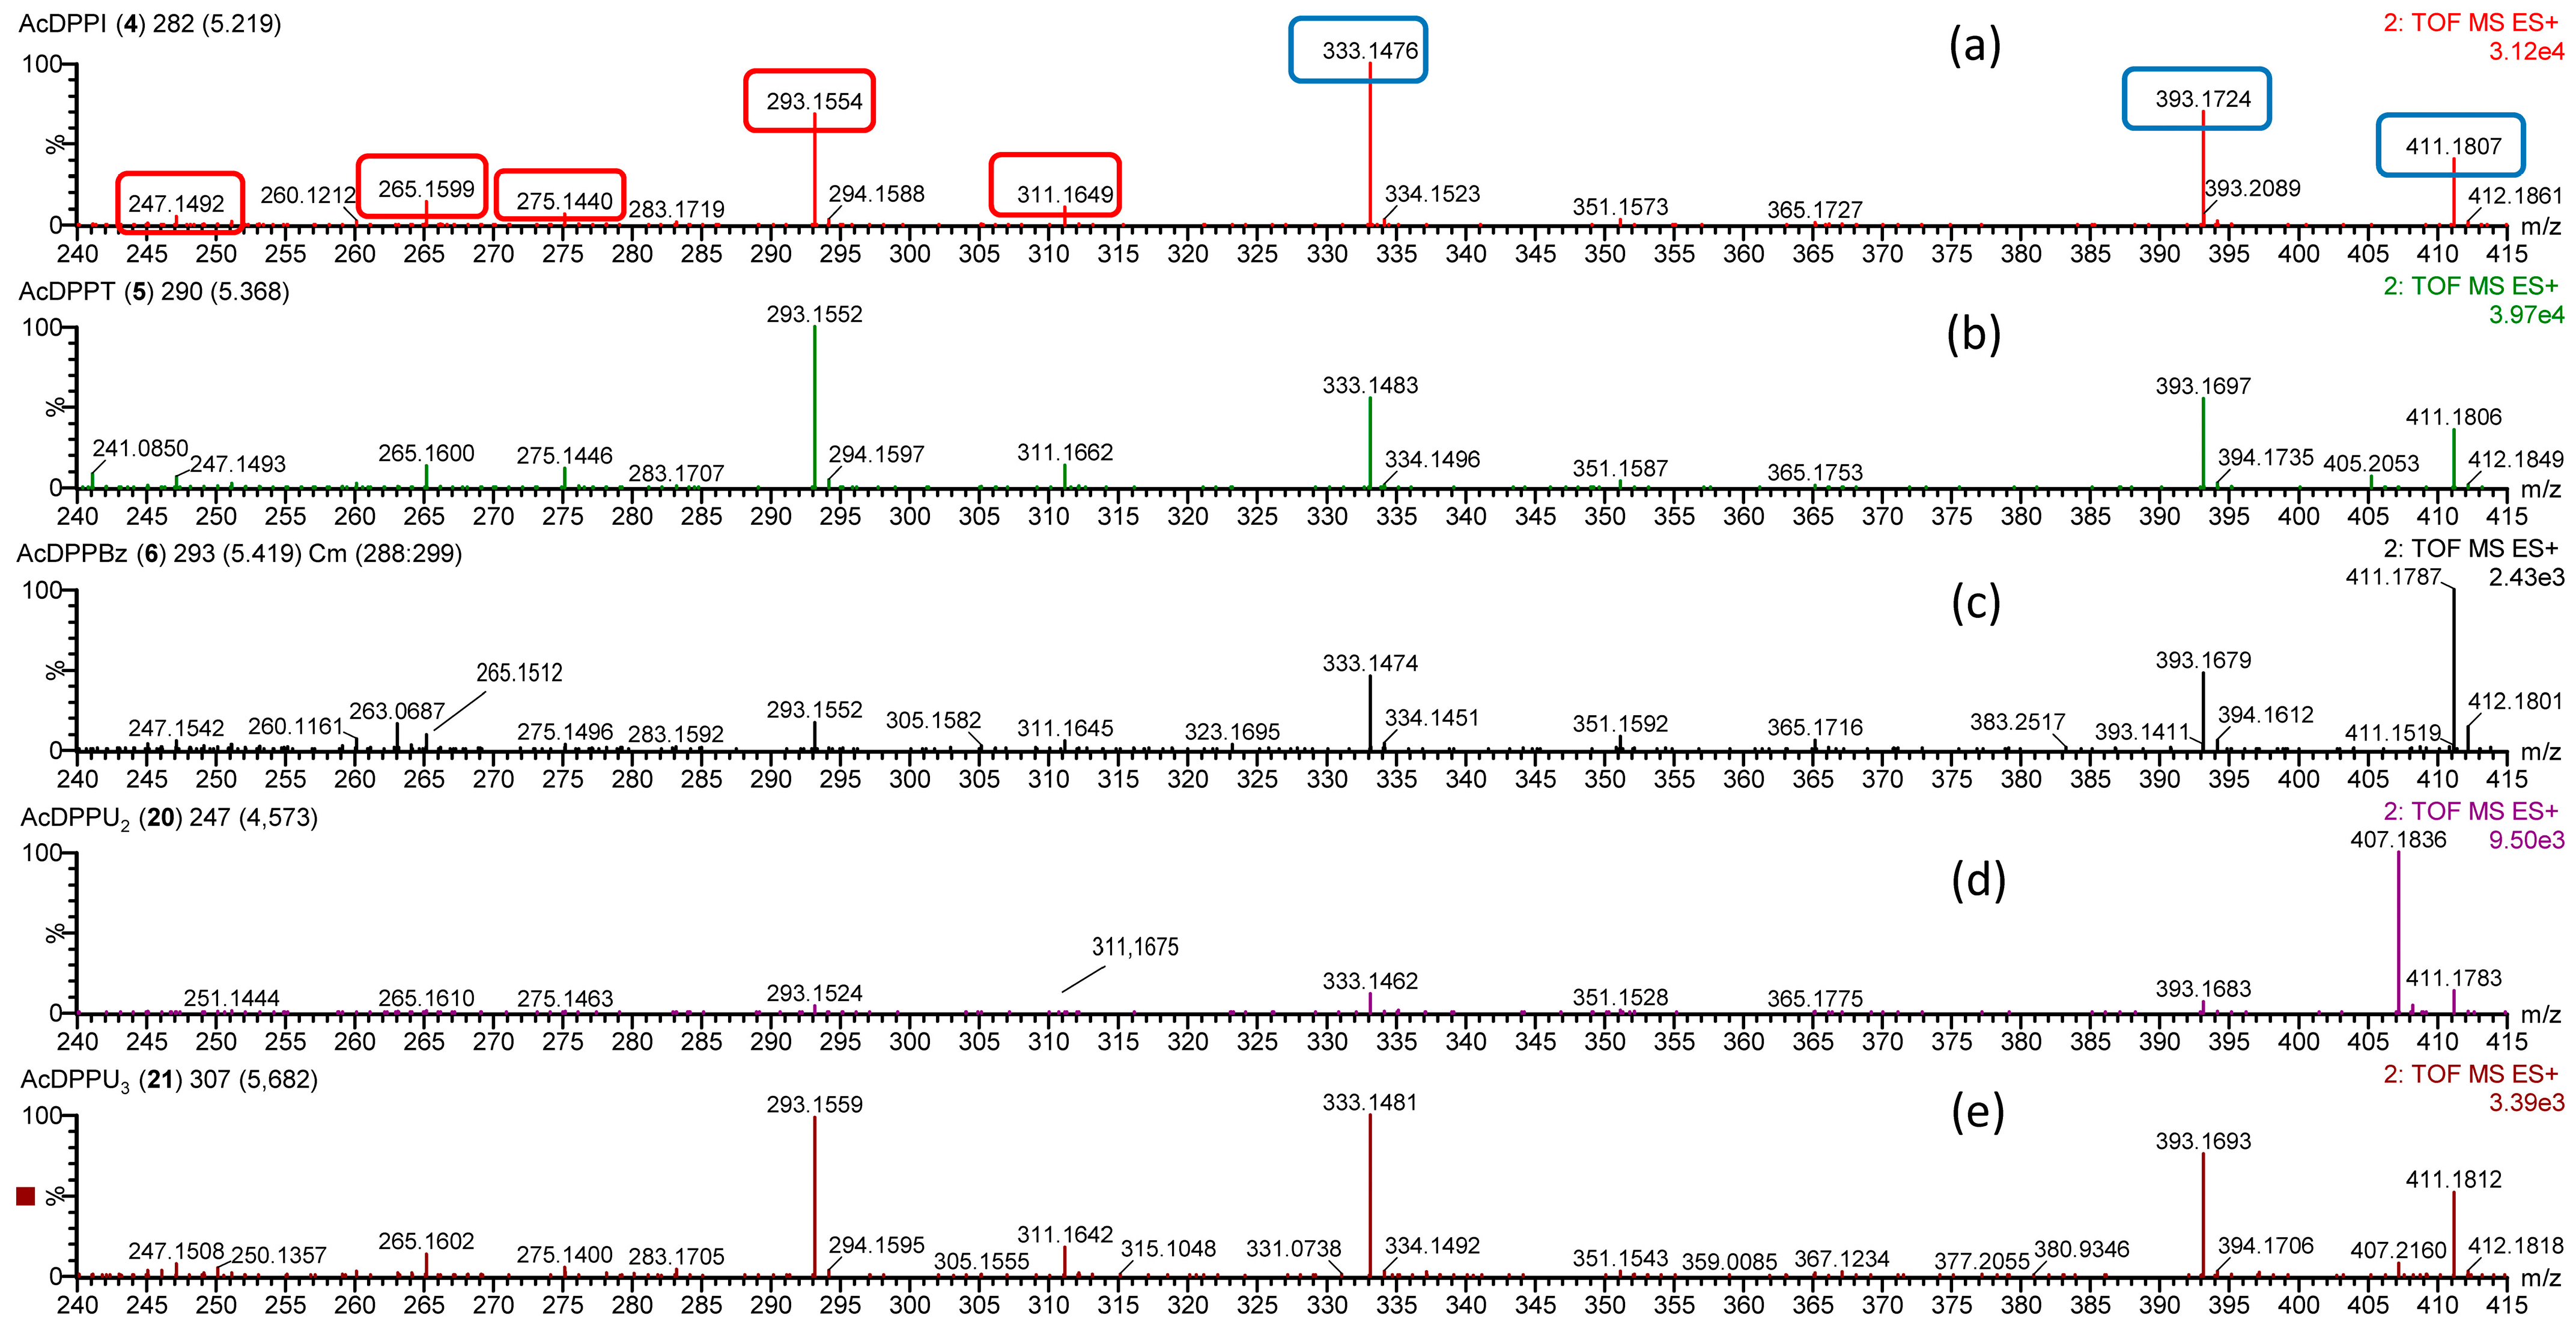
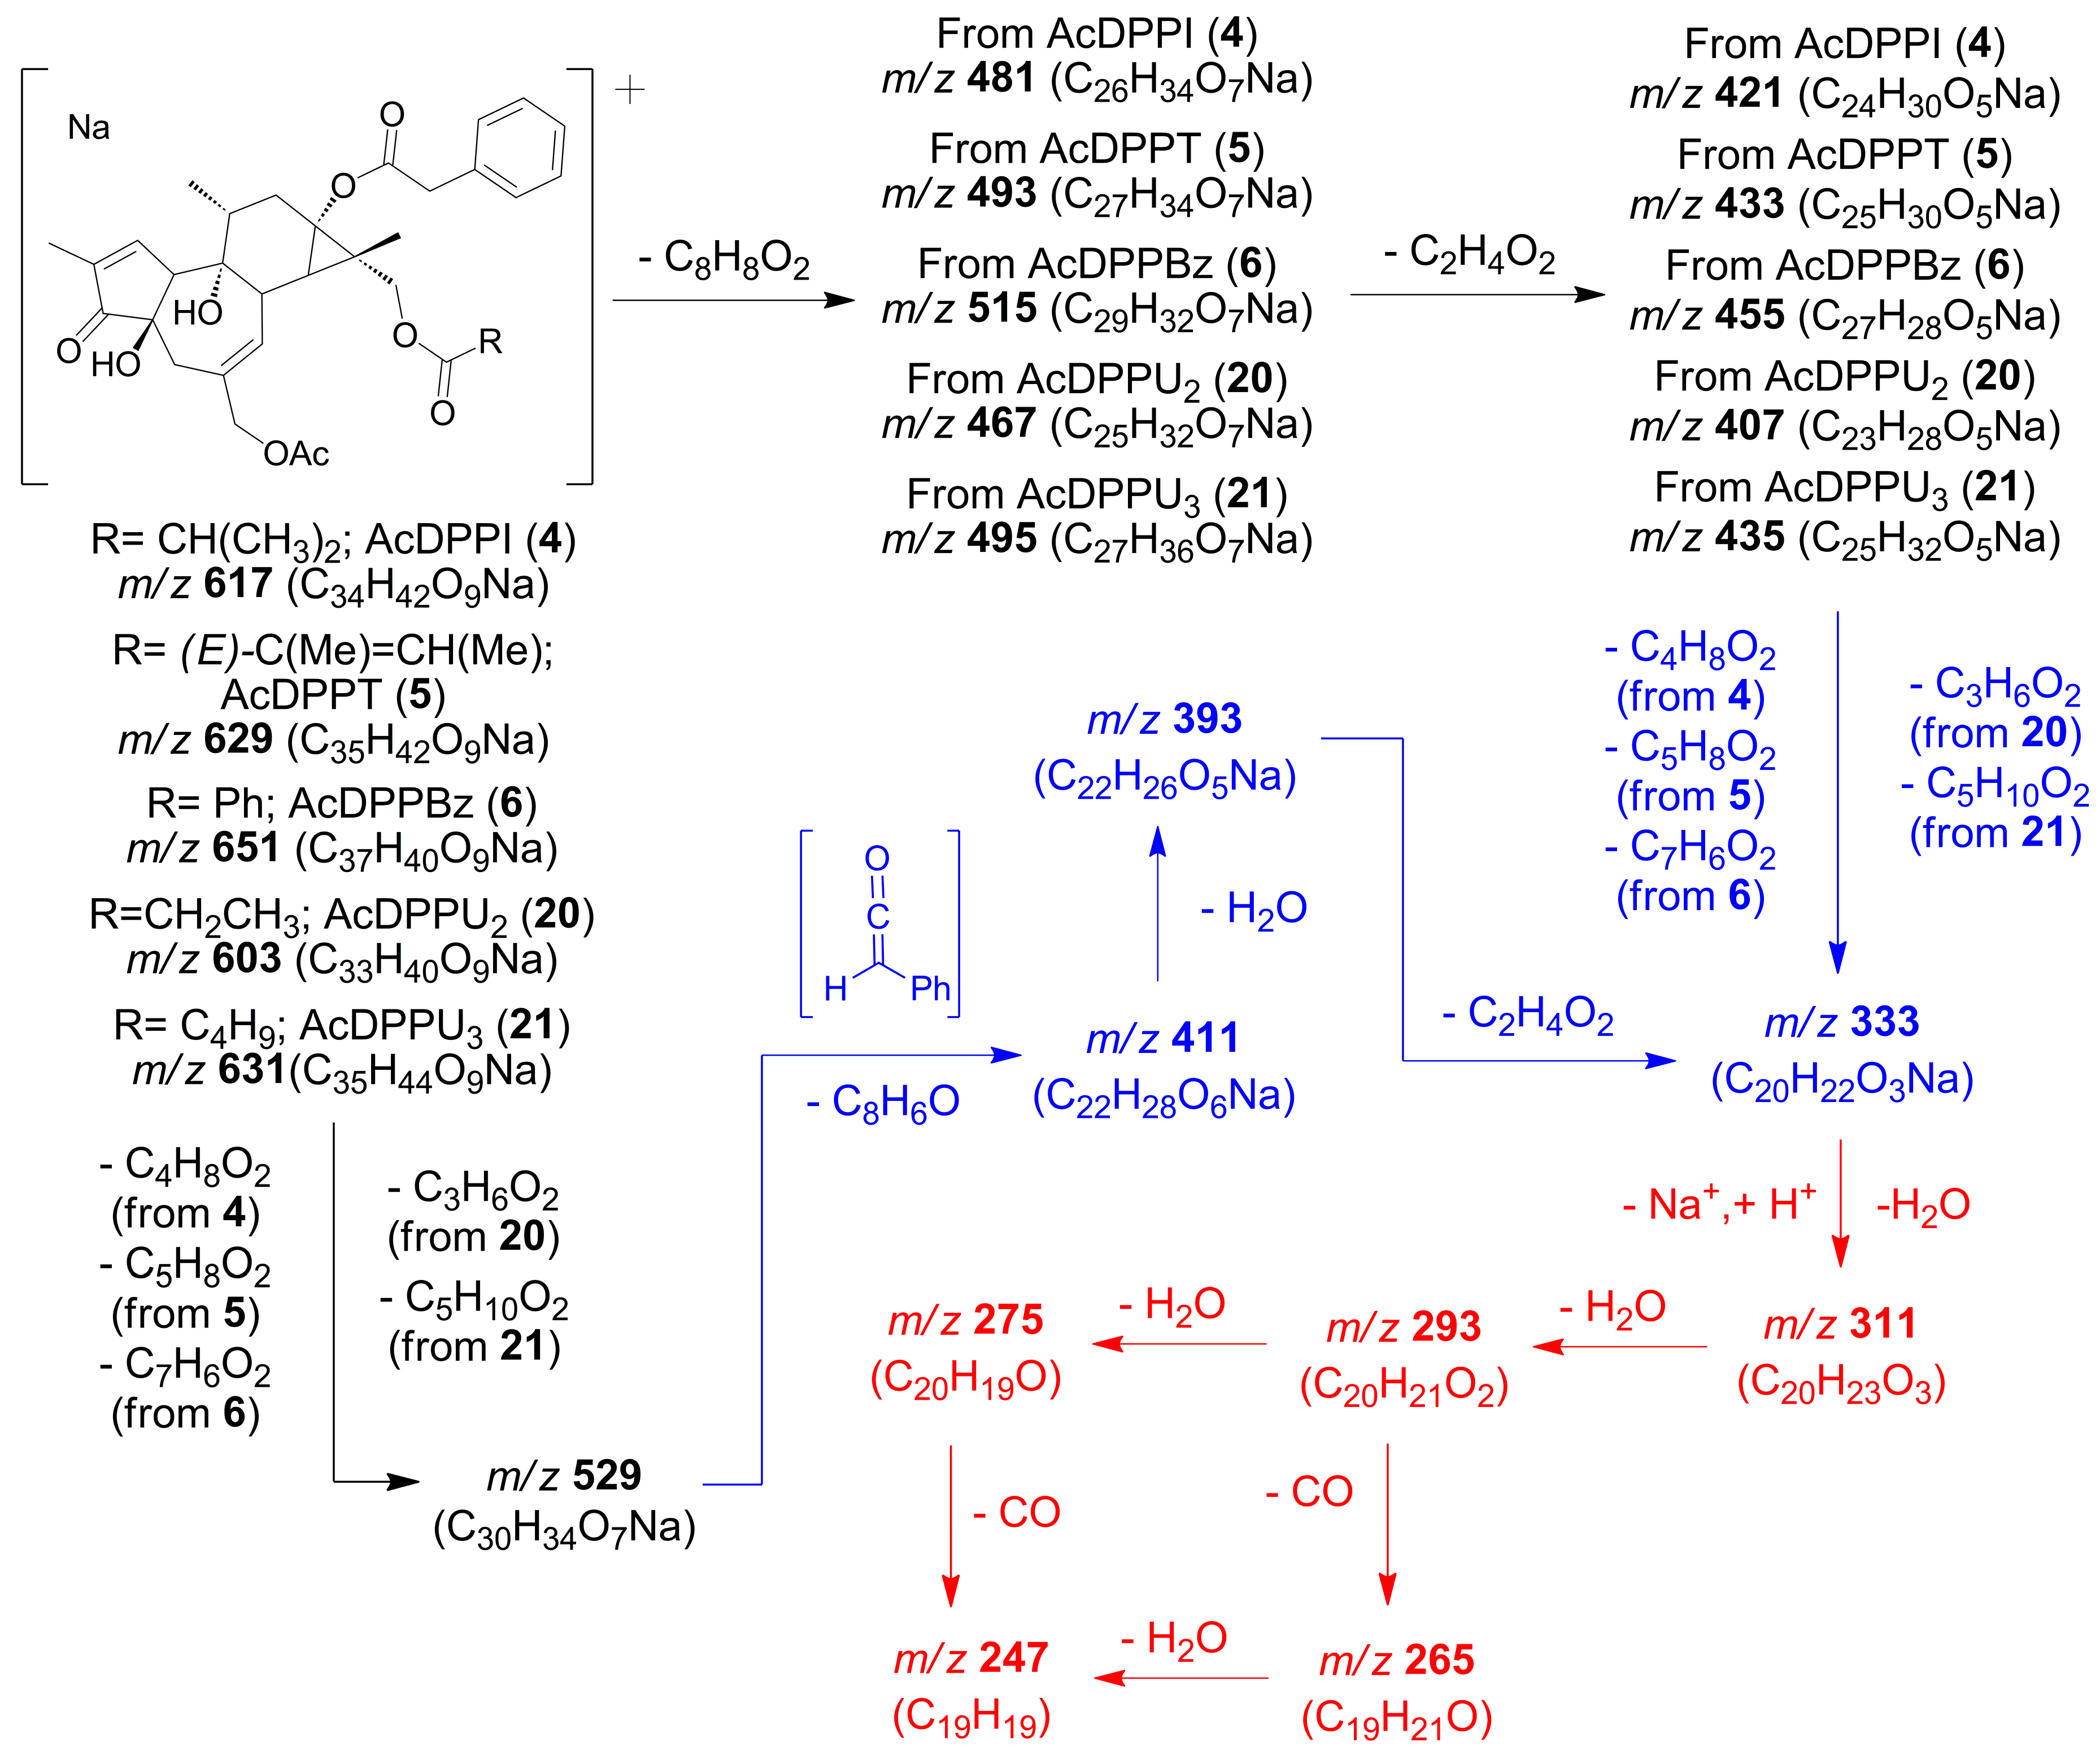
6, respectively. Daughter ions were observed in their HRMS
E spectra at
m/
z 311.1647, 293.1542 and 275.1436 (calculated) (
Table 4,
Figure 4a–c), which were similar to the ones described above for 13,16 diesters of 16-hydroxy-12-deoxyphorbols (DPPI (
1), DPPT (
2) and DPPBz (
3) (see, for instance, comparison between
Figure 2b (DPPT (
2)) and
Figure 4a,b). On the other hand, daughter ions at
m/
z 411.1784, 393.1678 and 333.1467 (calculated) (
Table 4,
Figure 4a–c; highlighted in blue in
Figure 4a) were also observed, which were not apparent in the HRMS
E spectra of compounds
1,
2 or
3. The latter group of ions could be assigned to losses of phenylketene, water and acetic acid from a precursor ion at
m/
z 529.2202 (calculated), which, in turn, originates from the loss of an ester group at C-16 from the parent molecular ions of compounds
4,
5 and
6 (
Table 4,
Figure 4a–c and
Figure S21b–d). The proposed fragmentation pathways leading to the above-mentioned ions can be found in
Scheme 2 and
Figure S22 for AcDPPI (
4), AcDPPT (
5) and Ac DPPBz (
6).
The
1H and
13C NMR data of compounds
4,
5 and
6 were very similar with those of DPPI (
1), DPPT (
2) and DPPBz (
3), respectively, except for the presence of signals corresponding to an extra acetate group in each compound (
Table 2 and
Table 3). This is consistent with the analysis of the HRMS
E data discussed above, where ion
m/
z 333.1467 (calculated) could be understood to originate from a loss of acetic acid from the precursor at
m/
z 393.1678 (calculated) in compounds
4,
5 and
6 (
Scheme 2,
Figure S22). Daughter ions at
m/
z 481.2222 (calcd for C
26H
34O
7Na, 481.2202) for compound
4,
m/
z 493.2221 (calcd for C
27H
34O
7Na, 493.2202) for compound
5 and
m/
z 515.2083 (calcd for C
29H
32O
7Na, 515.2046) for compound
6 were consistent with a loss of phenyl acetic acid from a molecular ion in each compound (
Table 4,
Figure S21; see
Scheme 2 and
Figure S22 for proposed fragmentation pathways), which, in turn, is consistent with the observation of the
1H and
13C NMR signals corresponding to a phenylacetate group (
Table 2 and
Table 3). Differences in
1H and
13C NMR for the above-mentioned compounds can be attributed to the presence of isobutyrate, tigliate and benzoate groups (
Table 2 and
Table 3). Further support for these observations can be drawn from the presence of an ion at
m/
z 529.2202 (calculated) in the HRMS
E spectra of compounds
4,
5 and
6, which would be consistent with losses of isobutyric, tiglic and benzoic acids from the molecular ions of previously mentioned compounds, respectively (
Table 4,
Figure S21; see
Scheme 2 and
Figure S22 for proposed fragmentation pathways). The HMBC correlations between H
2-16 and C-1″ in compounds
4,
5 and
6 located the isobutyrate/tigliate/benzoate groups at C-16 in each compound. The HMBC correlations between H
2-20 and the carbonyl group of the acetate moiety in each compound located this group at C-20 (
Figures S4g–S6g and S4i–S6i). Therefore, the phenylacetate moieties were located at C-13 in compounds
4,
5 and
6. NOESY correlations observed between H
2-16 and H-14α, and between H-8β, H-11β and H
3-17, analogous to the ones observed for DPPI (
1), DPPT (
2) [
8] and DPPBz (
3) (
Figure 3), confirmed the location of isobutyrate/tigliate/benzoate moieties and supported the structural assignment for each compound as 12-deoxy-16-hydroxyphorbol 20-acetate 16-isobutyrate 13-phenylacetate (AcDPPI (
4)), 12-deoxy-16-hydroxyphorbol 20-acetate 16-tigliate 13-phenylacetate (AcDPPT (
5)) and 12-deoxy-16-hydroxyphorbol 20-acetate 16-benzoate 13-phenylacetate (AcDPPBz (
6)).
Scheme 2.
Proposed fragmentation route for selected ions on HRMS
E spectra (DIA, high-energy function) for 16-hydroxy-12-deoxyphorbol 20-acetate-13,16-diacyl derivatives (
4–
6,
20–
21, group B compounds; see
Section 2.2). For each ion, nominal mass and elemental composition is presented; see a more detailed interpretation of the fragmentation route in
Figure S22. In red, common daughter ions with group A compounds (see
Section 2.2 and
Scheme 1). In blue, highlighted ions in
Figure 4a.
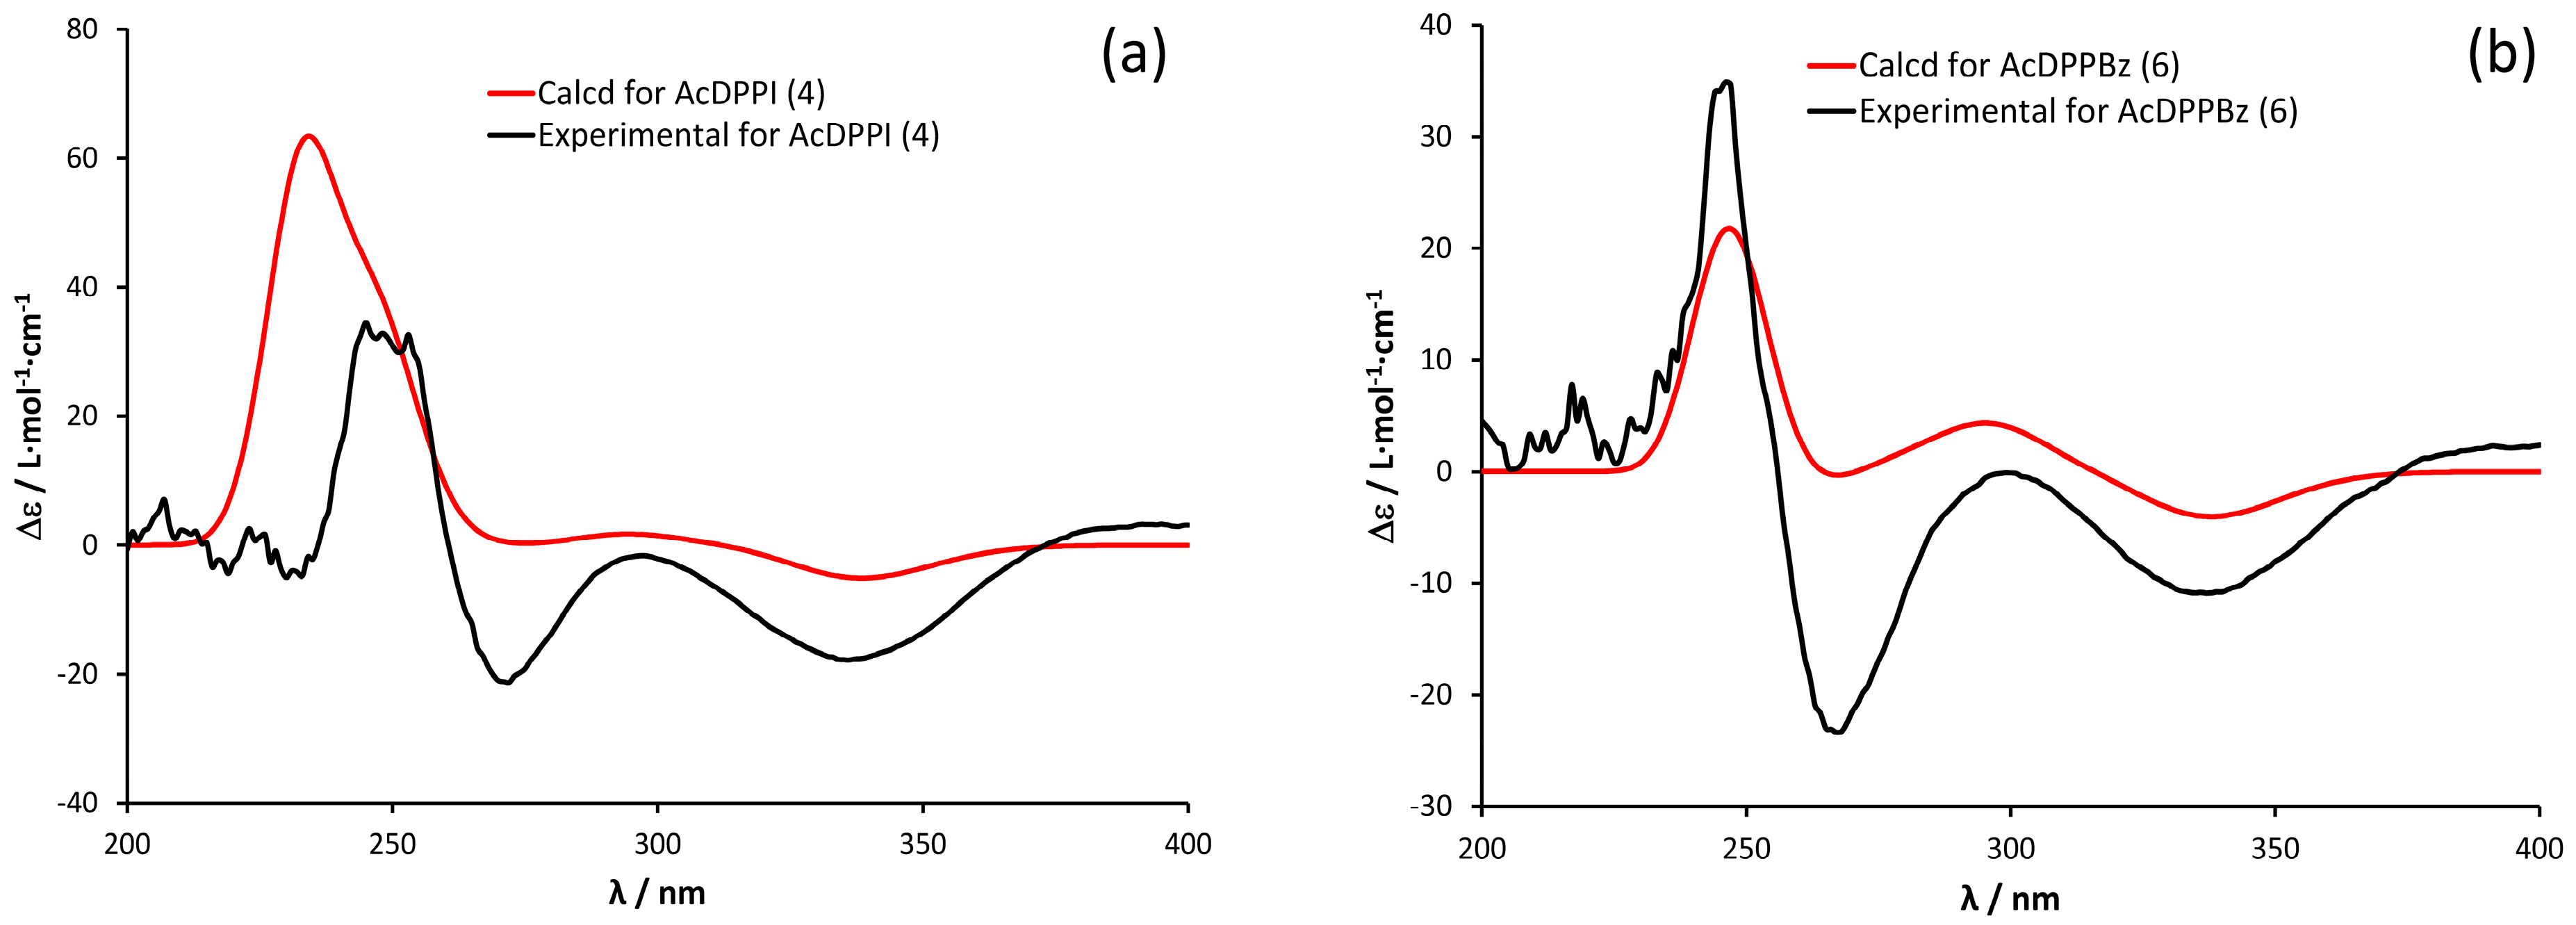
The absolute configuration for compounds AcDPPI (
4) and AcDPPBz (
6) was determined by the comparison of their experimental electronic circular dichroism (ECD) spectra, with the computed ECD spectrum for each one of their 4
R,8
S,9
R,10
S,11
R,13
S,14
R,15
S stereoisomers, calculated from quantum mechanical time-dependent density functional theory (TDDFT) calculations with a 6–31 + G(d,p) level of theory, using the Gaussian 16 program [
28]. As illustrated in
Figure 5, the calculated and theoretical ECD curves matched well, leading to the assignment of the structure and absolute configuration of compounds
4 and
6, respectively, as (4
R,8
S,9
R,10
S,11
R,13
S,14
R,15
S)-12-deoxy-16-hydroxyphorbol 20-acetate 16-isobutyrate 13-phenylacetate (AcDPPI) and (4
R,8
S,9
R,10
S,11
R,13
S,14
R,15
S)-12-deoxy-16-hydroxyphorbol 20-acetate 16-benzoate 13-phenylacetate (AcDPPBz). On the other hand, a comparison of the experimental ECD curves for compounds DPPI (
1), DPPT (
2), DPPBz (
3), AcDPPT (
5) and AcDPPBz (
6) show similar magnitudes and signs of Cotton effects (
Figure S19), which, in turn, allow for the assignation of the absolute configuration for compounds
1,
2,
3,
5 and
6 as 4
R,8
S,9
R,10
S,11
R,13
S,14
R,15
S as well. The observed absolute configuration for compounds
1–
6 matches what has been described previously for other tigliane derivatives [
29].
As far as we know, compound
4 (AcDPPI) is described here for the first time. Compounds named as RL12 and RL11, which were attributed structures as the ones described here as AcDPPT (
5) and AcDPPBz (
6), respectively, have been reported previously [
27,
30], but with lesser spectroscopic and spectrometric support for their structural assignment.
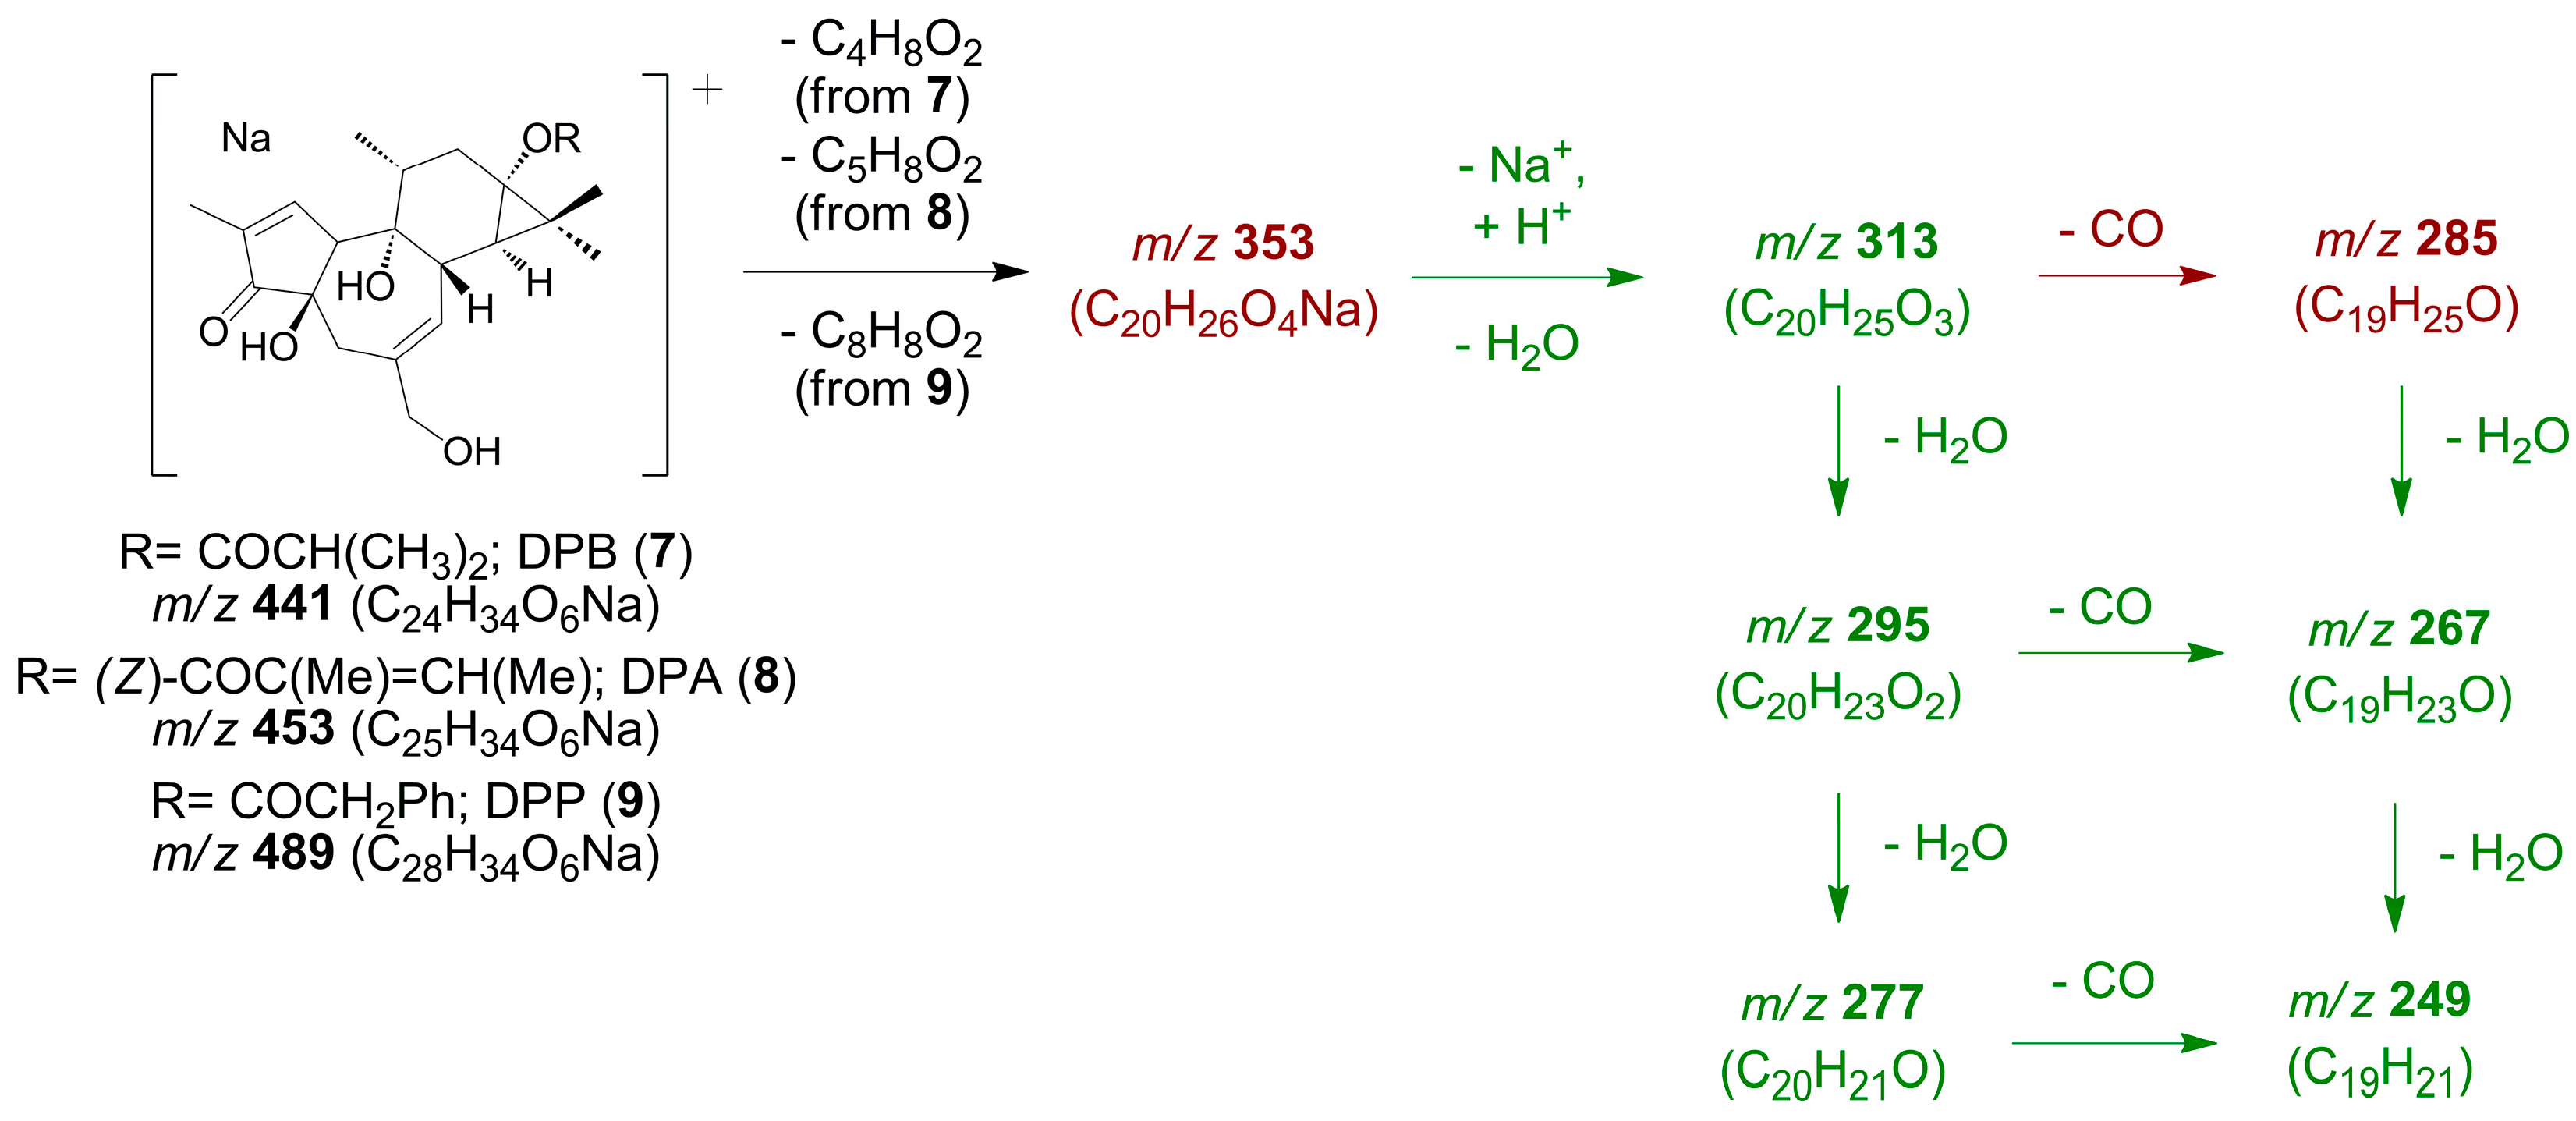
The additional comparison of the spectroscopic and spectrometric data of the compounds isolated and not discussed above, with those reported in the literature, allowed for the identification of three known tetracyclic 13-esters of 12-deoxyphorbol, assigned as 12-deoxyphorbol 13-isobutyrate (DPB (
7)) [
31,
32], 12-deoxyphorbol 13-angelate (DPA (
8)) [
33] and 12-deoxyphorbol 13-phenylacetate (DPP (
9)) [
33]. The examination of their HRMS
E spectra showed different fragmentation patterns to those described above for 16-hydroxy-12-deoxyphorbol 13,16-diacyl derivatives DPPI (
1), DPPT (
2) and DPPBz (
3) (
Table S1 and
Table 1 and
Figure 2). Selected ions of high-energy HRMS
E (DIA) [
26] for DPB (
7), DPA (
8) and DPP (
9), together with a comparison of their HRMS
E spectra, can be found in
Table S2 and
Figures S23 and S24.
The proposed fragmentation pathways leading to previously mentioned ions can be found in
Scheme 3 and
Figure S25.
On the other hand, a further comparison of the spectroscopic and spectrometric data of the compounds isolated and not mentioned above, with those reported in the literature, allowed for the identification of three known tetracyclic 13,20-diesters of 12-deoxyphorbol, assigned as 12-deoxyphorbol 20-acetate 13-isobutyrate (AcDPB (
10)) [
32], 12-deoxyphorbol 20-acetate 13-angelate (AcDPA (
11)) [
33] and 12-deoxyphorbol 20-acetate 13-phenylacetate (AcDPP (
12)) [
33,
34] (for HRMS
E data, see
Table S3 and
Figures S26 and S27).
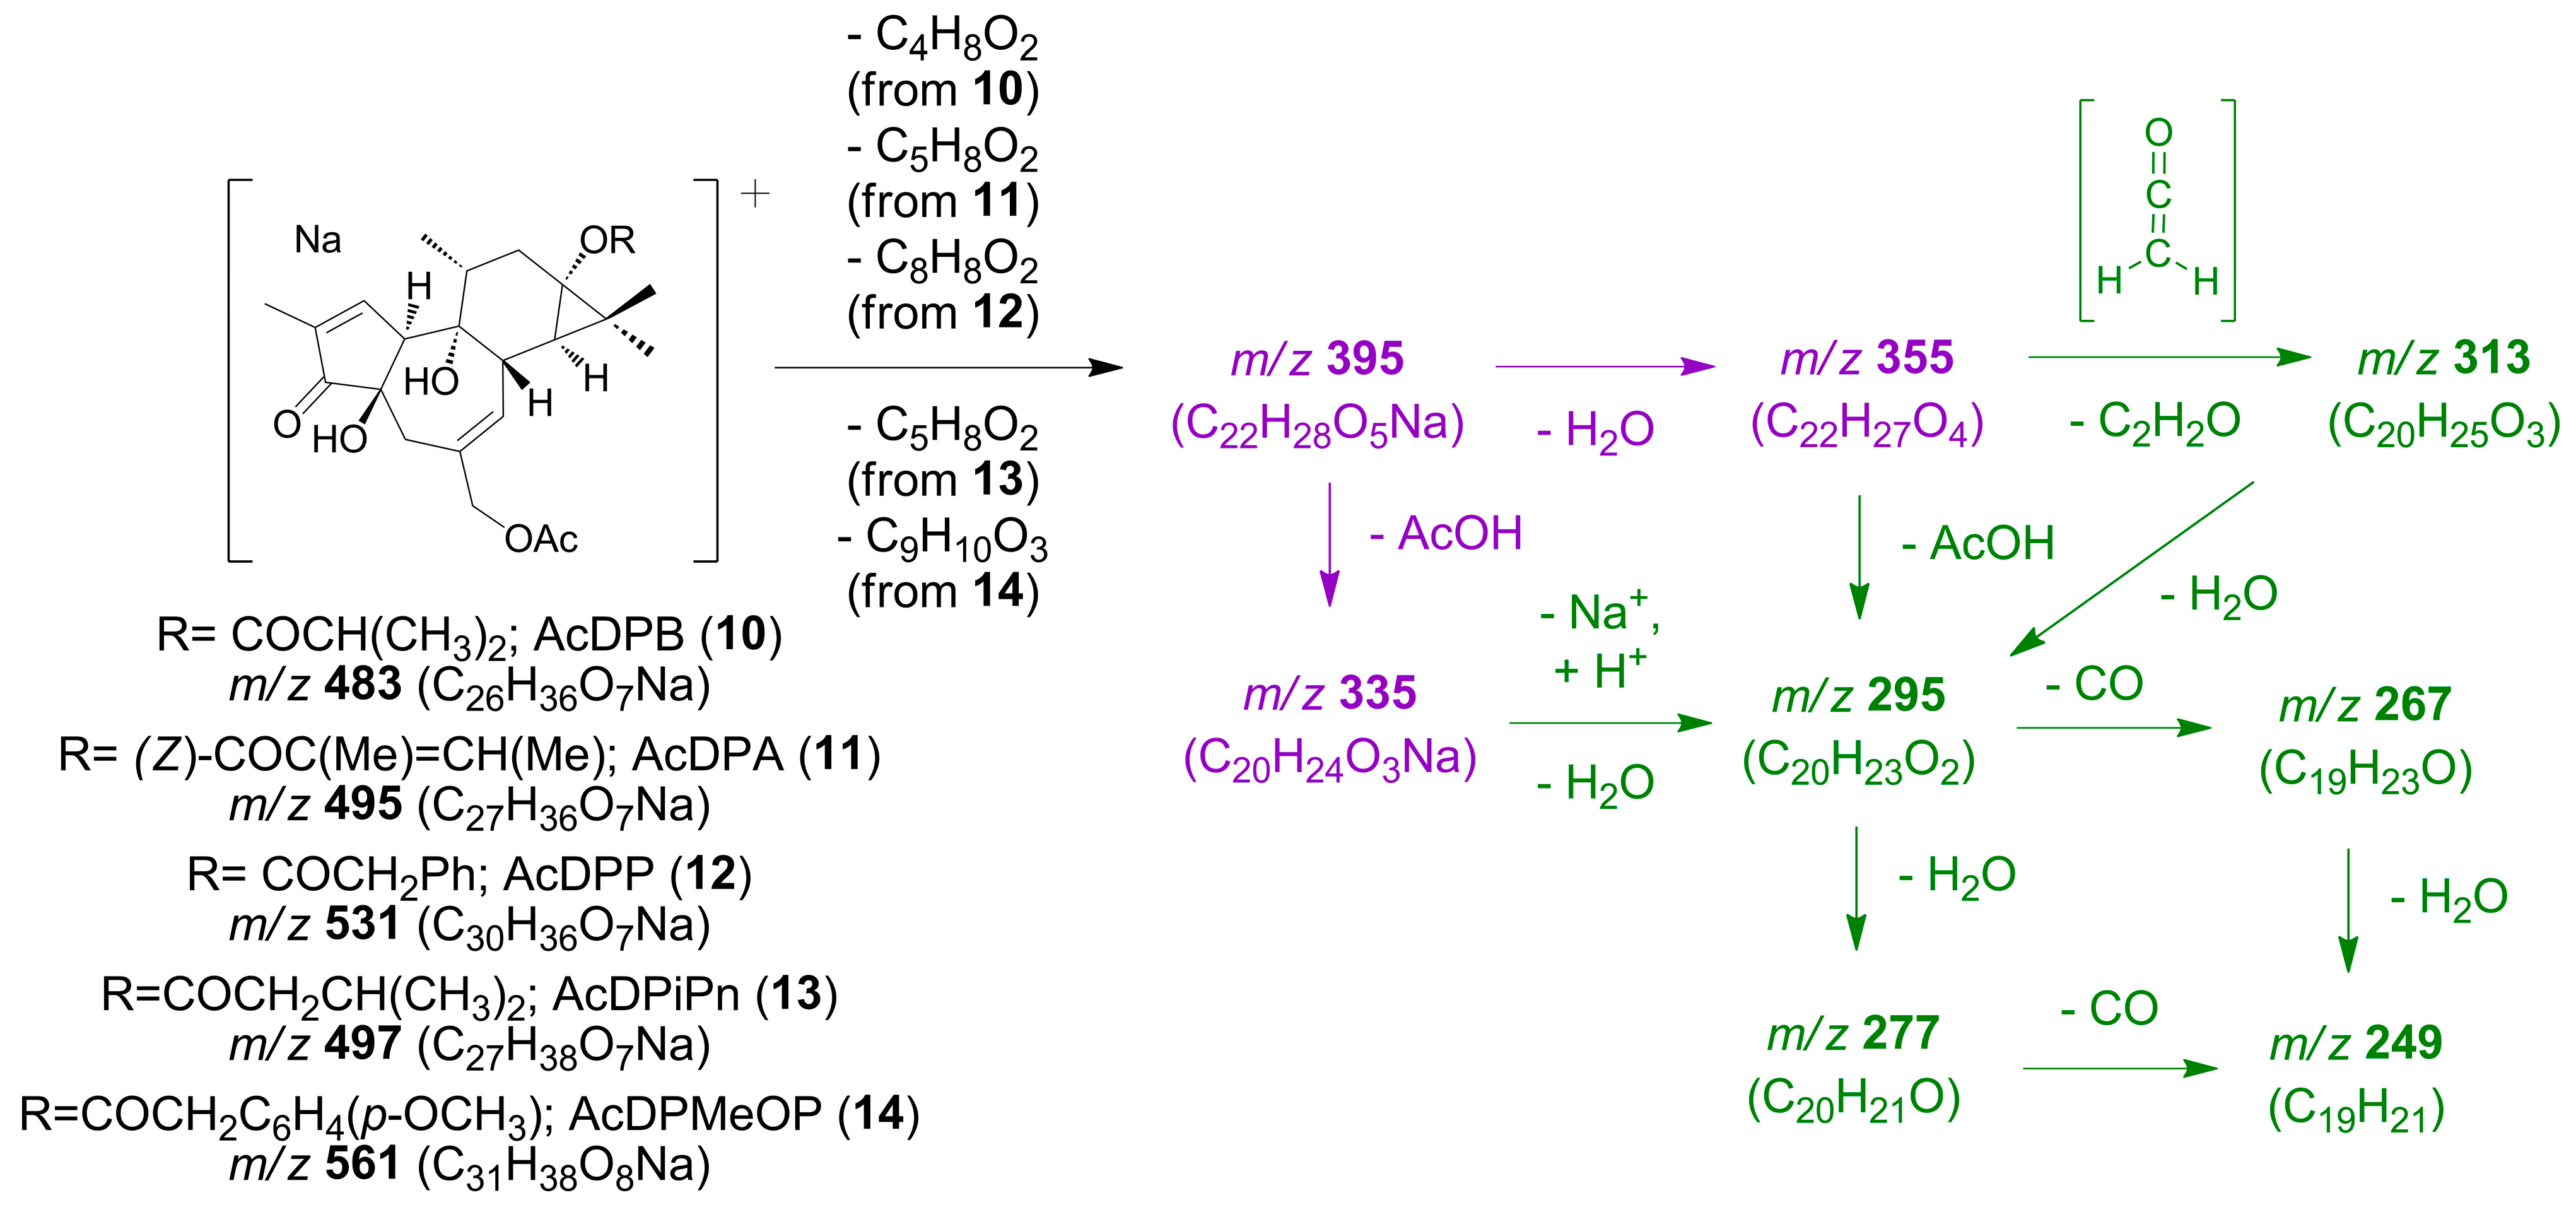
Three additional compounds with similar spectroscopic characteristics to those mentioned above were also isolated.
Compounds
13 and
14, both of them obtained as an amorphous powder, presented [M + Na]
+ molecular ions in their HRMS
E spectra at
m/
z 497.2527 (calcd for C
27H
38O
7Na, 497.2515) and 561.2455 (calcd for C
31H
38O
8Na, 561.2464), respectively (
Table 5,
Figure S28), which provide the molecular formulas C
27H
38O
7 for compound
13 and C
31H
38O
8 for compound
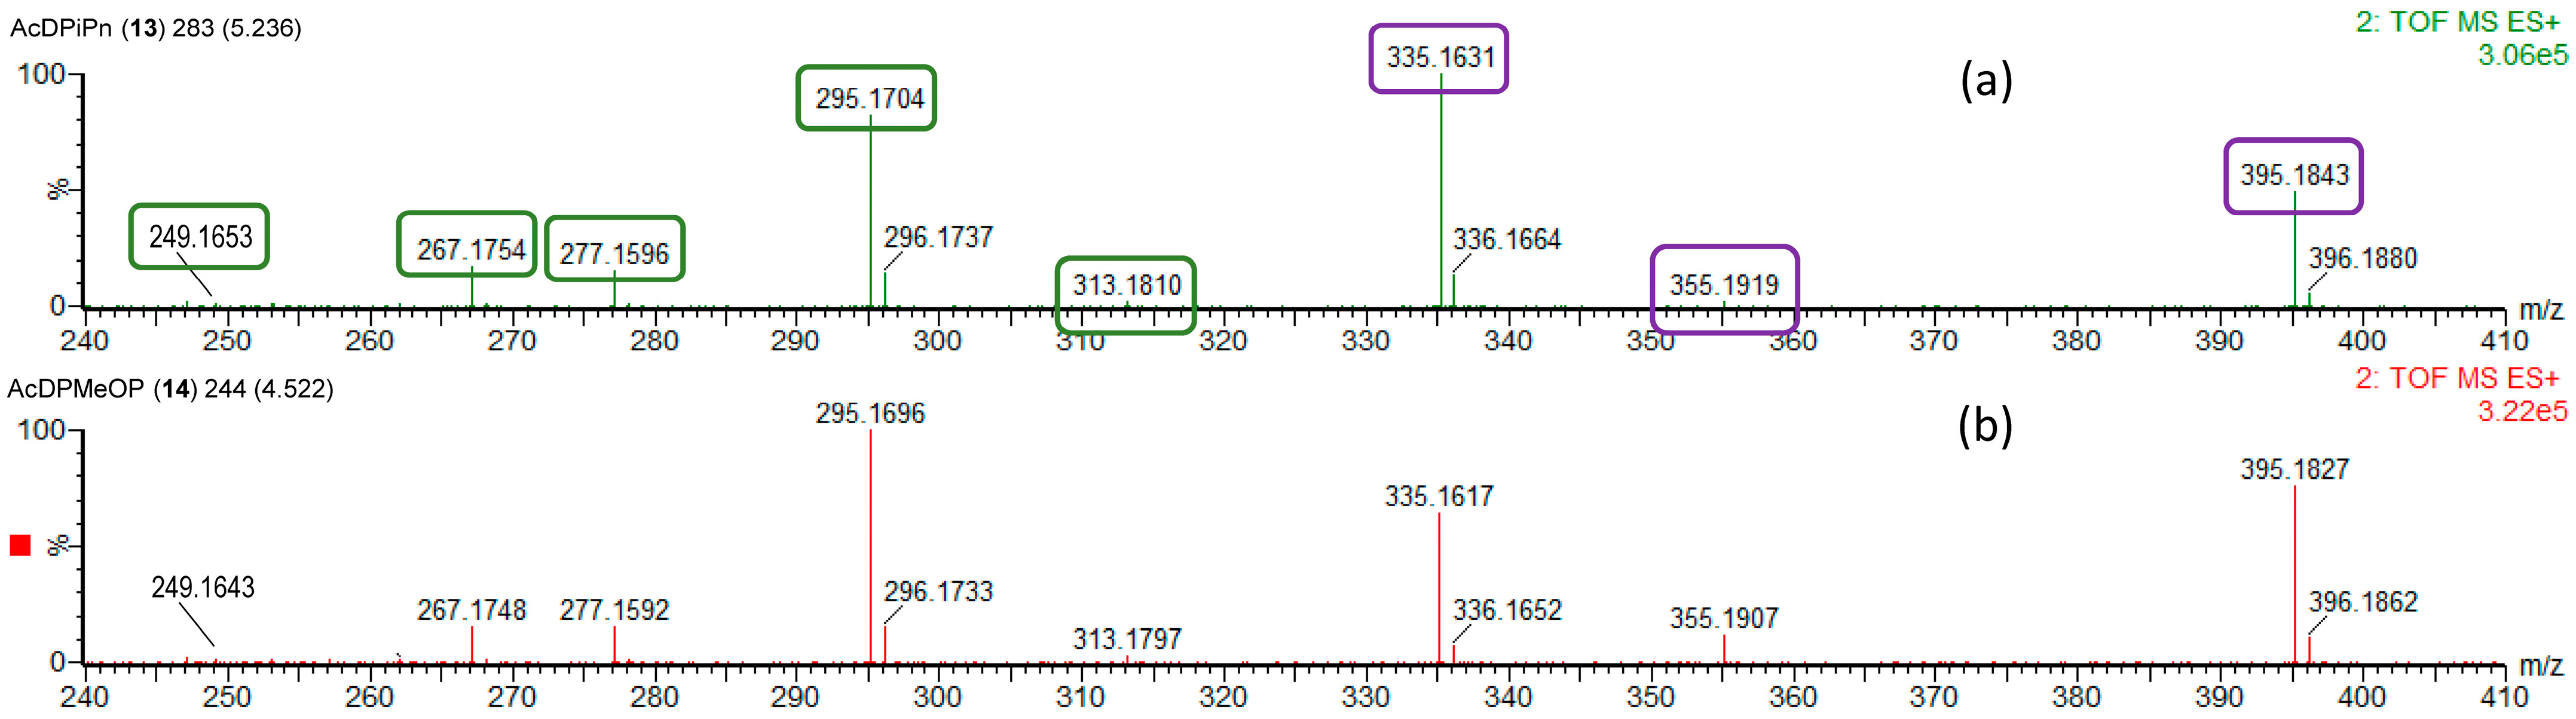
14. Daughter ions were observed in their HRMS
E spectra at
m/
z 313.1804, 295.1698, 277.1592, 267.1749 and 249.1643 (calculated), which could be assigned to losses of ketene, ketene and water (1 and 2 molecules), ketene and water and CO and, finally, ketene and 2 molecules of water and CO, respectively, from a precursor ion at
m/
z 355.1909 (calculated) (
Table 5,
Figure 6). Alternatively, the ion at
m/
z 295 (nominal mass) could be understood to originate from the loss of acetic acid from the parent ion at
m/
z 355.1909 (calculated) or from the loss of water from another parent ion at
m/
z 335.1623 (calculated). In turn, ions at
m/
z 355 and 335 (nominal masses) could originate from losses of water or acetic acid, respectively, from an ion at
m/
z 395.1834 (calculated). The latter ion would be prominently apparent (relative to [M + Na]
+ ion) not only in the HRMS
E spectra of compounds
13 and
14, (
Figure S28) but as well as in the HRMS
E spectra of AcDPB (
10), AcDPA (
11) and AcDPP (
12) (
Figure S26). The formation of this common daughter ion could be understood by the loss of isobutyric, angelic and phenylacetic acid, respectively, from [M + Na]
+ ions for the compounds AcDPB (
10), AcDPA (
11) and AcDPP (
12) and by the loss of carboxilic acids of the formulas C
5H
10O
2 and C
9H
10O
3, respectively, from [M + Na]
+ ions for compounds
13 and
14. The proposed fragmentation pathways leading to previously described ions can be found in
Scheme 4 and
Figure S29.
Furthermore, compounds
13 and
14 exhibited
1H and
13C NMR spectra (
Table 3 and
Table 6) very similar to those of AcDPB (
10), AcDPA (
11) and AcDPP (
12), with differences in the nature of the acyloxy fragment at C-13. The
1H NMR spectra of compound
13 showed a doublet at δ
H 0.96 ppm (6.9 Hz, 6H), correlated in the
1H-
1H COSY spectrum with a multiplet at δ
H 2.08 ppm (1H), which, in turn, correlated with a signal at δ
H 2.21 ppm (7.2 Hz, 2H), which is consistent with a 3-methylbutanoate moiety (
Figure S13c). On the other hand, the HSQC experiment showed correlations between these signals and those appearing in the
13C NMR spectrum at δc 22.8 and 22.7 ppm (
q), 27.0 ppm (
d) and 44.4 ppm (
t), which were assigned to C-4′/C-5′, C-3′ and C-2′, respectively (
Figure S13d,e). Correlations observed in the HMBC between signals assigned to H-2′ with those assigned to C-4′/C-5′ and between signals corresponding to H-3′ and a singlet at δ
C 176.9 ppm, assigned to C-1′ (
Figure S13g,i), confirmed the presence of the 3-methylbutanoate moiety, which would be consistent with the observed loss of a carboxylic acid of the formula C
5H
10O
2 from the [M + Na]
+ molecular ion, in its HRMS
E spectra, as discussed above. A further examination of the NMR data showed that an acetate group can be located at C-20, based on a heteronuclear correlation observed between resonances at δ
H 4.48 ppm (H
2-20) and δ
C 172.6 ppm (R
COO), which, in turn, was further correlated with a singlet at δ
H 2.02 ppm (3H); this, conversely, supported a C-13 location for 3-methylbutanoate substituent. Therefore, a structure of 12-deoxyphorbol 20-acetate 13-(3-methyl)butanoate (AcDPiPn) was assigned to compound
13.
On the other hand, the analysis of the
1H and
13C NMR spectra for compound
14 showed close similarities with those of compound
13; the main differences being the presence of a group of
1H and
13C resonances correlated in the HMBC spectrum [δ
C 175.7 ppm (C-1′), δ
H 3.56 ppm (
s, 2H, H-2′); δ
C 127.1 ppm (C-3′), δ
H 6.86 ppm (
d, 8.4 Hz, 2H, H-4′/8′); δ
C 131.4 ppm (C-4′/8′), δ
H 7.18 ppm (
d, 8.4 Hz, 2H, H-5′/7′); δ
C 160.6 ppm (C-6′), δ
H 3.77 ppm (s 3H, C-9′ (OC
H3)] (
Figure S14g–i) and assigned to a
p-methoxyphenylacetoxy group, and the absence of signals consistent with a 3-methylbutanoate group. The presence of a
p-methoxyphenylacetoxy group would be consistent with the observed loss of a carboxylic acid of the formula C
9H
10O
3 from the [M + Na]
+ molecular ion in its HRMS
E spectra, as described above. Therefore, a structure for compound
14 was proposed as 12-deoxyphorbol 20-acetate 13-(
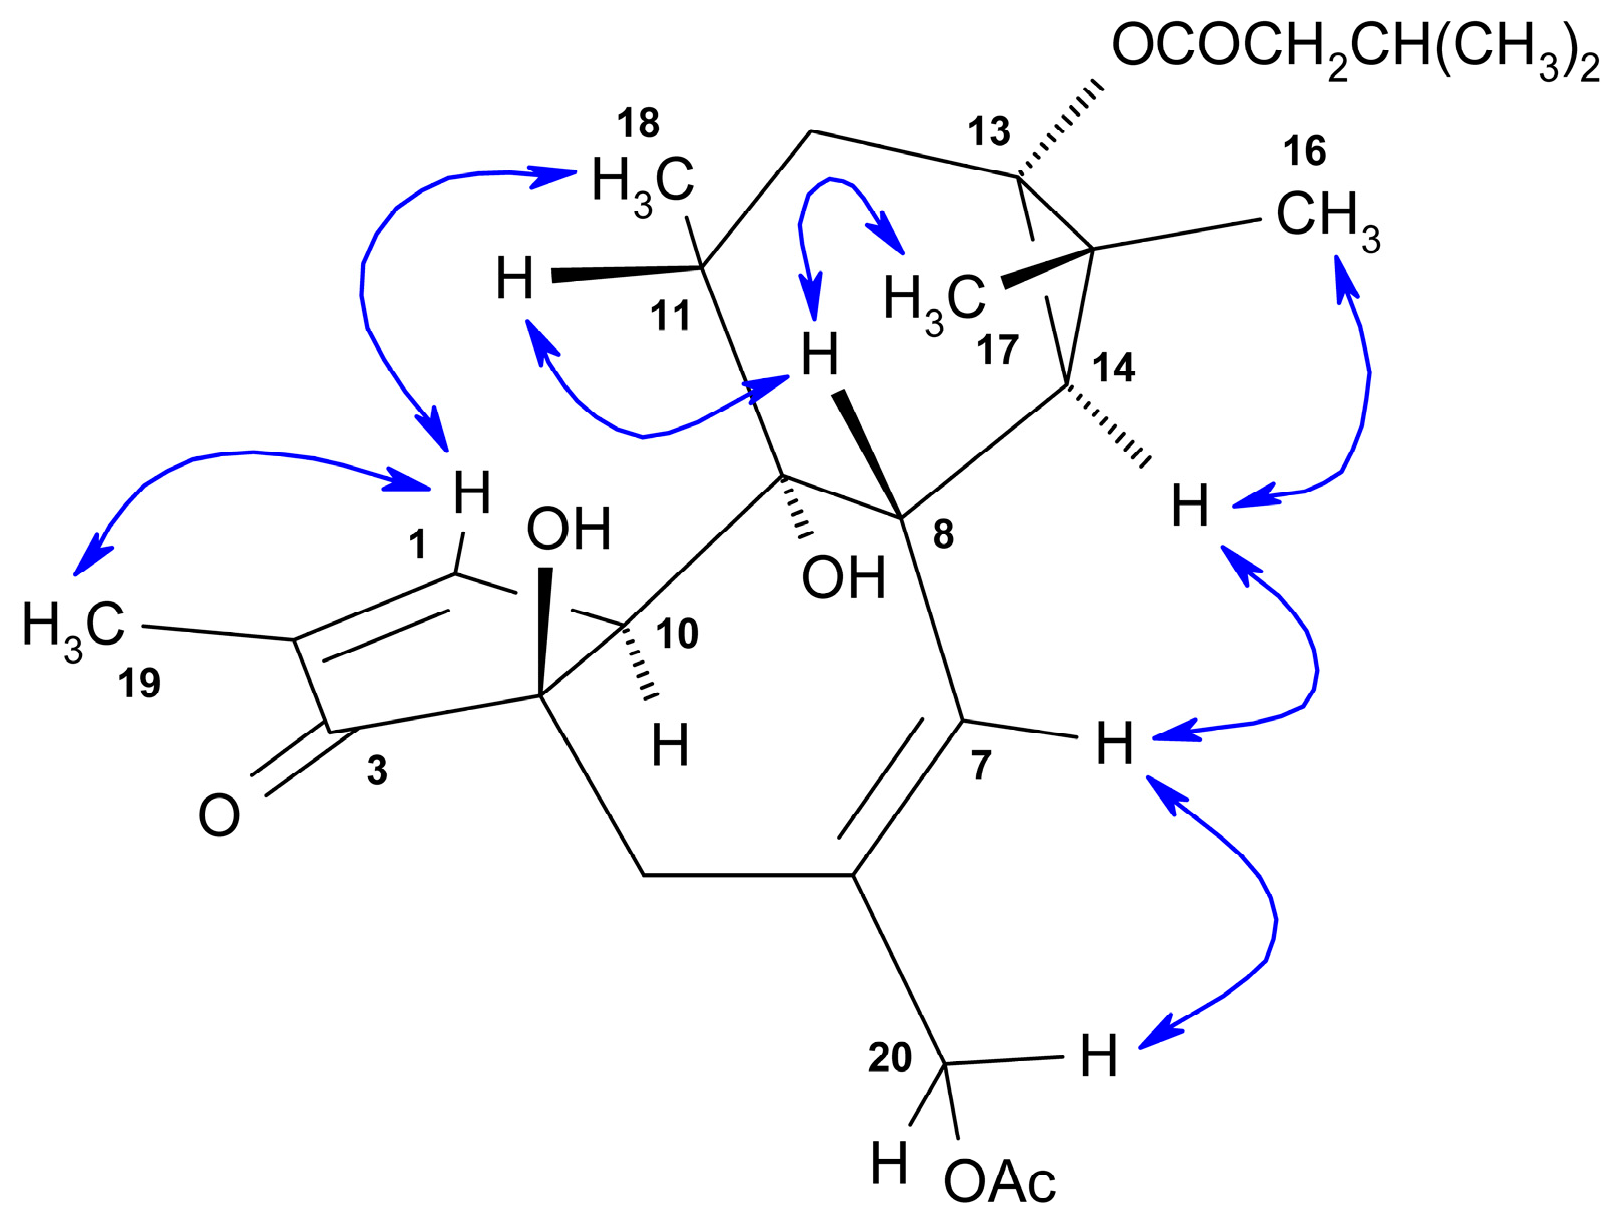
p-methoxy)phenylacetate (AcDPMeOP). NOESY correlations of H
3-19/H-1/H
3-18α and H-11β/H-8β/H
3-17β, on the one hand, and of H
2-20/H-7/H-14α/H
3-16α, on the other (
Figure 7 for AcDPiPn (
13)), were consistent with a relative configuration 4
R(S),
8S(R),9
S(R),10
S(R),11
R(S),13
S(R),14
R(S) for both AcDPiPn (
13) and AcDPMeOP (
14).
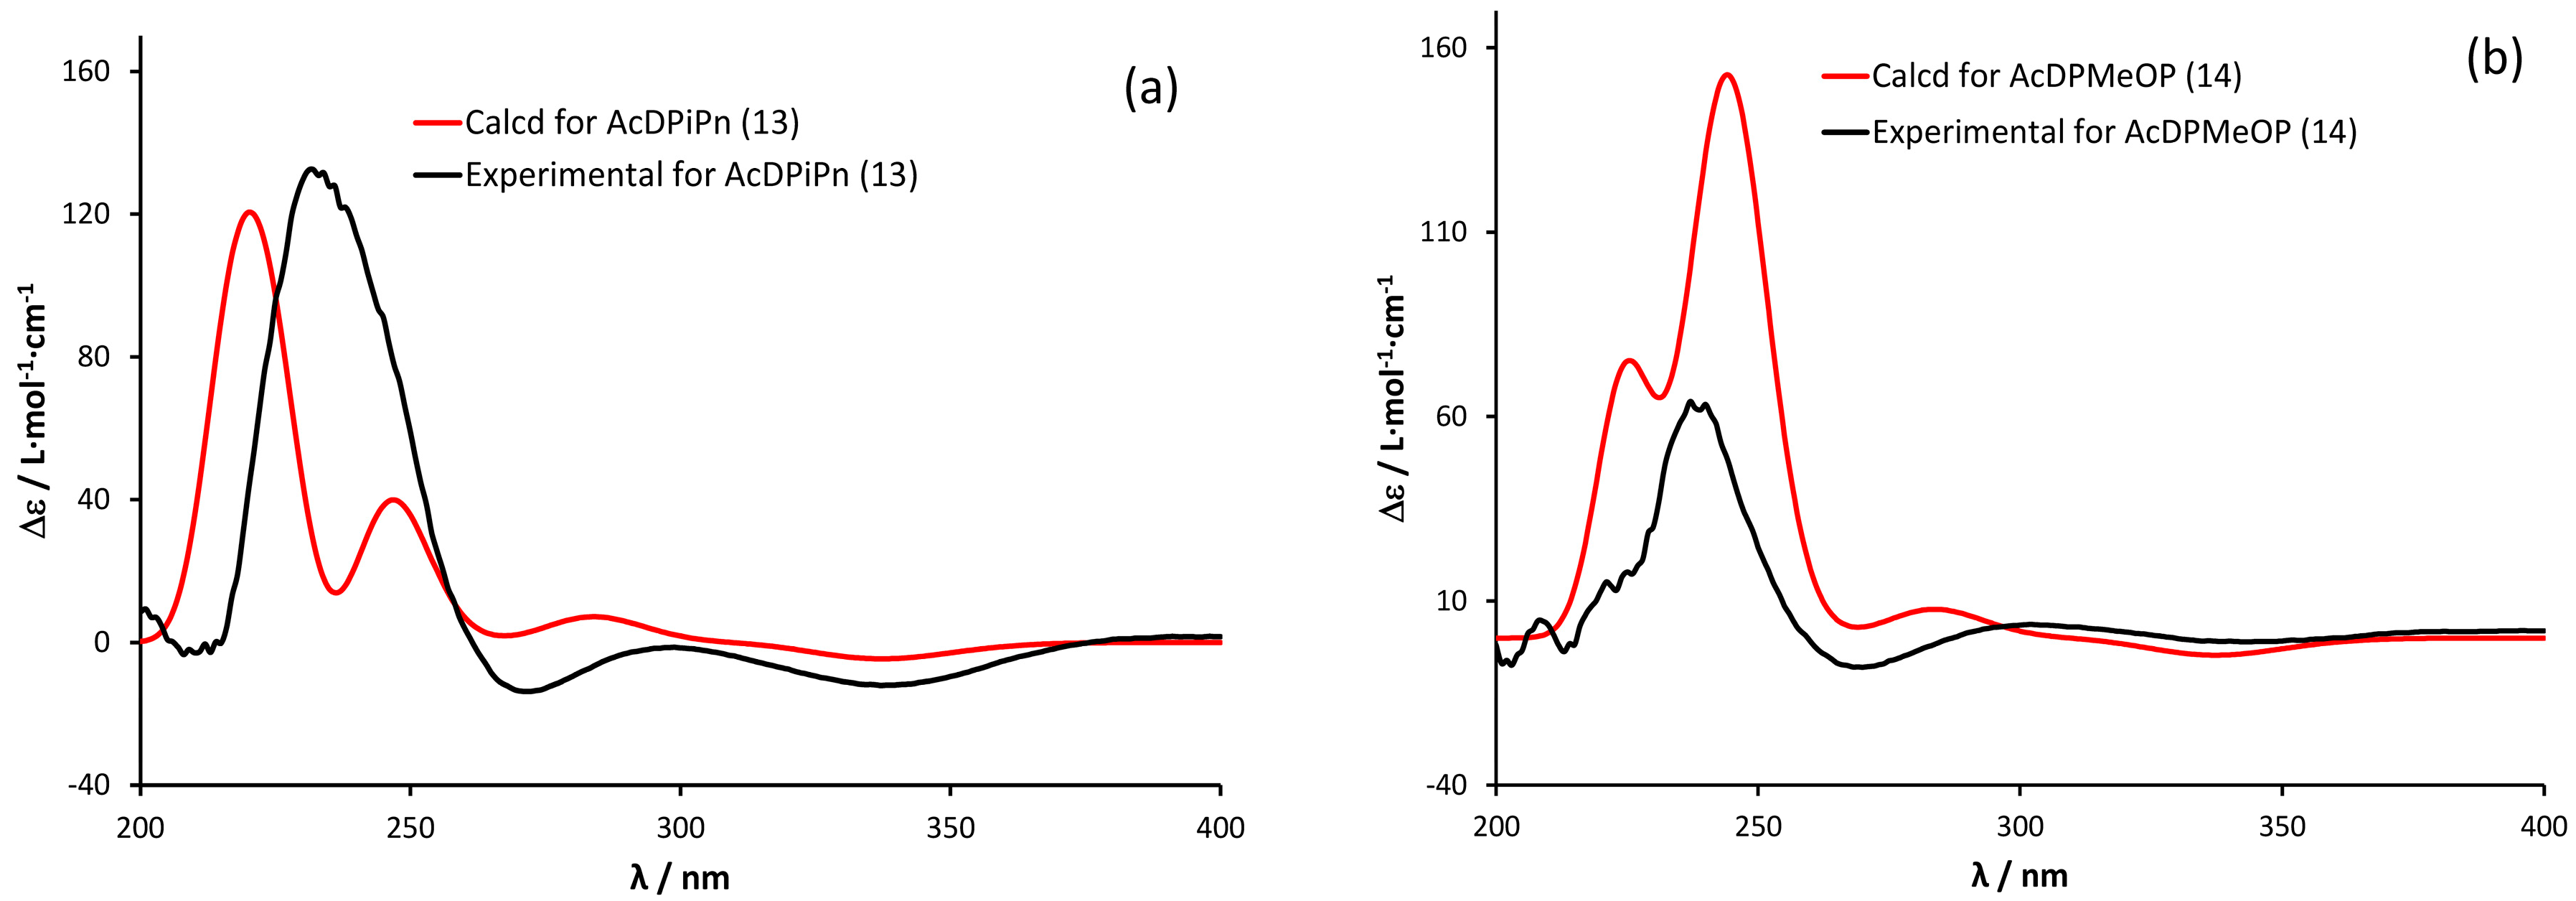
The absolute configuration for compounds
13 and
14 was determined by the comparison of their experimental electronic circular dichroism (ECD), with the computed ECD spectrum for their 4
R,8
S,9
R,10
S,11
R,13
S,14
R steroisomers, calculated from quantum mechanical time-dependent density functional theory (TDDFT) calculations with a 6–31 + G(d,p) level of theory, using the Gaussian 16 program [
28]. As illustrated in
Figure 8a,b, the calculated and theoretical ECD curves matched well, leading to the assignment of the structure and absolute configuration of compounds
13 and
14, respectively, as (4
R,8
S,9
R,10
S,11
R,13
S,14
R)-12-deoxyphorbol 20-acetate 13-(3-methyl)butanoate (AcDPiPn) and (4
R,8
S,9
R,10
S,11
R,13
S,14
R)-12deoxyphorbol 20-acetate 13-(
p-methoxy)phenylacetate (AcDPMeOP). These absolute configurations match what has been described previously for other tigliane derivatives [
29]. Compound
13 is described here for the first time, while a compound with the proposed structure for compound
14 and labeled as RL10, obtained from
E. resinifera, had been described previously [
27], but without a detailed assignment of its spectroscopic and spectrometric data.
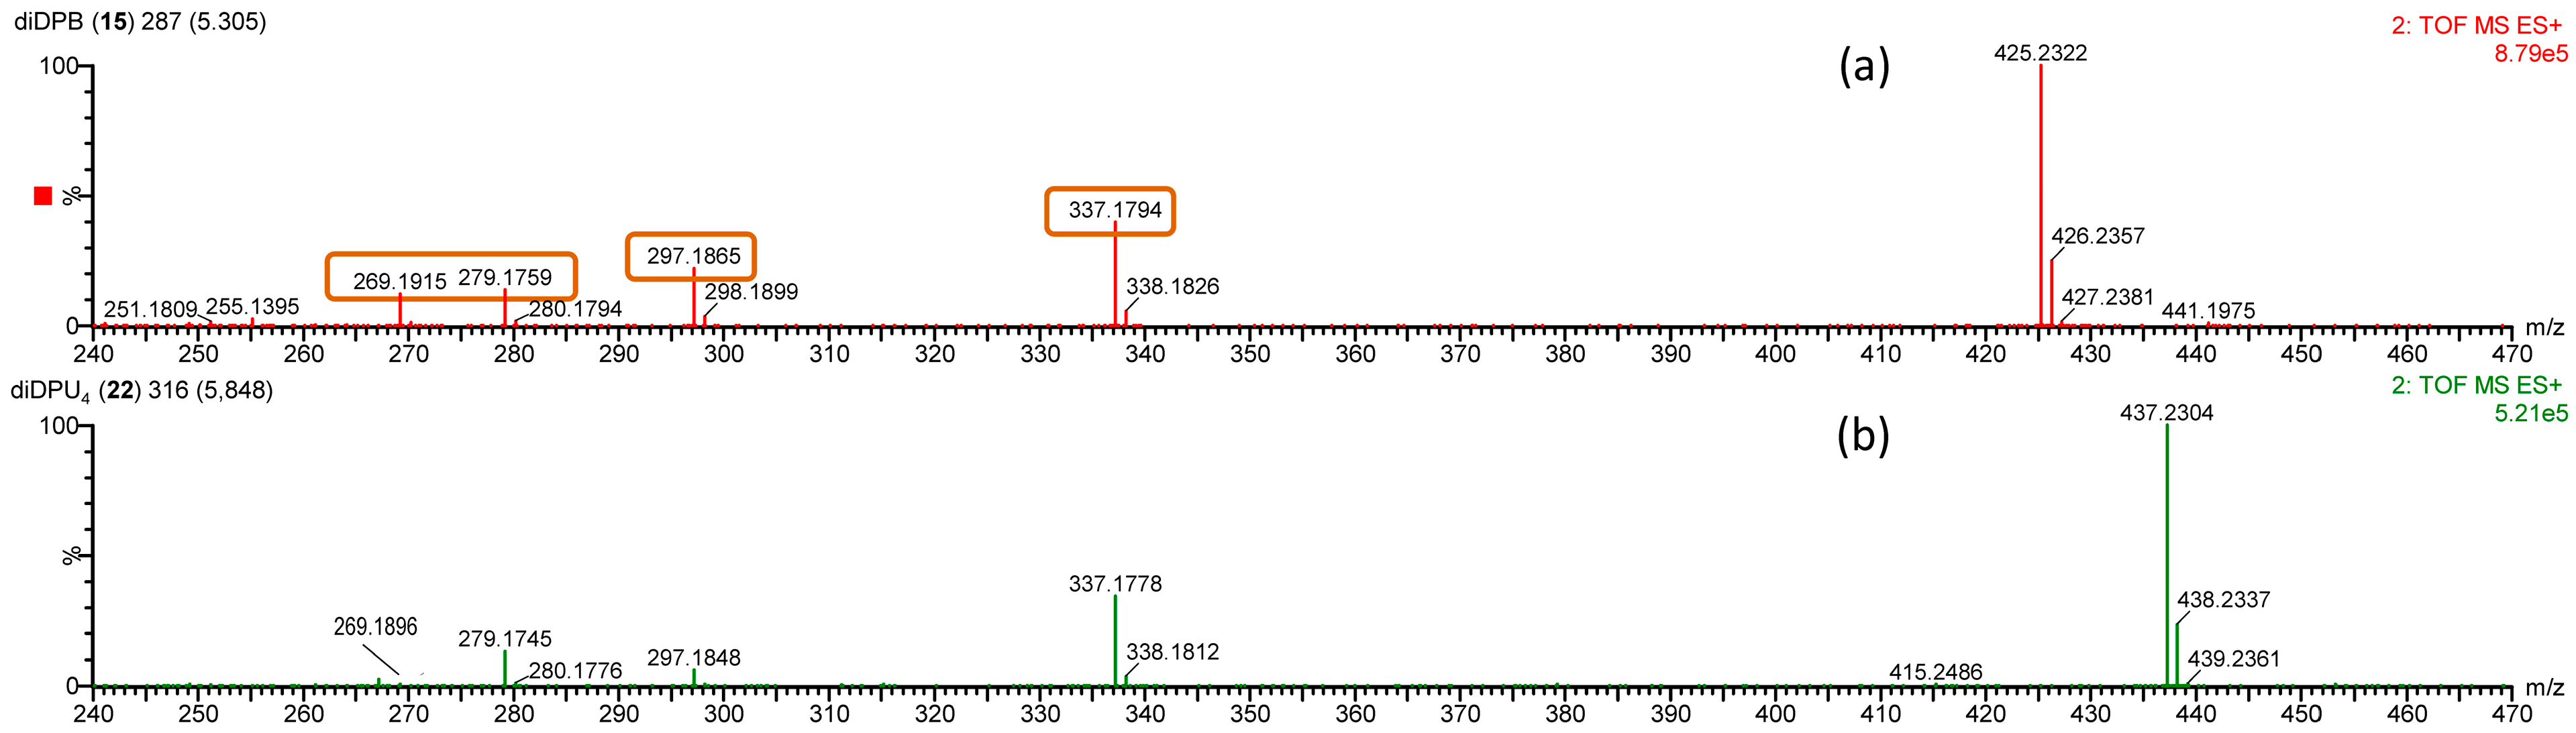
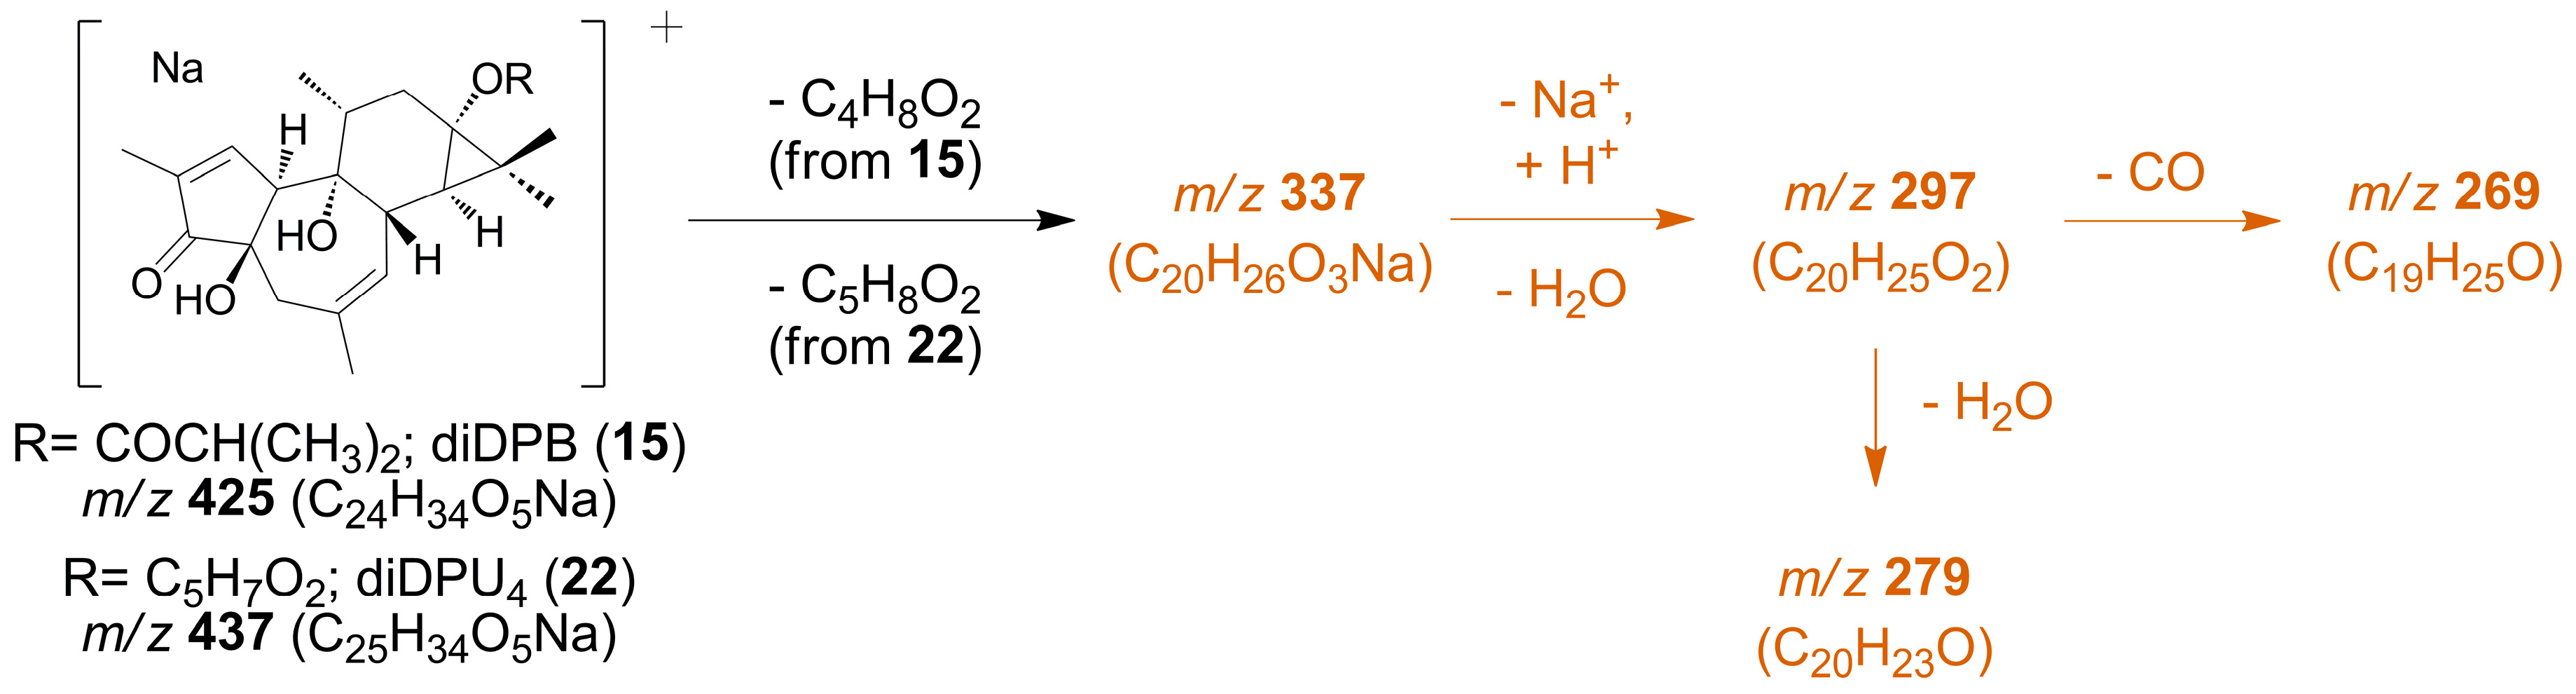
Finally, compound
15 was isolated as an amorphous powder and showed a [M + Na]
+ molecular ion in its HRMS
E spectrum at
m/
z 425.2322 (calcd for C
24H
34O
5Na, 425.2304) (
Table 7,
Figure 9), which allows for the assignment of molecular formula C
24H
34O
5 for compound
15. Daughter ions from this molecular ion were observed in its HRMS
E spectra at
m/
z 337.1780, 297.1855, 279.1749 and 269.1905 (calculated) which could be assigned to losses of a neutral fragment of formula C
4H
8O
2 and further losses of water, 2 molecules of water and a loss of water and CO, respectively (
Table 7,
Figure 9). A proposed fragmentation pathway leading to previously described ions can be found in
Scheme 5 and
Figure S30. A similar loss of a neutral fragment of formula C
4H
8O
2 can be observed in the HRMS
E of 12-deoxyphorbol 13-isobutyrate (DPB,
7) (see
Table S2,
Figure S24).
This compound presented
1H and
13C NMR spectra (
Table 3 and
Table 6) with similar signals to those presented by 12-deoxyphorbol 13-isobutyrate (DPB (
7)); the main differences were the absence of a signal corresponding to a hydroxymethylene group at C-20 and the presence of a new methyl group (δ
H 1.73 ppm, δ
C 25.8 ppm). This
1H-NMR signal correlates, on the one hand, with the
13C-NMR resonances for C-5, C-6 and C-7 in the HMBC experiment (
Figure S15f–h) and, on the other, with the resonance signals for H-5a, H-5b, H-7 and H-8 in the
1H-
1H COSY spectrum (
Figure S15c). Therefore, this is consistent with the presence of a methyl group at C-20 and supported the assignment of compound
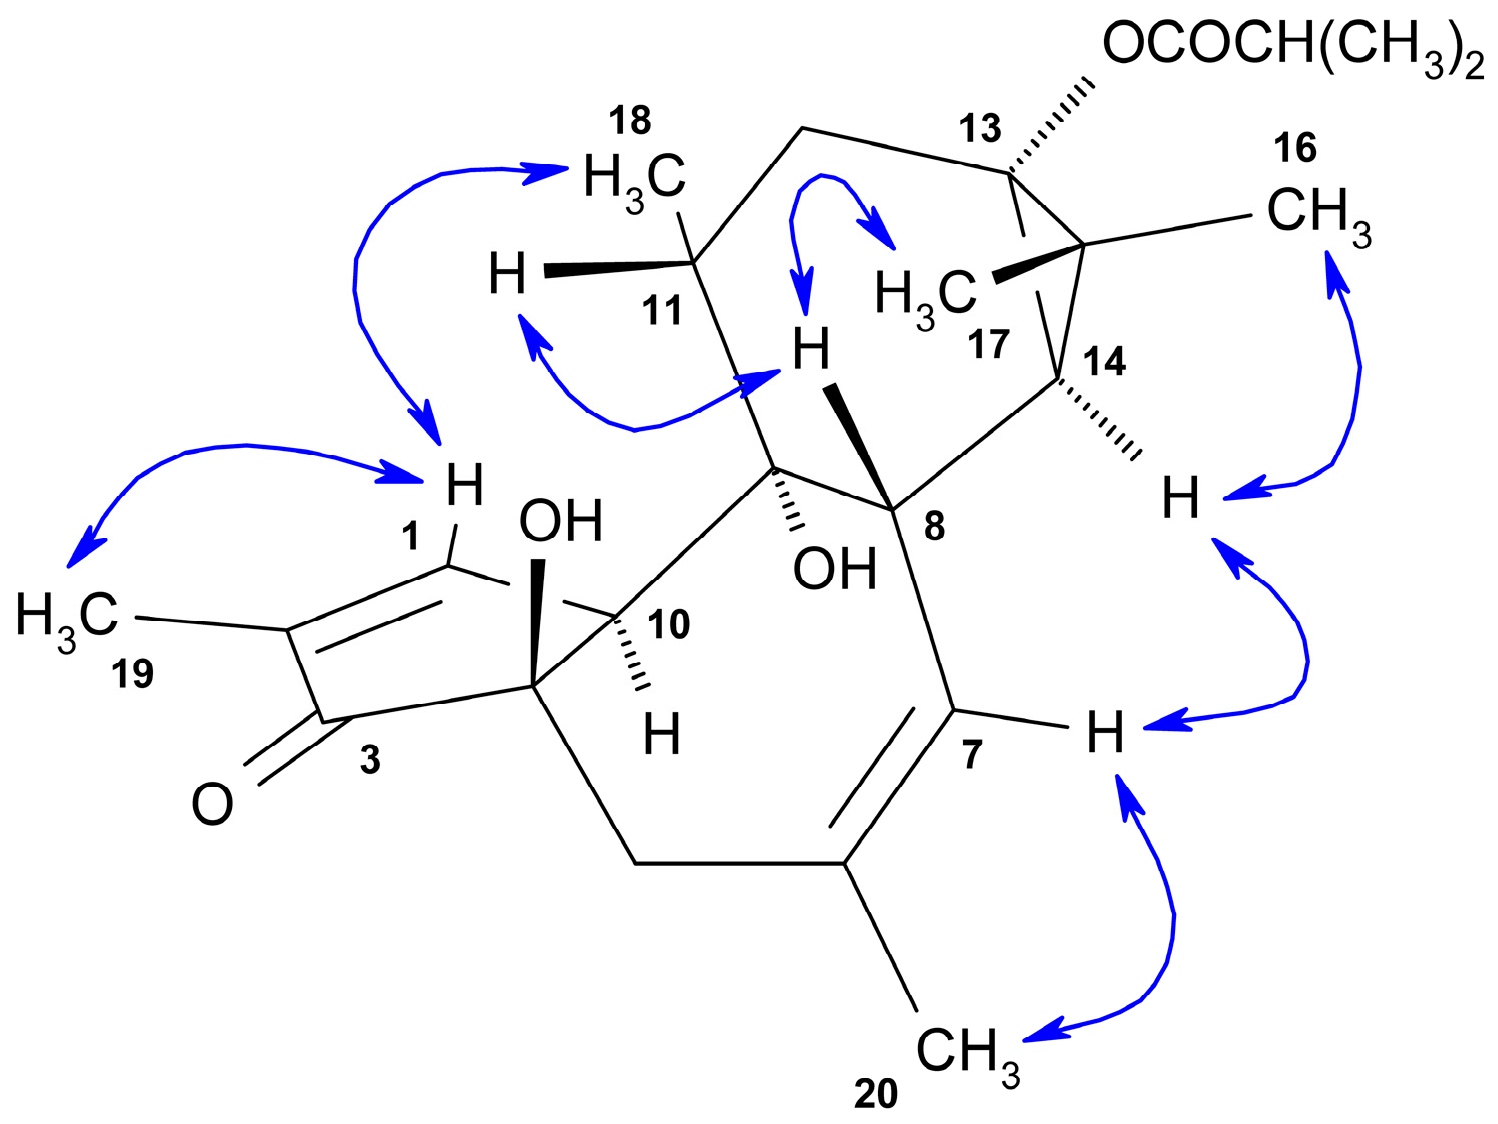
15 as 12,20-dideoxyphorbol 13-isobutyrate (diDPB). NOESY correlations of H
3-19/H-1/H
3-18α, H-11β/H-8β/H
3-17β and H
3-20/H-7/H-14α/H
3-16α (
Figure 10) were in agreement with a relative configuration 4
R(S),8
S(R),9
R(S),10
S(R),11
R(S),13
S(R),14
R(S) for compound
15, which is in accordance with the one previously described for other tigliane derivatives [
29].
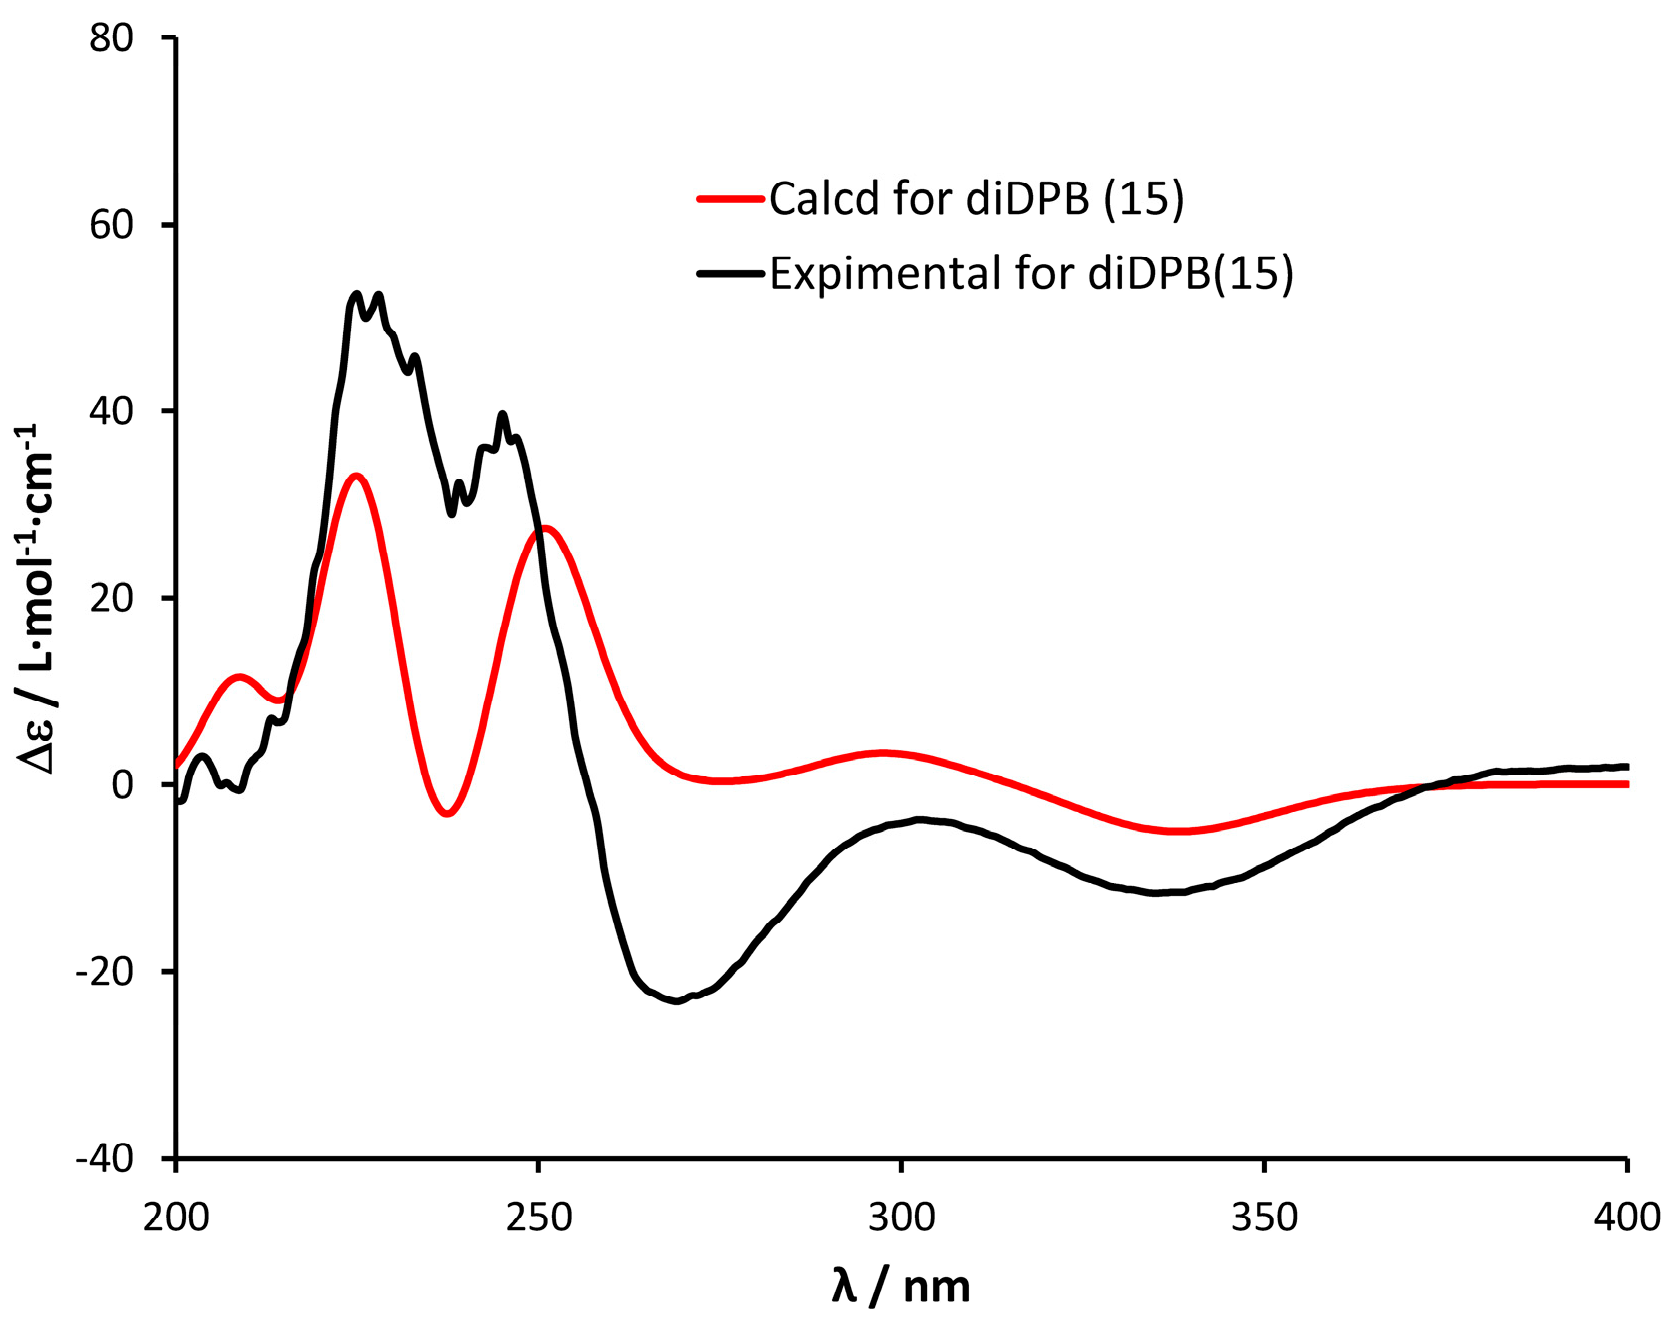
The absolute configuration for compound
15, based on the data described above for AcDPiPn (
13) and AcDPMeOP (
14), was proposed as 4
R,8
S,9
R,10
S,11
R,13
S,14
R. The comparison of the experimental electronic circular dichroism (ECD) spectra with the computed ECD spectra [
28] for compound
15 (
Figure 11) showed that both were in good agreement which, in turn, led to the assignment of the structure and absolute configuration of
15 as (4
R,8
S,9
R,10
S,11
R,13
S,14
R)-12,20-dideoxyphorbol 13-isobutyrate (diDPB). As mentioned above, this absolute configuration also matches with what has been described previously for other tigliane derivatives [
29]. Compound
15 had been previously described by Hergenhahn et al. [
27,
35] but no detailed discussion of its structural characterization could be found there. On the other hand, Kulyal et al. reported its isolation from the seed oil of
Jatropha curcas but the spectroscopic data described were scarce and incorrect [
36].
Some conclusions can be drawn from the ECD spectra presented in this work. On the one hand, no clear influence of substituents at C-16 in 12-deoxy-16-hydroxyphorbol esters described here (
1–
6), on the Cotton effects in the ECD spectra, can be drawn from the experimental data (see
Figure 5 and
Figure S19). Several Cotton effects, due to π → π* transitions, have been described for 12,13-disubstited phorbol esters (no ester at C-16) in the range between 200 and 260 nm in their ECD spectra [
37]. Equivalent ones in 12-deoxy-16-hydroxyphorbol esters (
1–
6) seem to be overlapping in their experimental ECD spectra, which is consistent with what is observed in the corresponding calculated ECD spectra (see, for instance,
Figure 5a for observed and calculated ECD spectra for AcDPPI (
4)).
On the other hand, the calculated ECD spectra for 12-deoxyphorbol esters
13 and
14 and for 12,20-dideoxyphorbol ester
15, predict positive, non-overlapped Cotton effects in the 220–240 nm and 240–260 nm ranges, which can be attributed to transitions π → π* [
38]. These Cotton effects can be observed in the experimental ECD spectra for diDPB (
15) (
Figure 11).
Finally, resiniferatoxin (
16) [
39] and two known tricyclic esters of ingol type (
17,
18) [
9,
12,
27] were also identified by a comparison of their spectroscopic and spectrometric data with those reported in the literature.
2.2. Identification of 12-Deoxyphorbol Derivatives by UHPLC-HRMSE: Targeted and Biased Non-Targeted Analysis
As a result of the analysis of the structural elucidation of 12-deoxyphorbols 1–15, as described above, specific fragmentation patterns are observed in their high-energy HRMSE spectra, which can be associated with specific structural classes (groups A–E), namely:
- A.
12-Deoxy-16-hydroxyphorbol 13,16-diacyl derivatives (
1–
3) (
Scheme 1).
- B.
12-Deoxy-16-hydroxyphorbol 20-acetate 13,16-diacyl derivatives (
4–
6) (
Scheme 2).
- C.
12-Deoxyphorbol 13-acyl derivatives (
7–
9) (
Scheme 3).
- D.
12-Deoxyphorbol 20-acetate 13-acyl derivatives (
10–
14) (
Scheme 4).
- E.
12,20-Dideoxyphorbol 13-acyl derivatives (
15) (
Scheme 5).
Simplified schemes of the fragmentation routes for each one of the above-mentioned structural classes, with characteristic daughter ions (nominal masses and elemental composition), can be found in
Scheme 1,
Scheme 2,
Scheme 3,
Scheme 4 and
Scheme 5; a more detailed description of the fragmentation patterns, including proposed structures and calculated masses for the daughter ions, can be found in
Figures S20, S22, S25, S29 and S30 in the
Supplementary Materials section.
These characteristic fragmentation patterns, combined with the inclusion of the characteristic [M + Na]
+ ions for each compound, can be applied to a targeted analysis of isolated compounds
1–
15 in the chromatographic fractions used for their isolation, which were initially selected for isolation studies exclusively on the grounds of an initial NMR screening (
Table 8).
As expected, a comparison of the extracted ion chromatograms for ions associated with characteristic fragments for each structural class (A–E) (especially those observed to be more abundant in the HRMS
E spectra of isolated compounds, see
Figure 2,
Figure 4,
Figure 6,
Figure 9 and
Figure S24) and [M + Na]
+ ions for each compound reveals the presence of 12-deoxyphorbols
1–
15 as components in chromatographic fractions F and G-6 to G-9 (
Table 8), in accordance with the isolation experiment results.
On the other hand, this analysis can also be extended to the search for other components which present ions corresponding to characteristic fragmentations of each structural class A–E mentioned above, but not described in the isolation section (biased non-targeted analysis [
40,
41]).
The analysis of the HRMS
E spectra of these components reveals the presence of ions at a higher
m/
z, which could be attributed to the parent ions of the characteristic daughter ions described for the structural classes A–E (
Scheme 1,
Scheme 2,
Scheme 3,
Scheme 4 and
Scheme 5). This, in turn, would allow a level-2 or 3 identification of these components detected and not described in the isolation section [
42]. Following this approach, four additional components have been identified in the chromatographic fractions of
E. resinifera (
Table 8).
The analysis of 12-deoxy-16-hydroxyphorbol 13,16-diesters daughter ions (group A compounds,
Scheme 1) leads to the identification of component
19 (DPPU
1) in fraction G-9 (entry 25,
Table 8) with an observed proposed parent ion [M + Na]
+ at
m/
z 589.2787 (calcd for C
33H
42O
8Na, 589.2777) (
Figure 2d,
Table 1). A structure of 12-deoxy-16-hydroxyphorbol 13,16-diester is attributed to this component, where the ester side chain at C-13 would be a phenylacetate substituent, as suggested by the presence of a daughter ion at
m/
z 487.2090 (calcd for C
28H
32O
6Na, 487.2097). Carboxylate moiety at C-16 would be assigned elemental formula C
5H
9O
2, which would correspond to C
5H
10O
2 for the protonated carboxylic acid (
Scheme 1 and
Figure S20). Only one unsaturation would be deduced from such a formula, which, in turn, would be consistent with several possible structures such as pentanoate, 3-methylbutanoate, 2-methylbutanoate or 2,2-dimethylpropanoate; therefore, only a level-3 identification would be possible for DPPU
1 (
19) [
42]. One of the tentative structures for DPPU
1 (
19), 12-deoxy-16-hydroxyphorbol 13-phenylacetate 16-(3-methyl)butanoate, has been described previously as candletoxin B from
E. poisonii [
43].
The analysis of 12-deoxy-16-hydroxyphorbol 20-acetate 13,16-diesters daughter ions (group B compounds,
Scheme 2) leads to the identification of component
20 (AcDPPU
2) in fraction G-7 (entry 13,
Table 8) with an observed proposed parent ion [M + Na]
+ at
m/
z 603.2540 (calcd for C
33H
40O
9Na, 603.2570) (
Figure 4d and
Figure S21e,
Table 9). A structure of 12-deoxy-16-hydroxyphorbol 20-acetate 13,16-diester is proposed for this component, where the ester side chain at C-13 would be a phenylacetate substituent, according to the presence of a daughter ion at
m/
z 529.2205 (calcd for C
30H
34O
7Na, 529.2202). Carboxylate moiety at C-16 would be assigned elemental formula C
3H
5O
2, which, in turn, would correspond to C
3H
6O
2 for the protonated carboxylic acid (
Scheme 2 and
Figure S22). This formula is consistent with the presence of one unsaturation and, therefore, a propionate structure could be assigned to this carboxylate moiety at C-16. Consequently, AcDPPU
2 (
20) could be described as 12-deoxy-16-hydroxyphorbol 20-acetate 13-phenylacetate-16-propionate (level-2 identification [
42]), which to our knowledge has not been described before.
On the other hand, the further analysis of 12-deoxy-16-hydroxyphorbol 20-acetate 13,16-diesters daughter ions (group B compounds,
Scheme 2) leads to the identification of component
21 (AcDPPU
3) in fraction G-8 (entry 18,
Table 8) with an observed proposed parent ion [M + Na]
+ at
m/
z 631.2911 (calcd for C
35H
44O
9Na, 631.2883) (
Figure 4e and
Figure S21f,
Table 9). A structure of 12-deoxy-16-hydroxyphorbol 20-acetate 13,16-diester is attributed to this component, where the ester side chain at C-13 would be a phenylacetate substituent, according to the presence of a daughter ion at
m/
z 529.2214 (calcd for C
30H
34O
7Na, 529.2202). Carboxylate moiety at C-16 would be assigned elemental formula C
5H
9O
2, which would correspond to C
5H
10O
2 for the protonated carboxylic acid (
Scheme 2 and
Figure S22). This formula for the carboxylate moiety, which contains only one unsaturation, would be consistent with several possible structures such as pentanoate, 3-methylbutanoate, 2-methylbutanoate or 2,2-dimethylpropanoate, as described for DPPU
1 (
19), so only a level-3 identification would be possible for AcDPPU
3 (
21) [
42]. One of the tentative structures for AcDPPU
3 (
21), 12-deoxy-16-hydroxyphorbol 20-acetate 13-phenylacetate 16-(3-methyl)butanoate, has been described previously as candletoxin A from
E. poisonii [
43].
Finally, the analysis of 12,20-dideoxy-phorbol 13-isobutyrate (
15) daughter ions (group E compounds,
Scheme 5) leads to the identification of component
22 (diDPU
4) in fraction G-7 (entry 14,
Table 8) with an observed proposed parent ion [M + Na]
+ at
m/
z 437.2304 (calcd for C
25H
34O
5Na, 437.2304) (
Figure 9b,
Table 7). A structure of 12,20-dideoxy-phorbol 13-ester is proposed for this component, where the elemental composition for ester moiety at C-13 (C
5H
7O
2; C
5H
8O
2 for the corresponding carboxylic acid) would be consistent with a tigliate, an angelate or a 3-methylbut-2-enate moiety, so only a level-3 identification would be possible for diDPU
4 (
22) [
42]. One of the tentative structures for diDPU
4 (
22), 12,20-dideoxy-phorbol 13-angelate, has been described before for a component in
E. resinifera [
35].


 ,
, 


