
Ecotoxicological Study of Tannic Acid on Soil and Water Non-Target Indicators and Its Impact on Fluvial and Edaphic Communities


Abstract
:1. Introduction
2. Results
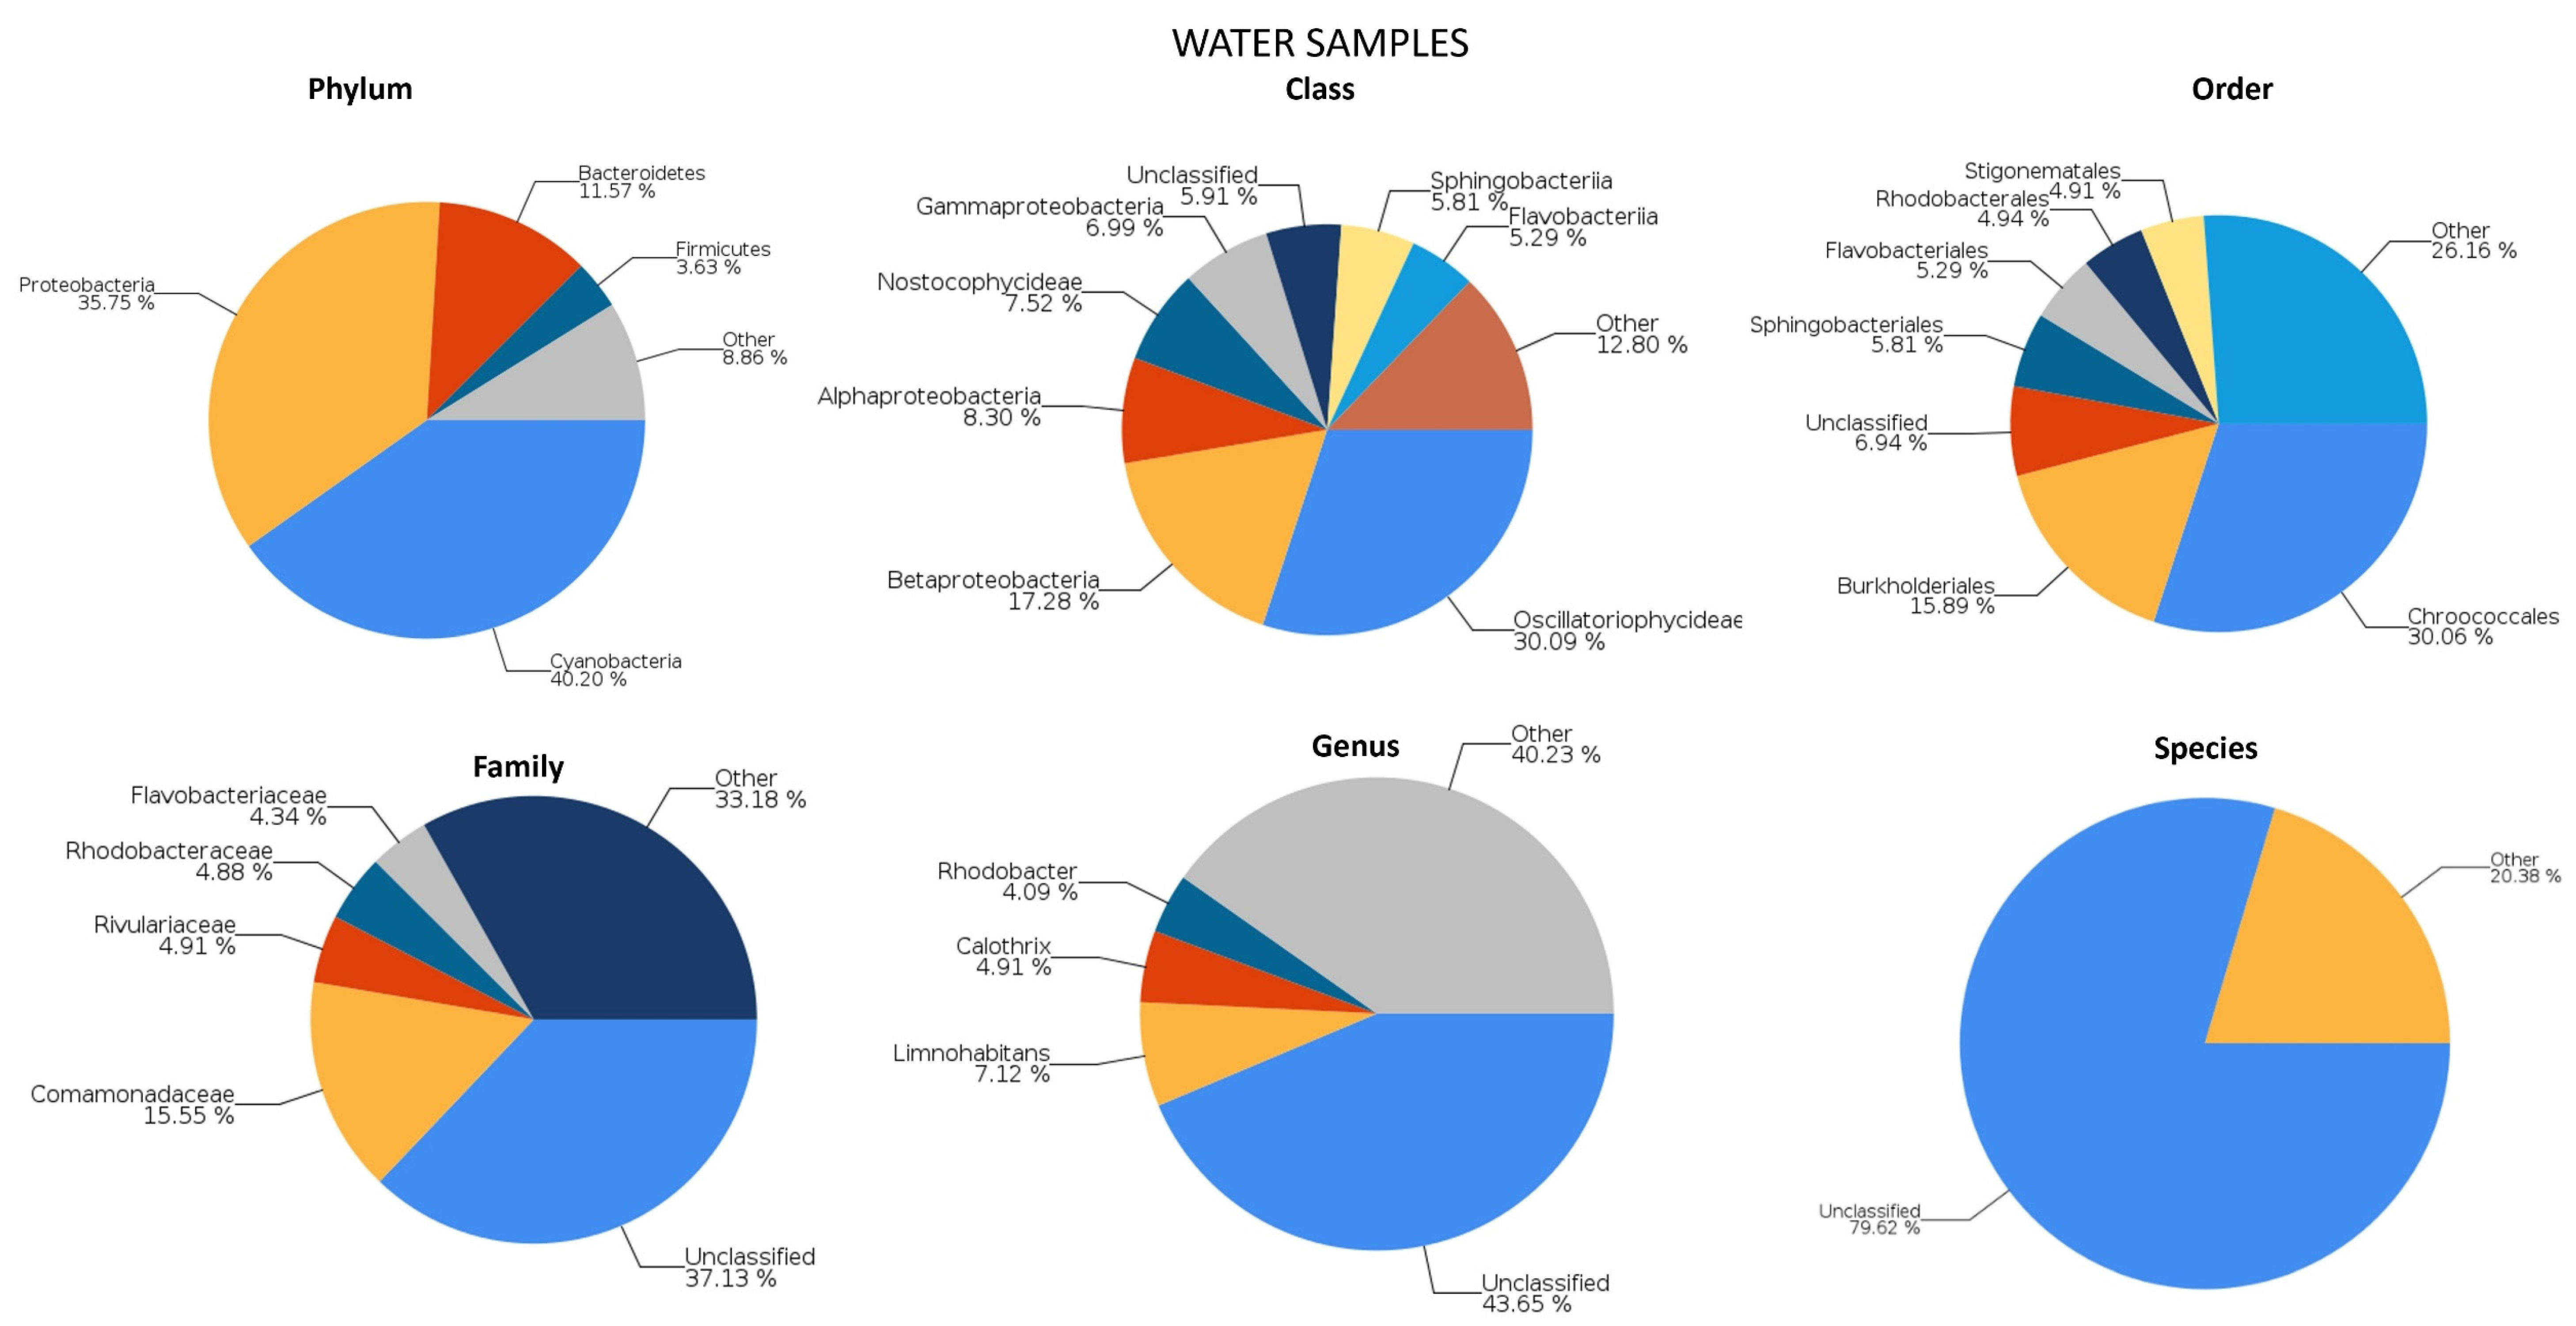
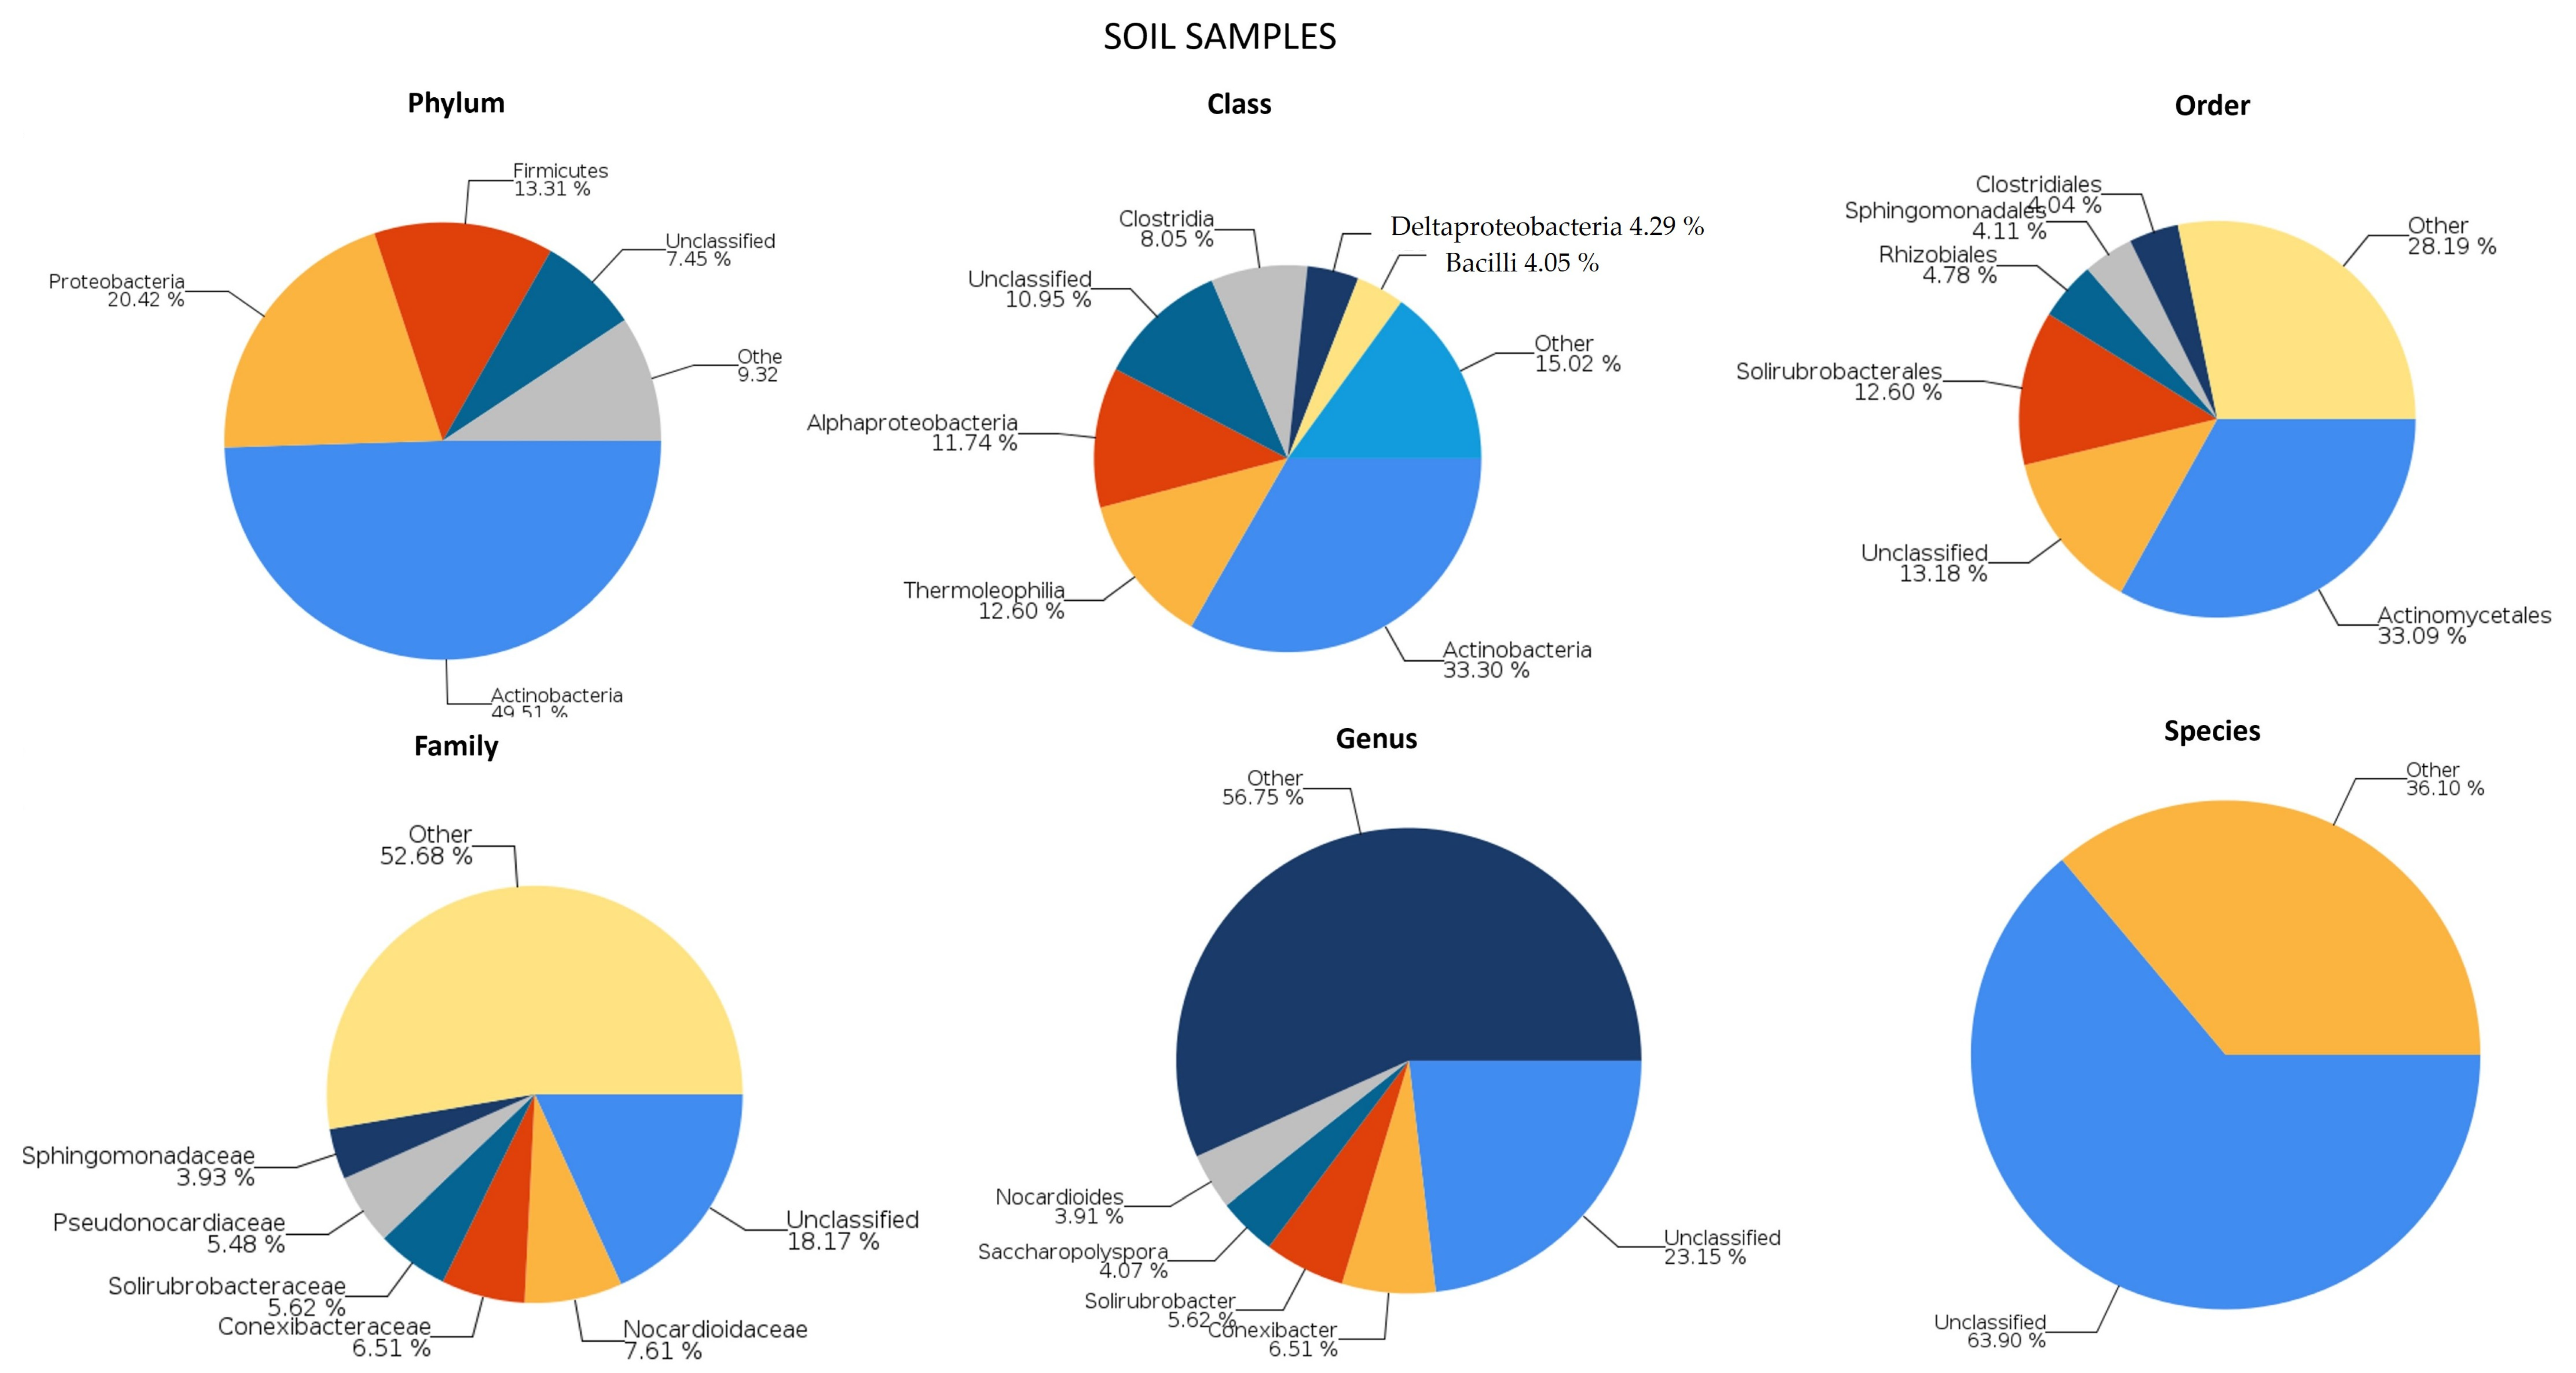
2.1. Genetic Analysis of Microbial Populations
2.1.1. River Communities
2.1.2. Soil Communities
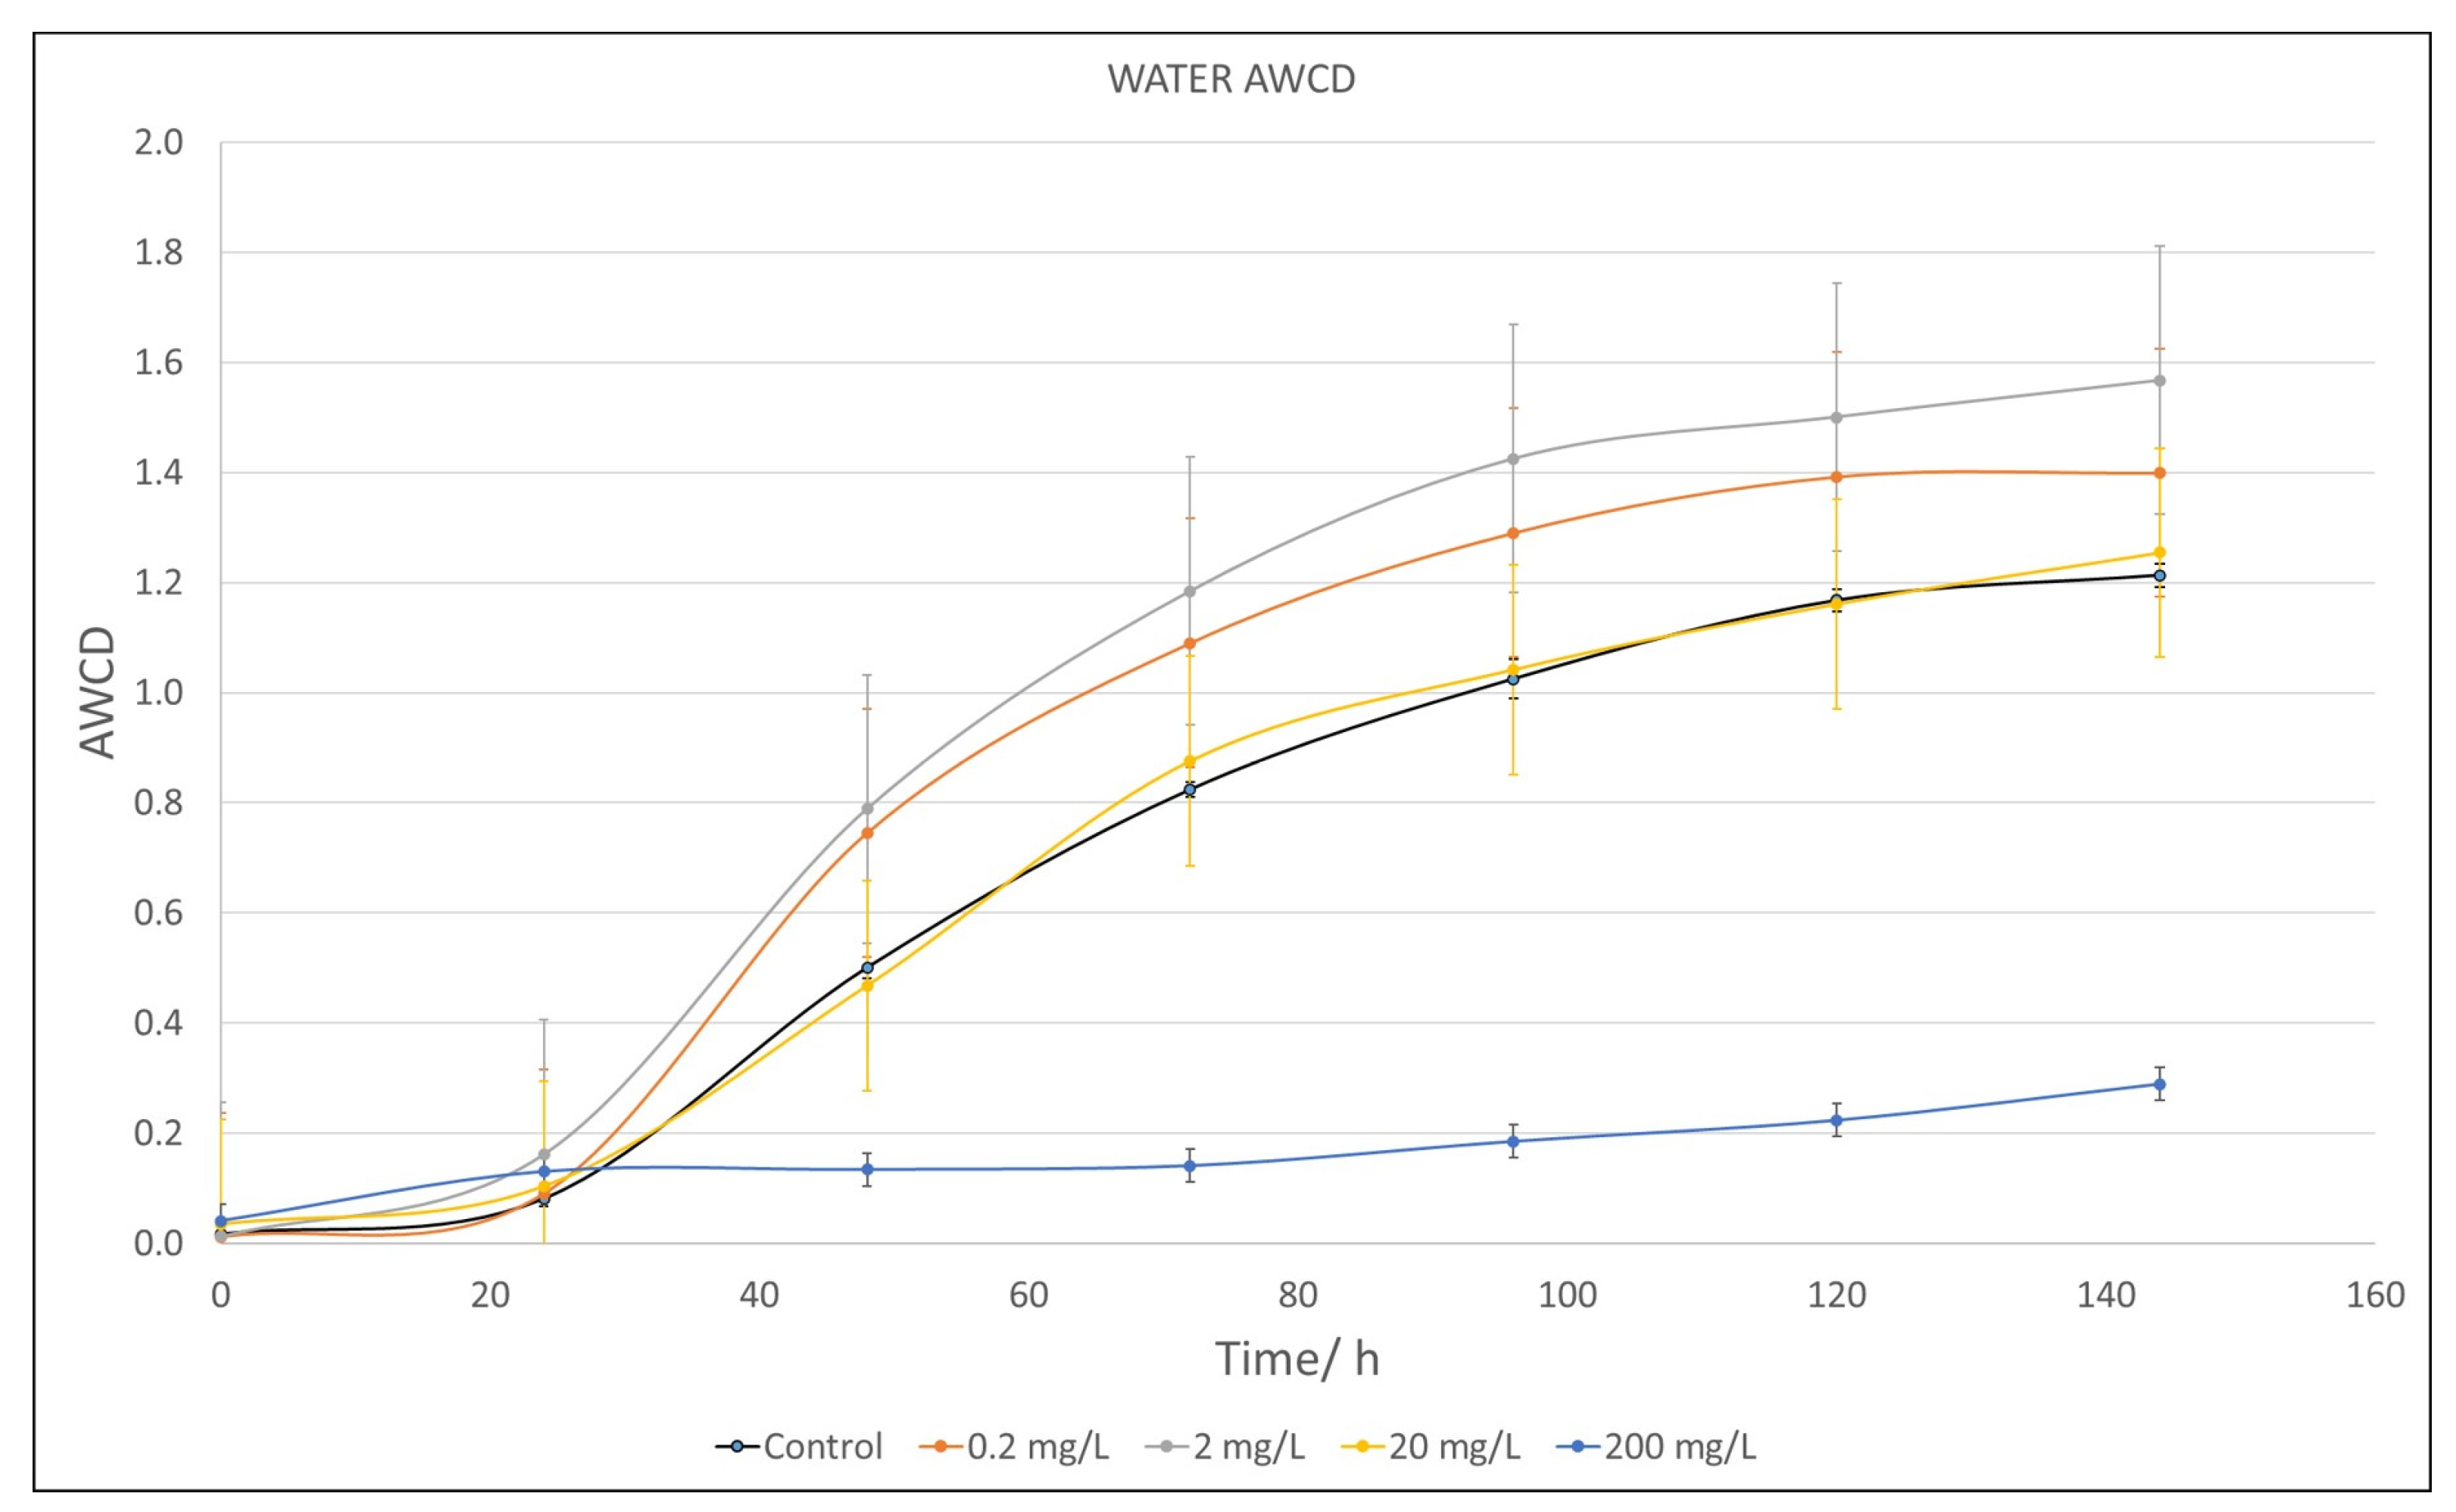
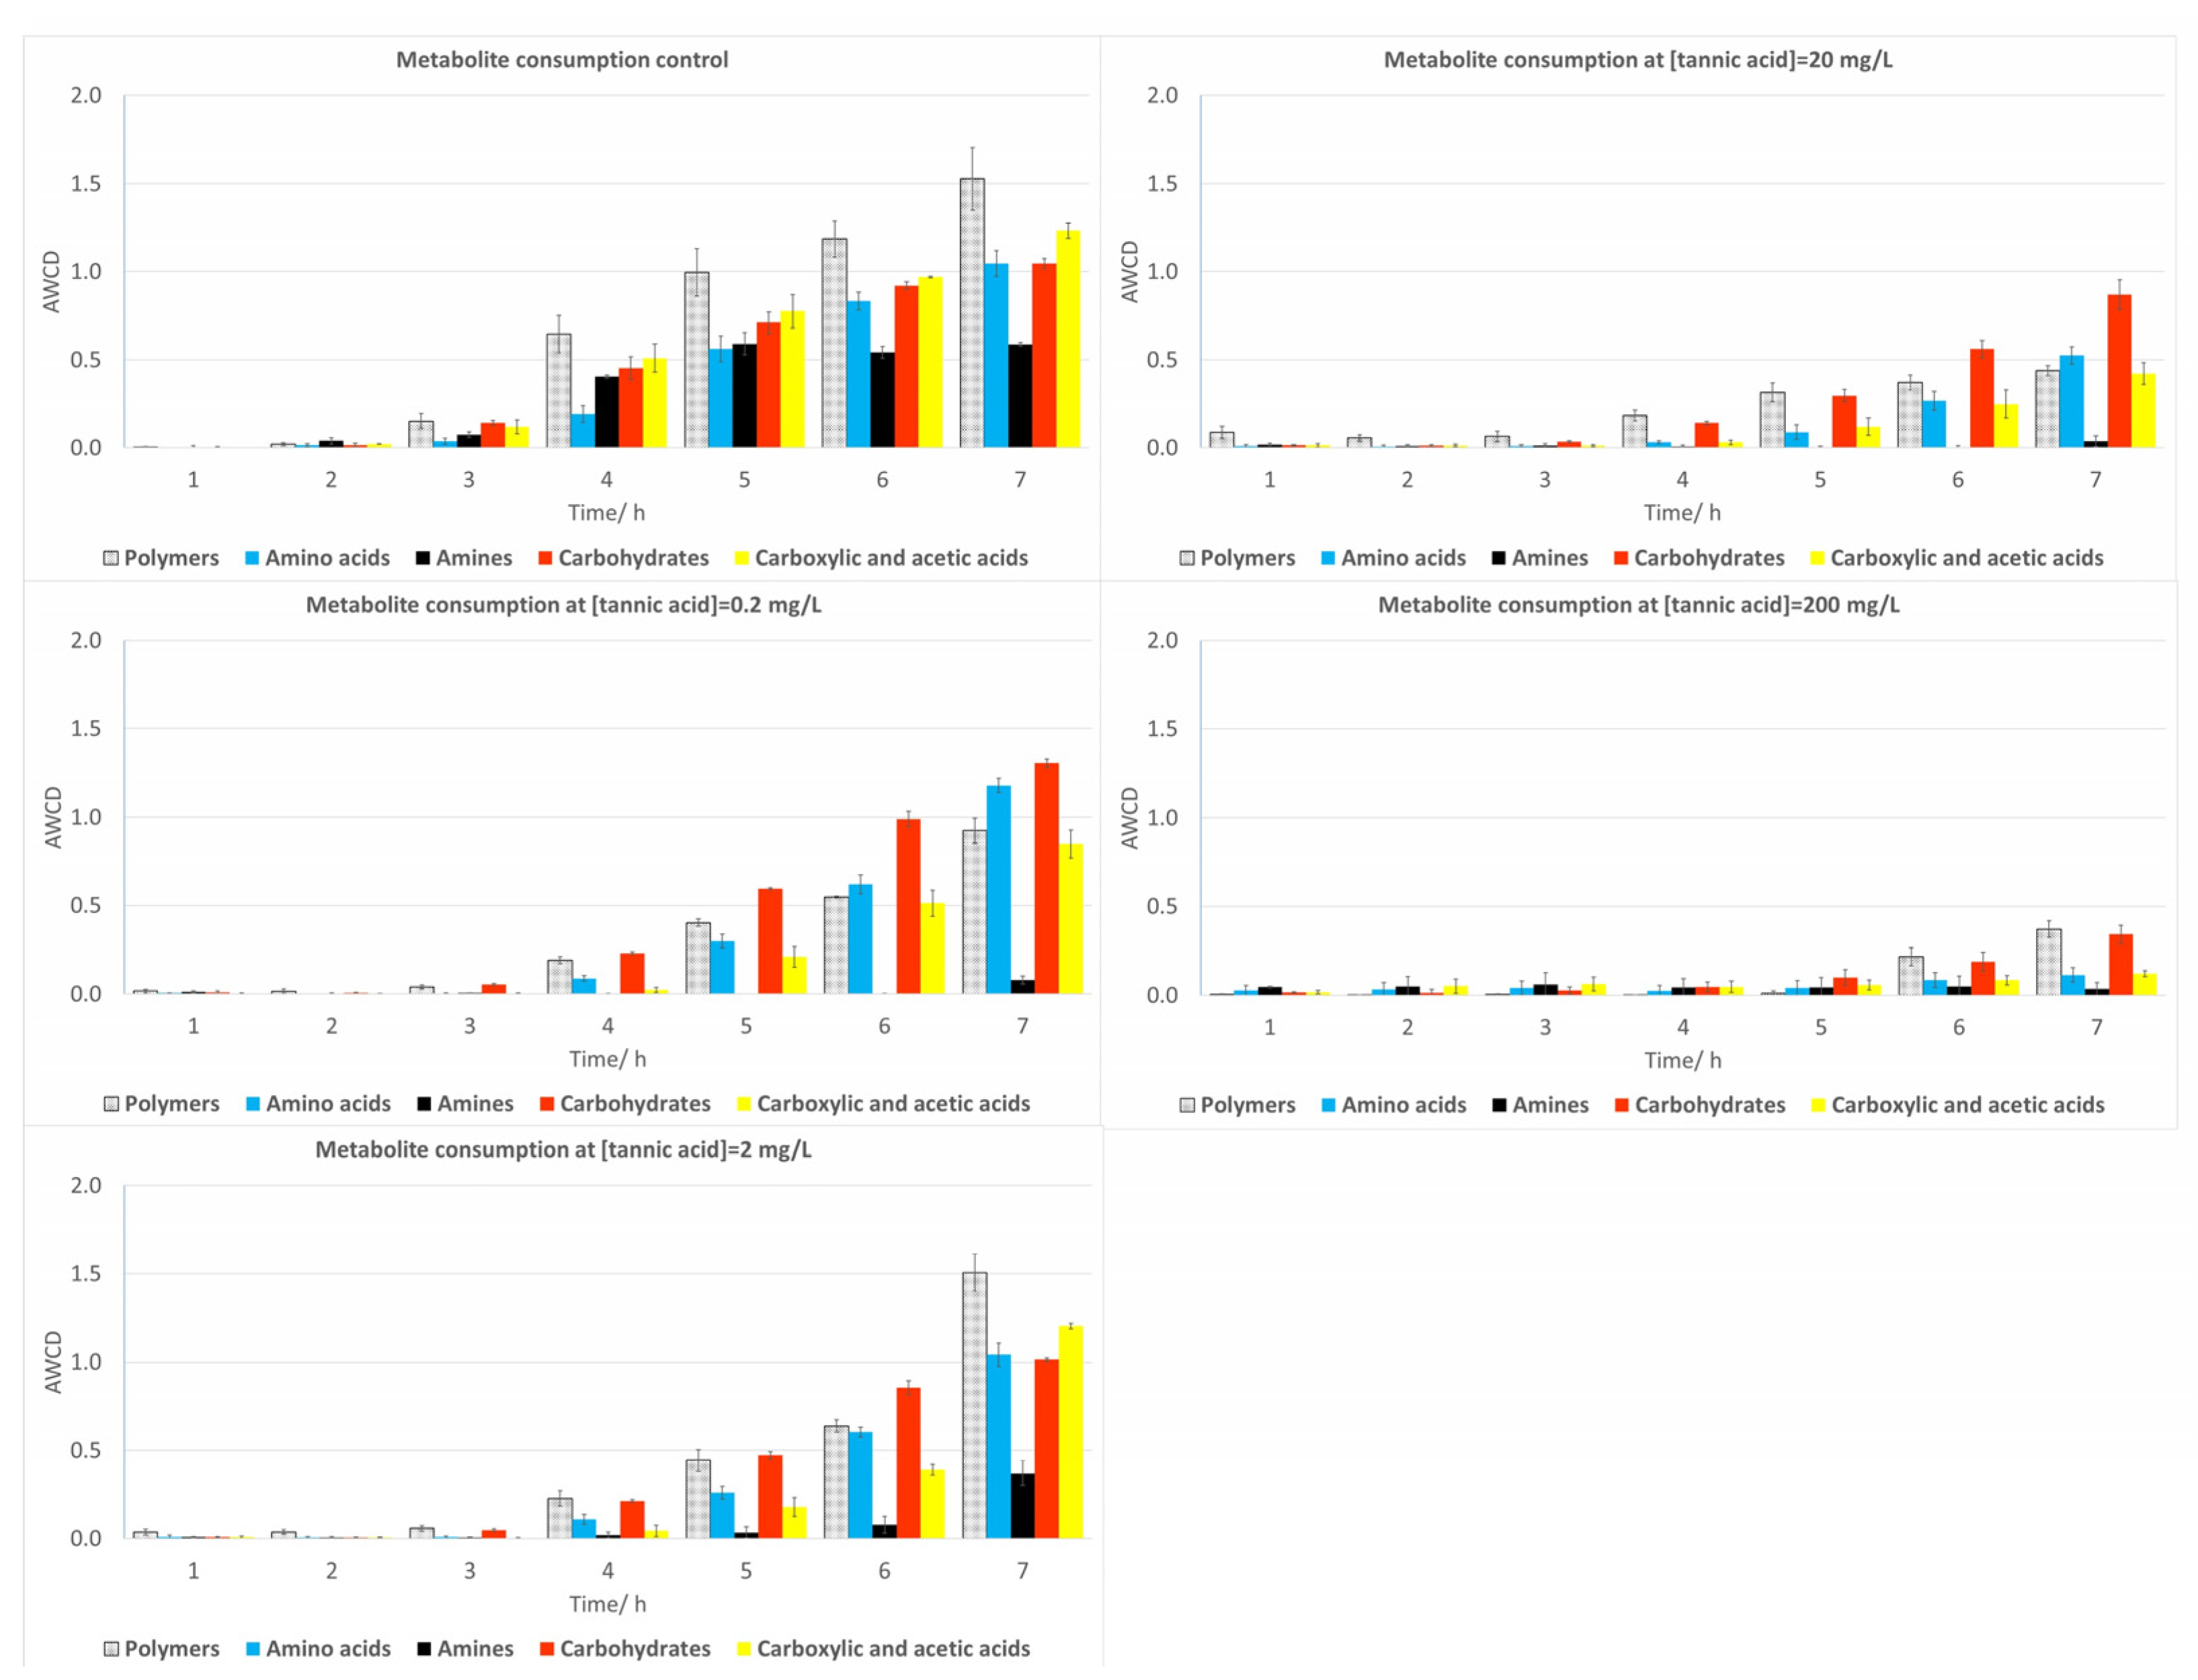
2.2. Average Well Color Development (AWCD) of Microbial Populations
2.2.1. Water Samples
2.2.2. Soil Samples
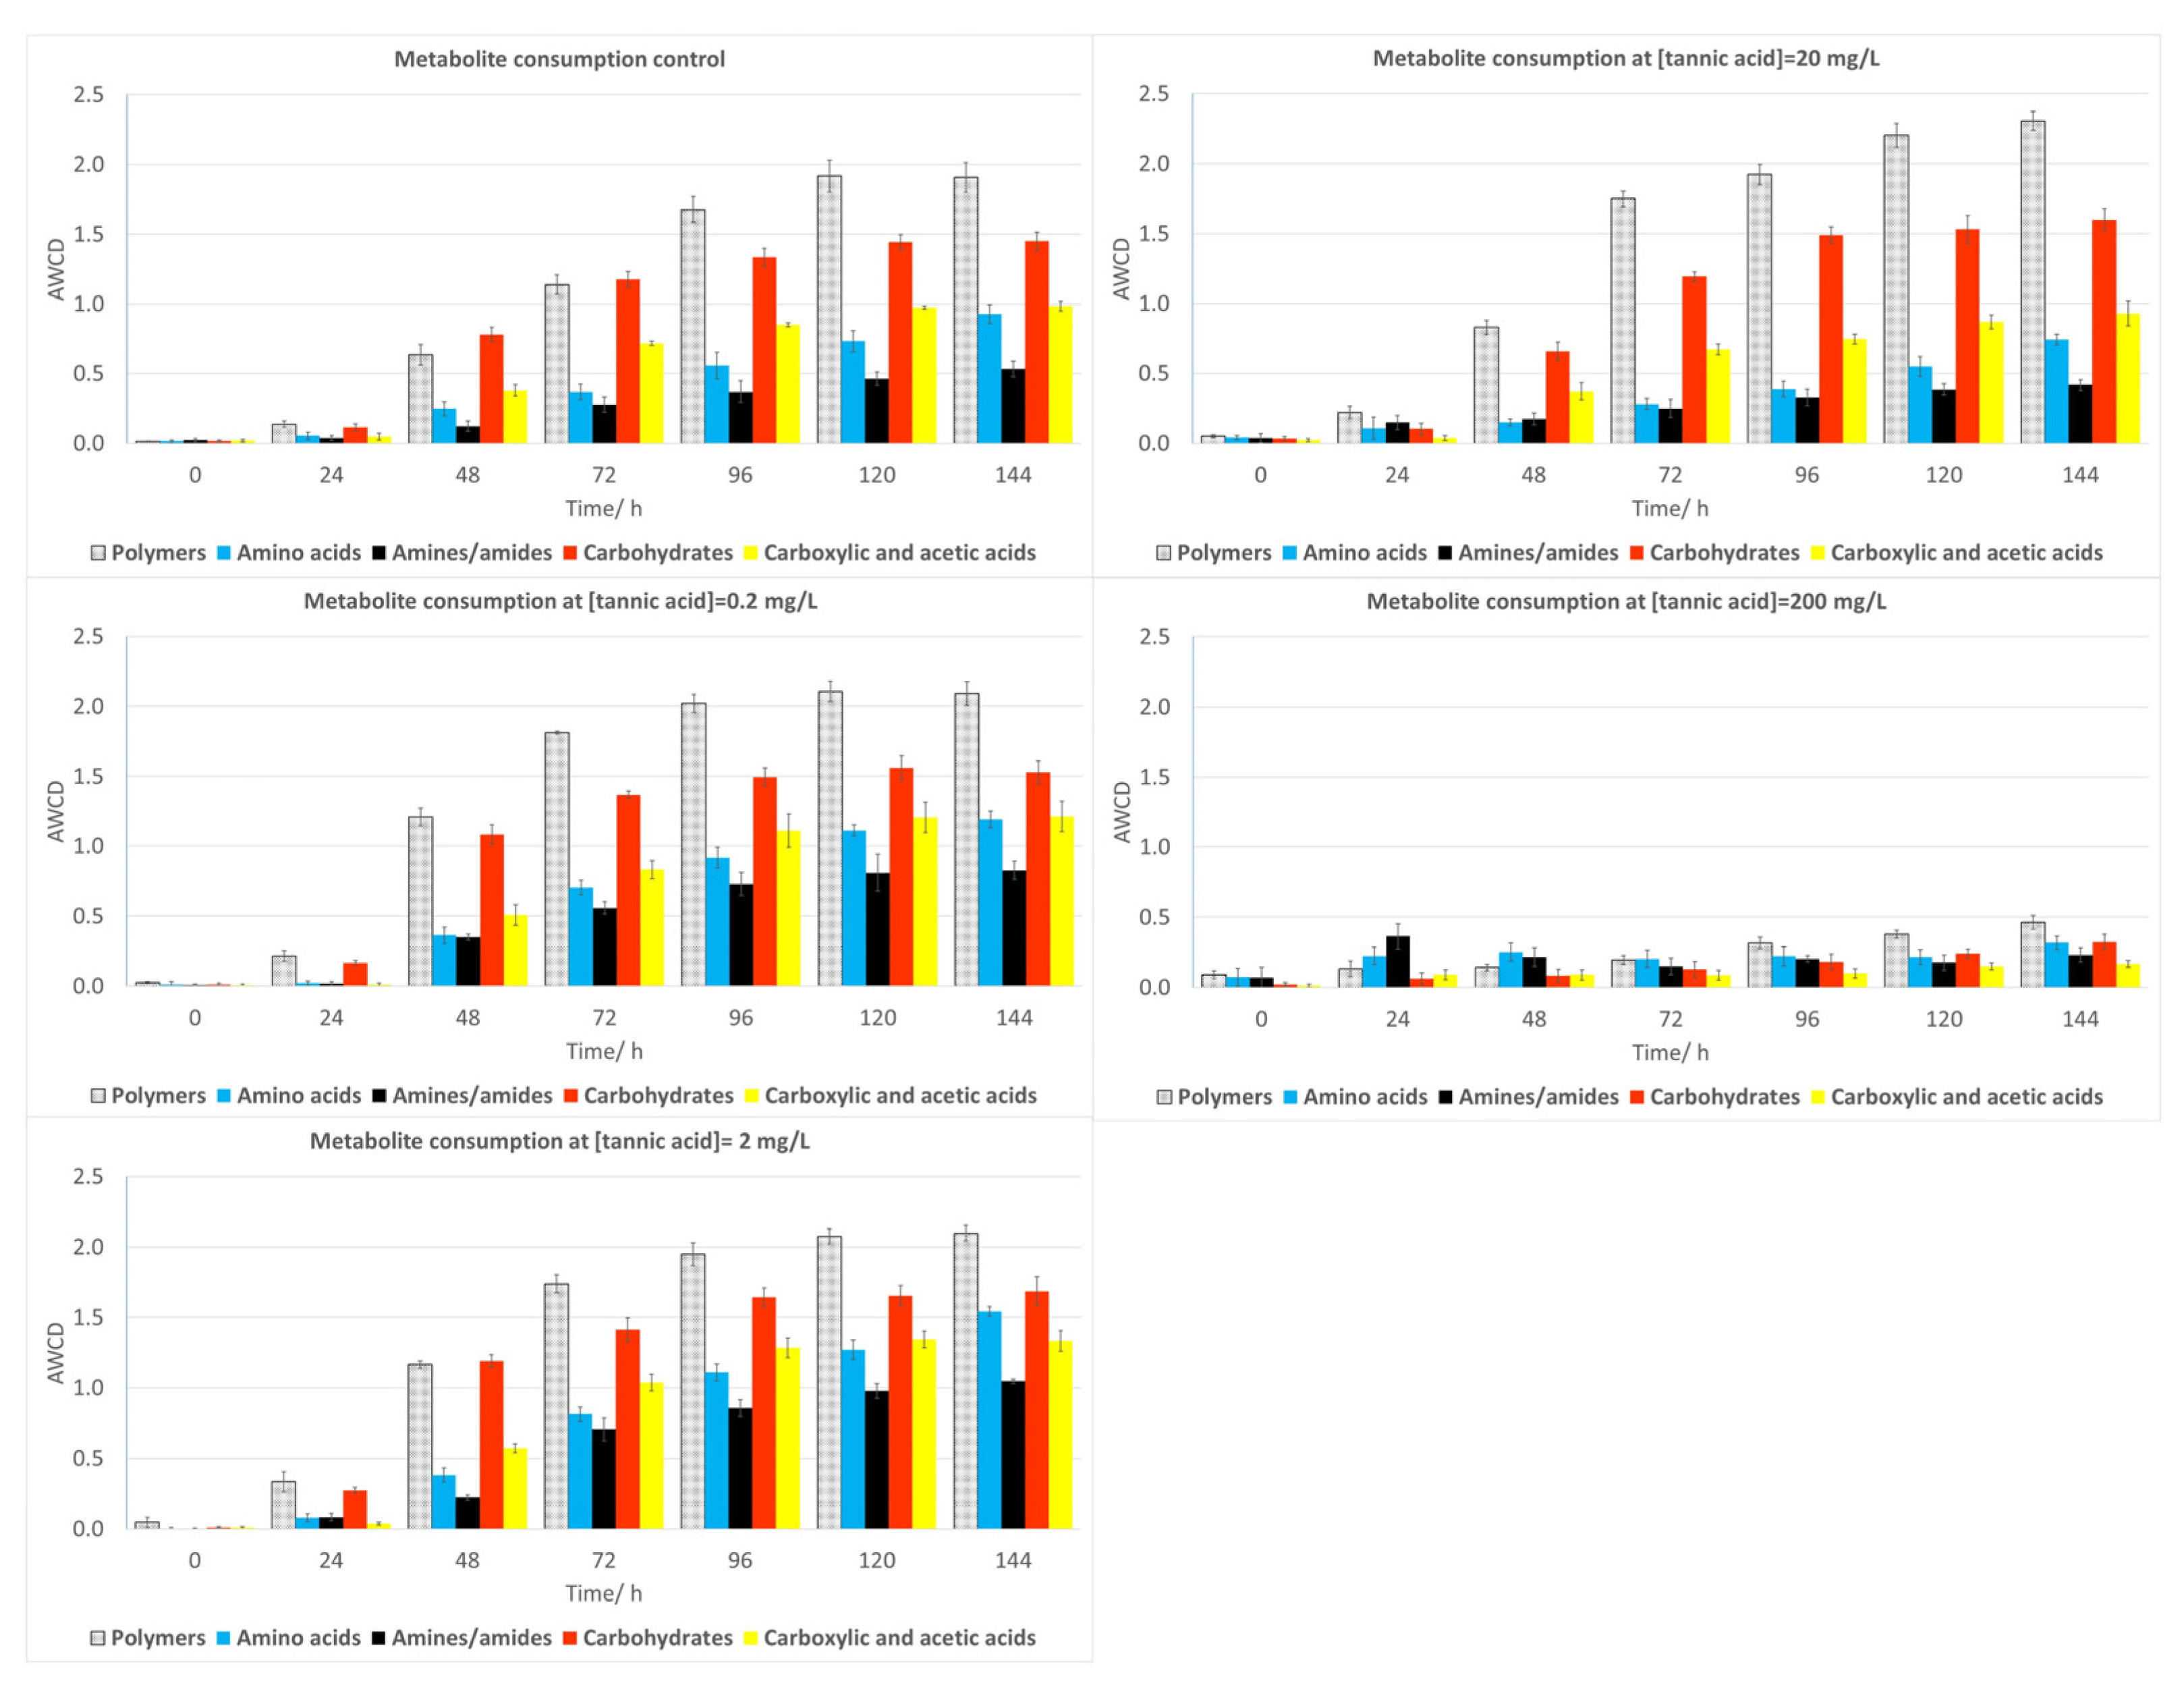
2.3. Community-Level Physiological Profiling (CLPP)
2.3.1. Water Samples
2.3.2. Soil Samples
2.4. Periphyton
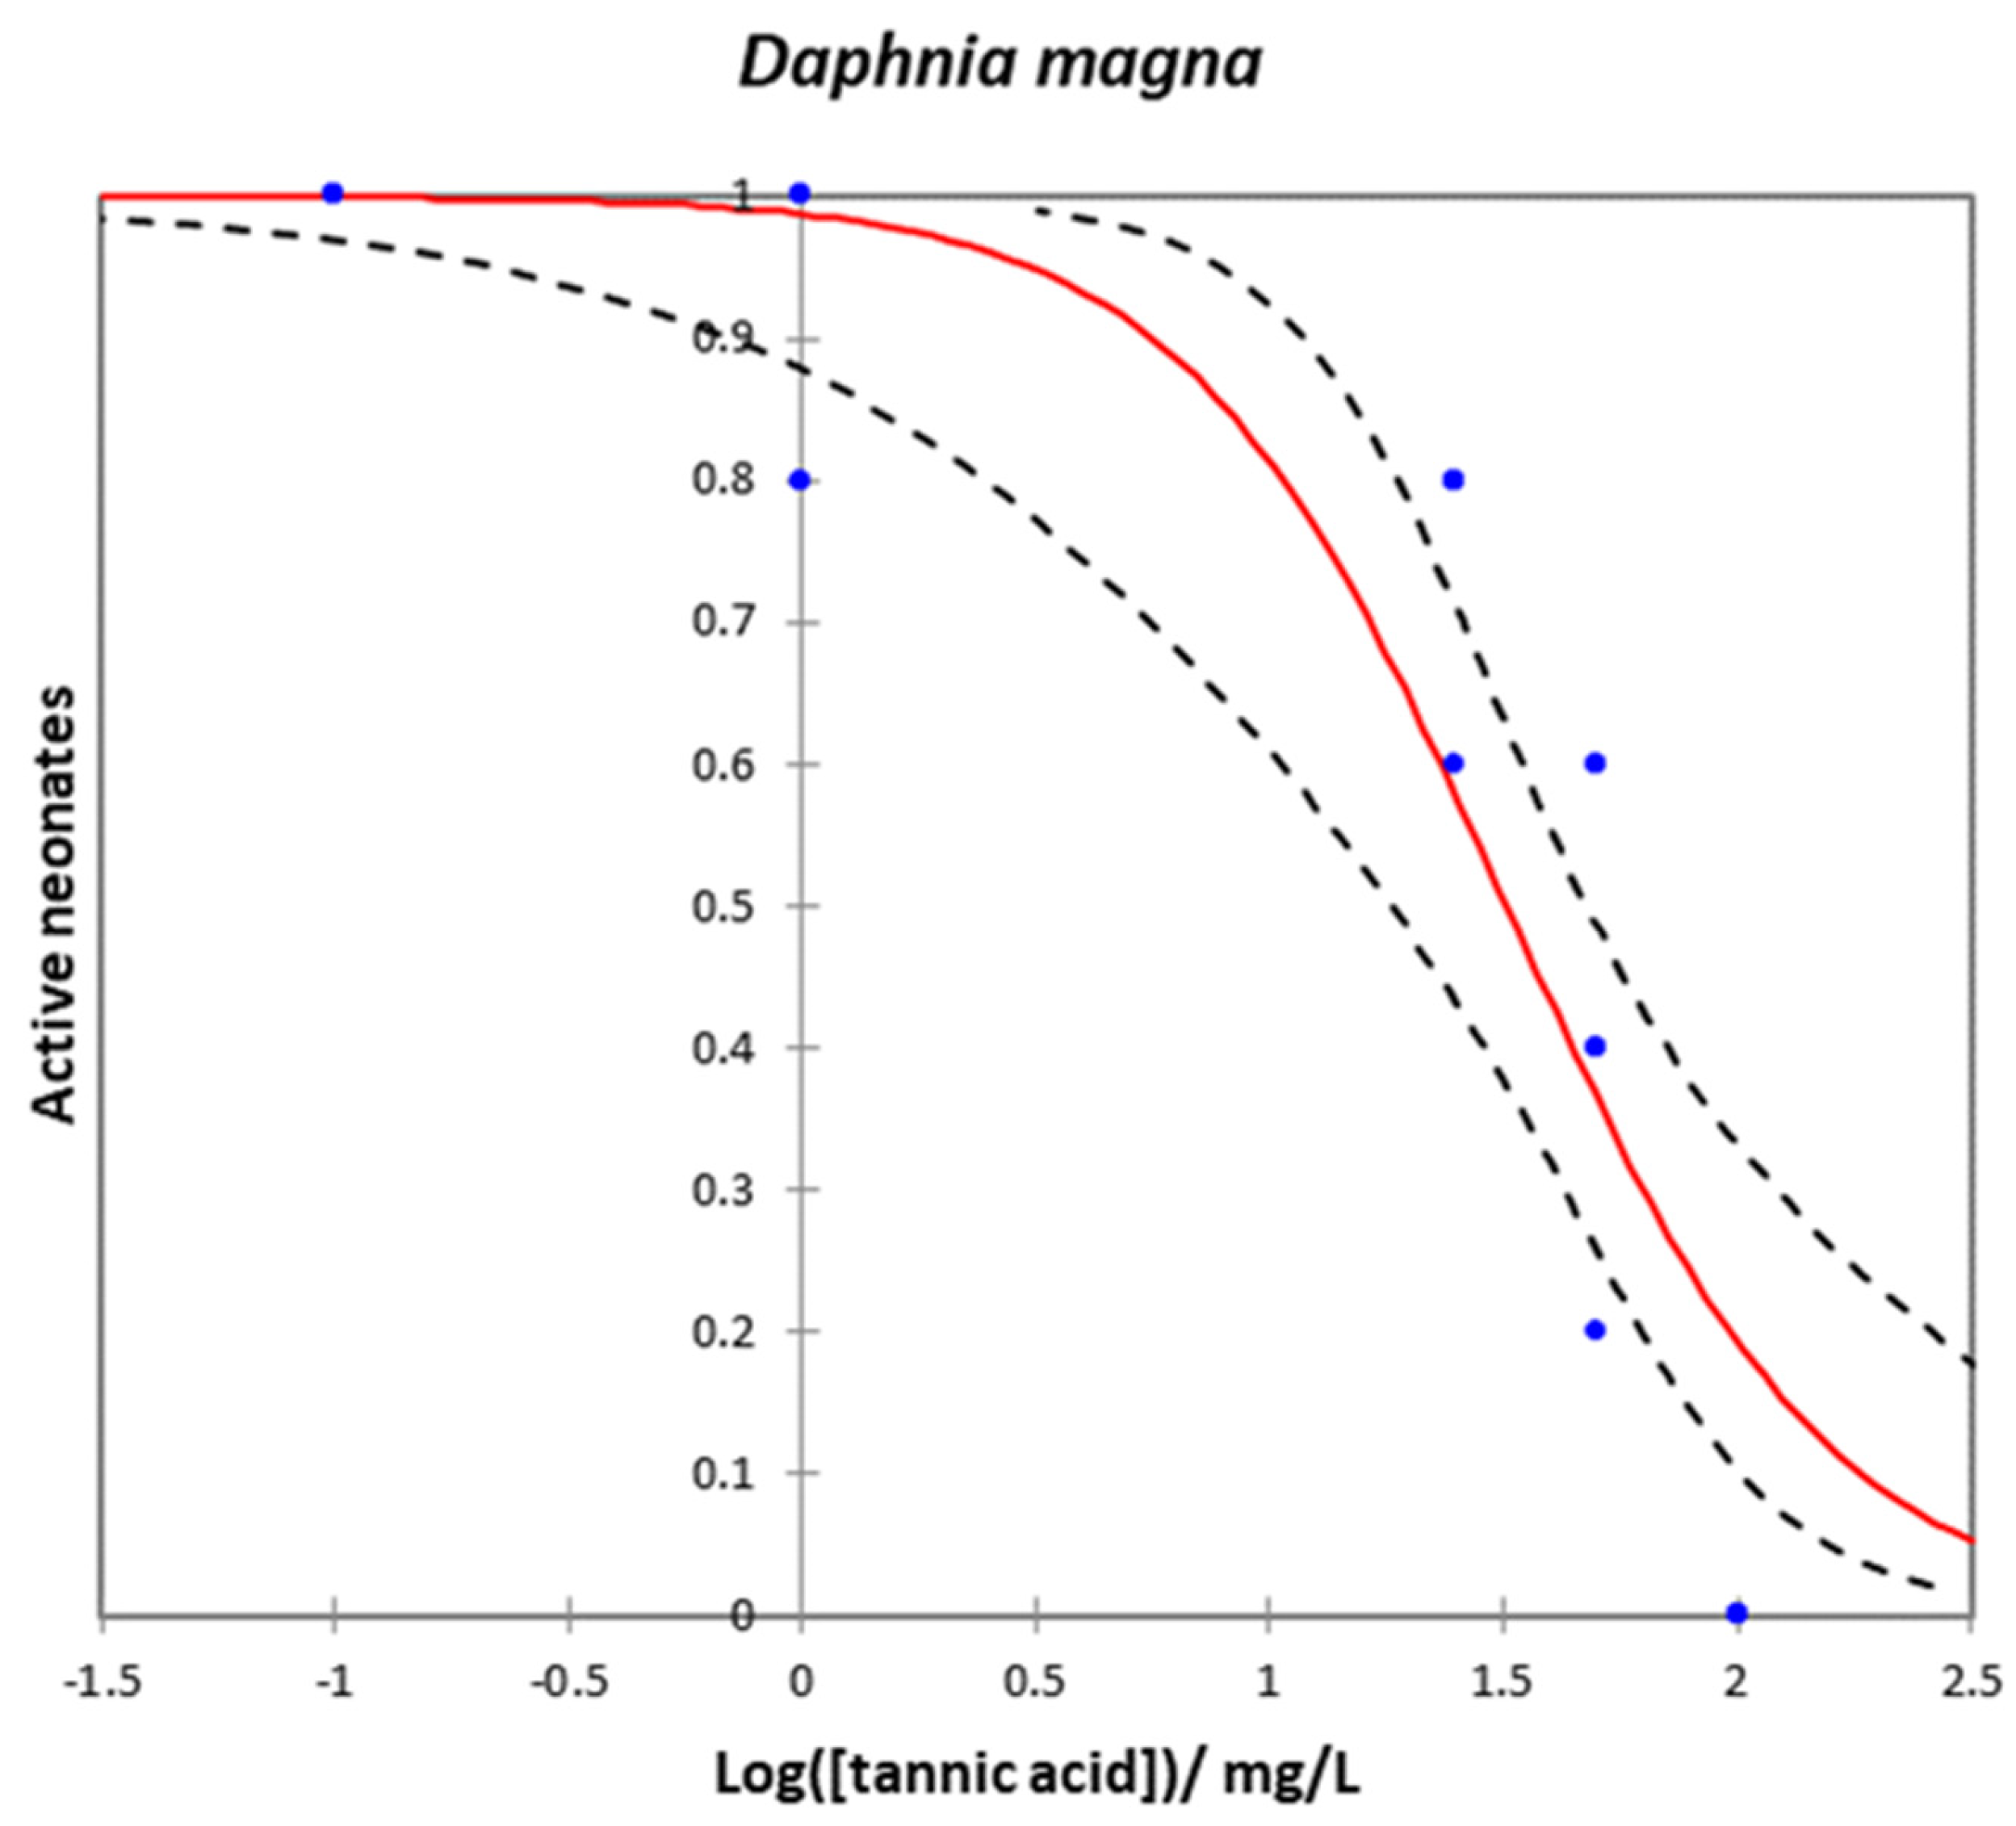
2.5. Daphnia magna
2.6. Vibrio fischeri
2.7. Eisenia foetida
2.8. Allium cepa
3. Discussion
3.1. The Effects of TA on Water Bioindicators and Water Ecosystems
3.2. The Effects of TA on Soil Bioindicators and Soil Ecosystems
4. Materials and Methods
4.1. Chemicals
4.2. Daphnia Magna Tests
4.3. Vibrio Fischeri Bioluminescence Assay
4.4. Periphyton Communities Assay
4.4.1. Colonization
4.4.2. Water Samples
4.4.3. Taxonomic Identification
4.4.4. Dose and Time Response Curves in Flow-Through Artificial Channels
4.5. Water and Soil Microorganism Tests
4.5.1. Water Samples
4.5.2. Soil Samples
4.5.3. Community-Level Physiological Profiling (CLPP) of Water and Soil Samples
4.5.4. Genetic Sequencing of River and Soil Microorganisms
4.6. Eisenia Foetida Assays
4.7. Allium cepa Assay
4.8. Statistics and Graphical Representation
5. Conclusions
Supplementary Materials
Author Contributions
Funding
Data Availability Statement
Acknowledgments
Conflicts of Interest
References
- Covington, A.D. Quo vadit chromium? The future directions of tanning. J. Am. Leather Chem. Assoc. 2008, 103, 7–23. [Google Scholar]
- Covington, A.D. Mineral Tanning: Chromium(III). In Tanning Chemistry: The Science of Leather; Royal Society of Chemistry: Tokyo, Japan, 2009; pp. 204–258. [Google Scholar]
- Fei, Y.; Liu, C. Detoxification and resource recovery of chromium-containing wastes. In Environmental Materials and Waste: Resource Recovery and Pollution Prevention; Academic Press: Cambridge, MA, USA, 2016; pp. 265–284. [Google Scholar] [CrossRef]
- Kanth, S.V.; Venba, R.; Madhan, B.; Chandrababu, N.K.; Sadulla, S. Cleaner tanning practices for tannery pollution abatement: Role of enzymes in eco-friendly vegetable tanning. J. Clean. Prod. 2009, 17, 507–515. [Google Scholar] [CrossRef]
- Hansen, E.; de Aquim, P.M.; Hansen, A.W.; Cardoso, J.K.; Ziulkoski, A.L.; Gutterres, M. Impact of post-tanning chemicals on the pollution load of tannery wastewater. J. Environ. Manag. 2020, 269, 110787. [Google Scholar] [CrossRef]
- De Nicola, E.; Meric, S.; Della Rocca, C.; Gallo, M.; Iaccarino, M.; Manini, P.; Petruzzelli, D.; Belgiorno, V.; Cheggour, M.; Di Gennaro, A.; et al. Wastewater toxicity of tannin- versus chromium-based leather tanneries in Marrakesh, Morocco. Arch. Environ. Contam. Toxicol. 2007, 53, 321–328. [Google Scholar] [CrossRef] [PubMed]
- China, C.R.; Maguta, M.M.; Nyandoro, S.S.; Hilonga, A.; Kanth, S.V.; Njau, K.N. Alternative tanning technologies and their suitability in curbing environmental pollution from the leather industry: A comprehensive review. Chemosphere 2020, 254, 126804. [Google Scholar] [CrossRef]
- De Nicola, E.; Gallo, M.; Iaccarino, M.; Meric, S.; Oral, R.; Russo, T.; Sorrentino, T.; Tunay, O.; Vuttariello, E.; Warnau, M.; et al. Hormetic versus toxic effects of vegetable tannin in a multitest study. Arch. Environ. Contam. Toxicol. 2004, 46, 336–344. [Google Scholar] [CrossRef] [PubMed]
- Chagas, T.Q.; Alvarez, T.G.D.; Montalvao, M.F.; Mesak, C.; Rocha, T.L.; Araujo, A.P.D.; Malafaia, G. Behavioral toxicity of tannery effluent in zebrafish (Danio rerio) used as model system. Sci. Total Environ. 2019, 685, 923–933. [Google Scholar] [CrossRef]
- Taju, G.; Majeed, S.A.; Nambi, K.S.N.; Babu, V.S.; Vimal, S.; Kamatchiammal, S.; Hameed, A.S.S. Comparison of in vitro and in vivo acute toxicity assays in Etroplus suratensis (Bloch, 1790) and its three cell lines in relation to tannery effluent. Chemosphere 2012, 87, 55–61. [Google Scholar] [CrossRef] [PubMed]
- Bhattacharya, P.; Swarnakar, S.; Mukhopadhyay, A.; Ghosh, S. Exposure of composite tannery effluent on snail, Pita globosa: A comparative assessment of toxic impacts of the untreated and membrane treated effluents. Ecotoxicol. Environ. Saf. 2016, 126, 45–55. [Google Scholar] [CrossRef] [PubMed]
- Verma, Y. Toxicity assessment of dye containing industrial effluents by acute toxicity test using Daphnia magna. Toxicol. Ind. Health 2011, 27, 41–49. [Google Scholar] [CrossRef]
- Ortiz-Monsalve, S.; Valente, P.; Poll, E.; Jaramillo-Garcia, V.; Henriques, J.A.P.; Gutterres, M. Biodecolourization and biodetoxification of dye-containing wastewaters from leather dyeing by the native fungal strain Trametes villosa SCS-10. Biochem. Eng. J. 2019, 141, 19–28. [Google Scholar] [CrossRef]
- Tigini, V.; Giansanti, P.; Mangiavillano, A.; Pannocchia, A.; Varese, G.C. Evaluation of toxicity, genotoxicity and environmental risk of simulated textile and tannery wastewaters with a battery of biotests. Ecotoxicol. Environ. Saf. 2011, 74, 866–873. [Google Scholar] [CrossRef]
- Qiao, D.W.; Yao, J.; Song, L.J.; Yang, J.Y. Migration of leather tannins and chromium in soils under the effect of simulated rain. Chemosphere 2021, 284, 131413. [Google Scholar] [CrossRef] [PubMed]
- Palmer, C.D.; Wittbrodt, P.R. Processes affecting the remediation of chromium-contaminated sites. Environ. Health Perspect. 1991, 92, 25–40. [Google Scholar] [CrossRef] [PubMed]
- Rangasamy, S.; Purushothaman, G.; Alagirisamy, B.; Santiago, M. Chromium contamination in soil and groundwater due to tannery wastes disposals at Vellore district of Tamil Nadu. Int. J. Environ. Sci. 2015, 6, 114–124. [Google Scholar]
- Cohen, M.D.; Kargacin, B.; Klein, C.B.; Costa, M. Mechanisms of chromium carcinogenicity and toxicity. Crit. Rev. Toxicol. 1993, 23, 255–281. [Google Scholar] [CrossRef] [PubMed]
- Guo, S.S.; Wu, H.; Tian, Y.Q.; Chen, H.X.; Wang, Y.; Yang, J.Y. Migration and fate of characteristic pollutants migration from an abandoned tannery in soil and groundwater by experiment and numerical simulation. Chemosphere 2021, 271, 129552. [Google Scholar] [CrossRef] [PubMed]
- Jeong, B.; Jeong, E.S.; Malazarte, J.M.; Sin, Y. Physiological and Molecular Response of Prorocentrum minimum to Tannic Acid: An Experimental Study to Evaluate the Feasibility of Using Tannic Acid in Controling the Red Tide in a Eutrophic Coastal Water. Int. J. Environ. Res. Public Health 2016, 13, 503. [Google Scholar] [CrossRef]
- Plavan, V.; Koliada, M.; Valeika, V. An Eco-Benign Semi-Metal Tanning System for Cleaner Leather Production. J. Soc. Leather Technol. Chem. 2017, 101, 260–265. [Google Scholar]
- Krishnamoorthy, G.; Sadulla, S.; Sehgal, P.K.; Mandal, A.B. Green chemistry approaches to leather tanning process for making chrome-free leather by unnatural amino acids. J. Hazard. Mater. 2012, 215, 173–182. [Google Scholar] [CrossRef]
- Mendonca, E.; Picado, A.; Silva, L.; Anselmo, A.M. Ecotoxicological evaluation of cork-boiling wastewaters. Ecotoxicol. Environ. Saf. 2007, 66, 384–390. [Google Scholar] [CrossRef]
- Garcia-Ballesteros, S.; Mora, M.; Vicente, R.; Sabater, C.; Castillo, M.A.; Argues, A.; Amat, A.M. Gaining further insight into photo-Fenton treatment of phenolic compounds commonly found in food processing industry. Chem. Eng. J. 2016, 288, 126–136. [Google Scholar] [CrossRef]
- Ghosh, A.; Bhadury, P. Exploring changes in bacterioplankton community structure in response to tannic acid, a major component of mangrove litterfall of Sundarbans mangrove ecosystem: A laboratory mesocosm approach. Environ. Sci. Pollut. Res. 2022, 29, 2107–2121. [Google Scholar] [CrossRef] [PubMed]
- Gusiatin, Z.M.; Klik, B.; Kulikowska, D. Tannic acid for remediation of historically arsenic-contaminated soils. Environ. Technol. 2019, 40, 1050–1061. [Google Scholar] [CrossRef]
- Song, C.; Zhang, K.X.; Wang, X.J.; Zhao, S.; Wang, S.G. Effects of natural organic matter on the photolysis of tetracycline in aquatic environment: Kinetics and mechanism. Chemosphere 2021, 263, 128338. [Google Scholar] [CrossRef]
- Pautou, M.P.; Rey, D.; David, J.P.; Meyran, J.C. Toxicity of vegetable tannins on Crustacea associated with alpine mosquito breeding sites. Ecotoxicol. Environ. Saf. 2000, 47, 323–332. [Google Scholar] [CrossRef]
- Wu, L.; Dai, J.E.; Bi, E.P. Roles of dissolved humic acid and tannic acid in sorption of benzotriazole to a sandy loam soil. Ecotoxicol. Environ. Saf. 2020, 204, 111088. [Google Scholar] [CrossRef]
- Akiyama, H.; Fujii, K.; Yamasaki, O.; Oono, T.; Iwatsuki, K. Antibacterial action of several tannins against Staphylococcus aureus. J. Antimicrob. Chemother. 2001, 48, 487–491. [Google Scholar] [CrossRef]
- Shen, H.; Chen, X.; Chen, H.B. Influence on the generation of disinfection byproducts in a tannic acid solution by aluminum ions. Environ. Technol. 2017, 38, 1100–1110. [Google Scholar] [CrossRef]
- White, T. Tannins-their occurrence and significance. J. Sci. Food Agric. 1957, 8, 377–385. [Google Scholar] [CrossRef]
- Naik, V.; Mahajan, G. Quorum Sensing: A Non-conventional Target for Antibiotic Discovery. Nat. Prod. Commun. 2013, 8, 1455–1458. [Google Scholar] [CrossRef] [PubMed]
- Chang, C.Y.; Krishnan, T.; Wang, H.; Chen, Y.; Yin, W.F.; Chong, Y.M.; Tan, L.Y.; Chong, T.M.; Chan, K.G. Non-antibiotic quorum sensing inhibitors acting against N-acyl homoserine lactone synthase as druggable target. Sci. Rep. 2014, 4, 7245. [Google Scholar] [CrossRef] [PubMed]
- Reyes, A.W.B.; Hong, T.G.; Hop, H.T.; Arayan, L.T.; Huy, T.X.N.; Min, W.; Lee, H.J.; Lee, K.S.; Kim, S. The in vitro and in vivo protective effects of tannin derivatives against Salmonella enterica serovar Typhimurium infection. Microb. Pathog. 2017, 109, 86–93. [Google Scholar] [CrossRef] [PubMed]
- Roger, J.D.; Magro, M.; Spagnolo, S.; Bonaiuto, E.; Baratella, D.; Fasolato, L.; Vianello, F. Antimicrobial and magnetically removable tannic acid nanocarrier: A processing aid for Listeria monocytogenes treatment for food industry applications. Food Chem. 2018, 267, 430–436. [Google Scholar] [CrossRef]
- Sivasankar, C.; Jha, N.K.; Ghosh, R.; Shetty, P.H. Anti quorum sensing and anti virulence activity of tannic acid and it’s potential to breach resistance in Salmonella enterica Typhi/Paratyphi A clinical isolates. Microb. Pathog. 2020, 138, 103813. [Google Scholar] [CrossRef] [PubMed]
- Ali, A.; Hussain, F.; Attacha, S.; Kalsoom, A.; Qureshi, W.A.; Shakeel, M.; Militky, J.; Tomkova, B.; Kremenakova, D. Development of Novel Antimicrobial and Antiviral Green Synthesized Silver Nanocomposites for the Visual Detection of Fe3+ Ions. Nanomaterials 2021, 11, 2076. [Google Scholar] [CrossRef]
- Kaczmarek, B. Tannic Acid with Antiviral and Antibacterial Activity as A Promising Component of Biomaterials-A Minireview. Materials 2020, 13, 3224. [Google Scholar] [CrossRef] [PubMed]
- Oehmcke-Hecht, S.; Mandl, V.; Naatz, L.T.; Duhring, L.; Kohler, J.; Kreikemeyer, B.; Maletzki, C. Streptococcus gallolyticus abrogates anti-carcinogenic properties of tannic acid on low-passage colorectal carcinomas. Sci. Rep. 2020, 10, 4714. [Google Scholar] [CrossRef]
- Sp, N.; Kang, D.Y.; Kim, D.H.; Yoo, J.S.; Jo, E.S.; Rugamba, A.; Jang, K.J.; Yang, Y.M. Tannic Acid Inhibits Non-small Cell Lung Cancer (NSCLC) Stemness by Inducing G(0)/G(1) Cell Cycle Arrest and Intrinsic Apoptosis. Anticancer Res. 2020, 40, 3209–3220. [Google Scholar] [CrossRef]
- Youness, R.A.; Kamel, R.; Elkasabgy, N.A.; Shao, P.; Farag, M.A. Recent Advances in Tannic Acid (Gallotannin) Anticancer Activities and Drug Delivery Systems for Efficacy Improvement; A Comprehensive Review. Molecules 2021, 26, 1486. [Google Scholar] [CrossRef]
- Ampiaw, R.E.; Lee, W. Persimmon tannins as biosorbents for precious and heavy metal adsorption in wastewater: A review. Int. J. Environ. Sci. Technol. 2020, 17, 3835–3846. [Google Scholar] [CrossRef]
- Pino-Otin, M.R.; Langa, E.; Val, J.; Mainar, A.M.; Ballestero, D. Impact of citronellol on river and soil environments using non-target model organisms and natural populations. J. Environ. Manag. 2021, 287, 112303. [Google Scholar] [CrossRef] [PubMed]
- Zhao, G.J.; Chung, K.T.; Milow, K.; Wang, W.X.; Stevens, S.E. Antibacterial properties of tannic acid and related compounds against the fish pathogen Cytophaga columnaris. J. Aquat. Anim. Health 1997, 9, 309–313. [Google Scholar] [CrossRef]
- Goel, B.B.; Agrawal, V.P. Tannic acid-induced biochemical-changes in the liver of 2 teleost fishes, Clarias batrachus and Ophiocephalus punctatus. Ecotoxicol. Environ. Saf. 1981, 5, 418–423. [Google Scholar] [CrossRef]
- Varanka, Z.; Rojik, I.; Varanka, I.; Nemcsok, J.; Abraham, M. Biochemical and morphological changes in carp (Cyprinus carpio L.) liver following exposure to copper sulfate and tannic acid. Comp. Biochem. Physiol. C Toxicol. Pharmacol. 2001, 128, 467–478. [Google Scholar] [CrossRef]
- Xie, Z.F.; Wang, M.L.; Deng, Y.S.; Li, J.N.; Li, J.T.; Pang, W.D.; Xie, L.J.; Jiang, D.H.; Huang, Z.G.; He, T.G.; et al. Acute toxicity of eucalyptus leachate tannins to zebrafish and the mitigation effect of Fe3+ on tannin toxicity. Ecotoxicol. Environ. Saf. 2022, 229, 113077. [Google Scholar] [CrossRef] [PubMed]
- Saha, N.C.; Kaviraj, A. Acute and chronic toxicity of tannic acid and spent bark of cinchona to tilapia Oreochromis mossambicus. Aquaculture 1996, 145, 119–127. [Google Scholar] [CrossRef]
- Jadhav, U.; Kadu, S.; Thokal, N.; Padul, M.; Dawkar, V.; Chougale, A.; Salve, A.; Patil, M. Degradation of tannic acid by cold-adapted Klebsiella sp NACASA1 and phytotoxicity assessment of tannic acid and its degradation products. Environ. Sci. Pollut. Res. 2011, 18, 1129–1138. [Google Scholar] [CrossRef] [PubMed]
- Madigan, T.M.; Martinko, J.M.; Bender, K.S.; Buckley, D.H.; Brock, S.D. Biología de los Microorganismos; Pearson: London, UK, 2015. [Google Scholar]
- McGregor, G.B.; Fabbro, L.D.; Lobegeiger, J.S. Freshwater planktic Chroococcales (Cyanoprokaryota) from North-Eastern Australia: A morphological evaluation. Nova Hedwig. 2007, 84, 299–331. [Google Scholar] [CrossRef]
- Casamatta, D.A.; Hasler, P. Blue-Green Algae (Cyanobacteria) in Rivers. In River Algae; Springer: Berlin/Heidelberg, Germany, 2016; pp. 5–34. [Google Scholar] [CrossRef]
- Battistuzzi, F.U.; Hedges, S.B. A Major Clade of Prokaryotes with Ancient Adaptations to Life on Land. Mol. Biol. Evol. 2009, 26, 335–343. [Google Scholar] [CrossRef]
- Beale, D.J.; Karpe, A.V.; Ahmed, W.; Cook, S.; Morrison, P.D.; Staley, C.; Sadowsky, M.J.; Palombo, E.A. A Community Multi-Omics Approach towards the Assessment of Surface Water Quality in an Urban River System. Int. J. Environ. Res. Public Health 2017, 14, 303. [Google Scholar] [CrossRef] [PubMed]
- Thoetkiattikul, H.; Mhuantong, W.; Pinyakong, O.; Wisawapipat, W.; Yamazoe, A.; Fujita, N.; Eurwilaichitr, L.; Champreda, V. Culture-independent study of bacterial communities in tropical river sediment. Biosci. Biotechnol. Biochem. 2017, 81, 200–209. [Google Scholar] [CrossRef] [PubMed]
- Aguirre, M.; Abad, D.; Albaina, A.; Cralle, L.; Goni-Urriza, M.S.; Estonba, A.; Zarraonaindia, I. Unraveling the environmental and anthropogenic drivers of bacterial community changes in the Estuary of Bilbao and its tributaries. PLoS ONE 2017, 12, e0178755. [Google Scholar] [CrossRef]
- Jin, D.C.; Kong, X.; Cui, B.J.; Jin, S.L.; Xie, Y.F.; Wang, X.R.; Deng, Y. Bacterial communities and potential waterborne pathogens within the typical urban surface waters. Sci. Rep. 2018, 8, 13368. [Google Scholar] [CrossRef]
- Smith, M.W.; Herfort, L.; Rivers, A.R.; Simon, H.M. Genomic Signatures for Sedimentary Microbial Utilization of Phytoplankton Detritus in a Fast-Flowing Estuary. Front. Microbiol. 2019, 10, 2475. [Google Scholar] [CrossRef] [PubMed]
- Narciso-da-Rocha, C.; Manaia, C.M. Multidrug resistance phenotypes are widespread over different bacterial taxonomic groups thriving in surface water. Sci. Total Environ. 2016, 563, 1–9. [Google Scholar] [CrossRef]
- Janssen, P.H. Identifying the dominant soil bacterial taxa in libraries of 16S rRNA and 16S rRNA genes. Appl. Environ. Microbiol. 2006, 72, 1719–1728. [Google Scholar] [CrossRef] [PubMed]
- Spain, A.M.; Krumholz, L.R.; Elshahed, M.S. Abundance, composition, diversity and novelty of soil Proteobacteria. ISME J. 2009, 3, 992–1000. [Google Scholar] [CrossRef] [PubMed]
- Parte, A.; Whitman, W.; Goodfellow, M.; Kampfer, P.; Busse, H.J.; Trujillo, M.; Ludwig, W.; Suzuki, K. Bergey’s Manual of Systematic Bacteriology: The Actinobacteria; Springer: New York, NY, USA, 2012; Volume 5. [Google Scholar]
- Marcos, M.S.; Bertiller, M.B.; Olivera, N.L. Microbial community composition and network analyses in arid soils of the Patagonian Monte under grazing disturbance reveal an important response of the community to soil particle size. Appl. Soil Ecol. 2019, 138, 223–232. [Google Scholar] [CrossRef]
- Arocha-Garza, H.F.; Canales-Del Castillo, R.; Eguiarte, L.E.; Souza, V.; De la Torre-Zavala, S. High diversity and suggested endemicity of culturable Actinobacteria in an extremely oligotrophic desert oasis. PeerJ 2017, 5, e3247. [Google Scholar] [CrossRef]
- Zhang, S.Y.; Fan, C.; Wang, Y.X.; Xia, Y.S.; Xiao, W.; Cui, X.L. Salt-tolerant and plant-growth-promoting bacteria isolated from high-yield paddy soil. Can. J. Microbiol. 2018, 64, 968–978. [Google Scholar] [CrossRef]
- Seki, T.; Matsumoto, A.; Omura, S.; Takahashi, Y. Distribution and isolation of strains belonging to the order Solirubrobacterales. J. Antibiot. 2015, 68, 763–766. [Google Scholar] [CrossRef]
- Ramos, L.R.; Vollu, R.E.; Jurelevicius, D.; Rosado, A.S.; Seldin, L. Firmicutes in different soils of Admiralty Bay, King George Island, Antarctica. Polar Biol. 2019, 42, 2219–2226. [Google Scholar] [CrossRef]
- Wang, Y.J.; Liu, L.; Yang, J.F.; Duan, Y.M.; Luo, Y.; Taherzadeh, M.J.; Li, Y.F.; Li, H.K.; Awasthi, M.K.; Zhao, Z.Y. The diversity of microbial community and function varied in response to different agricultural residues composting. Sci. Total Environ. 2020, 715, 136983. [Google Scholar] [CrossRef] [PubMed]
- Lv, X.F.; Yu, J.B.; Fu, Y.Q.; Ma, B.; Qu, F.Z.; Ning, K.; Wu, H.F. A Meta-Analysis of the Bacterial and Archaeal Diversity Observed in Wetland Soils. Sci. World J. 2014, 2014, 437684. [Google Scholar] [CrossRef] [PubMed]
- Cordero, J.; de Freitas, J.R.; Germida, J.J. Bacterial microbiome associated with the rhizosphere and root interior of crops in Saskatchewan, Canada. Can. J. Microbiol. 2020, 66, 71–85. [Google Scholar] [CrossRef] [PubMed]
- Zhang, L.; Xu, Z.H. Assessing bacterial diversity in soil. J. Soils Sediments 2008, 8, 379–388. [Google Scholar] [CrossRef]
- Hugenholtz, P.; Goebel, B.M.; Pace, N.R. Impact of culture-independent studies on the emerging phylogenetic view of bacterial diversity. J. Bacteriol. 1998, 180, 4765–4774. [Google Scholar] [CrossRef]
- Pino-Otin, M.R.; Val, J.; Ballestero, D.; Navarro, E.; Sanchez, E.; Mainar, A.M. Impact of Artemisia absinthium hydrolate extracts with nematicidal activity on non-target soil organisms of different trophic levels. Ecotoxicol. Environ. Saf. 2019, 180, 565–574. [Google Scholar] [CrossRef] [PubMed]
- Martins, J.; Teles, L.O.; Vasconcelos, V. Assays with Daphnia magna and Danio rerio as alert systems in aquatic toxicology. Environ. Int. 2007, 33, 414–425. [Google Scholar] [CrossRef]
- Abbas, M.; Adil, M.; Ehtisham-ul-Haque, S.; Munir, B.; Yameen, M.; Ghaffar, A.; Shar, G.A.; Tahir, M.A.; Iqbal, M. Vibrio fischeri bioluminescence inhibition assay for ecotoxicity assessment: A review. Sci. Total Environ. 2018, 626, 1295–1309. [Google Scholar] [CrossRef] [PubMed]
- Cortez, J.; Bouche, M.B. Do earthworms eat living roots? Soil Biol. Biochem. 1992, 24, 913–915. [Google Scholar] [CrossRef]
- Pino, M.R.; Val, J.; Mainar, A.M.; Zuriaga, E.; Espanol, C.; Langa, E. Acute toxicological effects on the earthworm Eisenia fetida of 18 common pharmaceuticals in artificial soil. Sci. Total Environ. 2015, 518, 225–237. [Google Scholar] [CrossRef] [PubMed]
- Wang, Y.; Wu, S.; Chen, L.; Wu, C.; Yu, R.; Wang, Q.; Zhao, X. Toxicity assessment of 45 pesticides to the epigeic earthworm Eisenia fetida. Chemosphere 2012, 88, 484–491. [Google Scholar] [CrossRef] [PubMed]
- Alias, C.; Zerbini, I.; Abba, A.; Benassi, L.; Gelatti, U.; Sorlini, S.; Piovani, G.; Feretti, D. Ecotoxicity Evaluation of Industrial Waste and Construction Materials: Comparison Between Leachates from Granular Steel Slags and Steel Slags-Containing Concrete Through a Plant-Based Approach. Bull. Environ. Contam. Toxicol. 2023, 111, 3. [Google Scholar] [CrossRef]
- Caetano, M.O.; Kieling, A.G.; Raimondi, R.L.; Gomes, L.P.; Homrich Schneider, I.A. Ecotoxicity tests with Allium cepa to determine the efficiency of rice husk ash in the treatment of groundwater contaminated with benzene, toluene, ethylbenzene, and xylene. Environ. Sci. Pollut. Res. 2018, 25, 12849–12858. [Google Scholar] [CrossRef] [PubMed]
- Pino-Otin, M.R.; Val, J.; Ballestero, D.; Navarro, E.; Sanchez, E.; Gonzalez-Coloma, A.; Mainar, A.M. Ecotoxicity of a new biopesticide produced by Lavandula luisieri on non-target soil organisms from different trophic levels. Sci. Total Environ. 2019, 671, 83–93. [Google Scholar] [CrossRef] [PubMed]
- Neagu, A.F.; Costea, T.; Nencu, I.; Dutu, L.E.; Popescu, M.L.; Olaru, O.T.; Gird, C.E. Obtaining and characterization of a selective Pelargonium graveolens l’her. Dry extract with potential therapeutic activity in metabolic diseases. Farmacia 2018, 66, 592–596. [Google Scholar] [CrossRef]
- Libralato, G.; Avezzu, F.; Ghirardini, A.V. Lignin and tannin toxicity to Phaeodactylum tricornutum (Bohlin). J. Hazard. Mater. 2011, 194, 435–439. [Google Scholar] [CrossRef] [PubMed]
- Strotmann, U.; Flores, D.P.; Konrad, O.; Gendig, C. Bacterial Toxicity Testing: Modification and Evaluation of the Luminescent Bacteria Test and the Respiration Inhibition Test. Processes 2020, 8, 1349. [Google Scholar] [CrossRef]
- ISO 11348; Water Quality—Determination of the Inhibitory Effect of Water Samples on the Light Emission of Vibrio fischeri (Luminescent Bacteria Test). International Organization for Standardization: Geneva, Switzerland, 2007.
- Jochimsen, J.C.; Jekel, M.R. Partial oxidation effects during the combined oxidative and biological treatment of separated streams of tannery wastewater. Water Sci. Technol. 1997, 35, 337–345. [Google Scholar] [CrossRef]
- Curiel, J.A.; Rodriguez, H.; de las Rivas, B.; Anglade, P.; Baraige, F.; Zagorec, M.; Champomier-Verges, M.; Munoz, R.; de Felipe, F.L. Response of a Lactobacillus plantarum human isolate to tannic acid challenge assessed by proteomic analyses. Mol. Nutr. Food Res. 2011, 55, 1454–1465. [Google Scholar] [CrossRef] [PubMed]
- Samoilova, Z.; Tyulenev, A.; Muzyka, N.; Smirnova, G.; Oktyabrsky, O. Tannic and gallic acids alter redox-parameters of the medium and modulate biofilm formation. AIMS Microbiol. 2019, 5, 379–392. [Google Scholar] [CrossRef]
- Stumpf, S.; Hostnik, G.; Primozic, M.; Leitgeb, M.; Salminen, J.P.; Bren, U. The Effect of Growth Medium Strength on Minimum Inhibitory Concentrations of Tannins and Tannin Extracts against E. coli. Molecules 2020, 25, 2947. [Google Scholar] [CrossRef]
- Chung, K.T.; Stevens, S.E.; Lin, W.F.; Wei, C.I. Growth inhibition of selected food-borne bacteria by tannic acid, propyl gallate and related compounds. Lett. Appl. Microbiol. 1993, 17, 29–32. [Google Scholar] [CrossRef]
- Chung, K.T.; Lu, Z.; Chou, M.W. Mechanism of inhibition of tannic acid and related compounds on the growth of intestinal bacteria. Food Chem. Toxicol. 1998, 36, 1053–1060. [Google Scholar] [CrossRef]
- Timotheo, C.A.; Lauer, C.M. Toxicity of vegetable tannin extract from Acacia mearnsii in Saccharomyces cerevisiae. Int. J. Environ. Sci. Technol. 2018, 15, 659–664. [Google Scholar] [CrossRef]
- Zhao, G.J.; Watson, J.; Crowder, C.; Stevens, S.E. Changes in biological production of the cyanobacterium, Nostoc sp. strain MAC, under subinhibitory concentrations of tannic acid and related compounds. J. Appl. Phycol. 1998, 10, 1–7. [Google Scholar] [CrossRef]
- Gil, C.S.; Duan, S.; Kim, J.H.; Eom, S.H. Allelopathic Efficiency of Plant Extracts to Control Cyanobacteria in Hydroponic Culture. Agronomy 2021, 11, 2350. [Google Scholar] [CrossRef]
- Schrader, K.K. Compounds with inhibitory activity against the channel catrish pathogens Edwardsiella ictaluri and Flavobacterium columnare. N. Am. J. Aquac. 2008, 70, 147–153. [Google Scholar] [CrossRef]
- Scalbert, A. Antimicrobial properties of tannins. Phytochemistry 1991, 30, 3875–3883. [Google Scholar] [CrossRef]
- Suga, N.; Ogo, M.; Suzuki, S. Risk assessment of oxytetracycline in water phase to major sediment bacterial community: A water-sediment microcosm study. Environ. Toxicol. Pharmacol. 2013, 36, 142–148. [Google Scholar] [CrossRef] [PubMed]
- Olumuyiwa, E.; Amund, O.; Ilori, M.; Schmidt, S. Utilization of tannic acid by bacteria in tropical aquatic and soil environments. J. Microbiol. Biotechnol. Food Sci. 2020, 10, 335–343. [Google Scholar] [CrossRef]
- Chavez-Gonzalez, M.L.; Guyot, S.; Rodriguez-Herrera, R.; Prado-Barragan, A.; Aguilar, C.N. Production profiles of phenolics from fungal tannic acid biodegradation in submerged and solid-state fermentation. Process Biochem. 2014, 49, 541–546. [Google Scholar] [CrossRef]
- Li, W.W.; Li, X.D.; Zeng, K.M. Aerobic biodegradation kinetics of tannic acid in activated sludge system. Biochem. Eng. J. 2009, 43, 142–148. [Google Scholar] [CrossRef]
- Gaiser, E. Periphyton as an indicator of restoration in the Florida Everglades. Ecol. Indic. 2009, 9, S37–S45. [Google Scholar] [CrossRef]
- Vis, C.; Hudon, C.; Cattaneo, A.; Pinel-Alloul, B. Periphyton as an indicator of water quality in the St Lawrence River (Quebec, Canada). Environ. Pollut. 1998, 101, 13–24. [Google Scholar] [CrossRef]
- Laue, P.; Bahrs, H.; Chakrabarti, S.; Steinberg, C.E.W. Natural xenobiotics to prevent cyanobacterial and algal growth in freshwater: Contrasting efficacy of tannic acid, gallic acid, and gramine. Chemosphere 2014, 104, 212–220. [Google Scholar] [CrossRef]
- Tebaa, L.; Douma, M.; Tazart, Z.; Mouhri, K.; Loudiki, M. Control of Microcystis aeruginosa toxic blooms by Moroccan medicinal plant-based algicides. Desalination Water Treat. 2021, 237, 146–158. [Google Scholar] [CrossRef]
- Erhard, D.; Gross, E.M. Allelopathic activity of Elodea canadensis and Elodea nuttallii against epiphytes and phytoplankton. Aquat. Bot. 2006, 85, 203–211. [Google Scholar] [CrossRef]
- Jones, J.I.; Sayer, C.D. Does the fish-invertebrate-periphyton cascade precipitate plant loss in shallow lakes? Ecology 2003, 84, 2155–2167. [Google Scholar] [CrossRef]
- Sabater, S.; Guasch, H.; Ricart, M.; Romani, A.; Vidal, G.; Kluender, C.; Schmitt-Jansen, M. Monitoring the effect of chemicals on biological communities. The biofilm as an interface. Anal. Bioanal. Chem. 2007, 387, 1425–1434. [Google Scholar] [CrossRef] [PubMed]
- Costerton, J.W.; Geesey, G.G.; Cheng, K.J. How bacteria stick. Sci. Am. 1978, 238, 86–95. [Google Scholar] [CrossRef]
- Battin, T.J.; Kaplan, L.A.; Newbold, J.D.; Cheng, X.H.; Hansen, C. Effects of current velocity on the nascent architecture of stream microbial biofilms. Appl. Environ. Microbiol. 2003, 69, 5443–5452. [Google Scholar] [CrossRef] [PubMed]
- Sheng, G.P.; Yu, H.Q.; Yue, Z.B. Production of extracellular polymeric substances from Rhodopseudomonas acidophila in the presence of toxic substances. Appl. Microbiol. Biotechnol. 2005, 69, 216–222. [Google Scholar] [CrossRef] [PubMed]
- Samrakandi, M.M.; Roques, C.; Michel, G. Influence of trophic conditions on exopolysaccharide production: Bacterial biofilm susceptibility to chlorine and monochloramine. Can. J. Microbiol. 1997, 43, 751–758. [Google Scholar] [CrossRef]
- Admiraal, W.; Blanck, H.; Buckert-De Jong, M.; Guasch, H.; Ivorra, N.; Lehmann, V.; Nystrom, B.A.H.; Paulsson, M.; Sabater, S. Short-term toxicity of zinc to microbenthic algae and bacteria in a metal polluted stream. Water Res. 1999, 33, 1989–1996. [Google Scholar] [CrossRef]
- Yin, L.; Wang, J.; Shi, K.; Zhang, Y.; Xu, Y.; Kong, D.; Ni, L.; Li, S. Interactions between tannins allelochemicals and extracellular polymeric substance (EPS) of Microcystis aeruginosa. Environ. Sci. Pollut. Res. 2022, 29, 83211–83219. [Google Scholar] [CrossRef]
- Chang, X.; Eigemann, F.; Hilt, S. Do macrophytes support harmful cyanobacteria? Interactions with a green alga reverse the inhibiting effects of macrophyte allelochemicals on Microcystis aeruginosa. Harmful Algae 2012, 19, 76–84. [Google Scholar] [CrossRef]
- Silva, S.B.; Padua, R.M.; Barbosa, F.A.R.; Silva, M.A.N.; Azevedo, F.R.; Magalhaes, S.M.S. Phytoplankton Cultures for Tannin Biodegradation. Water Air Soil Pollut. 2019, 230, 170. [Google Scholar] [CrossRef]
- Organisation for Economic Co-operation and Development (OECD). Test No. 207: Earthworm, Acute Toxicity Tests. In OECD Guidelines for the Testing of Chemicals, Section 2; OECD: Paris, France, 1984. [Google Scholar]
- Arnold, R.E.; Hodson, M.E.; Black, S.; Davies, N.A. The influence of mineral solubility and soil solution concentration on the toxicity of copper to Eisenia fetida Savigny. Pedobiologia 2003, 47, 622–632. [Google Scholar] [CrossRef]
- Saha, T.; Biswas, A.; Chakraborty, R. Subinhibitory Levels of Oxytetracycline in Earthworm Meal Significantly Boost Resistance-Mutation Rates in Bacillus spp. within the Gut of Eisenia fetida. J. Pharm. Res. Int. 2021, 33, 80–87. [Google Scholar] [CrossRef]
- Fiskesjo, G. The allium test in waste-water monitoring. Environ. Toxicol. Water Qual. 1993, 8, 291–298. [Google Scholar] [CrossRef]
- Barberio, A.; Voltolini, J.C.; Mello, M.L.S. Standardization of bulb and root sample sizes for the Allium cepa test. Ecotoxicology 2011, 20, 927–935. [Google Scholar] [CrossRef]
- WHO. WHO International Programme on Chemical Safety (IPCS). Available online: https://www.who.int/health-topics/chemical-safety (accessed on 27 September 2023).
- UN. UN United Nations Environment Programme (UNEP). Available online: https://www.unep.org/ (accessed on 27 September 2023).
- Kamble, S.T.; Pawar, K.B. Characterization of petal leachates of Gliricidia sepium (Jacq.) Kunth ex Walp for its herbicidal potential. Allelopathy J. 2018, 44, 49–60. [Google Scholar] [CrossRef]
- Zhang, W.; Chen, L.; Zhang, R.; Lin, K. High throughput sequencing analysis of the joint effects of BDE209-Pb on soil bacterial community structure. J. Hazard. Mater. 2016, 301, 1–7. [Google Scholar] [CrossRef]
- Feng, G.; Xie, T.; Wang, X.; Bai, J.; Tang, L.; Zhao, H.; Wei, W.; Wang, M.; Zhao, Y. Metagenomic analysis of microbial community and function involved in cd-contaminated soil. BMC Microbiol. 2018, 18, 11. [Google Scholar] [CrossRef]
- Blum, U.; Rice, E.L. Inhibition of symbiotic nitrogen-fixation by gallic and tannic acid, and possible roles in old-field succession. Bull. Torrey Bot. Club 1969, 96, 531. [Google Scholar] [CrossRef]
- Selvakumar, G.; Saha, S.; Kundu, S. Inhibitory activity of pine needle tannin extracts on some agriculturally resourceful microbes. Indian J. Microbiol. 2007, 47, 267–270. [Google Scholar] [CrossRef]
- Kakiuchi, N.; Hattori, M.; Nishizawa, M.; Yamgishi, T.; Okuda, T.; Namba, T. Studies on dental caries prevention by traditional medicines. VIII. Inhibitory effect of various tannins on glucan synthesis by glucosyltransferase from Streptococcus mutans. Chem. Pharm. Bull. 1986, 34, 720. [Google Scholar] [CrossRef] [PubMed]
- Brownlee, H.E.; Euen, A.R.; Hedger, J.; Scott, I.M. Anti-Fungal Effects of Cocoa Tannin on the Witches’ Broom Pathogen Crinipellis perniciosa. Physiol. Mol. Plant Pathol. 1990, 36, 39. [Google Scholar] [CrossRef]
- Mandal, S.M.; Dias, R.O.; Franco, O.L. Phenolic Compounds in Antimicrobial Therapy. J. Med. Food 2017, 20, 1031–1038. [Google Scholar] [CrossRef]
- Brown, J.C. Interactions involving nutrient elements. Annu. Rev. Plant Physiol. 1963, 14, 93. [Google Scholar] [CrossRef]
- Harris, C.M.; Livingstone, S.E. Chelating Agents and Metals Chelates; Dwyer, F.P., Mellor, D.P., Eds.; Academic Press: New York, NY, USA, 1964; p. 95. [Google Scholar]
- Tintino, S.R.; Morais-Tintino, C.D.; Campina, F.F.; Costa, M.D.; Menezes, I.R.A.; de Matos, Y.; Calixto, J.T.; Pereira, P.S.; Siqueira, J.P.; Leal-Balbino, T.C.; et al. Tannic acid affects the phenotype of Staphylococcus aureus resistant to tetracycline and erythromycin by inhibition of efflux pumps. Bioorg. Chem. 2017, 74, 197–200. [Google Scholar] [CrossRef] [PubMed]
- Pino-Otin, M.R.; Gan, C.; Terrado, E.; Sanz, M.A.; Ballestero, D.; Langa, E. Antibiotic properties of Satureja montana L. hydrolate in bacteria and fungus of clinical interest and its impact in non-target environmental microorganisms. Sci. Rep. 2022, 12, 18460. [Google Scholar] [CrossRef]
- Chowdhury, S.P.; Khanna, S.; Verma, S.C.; Tripathi, A.K. Molecular diversity of tannic acid degrading bacteria isolated from tannery soil. J. Appl. Microbiol. 2004, 97, 1210–1219. [Google Scholar] [CrossRef]
- Ilori, M.O.; Adebusoye, S.A.; Amund, O.O.; Oyetoran, B.O. A study of tannic acid degradation by soil bacteria. Pak. J. Biol. Sci. 2007, 10, 3224–3227. [Google Scholar] [PubMed]
- Organisation for Economic Co-operation and Development (OECD). Test No. 202: Daphnia sp. Acute Immobilisation Test. In OECD Guidelines for the Testing of Chemicals, Section 2; OECD: Paris, France, 2004. [Google Scholar] [CrossRef]
- UNE-EN ISO 6341; Water Quality—Determination of the Inhibition of the Mobility of Daphnia magna Straus (Cladocera, Crustacea)—Acute Toxicity Test. AENOR: Madrid, Spain, 2012.
- Navarro, E.; Guasch, H.; Sabater, S. Use of microbenthic algal communities in ecotoxicological tests for the assessment of water quality: The Ter river case study. J. Appl. Phycol. 2002, 14, 41–48. [Google Scholar] [CrossRef]
- UNE-EN 15204; Water Quality—Guidance Standard on the Enumeration of Phytoplankton Using Inverted Microscopy (Utermöhl Technique). AENOR: Madrid, Spain, 2007.
- UNE-EN 13946:2014; Water Quality—Guidance for the Routine Sampling and Preparation of Benthic Diatoms from Rivers and Lakes. AENOR: Madrid, Spain, 2014.
- UNE-EN 14407:2015; Water Quality—Guidance for the Identification and Enumeration of Benthic Diatom Samples from Rivers and Lakes. AENOR: Madrid, Spain, 2015.
- Consalvey, M.; Jesus, B.; Perkins, R.G.; Brotas, V.; Underwood, G.J.C.; Paterson, D.M. Monitoring migration and measuring biomass in benthic biofilms: The effects of dark/far-red adaptation and vertical migration on fluorescence measurements. Photosynth. Res. 2004, 81, 91–101. [Google Scholar] [CrossRef]
- UNE-EN ISO 19458:2007; Water Quality—Sampling for Microbiological Analysis (ISO 19458:2006). AENOR: Madrid, Spain, 2007.
- Pino-Otin, M.R.; Muniz, S.; Val, J.; Navarro, E. Effects of 18 pharmaceuticals on the physiological diversity of edaphic microorganisms. Sci. Total Environ. 2017, 595, 441–450. [Google Scholar] [CrossRef]
- Stefanowicz, A. The biolog plates technique as a tool in ecological studies of microbial communities. Pol. J. Environ. Stud. 2006, 15, 669–676. [Google Scholar]
- Weber, K.P.; Legge, R.L. One-dimensional metric for tracking bacterial community divergence using sole carbon source utilization patterns. J. Microbiol. Methods 2009, 79, 55–61. [Google Scholar] [CrossRef] [PubMed]
- Caporaso, J.G.; Lauber, C.L.; Walters, W.A.; Berg-Lyons, D.; Lozupone, C.A.; Turnbaugh, P.J.; Fierer, N.; Knight, R. Global patterns of 16S rRNA diversity at a depth of millions of sequences per sample. Proc. Natl. Acad. Sci. USA 2011, 108, 4516–4522. [Google Scholar] [CrossRef] [PubMed]
- Caporaso, J.G.; Lauber, C.L.; Walters, W.A.; Berg-Lyons, D.; Huntley, J.; Fierer, N.; Owens, S.M.; Betley, J.; Fraser, L.; Bauer, M.; et al. Ultra-high-throughput microbial community analysis on the Illumina HiSeq and MiSeq platforms. ISME J. 2012, 6, 1621–1624. [Google Scholar] [CrossRef]
- Pino-Otin, M.R.; Navarro, J.; Val, J.; Roig, F.; Mainar, A.M.; Ballestero, D. Spanish Satureja montana L. hydrolate: Ecotoxicological study in soil and water non-target organisms. Ind. Crops Prod. 2022, 178, 114553. [Google Scholar] [CrossRef]


| Name of the Chemical | CAS Number | Purity | Company |
|---|---|---|---|
| Tannic acid | 1401-55-4 | ACS Reagent (>95%) | Sigma-aldrich (Burlington, VT, USA) |
| NaOH | 1310-73-2 | 98% | PanReac (Barcelona, Spain) |
| HCl | 7647-01-0 | 37% | Fisher Chemical (Pittsburgh, PA, USA) |
| PBS (phosphate-buffered solution) | - | - | Sigmaaldrich (Burlington, VT, USA) |
| MOPS (4-Morpholinepropanesulfonic acid, 3-(N-Morpholino) propanesulfonic acid) | 1132-61-2 | ≥99.5% | Sigma-aldrich (Burlington, VT, USA) |
| Ethanol | 64-17-5 | ≥99.9% | Supelco by Sigma-aldrich (Burlington, VT, USA) |
Disclaimer/Publisher’s Note: The statements, opinions and data contained in all publications are solely those of the individual author(s) and contributor(s) and not of MDPI and/or the editor(s). MDPI and/or the editor(s) disclaim responsibility for any injury to people or property resulting from any ideas, methods, instructions or products referred to in the content. |
© 2023 by the authors. Licensee MDPI, Basel, Switzerland. This article is an open access article distributed under the terms and conditions of the Creative Commons Attribution (CC BY) license (https://creativecommons.org/licenses/by/4.0/).
Share and Cite
Pino-Otín, M.R.; Lorca, G.; Val, J.; Ferrando, N.; Ballestero, D.; Langa, E. Ecotoxicological Study of Tannic Acid on Soil and Water Non-Target Indicators and Its Impact on Fluvial and Edaphic Communities. Plants 2023, 12, 4041. https://doi.org/10.3390/plants12234041
Pino-Otín MR, Lorca G, Val J, Ferrando N, Ballestero D, Langa E. Ecotoxicological Study of Tannic Acid on Soil and Water Non-Target Indicators and Its Impact on Fluvial and Edaphic Communities. Plants. 2023; 12(23):4041. https://doi.org/10.3390/plants12234041
Chicago/Turabian StylePino-Otín, María Rosa, Guillermo Lorca, Jonatan Val, Natalia Ferrando, Diego Ballestero, and Elisa Langa. 2023. "Ecotoxicological Study of Tannic Acid on Soil and Water Non-Target Indicators and Its Impact on Fluvial and Edaphic Communities" Plants 12, no. 23: 4041. https://doi.org/10.3390/plants12234041
APA StylePino-Otín, M. R., Lorca, G., Val, J., Ferrando, N., Ballestero, D., & Langa, E. (2023). Ecotoxicological Study of Tannic Acid on Soil and Water Non-Target Indicators and Its Impact on Fluvial and Edaphic Communities. Plants, 12(23), 4041. https://doi.org/10.3390/plants12234041