
Almond Tree Adaptation to Water Stress: Differences in Physiological Performance and Yield Responses among Four Cultivar Grown in Mediterranean Environment


Abstract
:1. Introduction
2. Materials and Methods
2.1. Orchard and Experimental Site
2.2. Cultivar Description
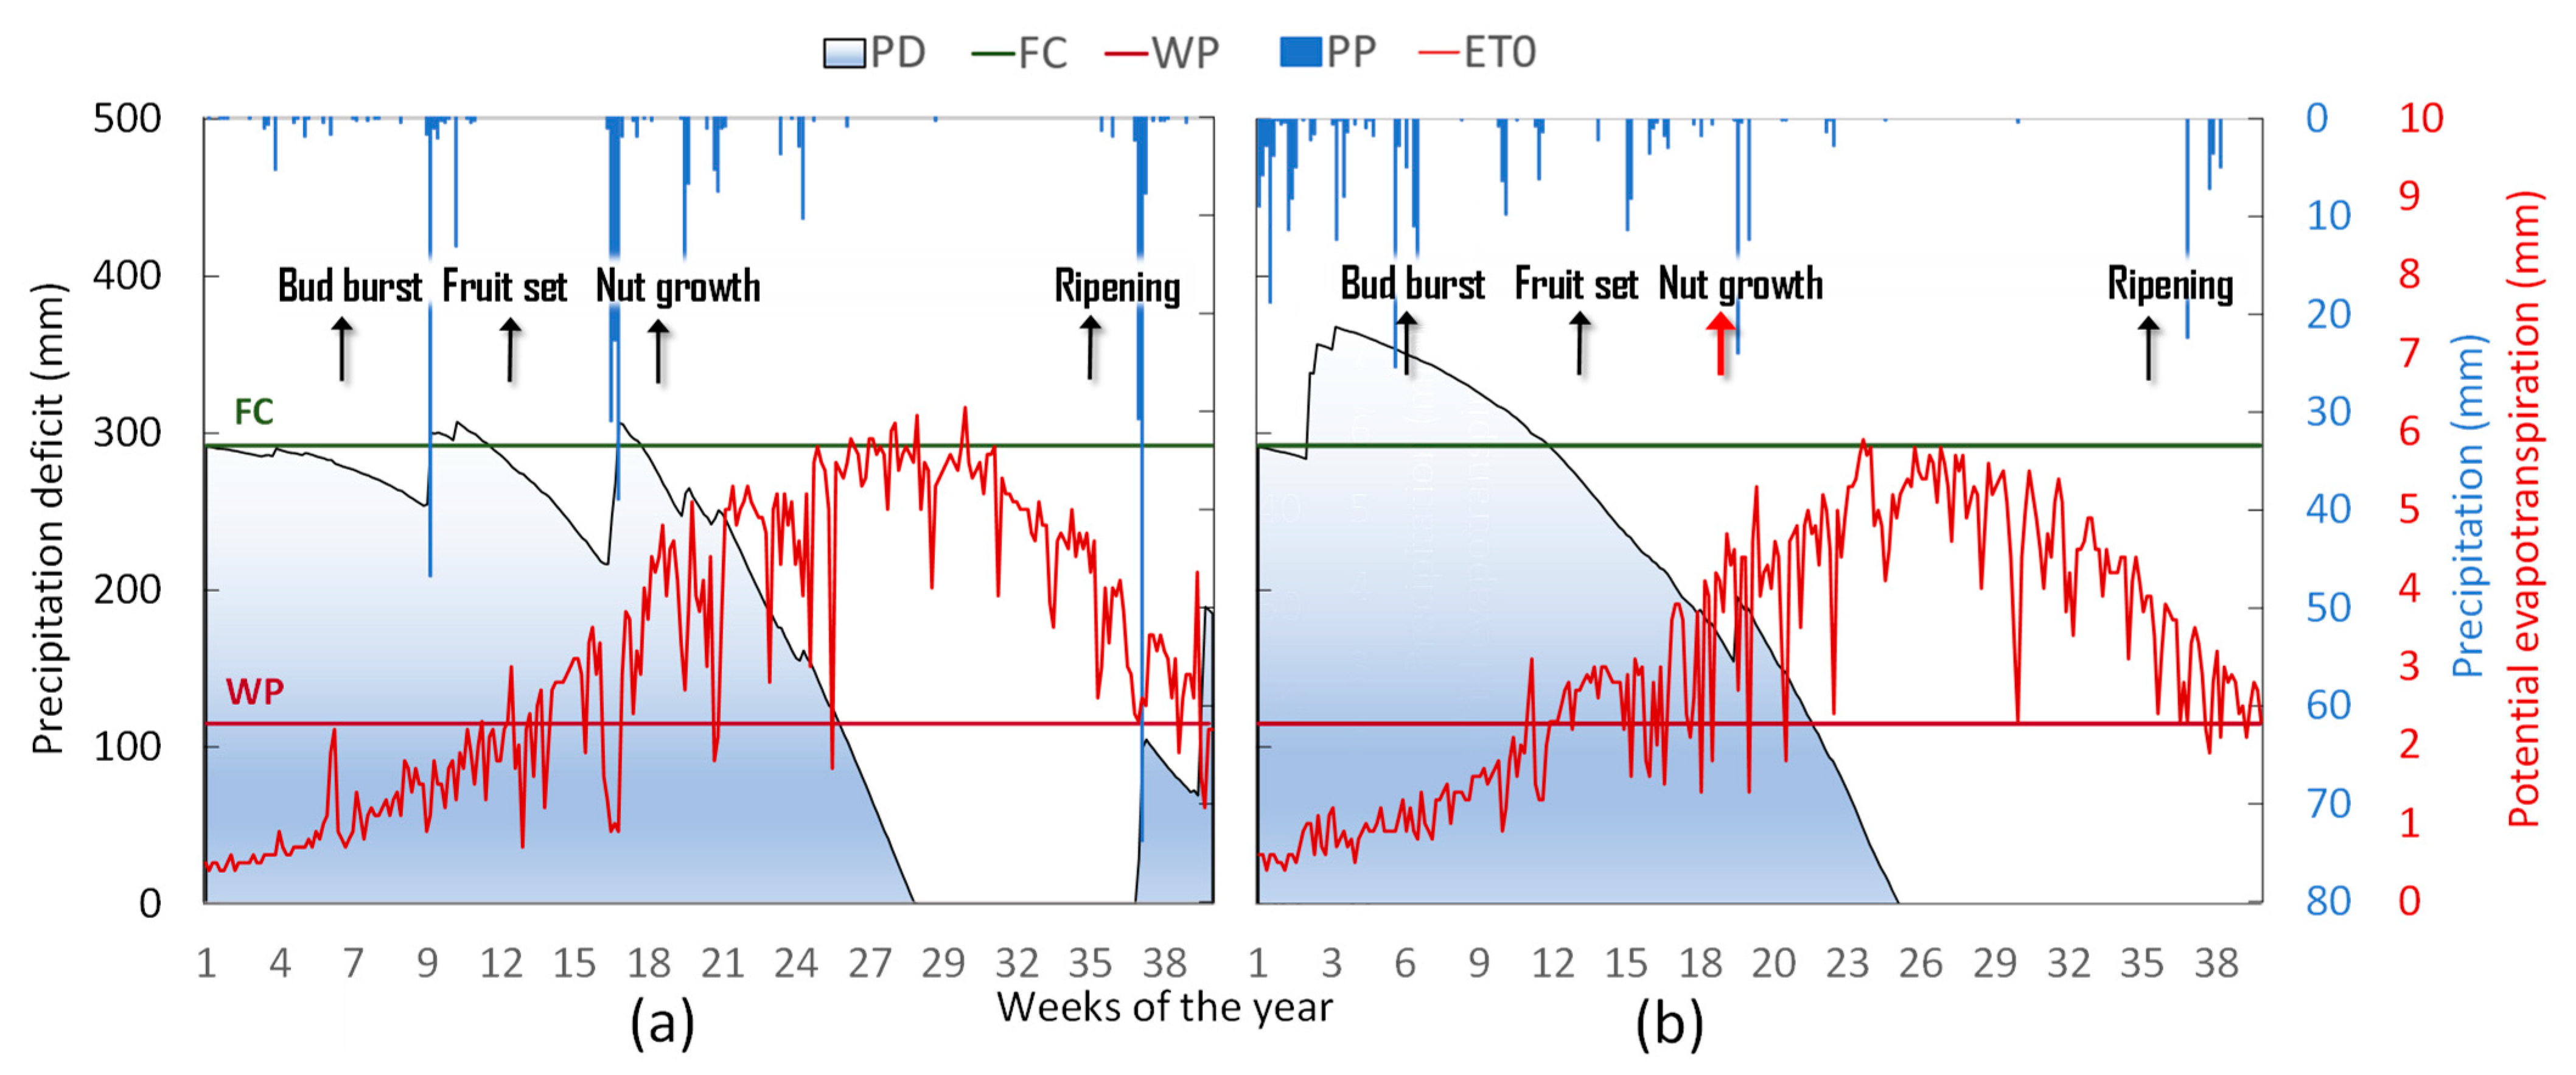
2.3. Weather, Water Balance, and Irrigation Management
2.4. Plant Water Status and Leaf Physiological Performance
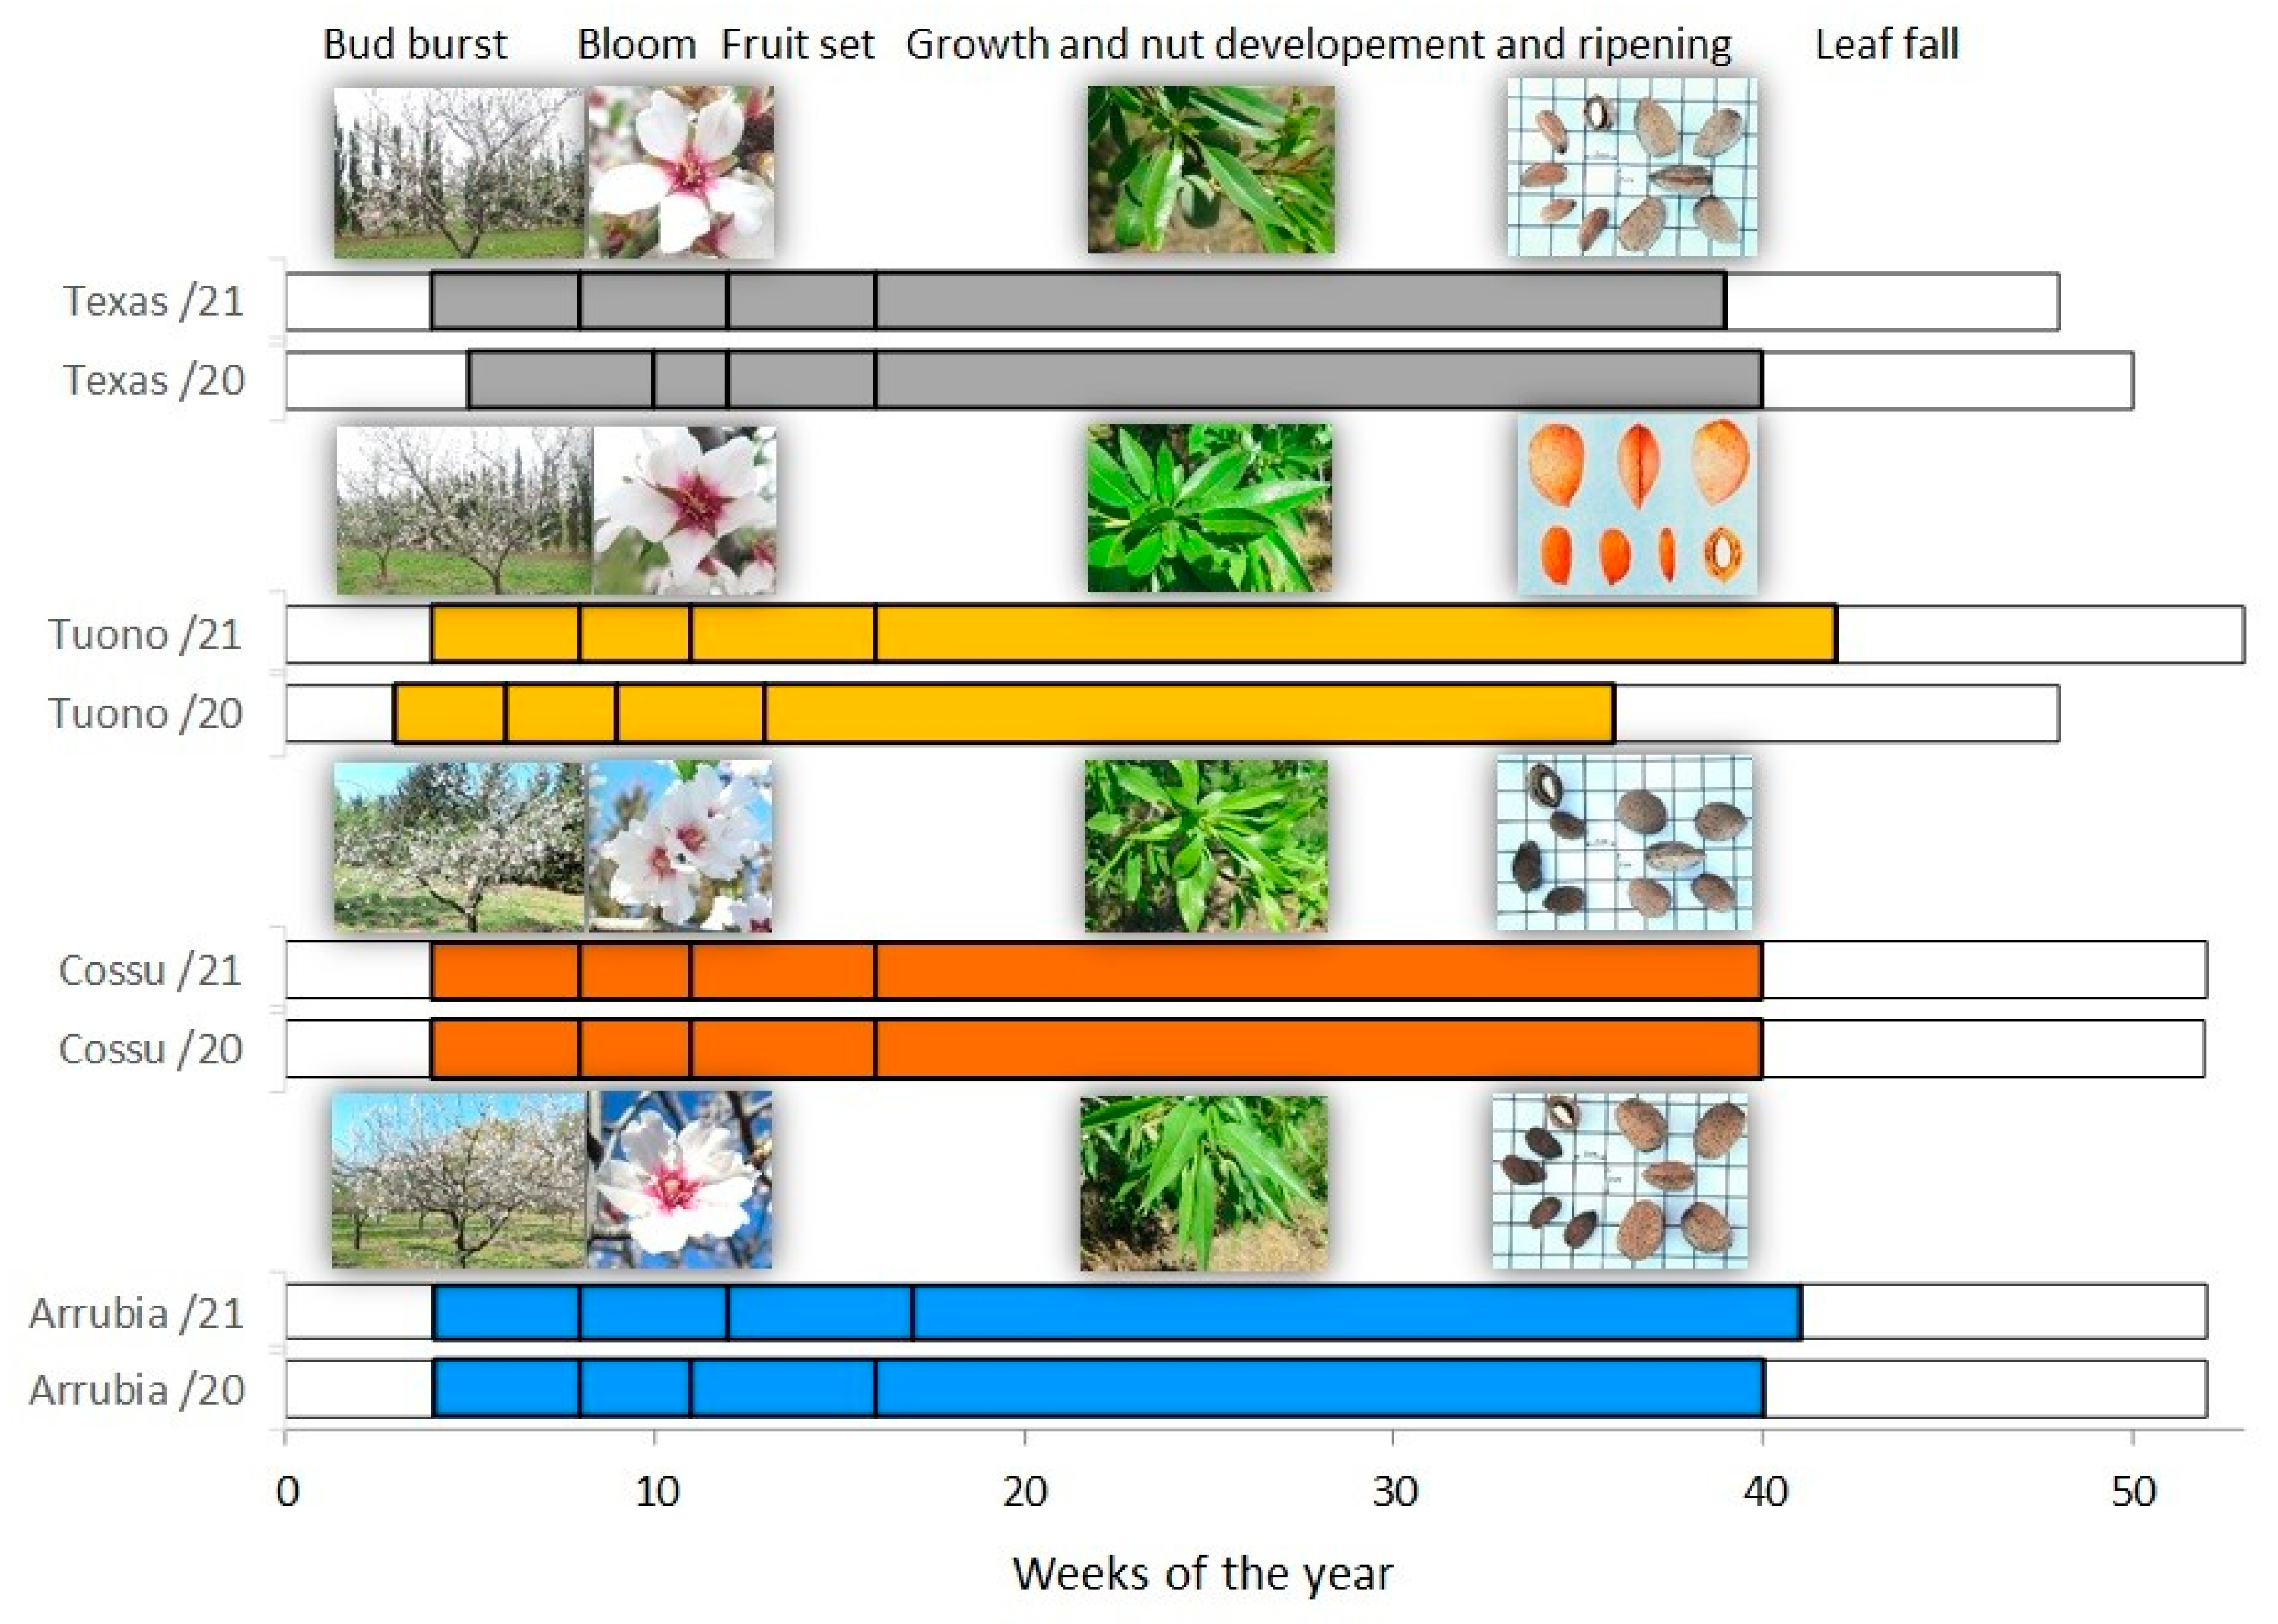
2.5. Phenological Succession, Morphological Traits, and Yield Components
2.6. Statistical Analysis
3. Results
3.1. Orchard Phenology, Season Water Balance, and Plant Water Status
3.2. Cultivar Physiological Performance and Yield Responses
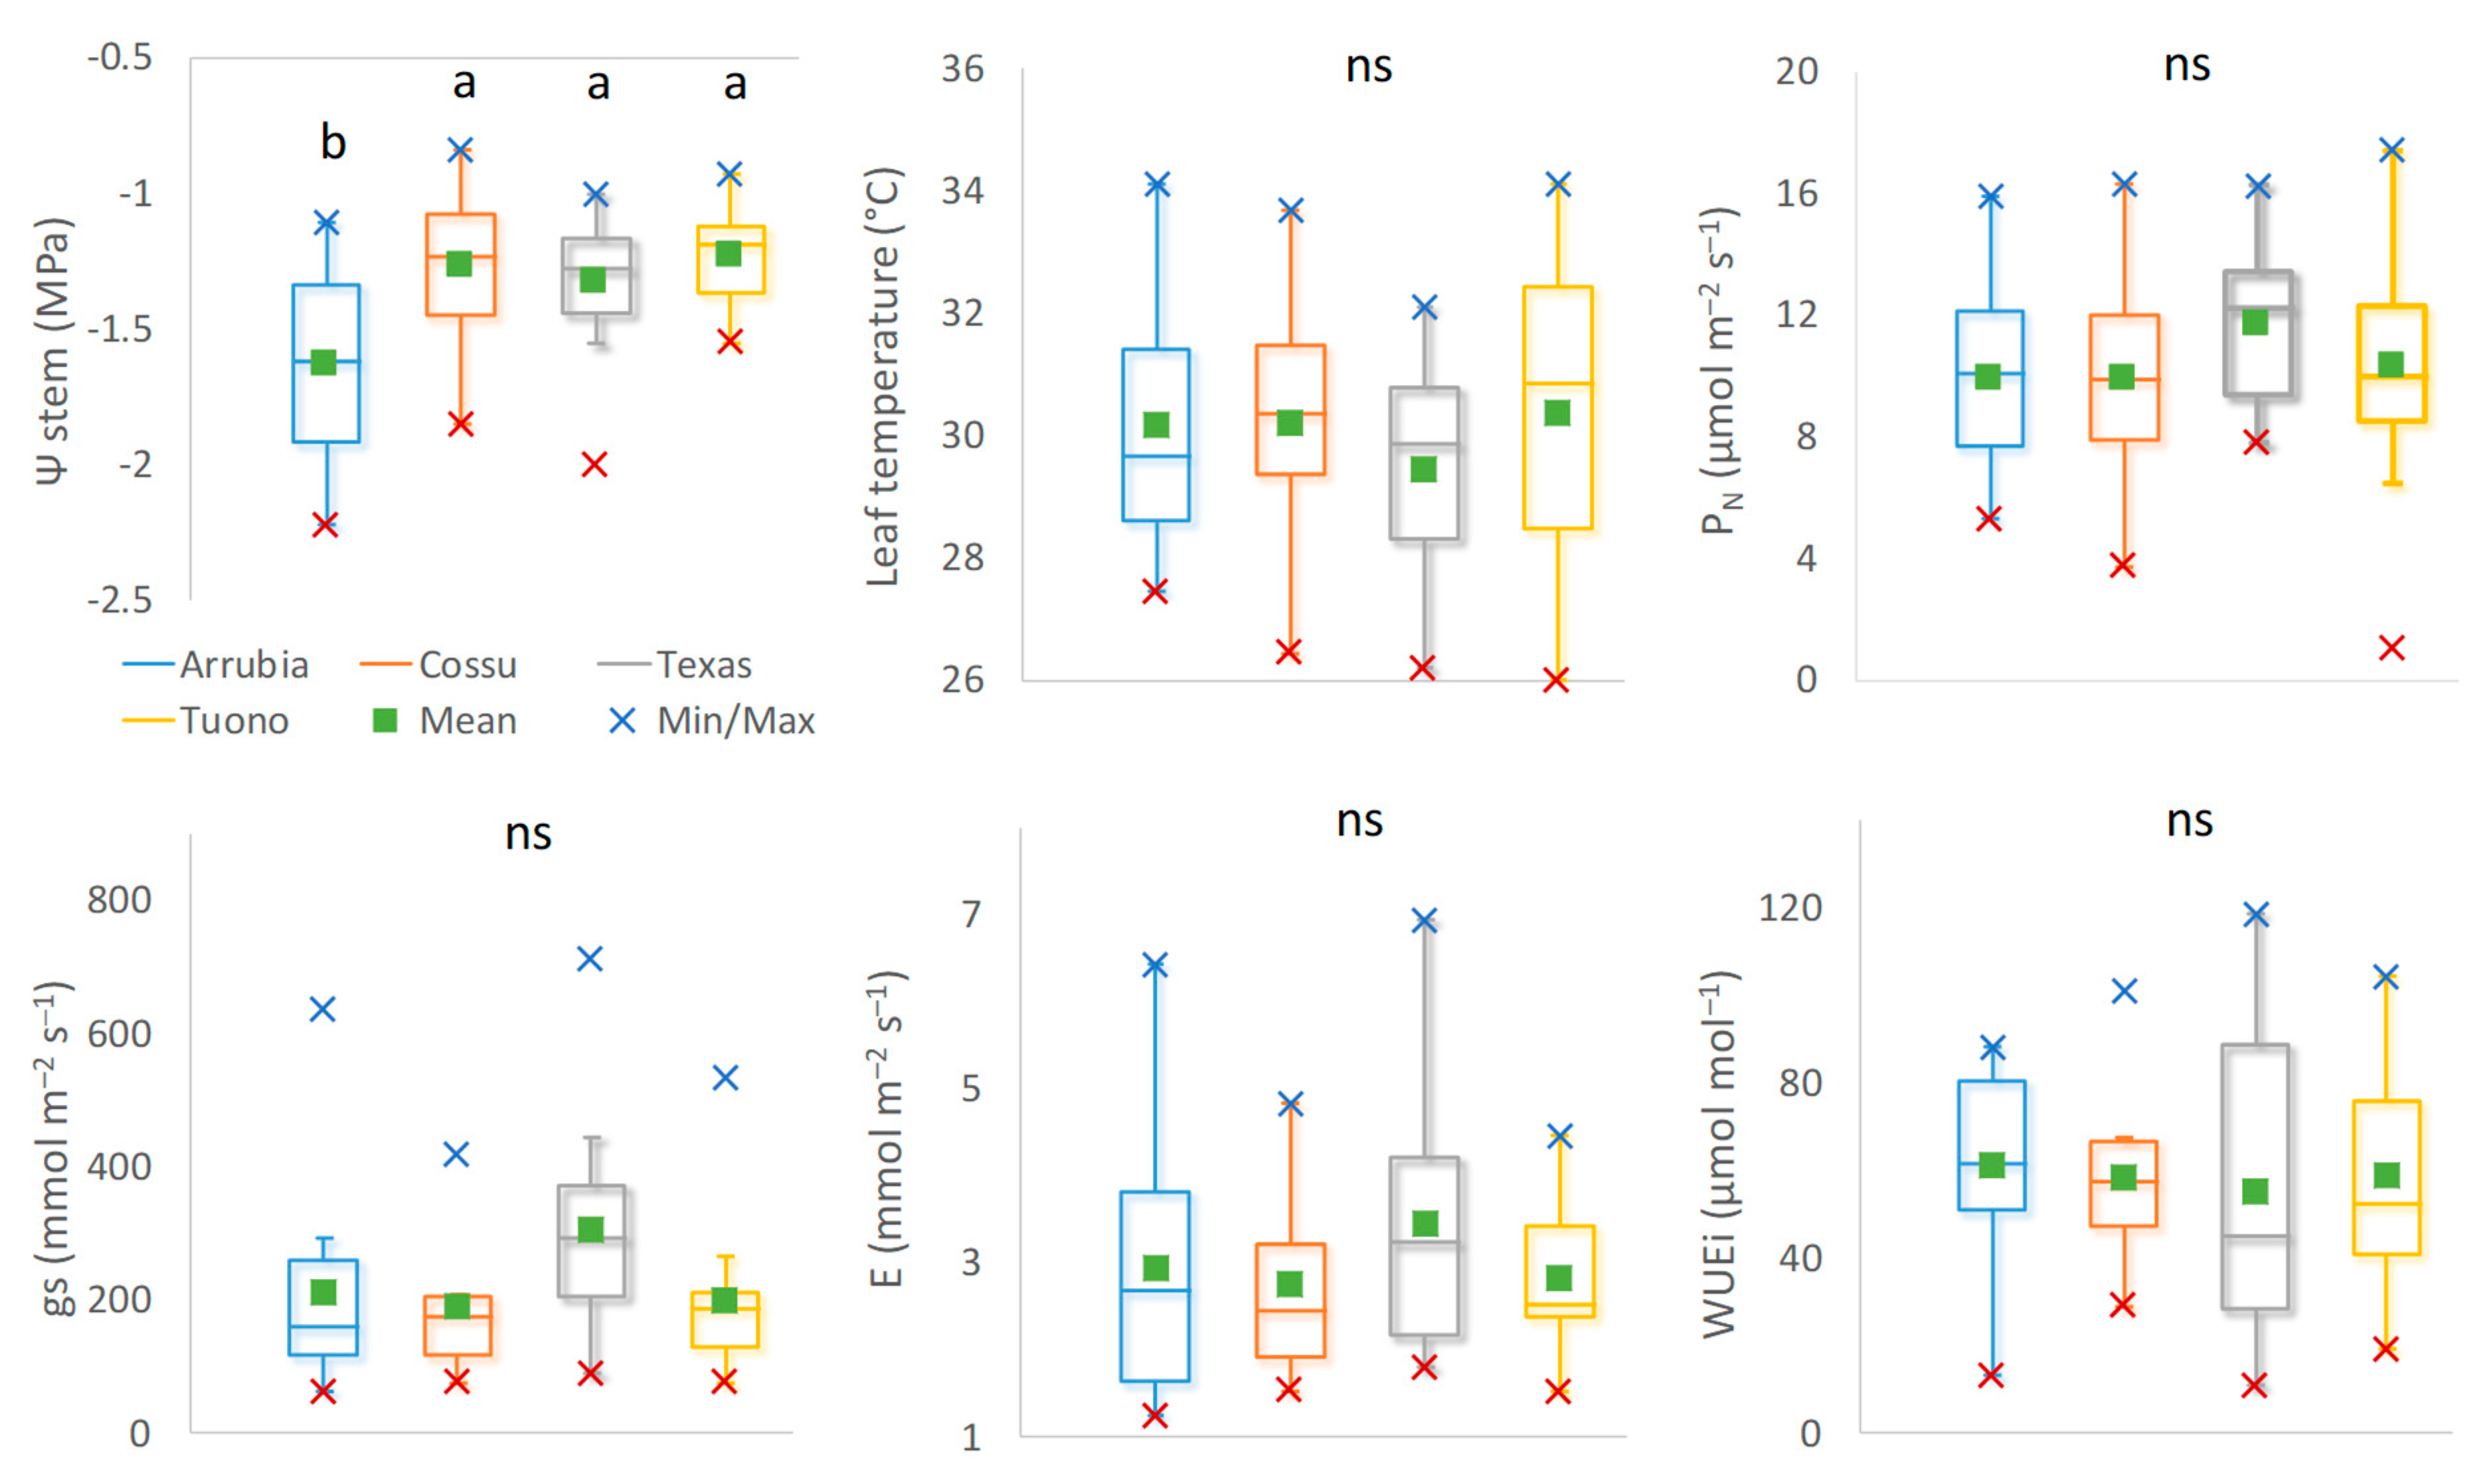
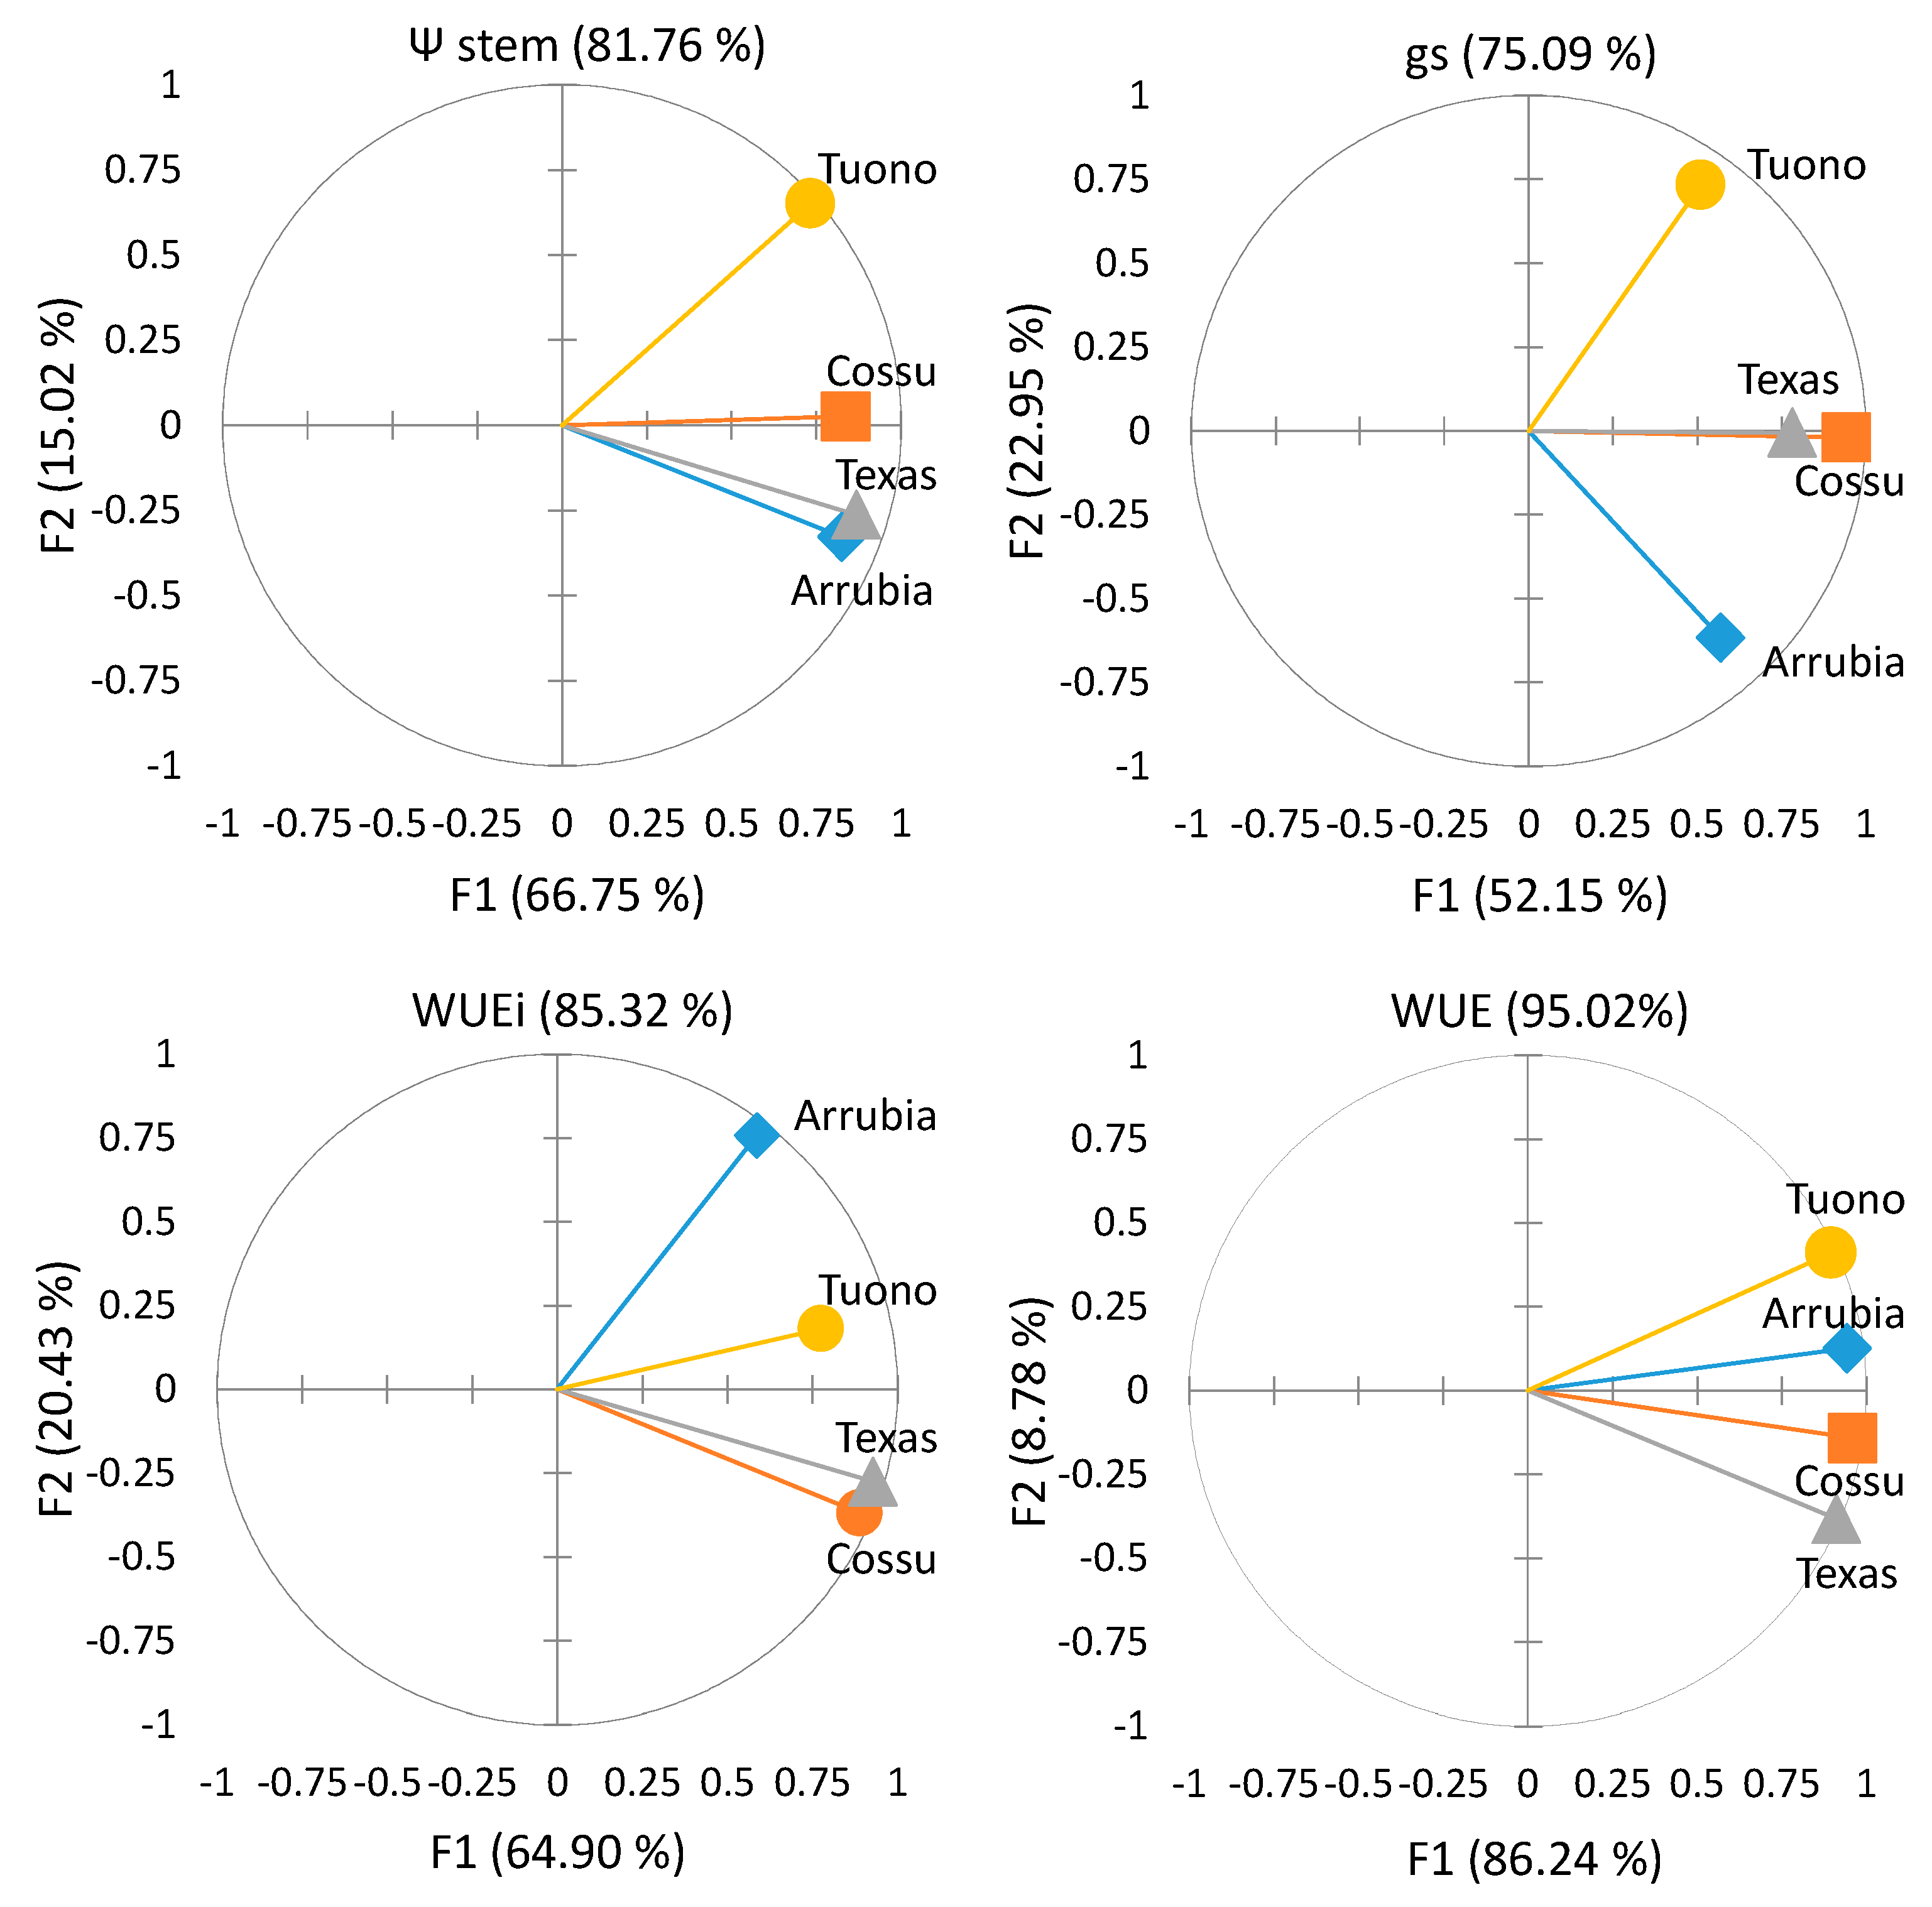
3.2.1. Water Relations and Photosynthetic Activity
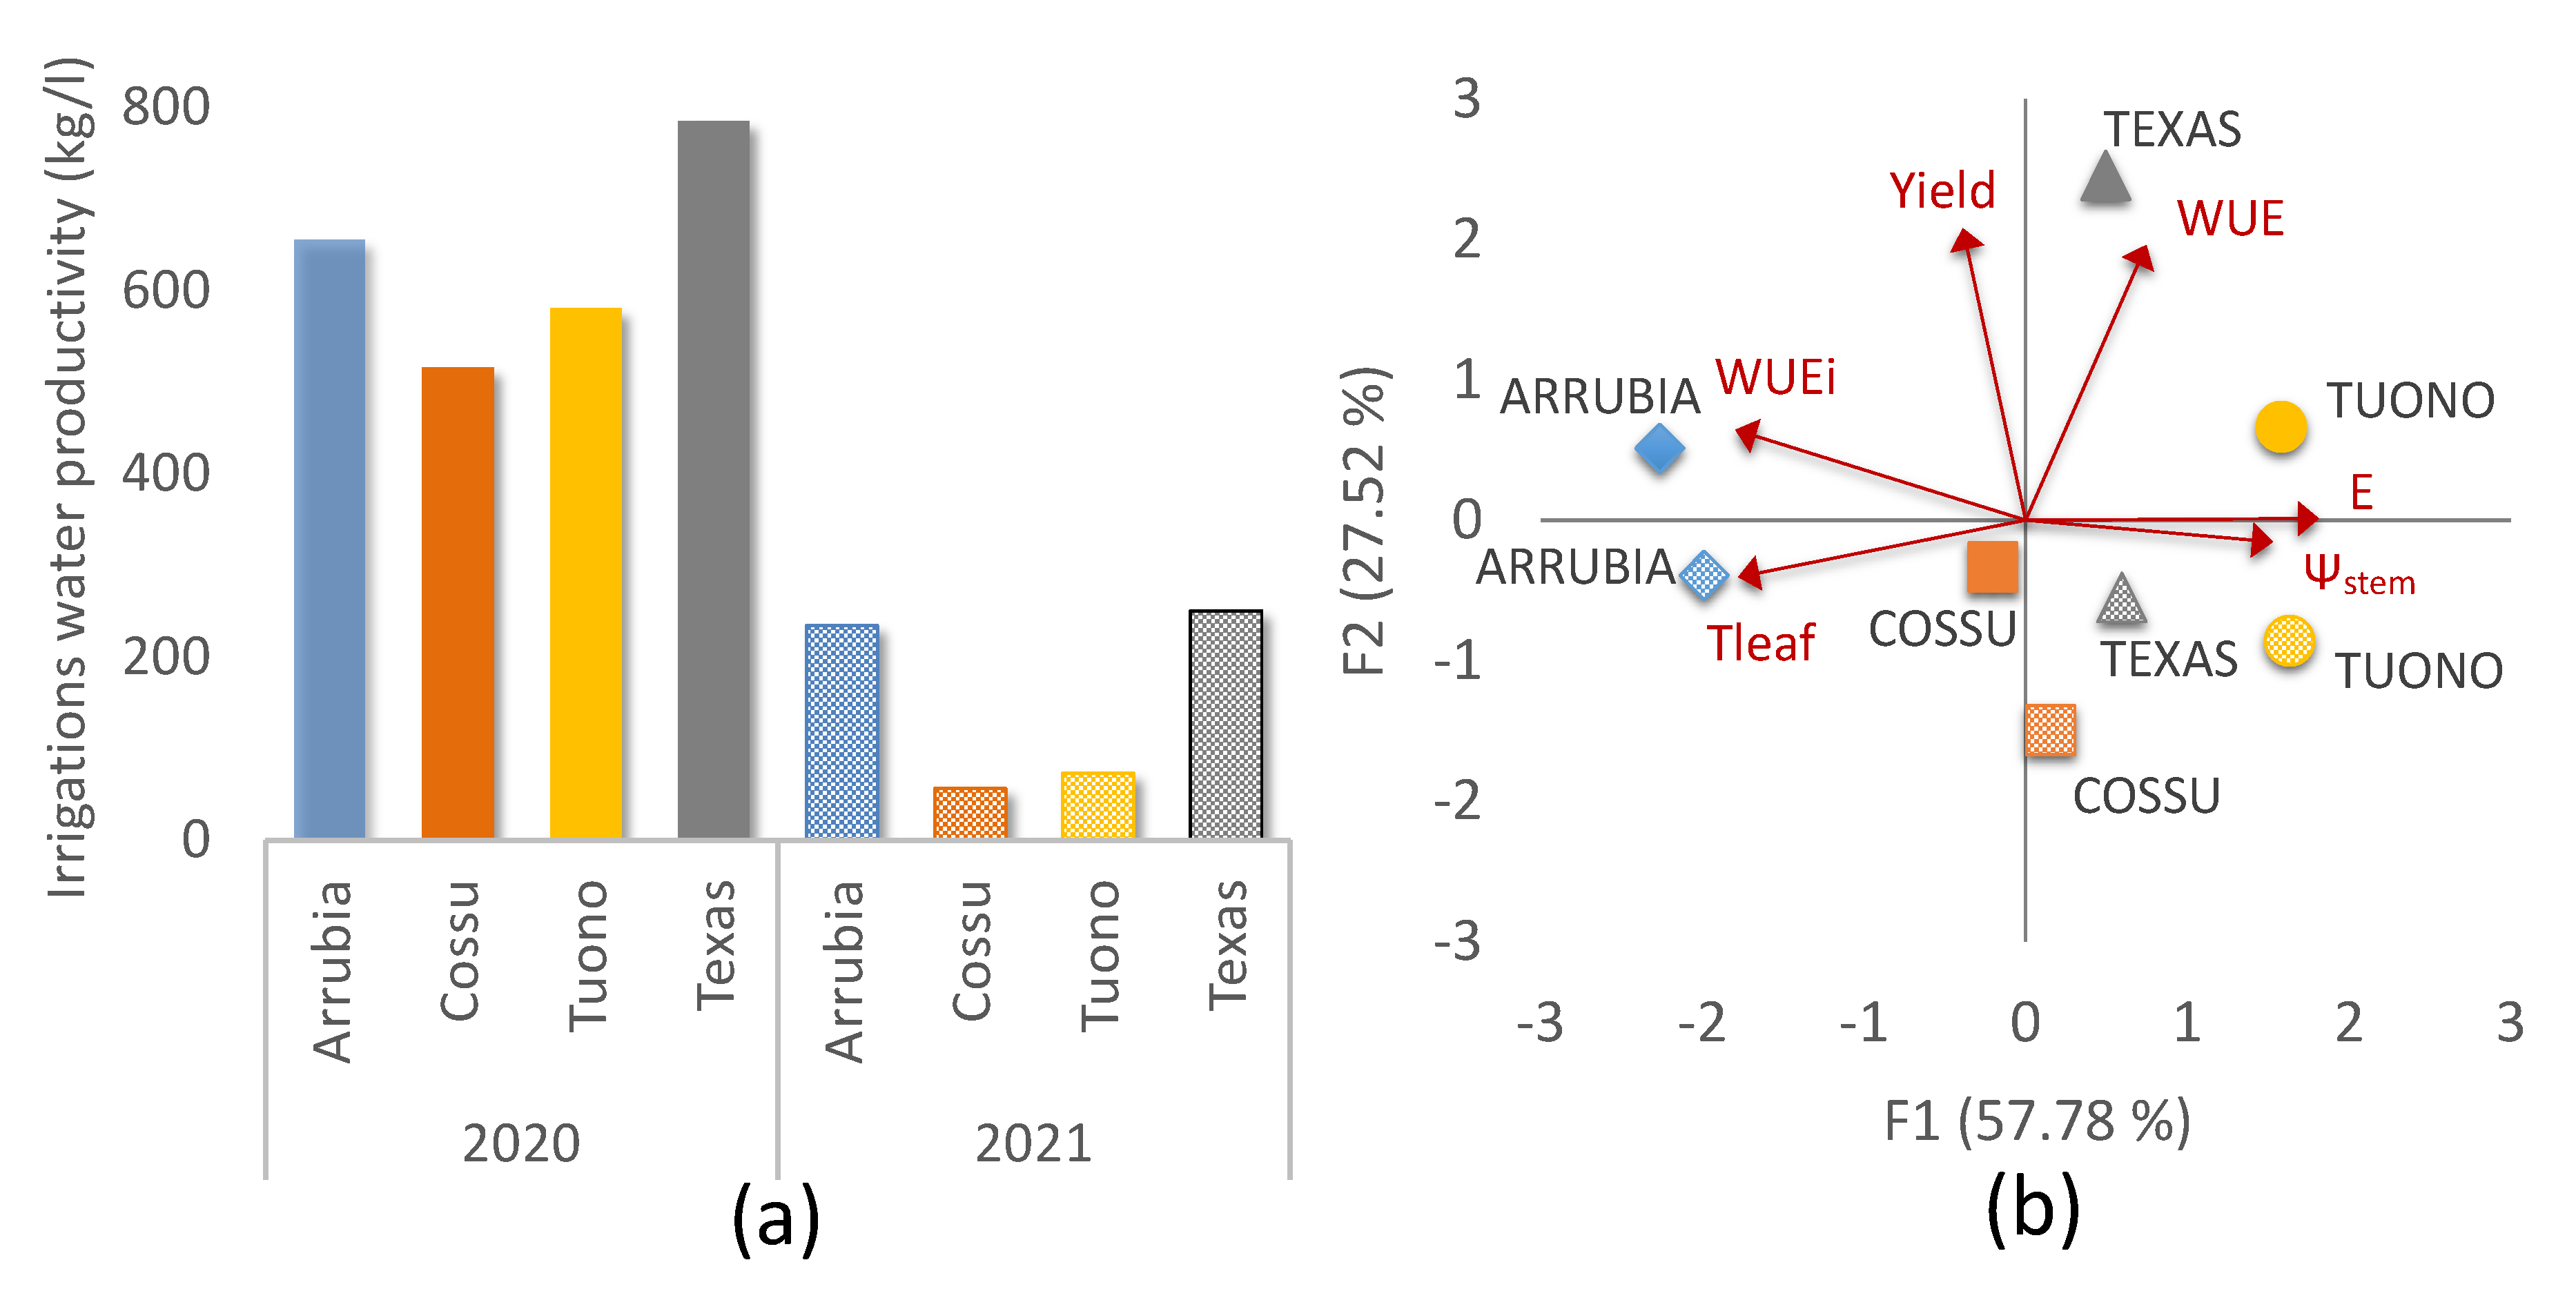
3.2.2. Yield and Water Use Efficiency
4. Discussion
5. Conclusions
Supplementary Materials
Author Contributions
Funding
Data Availability Statement
Acknowledgments
Conflicts of Interest
Appendix A

| Texture Class | Depth (cm) | Particle Size (% wt.) | Organic Matter | pH | Saturation | Field Capacity | Wilting Point | ||
|---|---|---|---|---|---|---|---|---|---|
| Sand | Loam | Clay | (%) | (% vol) | |||||
| Clay-loam | 0–20 | 42.7 | 27.1 | 30.2 | 2.33 | 7.35 | 46.6 | 32.3 | 12.8 |
| Sandy-clay-loam | 20–50 | 56.2 | 18.0 | 25.8 | 1.78 | 8.58 | 40.8 | 26.1 | 10.1 |
| Average values | 0–50 | 49.5 | 22.6 | 28.0 | 2.1 | 8.0 | 43.7 | 29.2 | 11.5 |
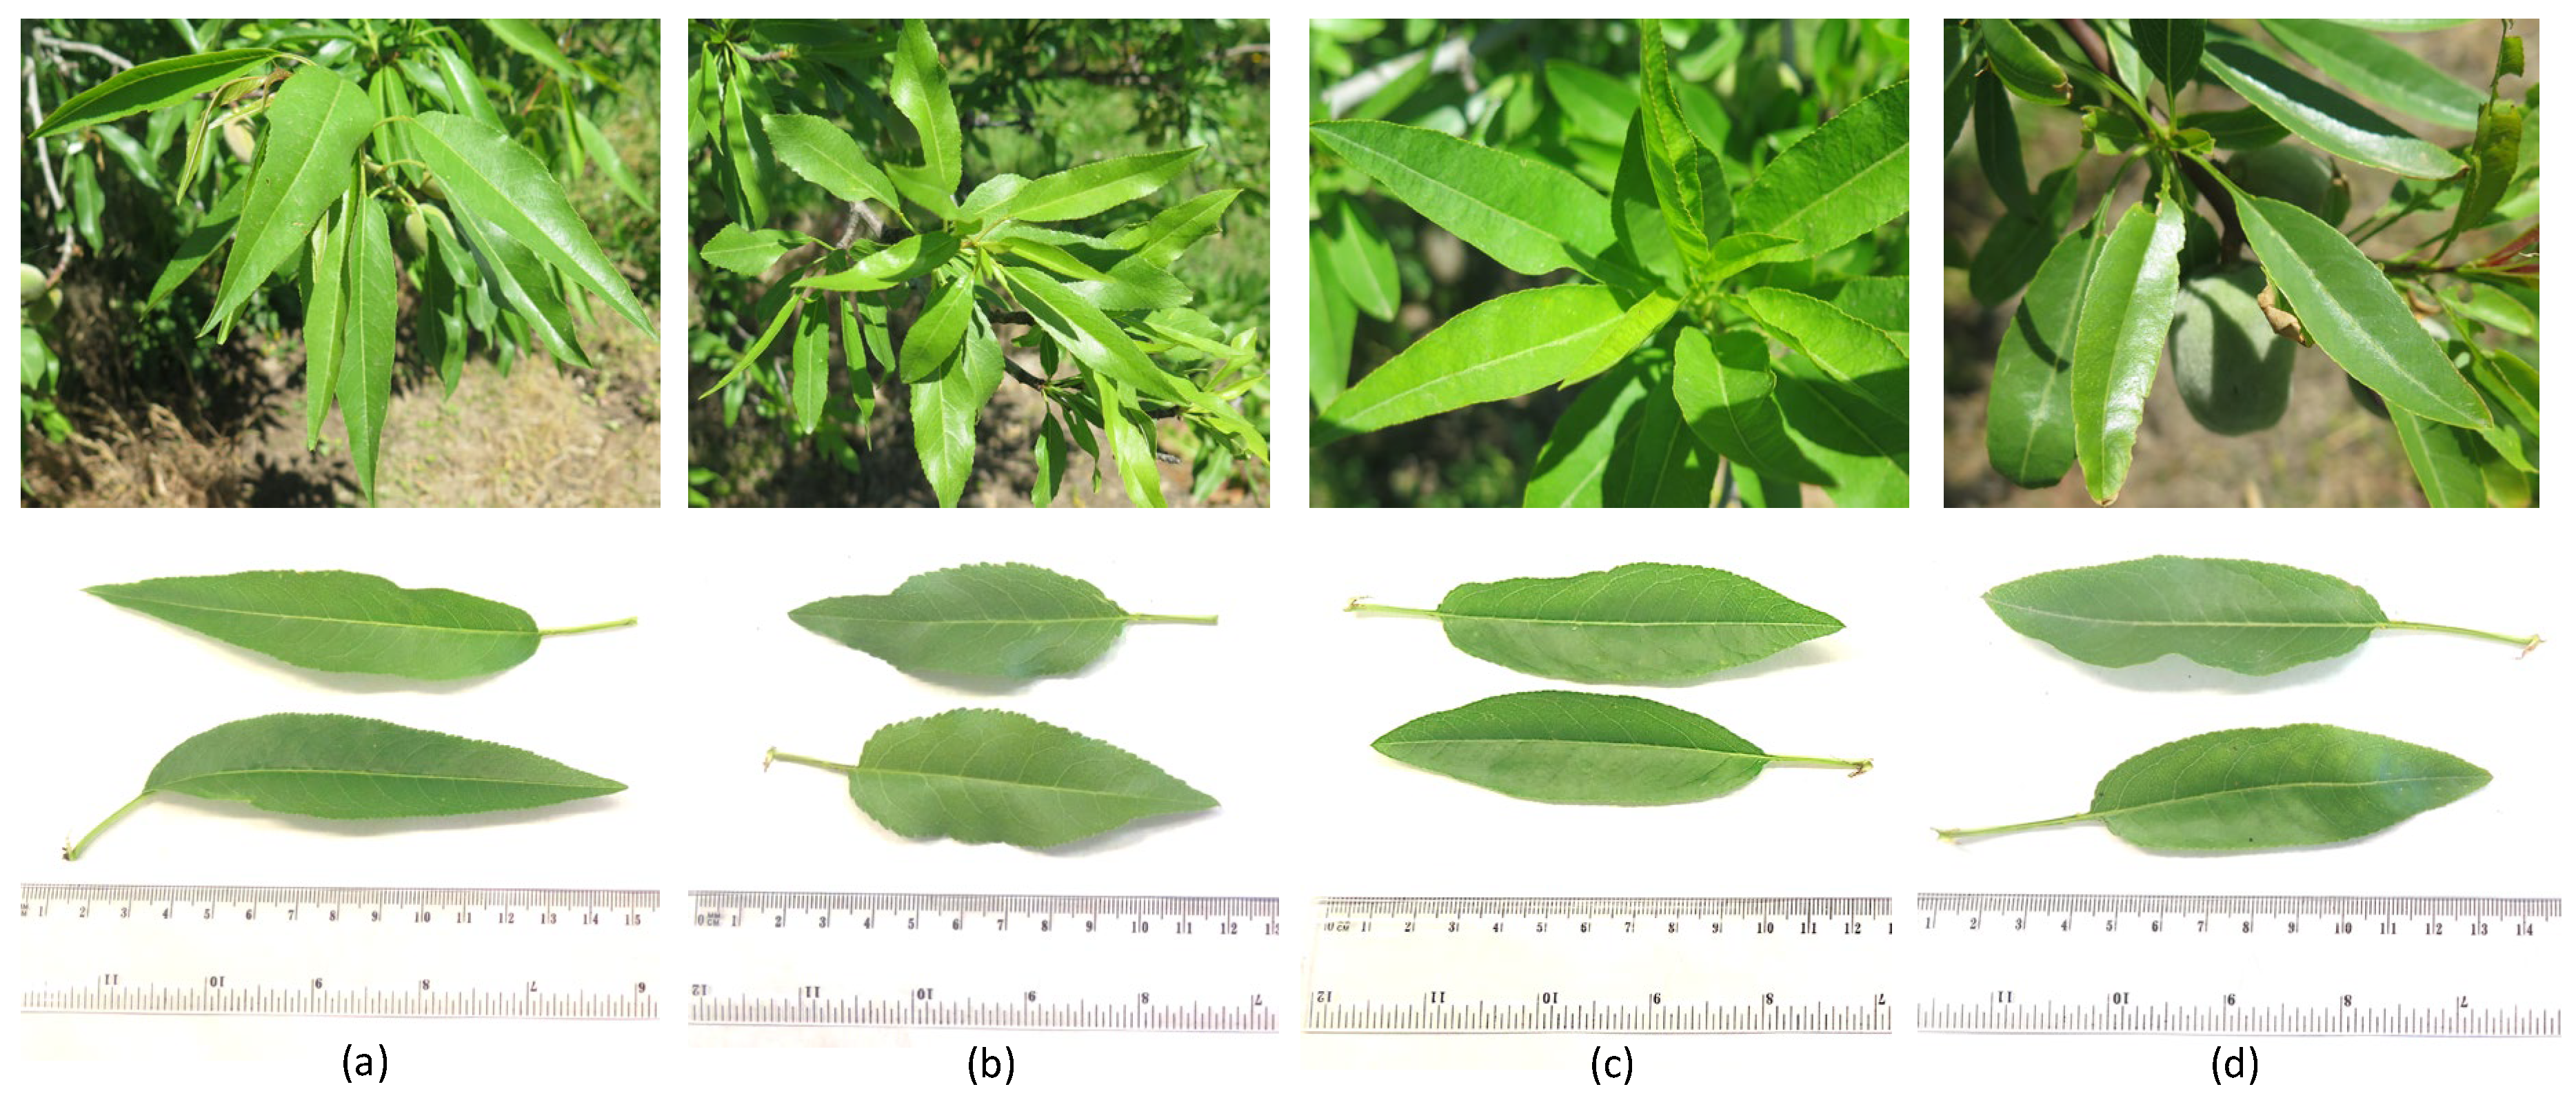
| ‘Arrubia’ | ‘Cossu’ | ‘Tuono’ | ‘Texas’ | Significance | |
|---|---|---|---|---|---|
| Leaf length (cm) | 11.1 ± 0.34 a | 7.9 ± 0.28 c | 9.06 ± 0.32 b | 8.8 ± 0.26 b | 0.001 |
| Leaf width (cm) | 2.7 ± 0.07 | 2.7 ± 0.10 | 2.7 ± 0.10 | 2.8 ± 0.08 | 0.420 |
| Area (cm2) | 93.4 ± 4.48 a | 66.8 ± 3.82 c | 77.4 ± 2.94 bc | 79.1 ± 3.4 b | 0.001 |
References
- Chessa, I.; Nieddu, G.; Pala, M. Il mandorlo. In Le Vecchie Varietà della Sardegna. Patrimonio Genetico Specie Arboree da Frutto, 2nd ed.; Agabbio, M., Ed.; Carlo Delfino Editore: Sassari, Italy, 1994; pp. 225–277. [Google Scholar]
- Ladizinsky, G. On the origin of almond. Gen. Resour. Crop Evol. 1999, 46, 143–147. [Google Scholar] [CrossRef]
- Barbera, G.; De Pau, L.; D’Hallewin, G.; Gaeta, L.; Lipari, E.; Losciale, P.; Manganiello, R.; Mulas, M.; Omodei, F.; Palasciano, M.; et al. Mandorlo. In Atlante dei Fruttiferi Autoctoni Italiani, 1st ed.; Fideghelli, C., Ed.; Ministero delle Politiche Agricole Alimentari e Forestali: Rome, Italy, 2016; Volume II, pp. 971–1047. [Google Scholar]
- FAOSTATS 2021–2022. Available online: https://www.fao.org/faostat/en/#search/almond (accessed on 20 December 2022).
- Maldera, F.; Vivaldi, G.A.; Iglesias-Castellarnau, I.; Camposeo, S. Two almond cultivar trained in a super-high density orchard show different growth, yield efficiencies and damages by mechanical harvesting. Agronomy 2021, 11, 1406. [Google Scholar] [CrossRef]
- Mulas, M.; Muntoni, M.; De Pau, L.; Satta, D.; Schirru, G.; Tocco, F.; Asuni, G.; Zedda, G. La Mandorlicoltura in Marmilla. Realtà e Opportunità di Sviluppo, 1st ed.; Comune di Genuri: Genuri, Italy, 2019; p. 110. [Google Scholar]
- Sottile, F.; Barone, E.; Barbera, G.; Palasciano, M. The Italian almond industry: New perspectives and ancient tradition. Acta Hortic. 2014, 1028, 401–406. [Google Scholar] [CrossRef] [Green Version]
- Del Faro, L. Analisi molecolari del germoplasma autoctono italiano. Fingerprinting. Il mandorlo. In Atlante dei Fruttiferi Autoctoni Italiani, 1st ed.; Fideghelli, C., Ed.; Ministero delle Politiche Agricole Alimentari e Forestali: Rome, Italy, 2016; Volume I, pp. 56–61. [Google Scholar]
- Campus, M.; Sanna, M.; Scanu, G.; Di Salvo, R.; De Pau, L.; Satta, D.; Demarcus, A.; Roggio, T. Impact of almond variety on “Amaretti” cookies as assessed through image features modeling, physical chemical measures and sensory analysis. Foods 2020, 9, 1272. [Google Scholar] [CrossRef]
- Barreca, D.; Nabavi, S.M.; Sureda, A.; Rasekhian, M.; Raciti, R.; Silva, A.S.; Annunziata, G.; Arnone, A.; Tenore, G.C.; Süntar, İ.; et al. Almonds (Prunus dulcis Mill. D.A. Webb): A source of nutrients and health-promoting compounds. Nutrients 2020, 12, 672. [Google Scholar] [CrossRef] [Green Version]
- Velasco, D.; Hough, J.; Aradhya, M.; Ross-Ibarra, J. Evolutionary genomics of peach and almond domestication. G3 2016, 6, 3985–3993. [Google Scholar] [CrossRef] [Green Version]
- Rapposelli, E.; Rigoldi, M.P.; Satta, D.; Delpiano, D.; Secci, S.; Porceddu, A. Genetic, phenotypic, and commercial characterization of an almond collection from Sardinia. Plants 2018, 7, 86. [Google Scholar] [CrossRef] [Green Version]
- Rigoldi, M.P.; Rapposelli, E.; De Giorgio, D.; Resta, P.; Porceddu, A. Genetic diversity in two Italian almond collections. Electron. J. Biotechnol. 2015, 18, 40–45. [Google Scholar] [CrossRef] [Green Version]
- Ledbetter, C.A. ‘Yorizane’: A new self-compatible almond cultivar suitable for California Production. HortScience 2021, 56, 1142–1143. [Google Scholar] [CrossRef]
- Mulas, M.; Nieddu, G.; Schirra, M.; D’Hallewin, G. Bioagronomic comparison among six cultivar and two rootstocks for irrigated almond cultivation. In Proceedings of the Huitième Colloque du Grempa—Group de Recherché et d’Étude Méditerranéen pour le Pistachier et l’Amandier, Nimes, France, 26–27 June 1990; pp. 259–263. [Google Scholar]
- Socias i Company, R.; Fernández i Martí, A.; Kodad, O.; Alonso, J.M. Self-compatibility Evaluation in Almond: Strategies, Achievements and Failures. HortScience 2010, 45, 1155–1159. [Google Scholar] [CrossRef] [Green Version]
- Moldero, D.; López-Bernal, Á.; Testi, L.; Lorite, I.J.; Fereres, E.; Orgaz, F. Almond responses to a single season of severe irrigation water restrictions. Irrig. Sci. 2021, 40, 1–11. [Google Scholar] [CrossRef]
- Fereres, E.; Soriano, M.A. Deficit irrigation for reducing agricultural water use. J. Exp. Bot. 2007, 58, 147–159. [Google Scholar] [CrossRef] [Green Version]
- Prgomet, I.; Pascual-Seva, N.; Morais, M.C.; Aires, A.; Barreales, D.; Castro Ribeiro, A.; Silva, A.; Barros, A.; Gonçalves, B. Physiological and biochemical performance of almond trees under deficit irrigation. Sci. Hortic. 2020, 261, 108990. [Google Scholar] [CrossRef] [Green Version]
- Parker, L.; Abatzoglou, J. Shifts in the thermal niche of almond under climate change. Clim. Chang. 2018, 147, 211–214. [Google Scholar] [CrossRef]
- Castel, J.R.; Fereres, E. Responses of young almond trees to two drought periods in the field. J. Hortic. Sci. 1982, 57, 175–187. [Google Scholar] [CrossRef]
- Shao, Y.; Cheng, Y.; Pang, H.; Chang, M.; He, F.; Wang, M.; Davis, D.J.; Zhang, S.; Betz, O.; Fleck, C.; et al. Investigation of Salt Tolerance Mechanisms across a Root Developmental Gradient in Almond Rootstocks. Front. Plant Sci. 2021, 5, 11:595055. [Google Scholar] [CrossRef]
- Egea, G.; Nortes, P.A.; González-Real, M.M.; Baille, A.; Domingo, R. Agronomic response and water productivity of almond trees under contrasted deficit irrigation regimes. Agric. Water Manag. Int. J. 2010, 97, 171–181. [Google Scholar] [CrossRef]
- Goldhamer, D.A.; Viveros, M.; Salinas, M. Regulated deficit irrigation in almonds: Effects of variations in applied water and stress timing on yield and yield components. Irrig. Sci. 2006, 24, 101–114. [Google Scholar] [CrossRef]
- Goldhamer, D.A.; Smith, T. Single season drought irrigation strategies influence almond production. Calif. Agric. 1995, 49, 19–22. [Google Scholar] [CrossRef]
- Fereres, E.; Aldrich, T.M.; Schulbach, H.; Martinich, D.A. Response of young almond trees to late-season drought. Calif. Agric. 1981, 35, 11–12. [Google Scholar]
- Shackel, K.; Edstrom, J.; Fulton, A.; Lampinen, B.; Schwankl, L.; Olivos, A.; Stewart, W.; Cutter, S.; Metcalf, S.; Munoz, H.; et al. Drought survival strategies for established almond orchards on shallow soil. In Proceedings of the Almond Industry Conference, Modesto, CA, USA, 8–9 December 2010. [Google Scholar]
- Ruíz-Sánchez, M.; Sánchez-Blanco, M.; Planes, J.; Alarcón, J.; Torrecillas, A. Seasonal changes in leaf water potential components in two almond cultivars. J. Agric. Sci. 1993, 120, 347–351. [Google Scholar] [CrossRef]
- Hernandez-Santana, V.; Rodriguez-Dominguez, C.M.; Fernández, J.E.; Diaz-Espejo, A. Role of leaf hydraulic conductance in the regulation of stomatal conductance in almond and olive in response to water stress. Tree Physiol. 2016, 36, 725–735. [Google Scholar] [CrossRef] [Green Version]
- Rahemi, A.; Fatahi, R.; Ebadi, A.; Taghavi, T.; Hassani, D.; Gradziel, T.; Folta, K.; Chaparro, J. Genetic diversity of some wild almonds and related Prunus species revealed by SSR and EST-SSR molecular markers. Plant Syst. Evol. 2012, 298, 173–192. [Google Scholar] [CrossRef]
- Kodad, O.; En Nahli, S.; El Baji, M.; Martínez-Gómez, P.; Martínez Garcia, P.J. Low fruitfulness in local almond orchards could be due to the inbreeding depression effect. Mor. J. Agri. Sci. 2021, 2, 1–8. [Google Scholar]
- Fernández i Martí, A.; Alonso, J.M.; Espiau, M.T.; Rubio-Cabetas, M.J.; Socias i Company, R. Genetic diversity in Spanish and foreign almond germplasm assessed by molecular characterization with simple sequence repeats. J. Am. Soc. Hort. Sci. 2009, 134, 535–542. [Google Scholar] [CrossRef] [Green Version]
- Sánchez-Pérez, R.; Ortega, E.; Duval, H.; Martínez-Gómez, P.; Dicenta, F. Inheritance and relationships of important agronomic traits in almond. Euphytica 2007, 155, 381–391. [Google Scholar] [CrossRef]
- Socias i Company, R.; Alonso, J.M.; Gómez Aparisi, J. Fruit set and productivity in almond as related to self-compatibility, flower morphology and bud density. J. Hortic. Sci. Biotechnol. 2004, 79, 754–758. [Google Scholar] [CrossRef]
- Lorite, I.J.; Cabezas, J.M.; Arquero, O.; Gabaldón-Leal, C.; Santos, C.; Rodríguez, A.; Ruiz-Ramos, M.; Lovera, M. The role of phenology in the climate change impacts and adaptation strategies for tree crops: A case study on almond orchards in Southern Europe. Agric. For. Meteorol. 2020, 294, 108142. [Google Scholar] [CrossRef]
- Sirotti, G. Il mandorlo. Contributo allo stato della coltura del mandorlo nella provincia di Cagliari. In Cattedra Ambulante di Agricoltura; Soc. Edit. It.: Cagliari, Italy, 1935. [Google Scholar]
- Millela, A. Le principali cultivar di mandorlo della Sardegna. Indagini condotte in provincia di Cagliari. Studi Sassaresi Sez. III 1960, VII, 2–18. [Google Scholar]
- Chessa, I.; Pala, M. Survey of the patrimony of almond variety in Sardinia. Opt. Mediterr. 1985, 1985, 97–103. [Google Scholar]
- De Giorgio, D.; Polignano, G.B. Evaluation the biodiversity of almond cultivar from a germplasm collection field in Southern Italy. In Sustaining the Global Farm; Stott, D.E., Mohtar, R.H., Steinhardt, G.C., Eds.; ISCO: West Lafayette, IN, USA, 2001; pp. 305–311. [Google Scholar]
- Palasciano, M.; Logoluso, V.; Lipari, E. Differences in drought tolerance in almond cultivar grown in Apulia region (Southeast Italy). Acta Hortic. 2014, 1028, 319–334. [Google Scholar] [CrossRef]
- Kester, D.E.; Gradziel, T.M.; Micke, W.C. Identifying Pollen Incompatibility Groups in California Almond Cultivar. J. Am. Soc. Hort. Sci. 1994, 119, 106–109. [Google Scholar] [CrossRef] [Green Version]
- Shiran, B.; Amirbakhtiar, N.; Kiani, S.; Mohammadi, S.; Sayed-Tabatabaei, B.E. Molecular characterization and genetic relationship among almond cultivar assessed by RAPD and SSR markers. Sci. Hort. 2007, 111, 280–292. [Google Scholar] [CrossRef]
- Bioversity International. Guidelines for the Development of Crop Descriptor Lists; Bioversity Technical Bulletin Series; Bioversity International: Rome, Italy, 2007; xii+72p, Available online: https://cropgenebank.sgrp.cgiar.org/images/file/learning_space/technicalbulletin13.pdf (accessed on 18 January 2023).
- Allen, R.G.; Perrier, L.S.; Raes, D.; Smith, M. Crop Evapotranspiration: Guidelines for Computing Crop Requirements; Irrigation and Drainage Paper No. 56; Food and Agriculture Organization of the United Nations: Rome, Italy, 1998; p. 300. [Google Scholar]
- Doorenbos, J.; Pruitt, W.O. Crop Water Requirements; FAO Irrigation and Drainage Paper 24; Food and Agriculture Organization of the United Nations: Rome, Italy, 1977; p. 144. [Google Scholar]
- Fiori, M.; Delitala, A.; Peana, I. Analisi Agrometeorologica e Climatologica della Sardegna. Analisi delle Condizioni Meteorologiche e Conseguenze sul Territorio Regionale nel Periodo Ottobre 2019—Settembre 2020. Dipartimento Meteoclimatico dell’Agenzia Regionale per la Protezione dell’Ambiente della Sardegna (ARPAS), Sassari, Italy. p. 85. Available online: http://www.sar.sardegna.it/pubblicazioni/periodiche/AnalisiAgrometeorologicaClimatologicaSardegna2019-2020.pdf (accessed on 6 December 2022).
- Fiori, M.; Delitala, A.; Peana, I. Analisi Agrometeorologica e Climatologica della Sardegna. Analisi delle Condizioni Meteorologiche e Conseguenze sul Territorio Regionale nel Periodo Ottobre 2021—Settembre 2021. Dipartimento Meteoclimatico dell’Agenzia Regionale per la Protezione dell’Ambiente della Sardegna (ARPAS), Sassari, Italy. p. 83. Available online: http://www.sar.sardegna.it/pubblicazioni/periodiche/AnalisiAgrometeorologicaClimatologicaSardegna2020-2021.pdf (accessed on 6 December 2022).
- Scholander, P.F.; Hammel, H.T.; Brandtreet, E.T.; Hemmingsen, E.A. Sap pressure in vascular plants: Negative hydrostatic pressure can be measured in plants. Science 1965, 148, 339–346. [Google Scholar] [CrossRef]
- Jones, H.G. Irrigation scheduling: Advantages and pitfalls of plant-based methods. J. Exp. Bot. 2004, 55, 2427–2436. [Google Scholar] [CrossRef] [Green Version]
- Strasser, R.J.; Tsimilli-Michael, M.; Srivastava, A. Analysis of the chlorophyll a fluorescence transient. In Chlorophyll a Fluorescence; Advances in Photosynthesis and Respiration; Sharkey, T.D., Eaton-Rye, J., Eds.; Springer: Dordrecht, The Netherlands, 2007; Volume 19, pp. 321–362. [Google Scholar] [CrossRef]
- Flexas, J.; Hendrickson, L.; Chow, W.S. 2001. Photoinactivation of photosystem II in high light-acclimated grapevines. Aust. J. Plant Physiol. 2001, 28, 755–764. [Google Scholar] [CrossRef]
- Strasser, R.J.; Srivastava, A.; Tsimilli-Michael, M. The fluorescence transient as a tool to characterize and screen photosynthetic samples. In Probing Photosynthesis: Mechanism, Regulation and Adaptation; Yunus, M., Pathre, U., Mohanty, P., Eds.; Taylor and Francis: London, UK, 2000; pp. 443–448. [Google Scholar]
- Gülcan, R. Almond Descriptors, revised ed.; International Board for Plant Genetic Resources (IBPGR): Rome, Italy, 1985; p. 30. [Google Scholar]
- Fernandes de Oliveira., A.; Rais, F.; Dettori, I.; Azzena, M.; Nieddu, G. UV light acclimation capacity of leaf photosynthetic and photochemical behaviour in near-isohydric and anisohydric grapevines in hot and dry environments. S. Afr. J. Enol. Vitic. 2019, 40, 188–205. [Google Scholar] [CrossRef]
- Oručević, A.; Aliman, J. The phenology of flowering and ripening of almond cultivars Nonpareil, Texas, Ferraduel and Genco in Herzegovina. Int. J. Plant Soil Sci. 2018, 21, 1–9. [Google Scholar] [CrossRef]
- Ortega, E.; Egea, J.; Dicenda, F. Effective pollination in almond cultivars. HortScience 2004, 39, 19–22. [Google Scholar] [CrossRef] [Green Version]
- Godini, A.; De Palma, L.; Palasciano, M. Self-fertile almonds and fruit set by optimized self- and cross pollination. Acta Hortic. 1994, 373, 157–160. [Google Scholar] [CrossRef]
- Gradziel, T.M.; Martínez-Gómez, P.; Dandekar, A.; Uratsu, S.; Ortega, E. Multiple genetic factors control self-fertility in almond. Acta Hortic. 2002, 591, 221–227. [Google Scholar] [CrossRef]
- Tombesi, S.; Lampinen, B.D.; Matcalf, S.; DeJong, T.M. Yield in almond is related more to the abundance of flowers than the relative number of flowers that set fruit. Calif. Agric. 2017, 71, 65–74. [Google Scholar] [CrossRef]
- Hauagge, R.; Kester, D.E.; Arulsekar, S.; Parfitt, D.E.; Liu, L. Isozyme variation among California Almond cultivar: II. Cultivar characterization and origins. J. Am. Soc. Hortic. Sci. 1987, 112, 693–698. [Google Scholar] [CrossRef]
- Wiliams, R.R. Factors affecting pollination in fruit trees. In Physiology of Tree Crops; Luckwill, L.C., Cutting, C.V., Eds.; Academic Press: London, UK; New York, NY, USA, 1970; pp. 193–207. [Google Scholar]
- Lovicu, G.; Pala, M.; de Pau, L.; Satta, D.; Farci, M. Bioagronomical behaviour of some almond cultivar in Sardinia. Acta Hortic. 2001, 591, 487–491. [Google Scholar] [CrossRef]
- Flexas, J.; Diaz-Espejo, A.; Gago, J.; Gallé, A.; Galmés, J.; Gulías, J.; Medrano, H. Photosynthetic limitations in Mediterranean plants: A review. Environ. Exp. Bot. 2014, 103, 12–23. [Google Scholar] [CrossRef]
- Lampinen, B.D.; Tombesi, S.; Metcalf, S.G.; DeJong, T.M. Spur behaviour in almond trees: Relationships between previous year spur leaf area, fruit bearing and mortality. Tree Physiol. 2011, 31, 700–706. [Google Scholar] [CrossRef] [Green Version]


| Direct Fluorescence Variables | Equation | Reference |
|---|---|---|
| Maximum yield of primary photochemistry of PSII | φPo = Fv/Fm | [52] |
| Variable fluorescence | Fv = Fm − Fo | |
| Linear indicator of functional PSII units | 1/Fo − 1/Fm | [51] |
| Maximum water-splitting efficiency | Fv/Fo | [52] |
| Quantum yield for electron transport | φEo = (Fv/Fm) × (1 − Vj) | |
| where Vj is the relative variable fluorescence at J-step (2 ms) | Vj = (F2ms − Fo)/(Fm − Fo) | |
| Quantum yield for energy dissipation | φDIo = 1 − φPo | |
| Density of the reaction centers | RCQA = φPo × (ABS/CSm) × (Vj/Mo) | |
| where Mo is the initial slope (in ms−1) of the fluorescence curve with respect to F300 | Mo = 4 × (F300 μs − Fo)/(Fm − Fo) | |
| and ABS/CSm is the absorption of photon flux by antenna chlorophyll molecules of active and inactive reaction center of PSII per excited cross-section of leaf area | ABS/CSm |
| Quarter | T Maximum (°C) | T Minimum (°C) | PP (mm) | ET0 (mm) | PD (mm) | Irrigation (mm) | ||||||
|---|---|---|---|---|---|---|---|---|---|---|---|---|
| 2020 | 2021 | 2020 | 2021 | 2020 | 2021 | 2020 | 2021 | 2020 | 2021 | 2020 | 2021 | |
| January–March | 16.2 | 15.2 | 7.7 | 6.9 | 83 | 182 | 110 | 118 | 283 | 323 | - | - |
| April–June | 23.7 | 22.9 | 13.3 | 12.7 | 159 | 77 | 360 | 355 | 212 | 144 | 175 | 175 |
| July–September | 29.7 | 30.3 | 18.9 | 19.4 | 248 | 39 | 405 | 375 | 26 | 0 | 197 | 320 |
| October–December | 18.2 | 18.8 | 10.3 | 10.5 | 310 | 185 | 100 | 94 | 276 | 42 | - | - |
| Annual | 22.0 | 21.8 | 12.6 | 12.5 | 800 | 482 | 975 | 942 | 199 | 126 | 372 | 495 |
| Season | Phenological Stage | Weeks of the Year | Kc | ETc | PP-ETc | Returned ETc (%) | Plant Water Status Gradients | |||
|---|---|---|---|---|---|---|---|---|---|---|
| Arrubia | Cossu | Texas | Tuono | |||||||
| 2020 | Fruit set—Pit hardening | 14–18 | 0.75 | 59.2 | 39.4 | - | ||||
| Pit hardening—Nut growth | 18–22 | 0.75 | 98.9 | −57.9 | 150 | |||||
| 22–27 | 0.95 | 141.8 | −123.0 | 70 | ||||||
| Kernel filling—Hull split | 27–31 | 0.95 | 164 | −163.6 | 55 | |||||
| 31–36 | 0.95 | 136.6 | −135.2 | 65 | ||||||
| Harvest—Bud differentiation | 36–40 | 0.85 | 75.1 | 171.5 | - | |||||
| 2021 | Fruit set—Pit hardening | 13–17 | 0.75 | 61.7 | −59.7 | - | ||||
| Pit hardening—Nut growth | 18–22 | 0.75 | 91.4 | −38.2 | 170 | |||||
| 23–26 | 0.95 | 143.3 | −142.7 | 80 | ||||||
| Kernel filling—Hull split | 26–31 | 0.95 | 148.6 | −146.2 | 80 | |||||
| 31–35 | 0.95 | 127.2 | −127.0 | 70 | ||||||
| Harvest—Bud differentiation | 35–39 | 0.85 | 72.3 | −72.3 | - | |||||
| CV | Season | Yield (Kg/plant) | Fruit Weight (g) | Nut Weight (g) | Kernel Weight (g) | Kernel Length (cm) | Kernel Width (cm) | Double Kernel (%) |
|---|---|---|---|---|---|---|---|---|
| Arrubia | 2020 | 6.1 Aa | 12.89 A | 7.47 Aa | 1.42 b | 2.66 Ab | 1.73 Aa | 4.4 B |
| 2021 | 2.9 Ab | 10.91 A | 7.36 Ab | 1.58 a | 2.76 Aa | 1.66 Ab | 3.3 B | |
| Cossu | 2020 | 4.8 Ba | 10.28 A | 6.00 Bb | 1.41 b | 2.24 Bb | 1.60 Bb | 2.2 AB |
| 2021 | 0.7 Bb | 11.83 A | 6.80 Ba | 1.59 a | 2.46 Ba | 1.70 Ba | 11.1 AB | |
| Tuono | 2020 | 5.4 Aa | 8.04 B | 4.87 Cb | 1.48 b | 1.84 Bb | 1.35 Db | 0 Cc |
| 2021 | 1.9 Ab | 9.16 B | 5.46 Ca | 1.71 a | 2.71 Ba | 1.52 Da | 0 Cc | |
| Texas | 2020 | 7.3 Aa | 7.54 B | 4.75 Cb | 1.26 b | 2.43 B | 1.46 Cb | 12.2 A |
| 2021 | 3.1 Ab | 8.64 B | 5.34 Ca | 1.62 a | 2.44 B | 1.58 Ca | 11.1 A | |
| Sig. | Cultivar | 0.001 | 0.001 | 0.001 | 0.127 | 0.001 | 0.001 | 0.001 |
| Season | 0.005 | 0.712 | 0.003 | 0.001 | 0.001 | 0.005 | 0.1 | |
| Interaction | 0.016 | 0.67 | 0.019 | 0.011 | 0.001 | 0.001 | 0.74 |
Disclaimer/Publisher’s Note: The statements, opinions and data contained in all publications are solely those of the individual author(s) and contributor(s) and not of MDPI and/or the editor(s). MDPI and/or the editor(s) disclaim responsibility for any injury to people or property resulting from any ideas, methods, instructions or products referred to in the content. |
© 2023 by the authors. Licensee MDPI, Basel, Switzerland. This article is an open access article distributed under the terms and conditions of the Creative Commons Attribution (CC BY) license (https://creativecommons.org/licenses/by/4.0/).
Share and Cite
Fernandes de Oliveira, A.; Mameli, M.G.; De Pau, L.; Satta, D. Almond Tree Adaptation to Water Stress: Differences in Physiological Performance and Yield Responses among Four Cultivar Grown in Mediterranean Environment. Plants 2023, 12, 1131. https://doi.org/10.3390/plants12051131
Fernandes de Oliveira A, Mameli MG, De Pau L, Satta D. Almond Tree Adaptation to Water Stress: Differences in Physiological Performance and Yield Responses among Four Cultivar Grown in Mediterranean Environment. Plants. 2023; 12(5):1131. https://doi.org/10.3390/plants12051131
Chicago/Turabian StyleFernandes de Oliveira, Ana, Massimiliano Giuseppe Mameli, Luciano De Pau, and Daniela Satta. 2023. "Almond Tree Adaptation to Water Stress: Differences in Physiological Performance and Yield Responses among Four Cultivar Grown in Mediterranean Environment" Plants 12, no. 5: 1131. https://doi.org/10.3390/plants12051131