1. Introduction
Hops (
Humulus lupulus L.) are the most expensive ingredient for breweries, used for their aromatic, preservative and bittering properties. Hop cultivation requires a large amount of nutrient input. In particular, as this species exhibits rapid growth in spring (it can grow up to 25 cm per day), the utilisation of high amounts of nutrients, especially nitrogen, is needed [
1]. The use of different types of nutrients can influence both the yield and quality of plants [
2,
3,
4] and, therefore, the quality of the processed product. In grape cultivation, fertilisation is part of the
terroir effect, since it can affect wine quality not only by modifying grape microflora but also by affecting secondary metabolism [
3,
5]. Webster et al. [
5] observed an effect of nitrogen (N) fertilisation on grape production, which highlighted significant differences in the monoterpene composition of wines and their sensorial features. Similar findings have also been reported for the tea tree (
Camelia sinensis L.): several studies have shown that foliar fertilisation affects the aromatic compounds of leaves and teas. The research by Liu et al. [
6], in particular, found a correlation between N application and the increment in (E)-2-hexenal and (Z)-3-hexanol, both of which are responsible for the typical greenish odour of green tea. Terpene, monoterpenoid and sesquiterpenoid biosynthesis also increased in
Chrysanthemum Boreale (Makino) flowers following NPK (nitrogen, phosphorus and potassium) and lime fertilisation treatments [
7].
In this context, the hop secondary metabolism is known to be influenced by different factors, such as the terroir [
8,
9,
10], biotic and abiotic stress [
11,
12], and plant nutrition [
10,
13,
14]. Traditionally, the most commonly used N fertilisers include ureas, coated ureas, ammonium nitrate, ammonium sulfate (highly acidifying), calcium nitrate and potassium nitrate [
15]. Other synthesis fertilisers rich in N, P and K are commonly used for hop nutrition during the growing season [
16]. Over recent decades, the agricultural world, including the brewery sector, has shown particular interest in organic production and manuring, as a result of an increased human awareness of environmental issues, which has led, in turn, to new research into organic raw materials [
17,
18]. This can be found in hop cultivation, where there is an increase in organic farming methods. For example, differences in hop cone quality have been found in an experiment comparing hops cultivated organically (probiotic microorganisms and plant extracts, horse manure and probiotic microorganisms) with those undergoing conventional manuring [
19]. Organic hops exhibited a higher content not only of xanthohumol, proanthocyanidine and flavan-3-ol but also of alpha acids when compared with cones cultivated using conventional manuring. The impact of agronomic practices on hop quality is also evidenced in a study on different hop cultivars by Kishimoto et al. [
10], where hops cultivated using copper sulphate exhibited a quantitative decrease in the aromatic profile of 4-mercapto-4-methylpentan-2-one, characterized by a blackcurrant-like note.
In beer production, the aromatic fraction contained in the essential oil of hops gives the beer a unique character. Therefore, the use of different hop fertilisation methods, acting directly or indirectly in secondary metabolism and terpene biosynthesis, could affect beer quality and sensory characteristics [
20]. Similar sensory differences have previously been observed in a study on consumer preferences [
21], where beers obtained using different fertilised hops were given to consumers, who effectively perceived differences in beer quality. This result highlights the importance of hop fertilisation [
21]. Moreover, considering the increased interest in sustainability, the identification of a fertilisation method that could meet the needs of hop producers, brewers and the environment becomes more urgent.
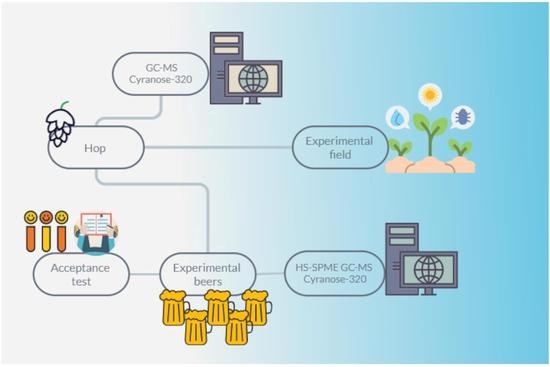
At present, only fragmented data are available in the literature in regards to hop and beer quality and foliar fertilisation treatments. No studies have been performed including both these aspects in the same experimental design. In the present research, for the first time, the effect of different organic foliar fertilisation regimes on hops’ essential oil and beers was investigated, using a multidisciplinary approach for their characterisation, i.e., GC, Cyranose 320 and panel analysis.
3. Materials and Methods
3.1. Experimental Design and Hop Cone Sampling
The experiment was carried out during the 2018/2019 season at the “Azienda Agric-ola Ludovico Lucchi”, located in Campogalliano (MO-IT) (44.704140 N, 10.841347 E). Meteorological data are reported in the
Supplementary Materials, Figure S2. In the hop field, plants were spaced 1.2 m from each other along the row, with the rows being 3 m apart. Hop plants were grown on a loamy clay soil, with 1,04% of gravel, coarse sand and fine sand (1 and 12.9%), coarse slit and fine slit (15 and 35%), and 36% of clay. The physical and chemical proprieties of the soil are reported in
Table 6. In winter, 30 t·ha
−1 of cow manure was supplied to the soil. The experimental design and the first results of the experiment regarding physiological measurements have already been published [
22]. During the growing season, four organic fertiliser mixtures, based principally on marine algae, amino acids and microelements (T1, T2, T3 and T4) (
Table S1), which had been kindly provided by Caprara S.r.l., were tested on the same cultivar (Cascade). Each treatment, consisting of different nutrient mixtures (
Table 1,
Table S1), was applied utilising an atomiser machine (foliar treatments). The experiment involved two periods where foliar treatment was carried out: the first period (t1) took place between the emission of lateral shoots and the start of blooming; the second period (t2) took place between 50% blooming and the end of blooming. For each period, three foliar treatments, one per week, were applied. The amounts of macro- and microelements applied to the hop plants are indicated in
Table 1. Non-treated plants were also considered, representing the control. For each treatment, 3 independent replicates were used, with each replicate consisting of 150 plants. Each treatment was separated from the next by 5 rows of untreated plants.
3.2. Hop Cone Sampling
The hop cones were harvested and divided per treatment (13 September 2019). They were then immediately dried by the farmer at 50 °C for 8 h. In order to ensure the robustness of the data, the hop cones for each replicate were derived from 150 plants. Three replicates for each treatment were considered. After drying, 1 kg of homogenised sample from each replicate was stored in vacuum-sealed packages at −20 °C.
3.3. Hop Cone Analysis
3.3.1. Hop Oil GC-MS Analysis
Essential oils were first extracted in triplicate by steam distillation with a Clevenger apparatus, using 25.0 g of dried hops left for 4 h in a 2.0 L round-bottom flask with 1250 mL of pure water. Anhydrous sodium sulfate (Sigma-Aldrich, Milan, Italy) was then added to the extracted essential oils, which were subsequently stored at 4 °C. Before analysis, the essential oils were diluted in CH2Cl2 (1:200 v/v), to which 400 ppm of Toluene had been added as the internal standard (Carlo Erba, Milan, Italy).
All samples were analysed with a Thermo Scientific (San Jose, CA, USA) TRACE 1300 gas-chromatograph coupled to a Thermo Scientific ISQ™ Single Quadrupole mass spectrometer. The gas-chromatograph was equipped with Supelcowax 10 (30 m × 0.25 mm, f.t. 0.25 μm) (Supelco, Bellefonte, PA, USA) capillary columns and helium was used as a carrier gas (1 mL min
−1). The gas chromatography–mass spectrometry (GC–MS) oven temperature gradient started from 50 °C, a condition that was maintained for 3 min, after which the temperature was raised to 200 °C (5 °C min
−1). This final temperature was maintained for 18 min. The injector was maintained at 230 °C, operating in split modality with a ratio of 1:20. The mass spectrometer was equipped with an electron impact (EI) source (70 eV) and the acquisition mode was full scan (from 40 to 500
m/
z). A solvent delay time of 4 min was applied. The main terpenic volatile compounds were identified on the basis of their mass spectra compared with the reference mass spectra libraries (NIST, 2005 software, Mass Spectral Search Program V.2.0d, Washington, DC, USA version 2.2 June 2014) and on the basis of their calculated Retention Indexes (RIs) through the application of the Kovats’ index (KI) formula compared with those reported in the literature [
25,
35,
36]. When it was not possible to find the KI in the literature, a tentative identification was obtained by matching the value obtained with mass spectra library data: a minimum match quality of 98% was used as a criterion. In order to determine the RI of the components, a mixture of alkanes (C8–C20) was injected in the GC–MS equipment and analysed under the same conditions described earlier. After the identification of target volatile compounds (VOC), peak areas of target volatile compounds (AVOCs) were obtained on the basis of the major ion then normalised with the internal standard peak area (AIS). Data were expressed as a percentage based on the equation below:
Avoc = integrated peak area
ASI = area of the internal standard
All samples were analysed in triplicate.
3.3.2. Hop Cone Electronic Nose Analysis
The electronic nose employed for the analysis was the Cyranose 320 (Sensigent LLC, 1438 Arrow Hwy, Baldwin Park, CA, USA, 91706). The Cyranose 320 integrates 32 polymer sensors, which, when in contact with a vapour, absorb the vapour and swell like a sponge. During this process, the electronic nose arrays are used to identify the vapour [
37]. The ability of the electronic nose to discriminate different samples has been previously observed, for example, in long-grain rice, where it was able to discriminate the cultivars [
37]. In another study, the electronic nose was successfully used with apples to distinguish fruit ripeness grades [
38,
39]. In our study, the electronic nose was used to analyse and characterise the samples. Cyranose 320 software was used to record the experimental data. Six dried cones per sample in triplicate were placed into a 50 mL falcon, which was then closed with the internal headspace equilibrated for 30 min. Measurements could be registered when the resistance of the gas sensors remained stable at a high value of 0~1 [
37].
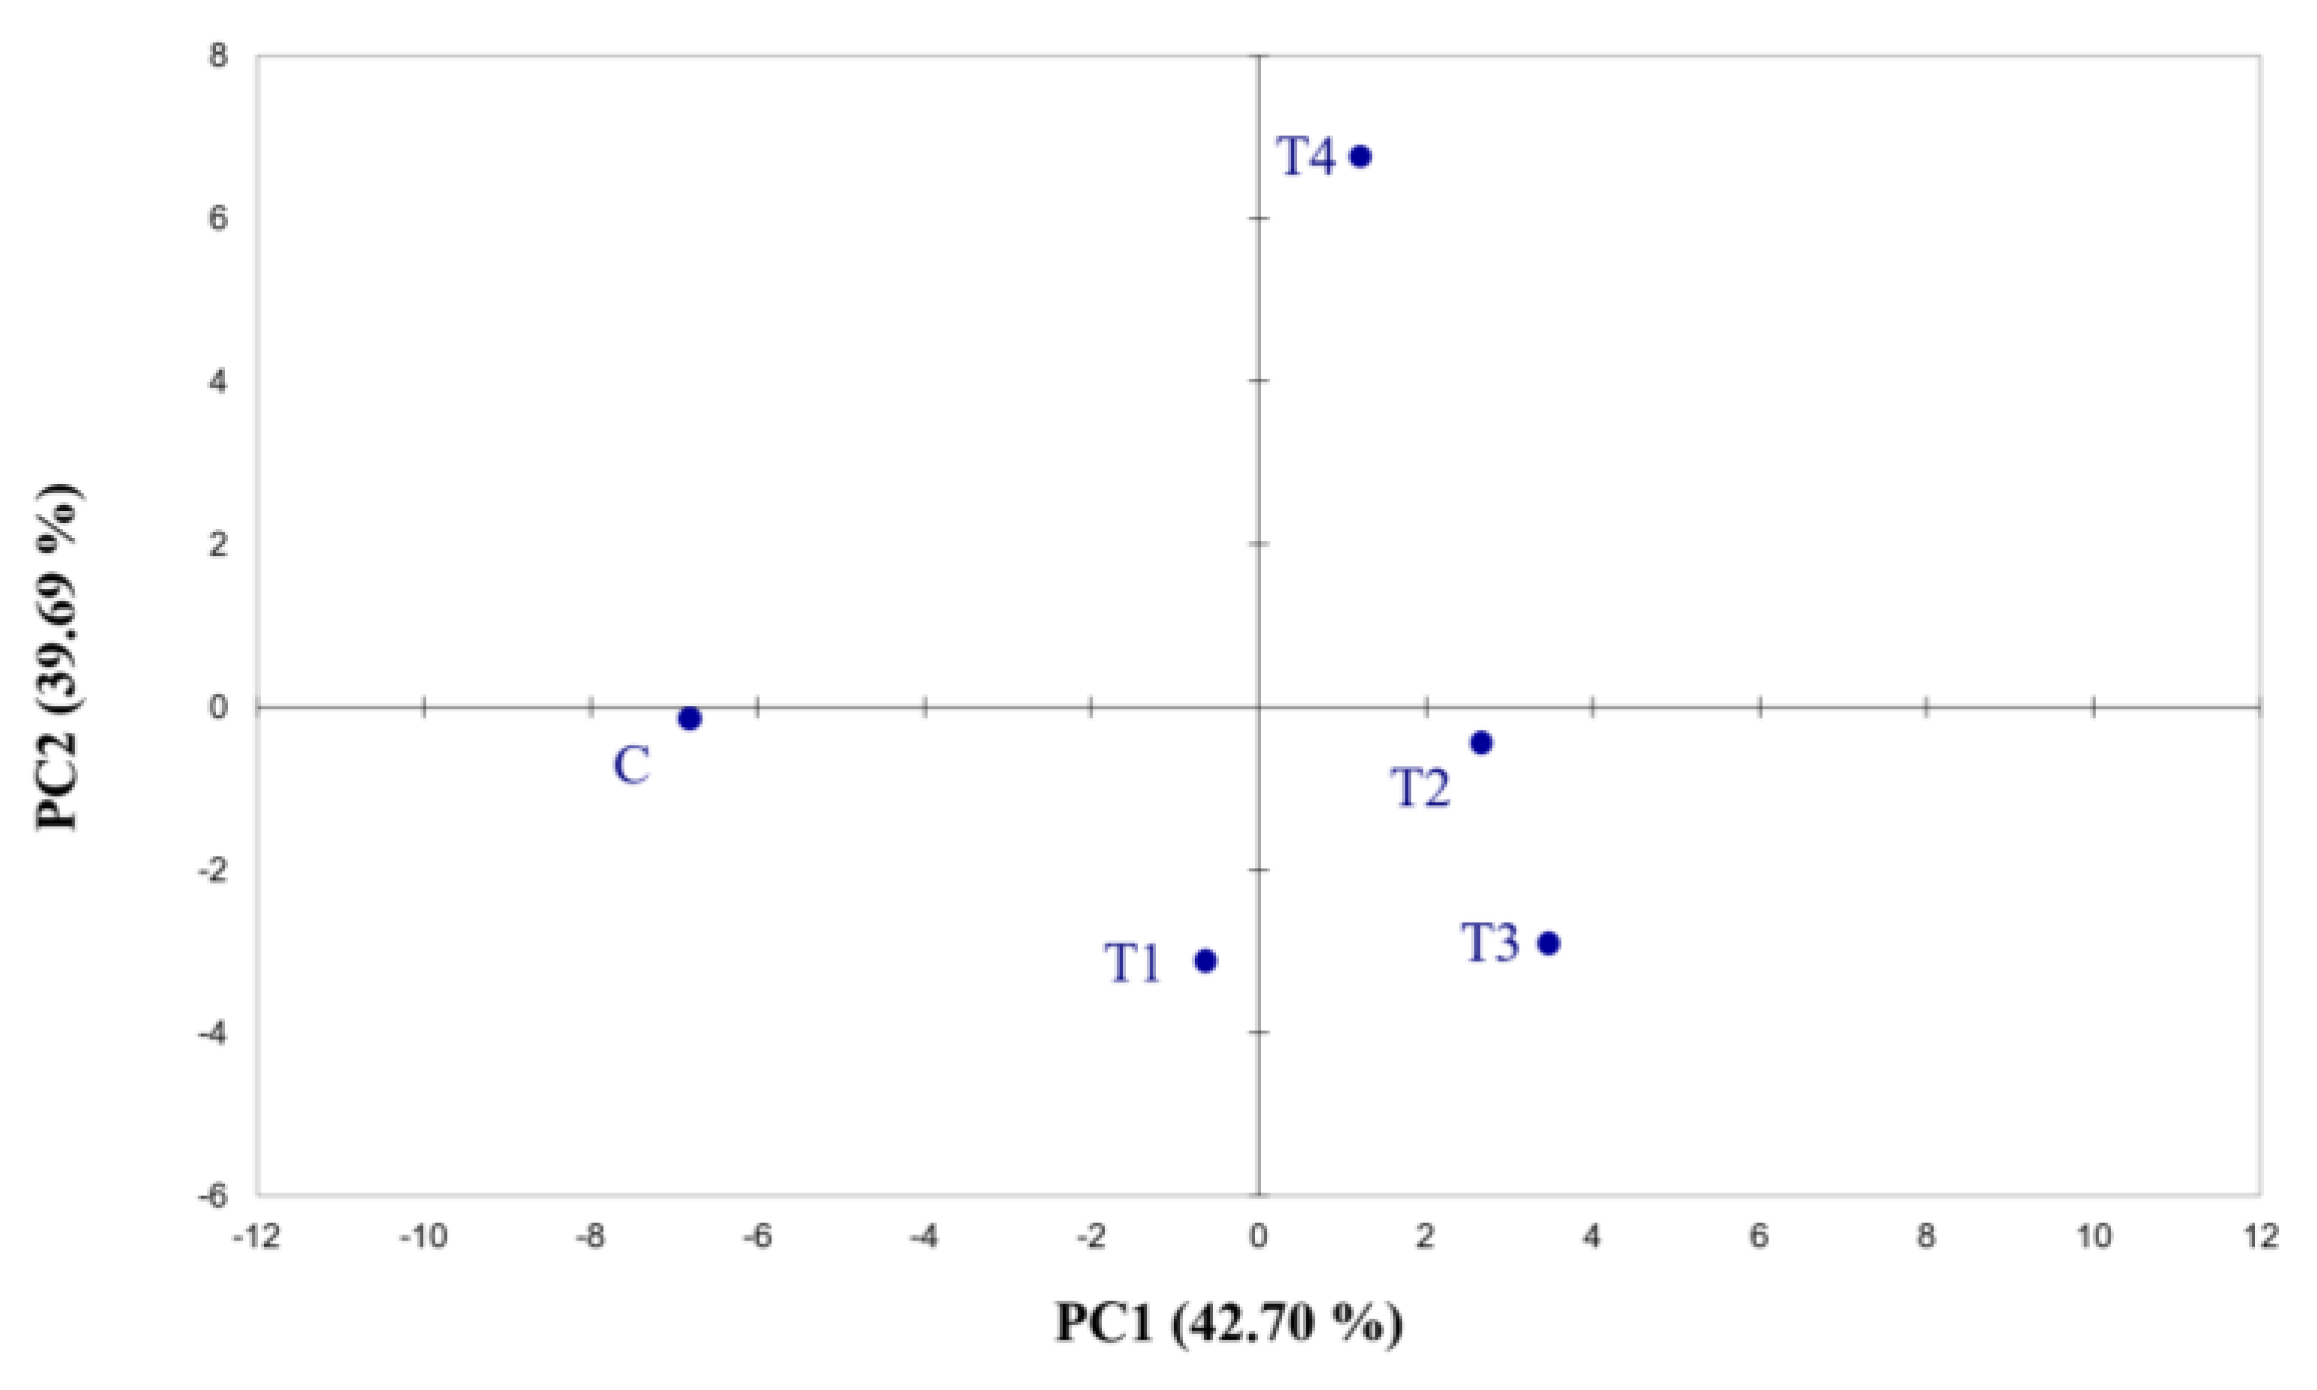
Before modelling, the cross-validation technique was applied to determine the optimum number of principal components. The results were used in principal component analysis in order to classify the samples and identify differences.
3.4. Brewing Trials
Dry hopping, which consists of adding hops to the cold liquor at the end of the main fermentation process, was used to emphasise and preserve the hop aroma [
40]. This is a relatively easy method, used to enhance the flavour and fragrance of beer. The chemical procedure improves both the aroma and the microbial stability of beer by the cold extraction of volatile and non-volatile compounds [
41].
The control hops, together with the hops coming from the four fertilisation treatments, were used and dry-hopped to obtain five different beers (BC, BT1, BT2, BT3 and BT4).
Brewing Process
Two batches of India Pale Ale beer, each of 100 L, were produced at the pilot plant facility of Porto Conte Ricerche Srl (Alghero, Italy). Grist containing 90% Pale Ale malt (Weyermaan, Bamberg, Germany), 8% Carared malt (Weyermaan, Bamberg, Germany) and 2% Carapils malt (Weyermaan, Bamberg, Germany) was ground in a two-roll mill with 1 mm spacing. Mashing was carried out using 75 L of water to which 20 g of CaSO4 (Mr. Malt, Udine, Italy) and 10 g of CaCl2 (Mr. Malt, Udine, Italy) were added. Mashing was conducted at 66 °C for 60 min, heated to a temperature of 78 °C, and then kept for 10 min for mash-out. The wort was first transferred to a kettle, and then spent grain was washed using hot water at 78 °C. The Cascade hop (Mr. Malt, Udine, Italy) was added at the start of boiling for bittering at the final international Bitter Unit (IBU) of 30. The boiled wort was separated from the hot trub by whirlpool then cooled at 18 °C.
Wort fermentation was conducted in different vessels with 20 L of boiled wort for each experimental treatment. Dry yeast Saf-Brew US-05 (Fermentis, Marcq-en-Baroeul Cedex, France) was added directly to the fermenter (0.5 g L−1), after which fermentation was carried out at 15 °C for seven days to obtain green beer. The temperature was then reduced to 4 °C for two weeks to obtain cold-matured beers.
Tanks of 20 L of green beer were dry-hopped for 5 days at 4 °C using 300 g of each hop sample (C, T1, T2, T3 and T4) in duplicate. After this, the hops were removed and the beers were bottled. Conditioned dry-hopped beer was obtained by adding 6 g L−1 of glucose and 0.05 g L−1 of yeast F2 (Fermentis, Marcq-en-Baroeul Cedex, France) and keeping the beer at 22 °C for 14 days.
3.5. Single-Hopped Beer Analysis
3.5.1. Determination of Standard Quality Attributes
The original extract (%
w/
w), apparent extract (%
w/
w), real extract (%
w/
w) and alcohol (%
v/
v) were measured in triplicate with a PBA-B generation M (Anton Paar, Graz, Austria). The following analyses were performed according to the official Analytica-European Brewery Convention methods [
42]: colour (EBC-U) using EBC method 9.6; pH using EBC method 9.35; and turbidity (EBC-U) using EBC method 9.29. In addition, foam stability was measured with a NIBEM-OPH foam stability tester (Haffmans, Zeist, The Netherlands) according to Analytica-EBC method 9.42.1.
All analyses were performed in triplicate.
3.5.2. HS/SPME/GC-MS Analysis
The five beers (BC, BT1, BT2, BT3 and BT4) were analysed for their volatile compounds in triplicate. Five mL of beer was transferred into 10 mL headspace vials containing 1.5 g of sodium chloride and 10 µL of 1-Butanol as the internal standard (25 g/L), which were then sealed with PTFE–silicone septa and stored at 7 °C in a refrigerated compartment. Analysis of volatile compounds was carried out using the headspace solid-phase microextraction (HS/SPME/GC/MS) technique by means of Divinylbenzene/Carboxen/Polydimethylsiloxane (DVB-CAR-PDMS) fibre (Supelco, Bellefonte, PA, USA) [
43]. For SPME analysis, the samples were incubated for 10 min at 40 °C, after which extraction was carried out exposing the fibre to the headspace for 40 min. Both incubation and extraction were performed by agitation. Fibre desorption was carried out in an injector for 2 min at 250 °C with a split flow of 7.2 mL min
−1. The fibre was activated each day following the manufacturer’s instructions. Chromatographic analysis was performed using TRACE GC coupled with an ISQ single quadrupole (Thermo Scientific, Hudson, NY, USA). The analytes were separated on a SLB-5 ms capillary column (60 m × 0.25 mm × 0.25 μm film thickness) (Supelco, Bellefonte, PA, USA) using helium as a carrier gas at a 1.2 mL min
−1 constant flow rate. The oven temperature programme started at 50 °C and was held there for 5 min and then it was increased at 5 °C min
−1 to 250 °C and held there for 3 min [
44]. The transfer line and ion source were set at 250 °C and 270 °C, respectively, with a quadrupole scan ranging between 33 and 300 amu and with the ionisation energy being 70 eV [
45]. Chromatographic data were acquired by means of Tracefinder (Thermo Scientific, Waltham, MA, USA).
The identification of terpenes was carried out by comparing the mass spectra with those of the data system library (NIST, 2005 software, Mass Spectral Search Program V.2.0d, Washington, DC, USA version 2.2 June 2014) [
36,
46]. All Identity Spectrum Match factors above 850 resulting from the NIST Identity Spectrum Search algorithm (NIST MS Search 2.0) were considered acceptable for positive identification. After the identification of target volatile compounds (VOCs), peak areas (A
VOC) were obtained on the basis of the major ion then normalised with the internal standard peak area (A
IS). Data were expressed as a percentage on the basis of the Equation explained in
Section 3.3.1.
3.5.3. Beer Electronic Nose Analysis
For instrument training, 15 mL of beer per sample in triplicate was placed in a 50 mL falcon. The falcon was then closed and the headspace inside was equilibrated for 45 min. The analysis was performed as reported in
Section 3.3.2.
3.5.4. Sensory Analysis
Two methods of hedonic evaluation were employed: Method I involved a nine-point hedonic scale, anchored at both extremes where 1 = “extremely dislike” and 9 = “like very much”; Method II involved a classification of samples according to their degree of approval.
A hedonic survey of the consumer acceptability of the five beers was conducted in the Food Science Laboratory of Porto Conte Ricerche Srl (Alghero, Italy). The sensory scores of the four beer samples (BT1, BT2, BT3 and BT4) and the control BC were evaluated using an acceptance test and a nine-point hedonic scale. The consumers gave a score of 1–9 to the samples, ranging from “extremely dislike” to “like very much” [
47]. A total of 52 subjects were included in the consumer study, 36 males and 16 females aged 32–60 years. They were asked to fill out an anonymous questionnaire with their demographic data (age, gender, education level, specific food frequency questions). A questionnaire was also provided to obtain their opinion of the beer samples, preferences and purchase intent. The consumers recruited for the test declared that they habitually consumed craft beers and that they paid particular attention to the olfactory and gustatory characteristics of beers [
48].
Before participating in the study, all the consumers provided their informed consent. The prepared samples were stored at 4 ± 2 °C until evaluation; the samples were presented in glass beakers equipped with lids to limit the loss of volatile compounds and coded with three-digit random numbers in a randomised presentation order to minimise bias. The respondents were then asked how much they liked the beers in terms of appearance, odour, flavour and overall acceptability.
Before each evaluation, the subjects were briefed on each of the two methods for the task and on the tasting technique (taste and swallow). Mineral water at room temperature was available as a neutraliser between samples. In Method I, the subjects rated the agreeableness (degree of liking) of each sample on the nine-point hedonic scale. The consumers were instructed to take only as much of each sample as needed to make an assessment during the test. In Method II, after tasting all five samples, the consumers were asked to rank the beers in order, from the most-liked to the least-liked sample. The subjects were then instructed to taste the beer samples by taking a sip of each, after which they had to attempt to grade the samples based on their first sensory impressions, repeating the test (if necessary) to ensure correct grading.
Classification data were analysed with Friedman’s test of rank to find out if there were significant differences in agreeableness between samples and to determine which samples differed from each other (ISO8587, 2006).
3.6. Statistical Analysis
All data obtained were evaluated using XLSTAT (Addinsoft SARL, Long Island City, NY, USA) and Statgraphics Centurion XV (Manugistics Inc., Rockville, MD, USA). The results were statistically analysed using the Kruskal–Wallies and Dunn’s post hoc tests according to variance homogeneity (Shapiro–Wilk test and Cochran test), with a cut-off significance of p < 0.05. For the aromatic profiles of both hops and beer (data of GC and Cyranose 320), a Kaiser–Meyer–Olkin test (KMO) and Barlett’s test were first employed, followed by principal component analysis (PCA) using Pearson’s method (p ≤ 0.05). Classification data on sensory analysis was performed with Friedman’s test of rank.
4. Conclusions
This study illustrates the effects of four fertilisation treatments and a control on the aromatic profile of Cascade hops and, consequently, on the aroma and flavour of five single dry-hopped beers. Modifications could be observed regarding the presence of a number of terpenes in the volatile fraction in both hops and beers, using not only standard analytical methods (GC-MS and HS-SPME-GC-MS) but also an electronic portable nose (Cyranose 320). The results showed that the variations between hops and beer samples, even if small, are detectable using different methods. Terpene analyses on hop cones revealed a major presence of monoterpenes and sesquiterpenes in the control and in the fertilised hops, respectively. Sensory analysis carried out on consumers determined the acceptability of the produced beers, showing that differences among the samples were perceptible by consumers themselves. The scores revealed that significant differences were perceived in both odour and flavour, thus emphasising the high impact that the nutritional treatments applied to hops have on the beers produced. In the sensory analysis, preference was given to the BT1 sample, while the instrumental analysis showed a higher presence of volatiles in the control, with the exception of geraniol. Nonetheless, in the sensory evaluation, all the tested samples were evaluated as acceptable.

 ,
, 

