Article

Chemical Profile and Health-Promoting Activities of Crataegus laciniata (Rosaceae) Flowers

by
Salvatore Mirabile
1,2,
Valeria D’Angelo
1,
Maria Paola Germanò
1,*,
Shiva Pouramin Arabi
3,
Valentina Parisi
3,
Francesco Maria Raimondo
4 and
Emanuele Rosa
3
1
Department of Chemical, Biological, Pharmaceutical and Environmental Sciences, University of Messina, Viale F. Stagno d’Alcontres 31, 98166 Messina, Italy
2
Foundation Prof. Antonio Imbesi, University of Messina, Piazza Pugliatti 1, 98122 Messina, Italy
3
Department of Pharmacy, University of Salerno, 84084 Fisciano, Italy
4
PLANTA/Centro autonomo di Ricerca, Documentazione e Formazione, Via Serraglio Vecchio 28, 90123 Palermo, Italy
*
Author to whom correspondence should be addressed.
Plants 2024, 13(1), 34; https://doi.org/10.3390/plants13010034
Submission received: 27 November 2023 / Revised: 15 December 2023 / Accepted: 18 December 2023 / Published: 21 December 2023
(This article belongs to the Special Issue Phytochemical Composition and Biological Activity)

Abstract

:
In the present study, we focused our attention on Crataegus laciniata Ucria (Rosaceae), which is wild growing in western Sicily (Italy). The chemical profile of the C. laciniata flower’s (CLF) ethanolic (70%) extract showed the presence of both C-flavonoid and O-flavonoid derivatives. Beyond the main metabolites, like hyperoside and vitexin, there are several luteolin derivates, in addition to catechin and epicatechin dimers or trimers. Regarding the antioxidant activities, CLF showed a strong ability to scavenge DPPH and ABTS radicals and a good Fe3+-reducing antioxidant power. The investigation into the key enzymes in diabetes showed strong inhibition on α-amylase and α-glucosidase, whereas the skin-whitening properties are linked to inhibitory effects on tyrosinase. Moreover, we employed Danio rerio (zebrafish) for toxicity assessment, as it represents an ideal in vivo model due to its high correlation with humans in response to pharmaceutical and cosmetic testing. Zebrafish embryos exposed to CLF (25–100 µg/mL) showed marked depigmentation compared to phenylthiourea (PTU), in addition to a high survival percentage and the absence of malformations. In conclusion, this experimental study outlines that C. laciniata flowers could be a potential source of bioactive compounds for application in the pharmaceutical and cosmeceutical industries.

1. Introduction

Crataegus L. (hawthorn) is a large genus of small shrubs and trees belonging to Rosaceae family widely present in North Europe, temperate Asia, Africa and North America, including approximately 200 species. In recent years, hawthorn has been demonstrated to be an excellent source of many natural bioactive molecules, which have promising benefits for human health [1].
Many studies have shown that extracts from the fruits of hawthorn have beneficial effects on the cardiovascular system, including hypotensive activity and hypocholesterolemic and hypolipidemic effects [2]. Despite the long history of the use of the hawthorn fruits for both food and medicinal purposes, limited data are available on the active constituents and biological effects of the flowers [3].
In the present study, we focused on Crataegus laciniata Ucria, a species distributed through the western Mediterranean, i.e., northern Algeria, Morocco, southeastern Spain and Italy (Puglia and Sicily). C. laciniata has sometimes been synonymized with C. orientalis Pall. Ex M. Bieb. However, modern botanists are inclined to regard it as a distinct species. It is characterized by slightly lanate twigs, leaves, inflorescences, hypanthia and fruits. The subterminal leaves of flowering shoots are deeply and narrowly lobed, and they bear short petioles. The fruits are brick-red, 8–14 mm in diameter and have (1)2–3(5) pyrenes [4].
As far as we know, there are no data related to C. laciniata flowers. Consequently, the objective of this study was to investigate the chemical composition of a C. laciniata flower (CLF) ethanolic extract (70%) via HR-LC-MS analysis, as well as the antioxidant activities and in vitro health properties through the evaluation of inhibition of the key enzymes involved in diabetes (α-amylase and α-glucosidase). In addition, the effects on tyrosinase enzyme, which catalyzes the two limiting reactions of melanin biosynthesis, were also evaluated. Finally, we employed zebrafish (Danio rerio) embryos to evaluate both the toxicity and the whitening properties of CLF for its potential employment to counteract skin hyperpigmentation disorders. Information gained from this study can be used to support a future application of C. laciniata flowers as a good source of bioactive compounds.

2. Results

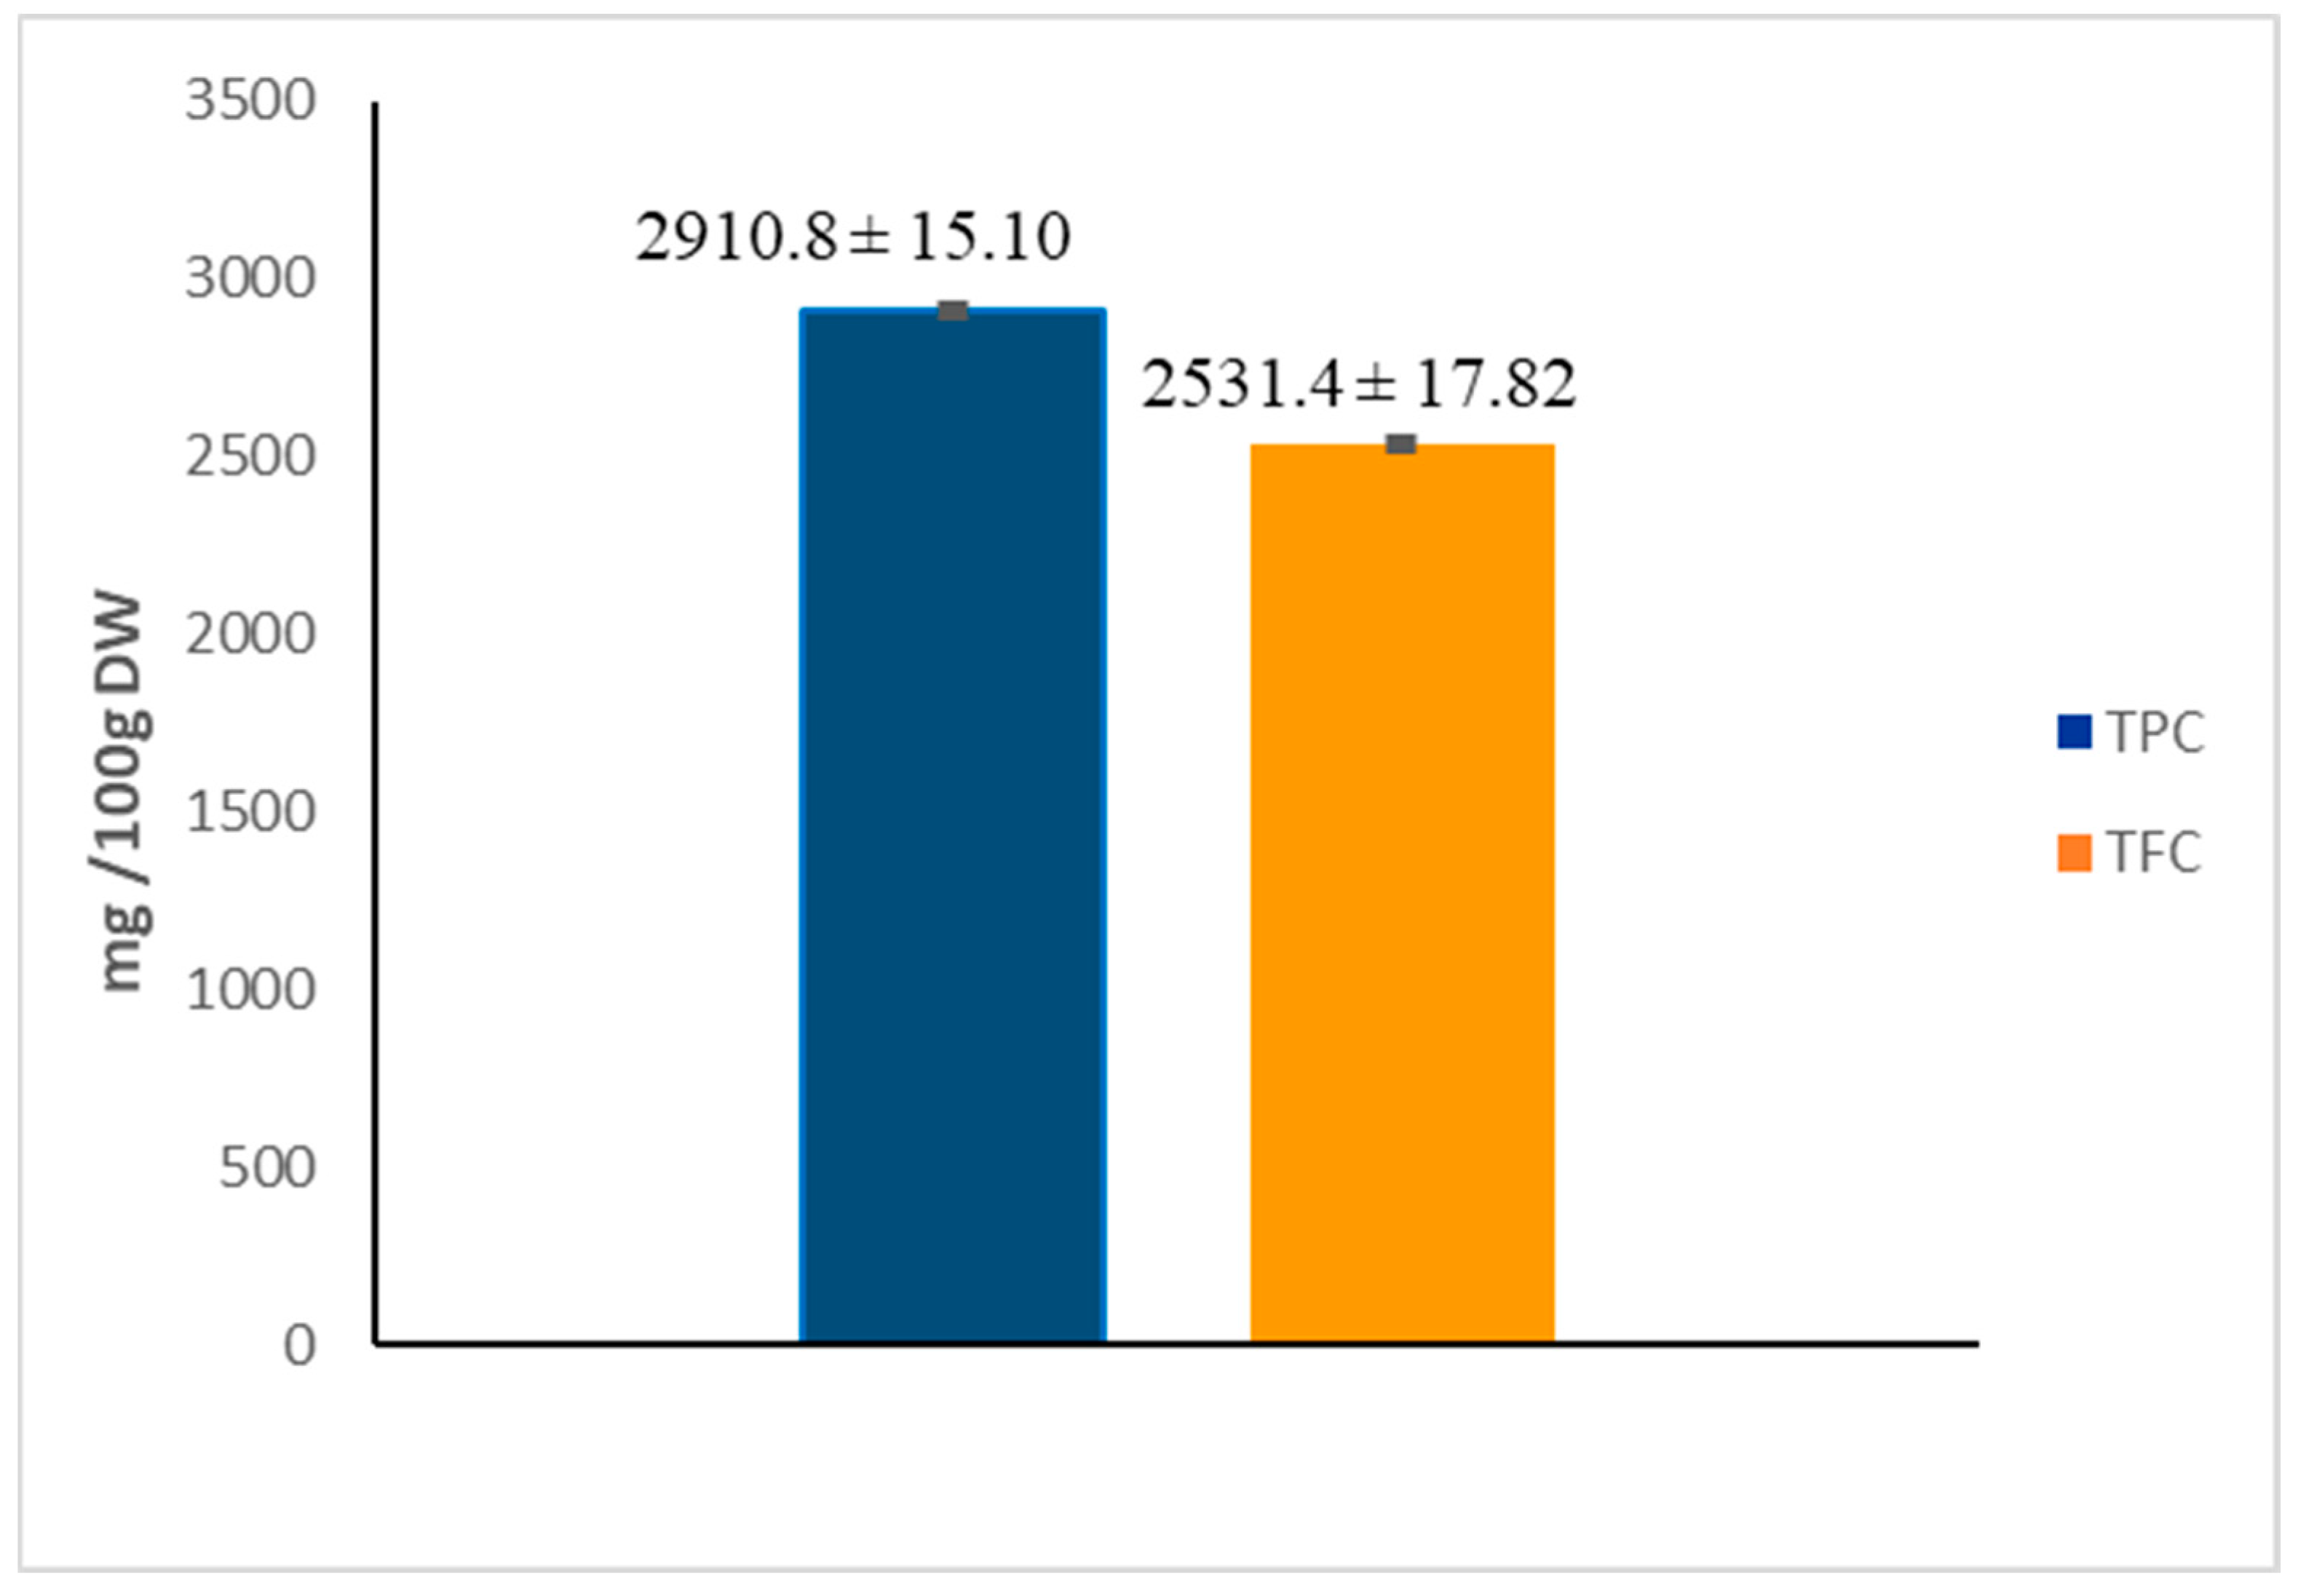
2.1. Total Phenolic (TPC) and Flavonoid (TFC) Content

TPC was determined using the Folin–Ciocalteu reagent via the TFC with aluminium chloride method. The total content of polyphenols and flavonoids of hawthorn flowers is summarized in Figure 1. It was observed that CLF has a high phenolic content (2910.8 mg GAE/100 g DW), mainly represented by flavonoids (2531.4 mg RE/100 g DW).

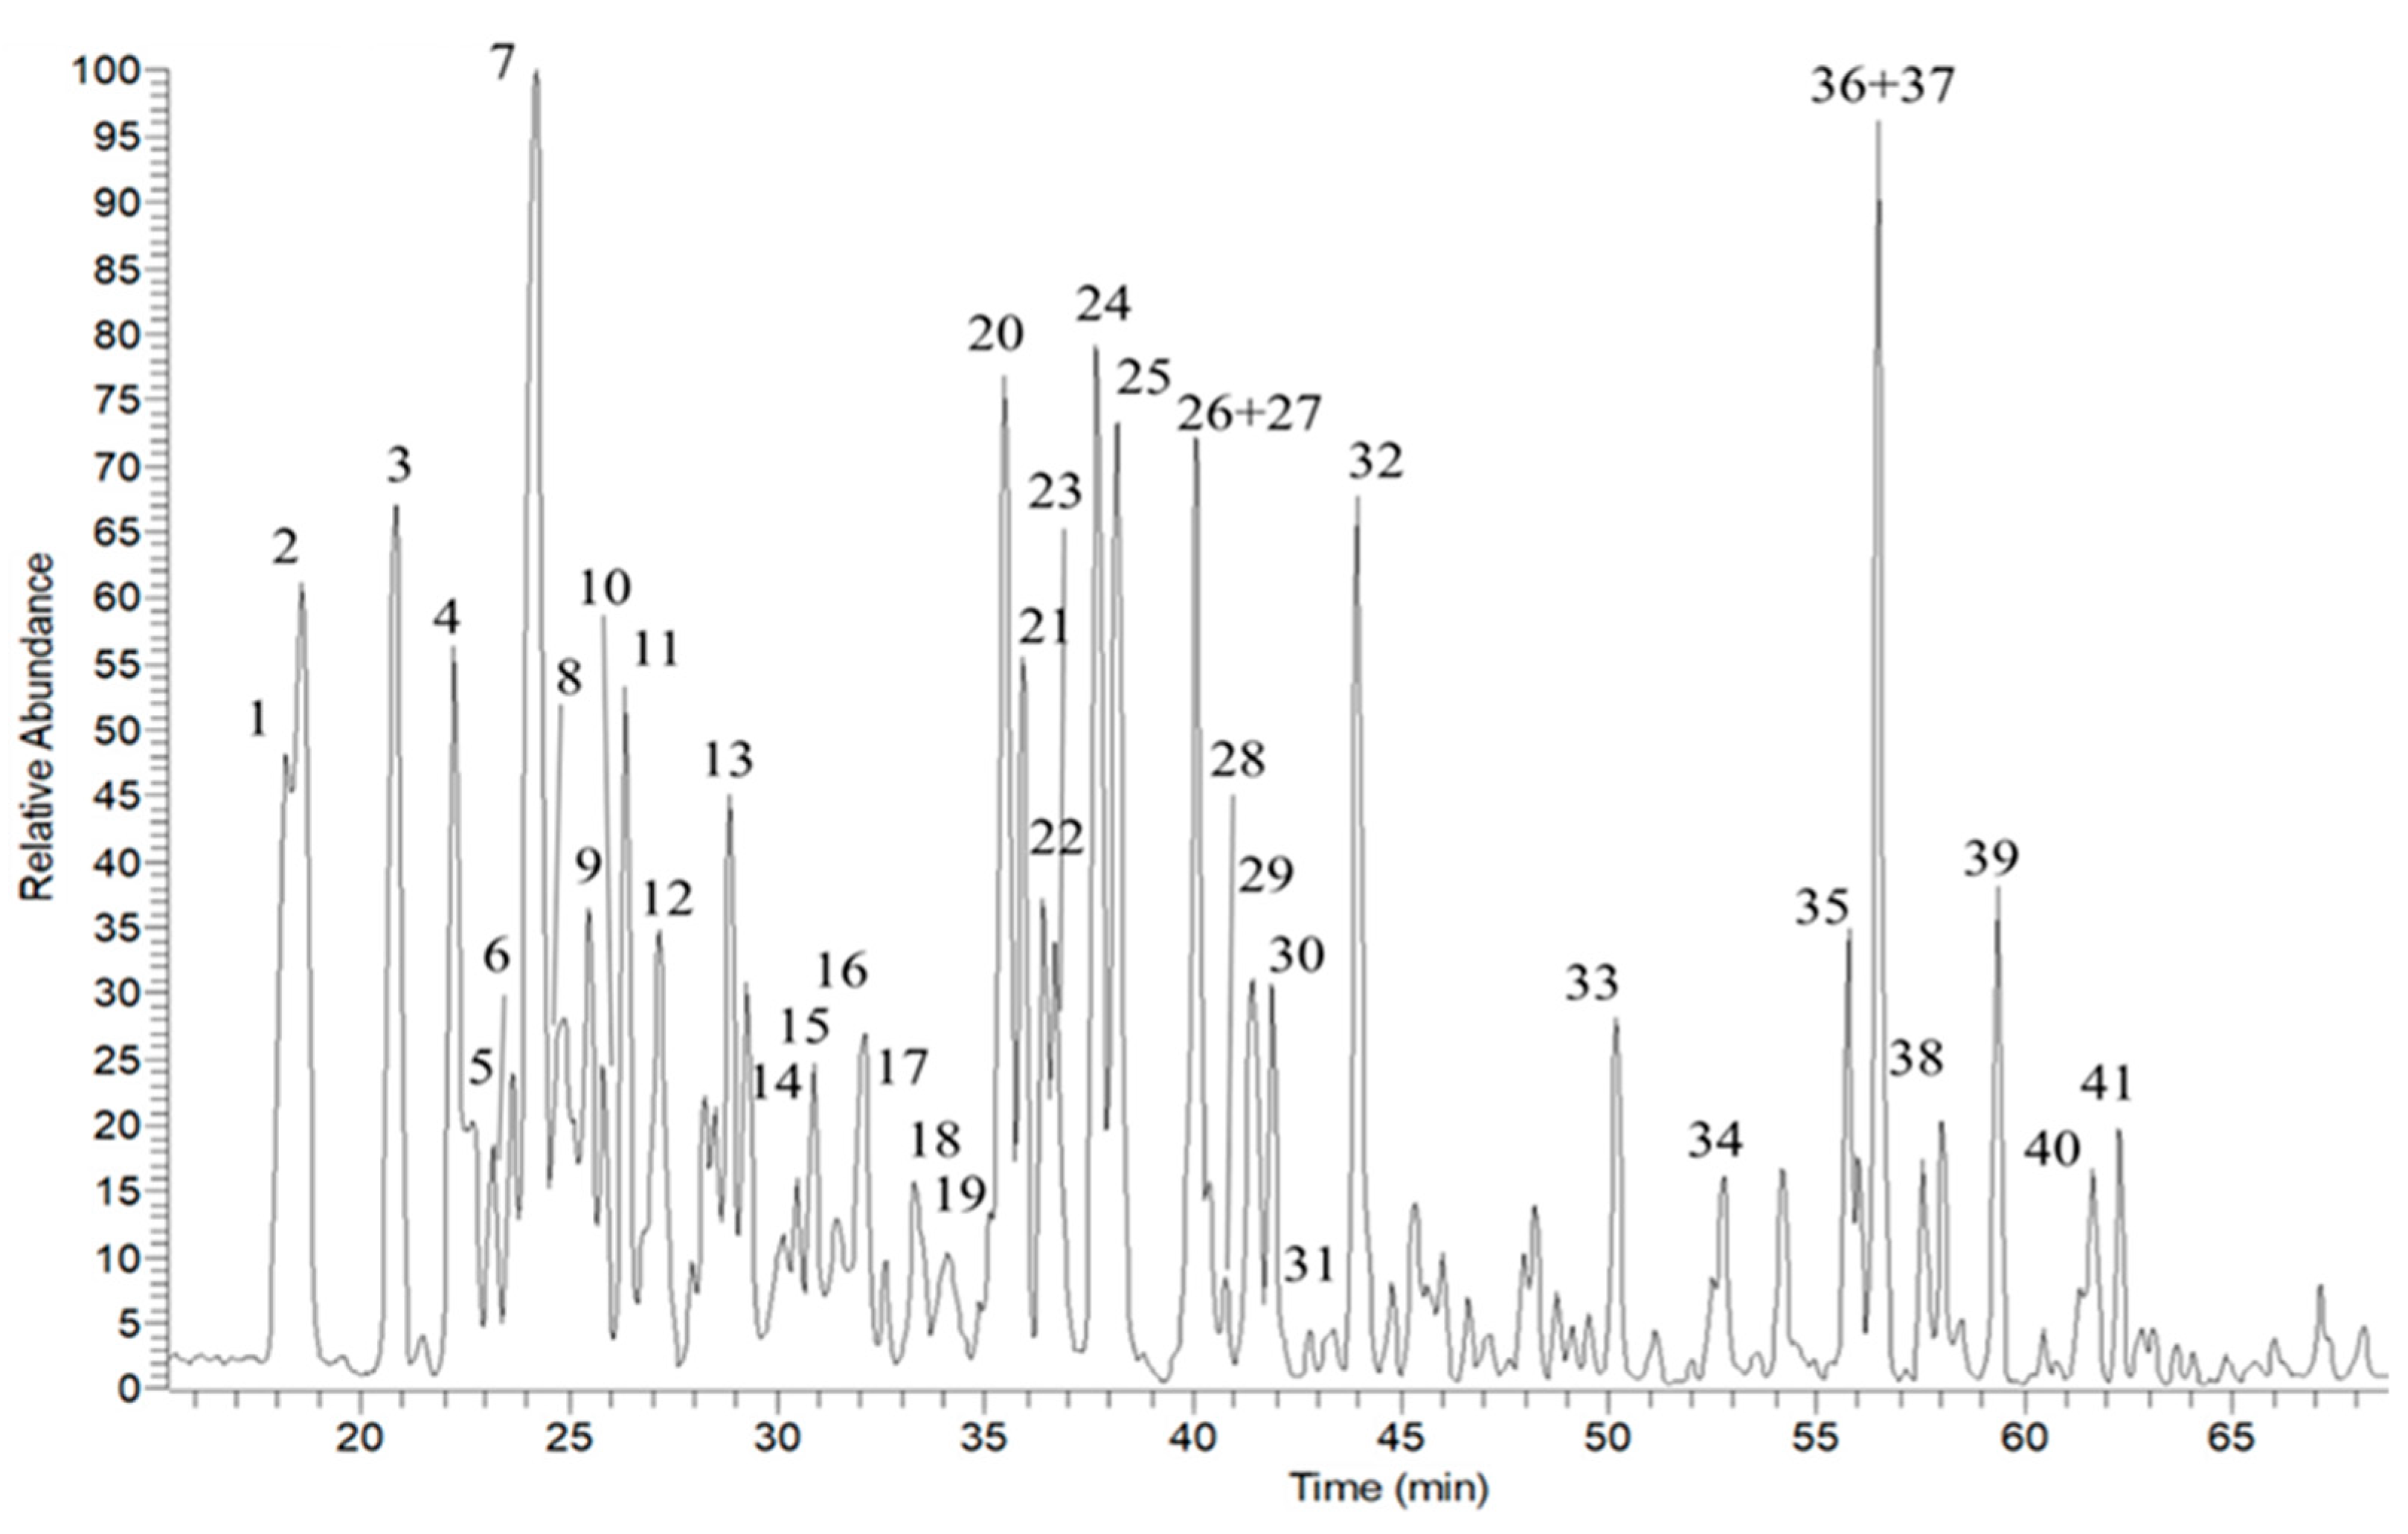
2.2. Phytochemical Characterization

The untargeted analysis of CLF was effectuated in both polarities, i.e., negative- and positive-ion modes (Figure 2). Compounds 1, 2, 6, 7 and 8 showed the presence of the fragment ion at m/z 161 [M-H] corresponding to dehydrated and deprotonated caffeic acid and fragment ion at m/z 191 [M-H] corresponding to deprotonated quinic acid. Several polyphenolics were identified, particularly catechin and epicatechin dimers or trimers, with compounds 10, 11 and 15 identified as procyanidin derivates (Table 1). The most abundant polyphenols identified in the CLF extract were flavonoid glycosides, both C-flavonoid and O derivatives. Beyond the main CLF metabolites, such as hyperoside (24) and vitexin (21), there are several luteolin derivatives with different glycosylation patterns (compounds 17, 19, 27, 30 and 32). These compounds showed the fragment ion at m/z 287 [M+H]+ corresponding to aglycon luteolin for O-flavonoids, while for C-flavonoids, we observed a fragment ion at m/z 431 [M+H-H2O]+, corresponding to sugar’s fragmentation. Quercetin was one of the most abundant aglycons. The fragment ion at m/z 303 [M+H]+, corresponding to quercetin, was present in compounds 22, 23, 26, 28, 31 and 33. Peak 26 showed the loss of m/z 162, attributed to hexose units; 22 and 23 showed the double loss of m/z 162 and 146, corresponding to losses of hexose and deoxyhexose, respectively. In contrast, 31 and 33 showed the fragmentation pattern of C-hexoside with fragment ion at m/z 445 [M+H-C2H3O-H2O]+. The extract of CLF is very rich in anthocyanidins; in particular, compounds 16, 18 and 25 show the same fragment ion at m/z 303 [M]+, corresponding to a delphinidin aglycon. Finally, several polyunsaturated fatty acids and hydroxylated polyunsaturated fatty acids were observed at the end of the chromatogram. The identified metabolites in CLF are listed in Table 1.

2.3. Antioxidant Activity

Considering the phytochemical composition of the C. laciniata flower extract, different in vitro tests were performed to assess its antioxidant potential. Our results are reported in Table 2 and show a good antioxidant activity in DPPH and FRAP assays. Interestingly, in the TEAC test, CLF exhibited a strong ability to scavenge the ABTS radical, which provided results comparable to Trolox, used as positive control.

2.4. α-Amylase and α-Glucosidase Inhibitory Activity

The inhibitory effects on α-amylase and α-glucosidase enzymes were evaluated. Our results show that CLF inhibited both the enzymes, even if the effects on α-glucosidase were higher than α-amylase. Interestingly, CLF was demonstrated to be 100-fold more potent than the reference compound acarbose (4.56 vs. 436.47 µg/mL). The IC50 values of CLF are reported in Table 3 and compared to those of acarbose.

2.5. Inhibitory Effects on Tyrosinase Enzyme

C. laciniata extract was investigated regarding tyrosinase, and our results shown in Table 4 were compared to kojic acid, used as a positive control. The inhibitory effects of CLF are already evident in the first step of the reaction, with a lower IC50 value for monophenolase than diphenolase activity (67.47 vs. 103.61 µg/mL).

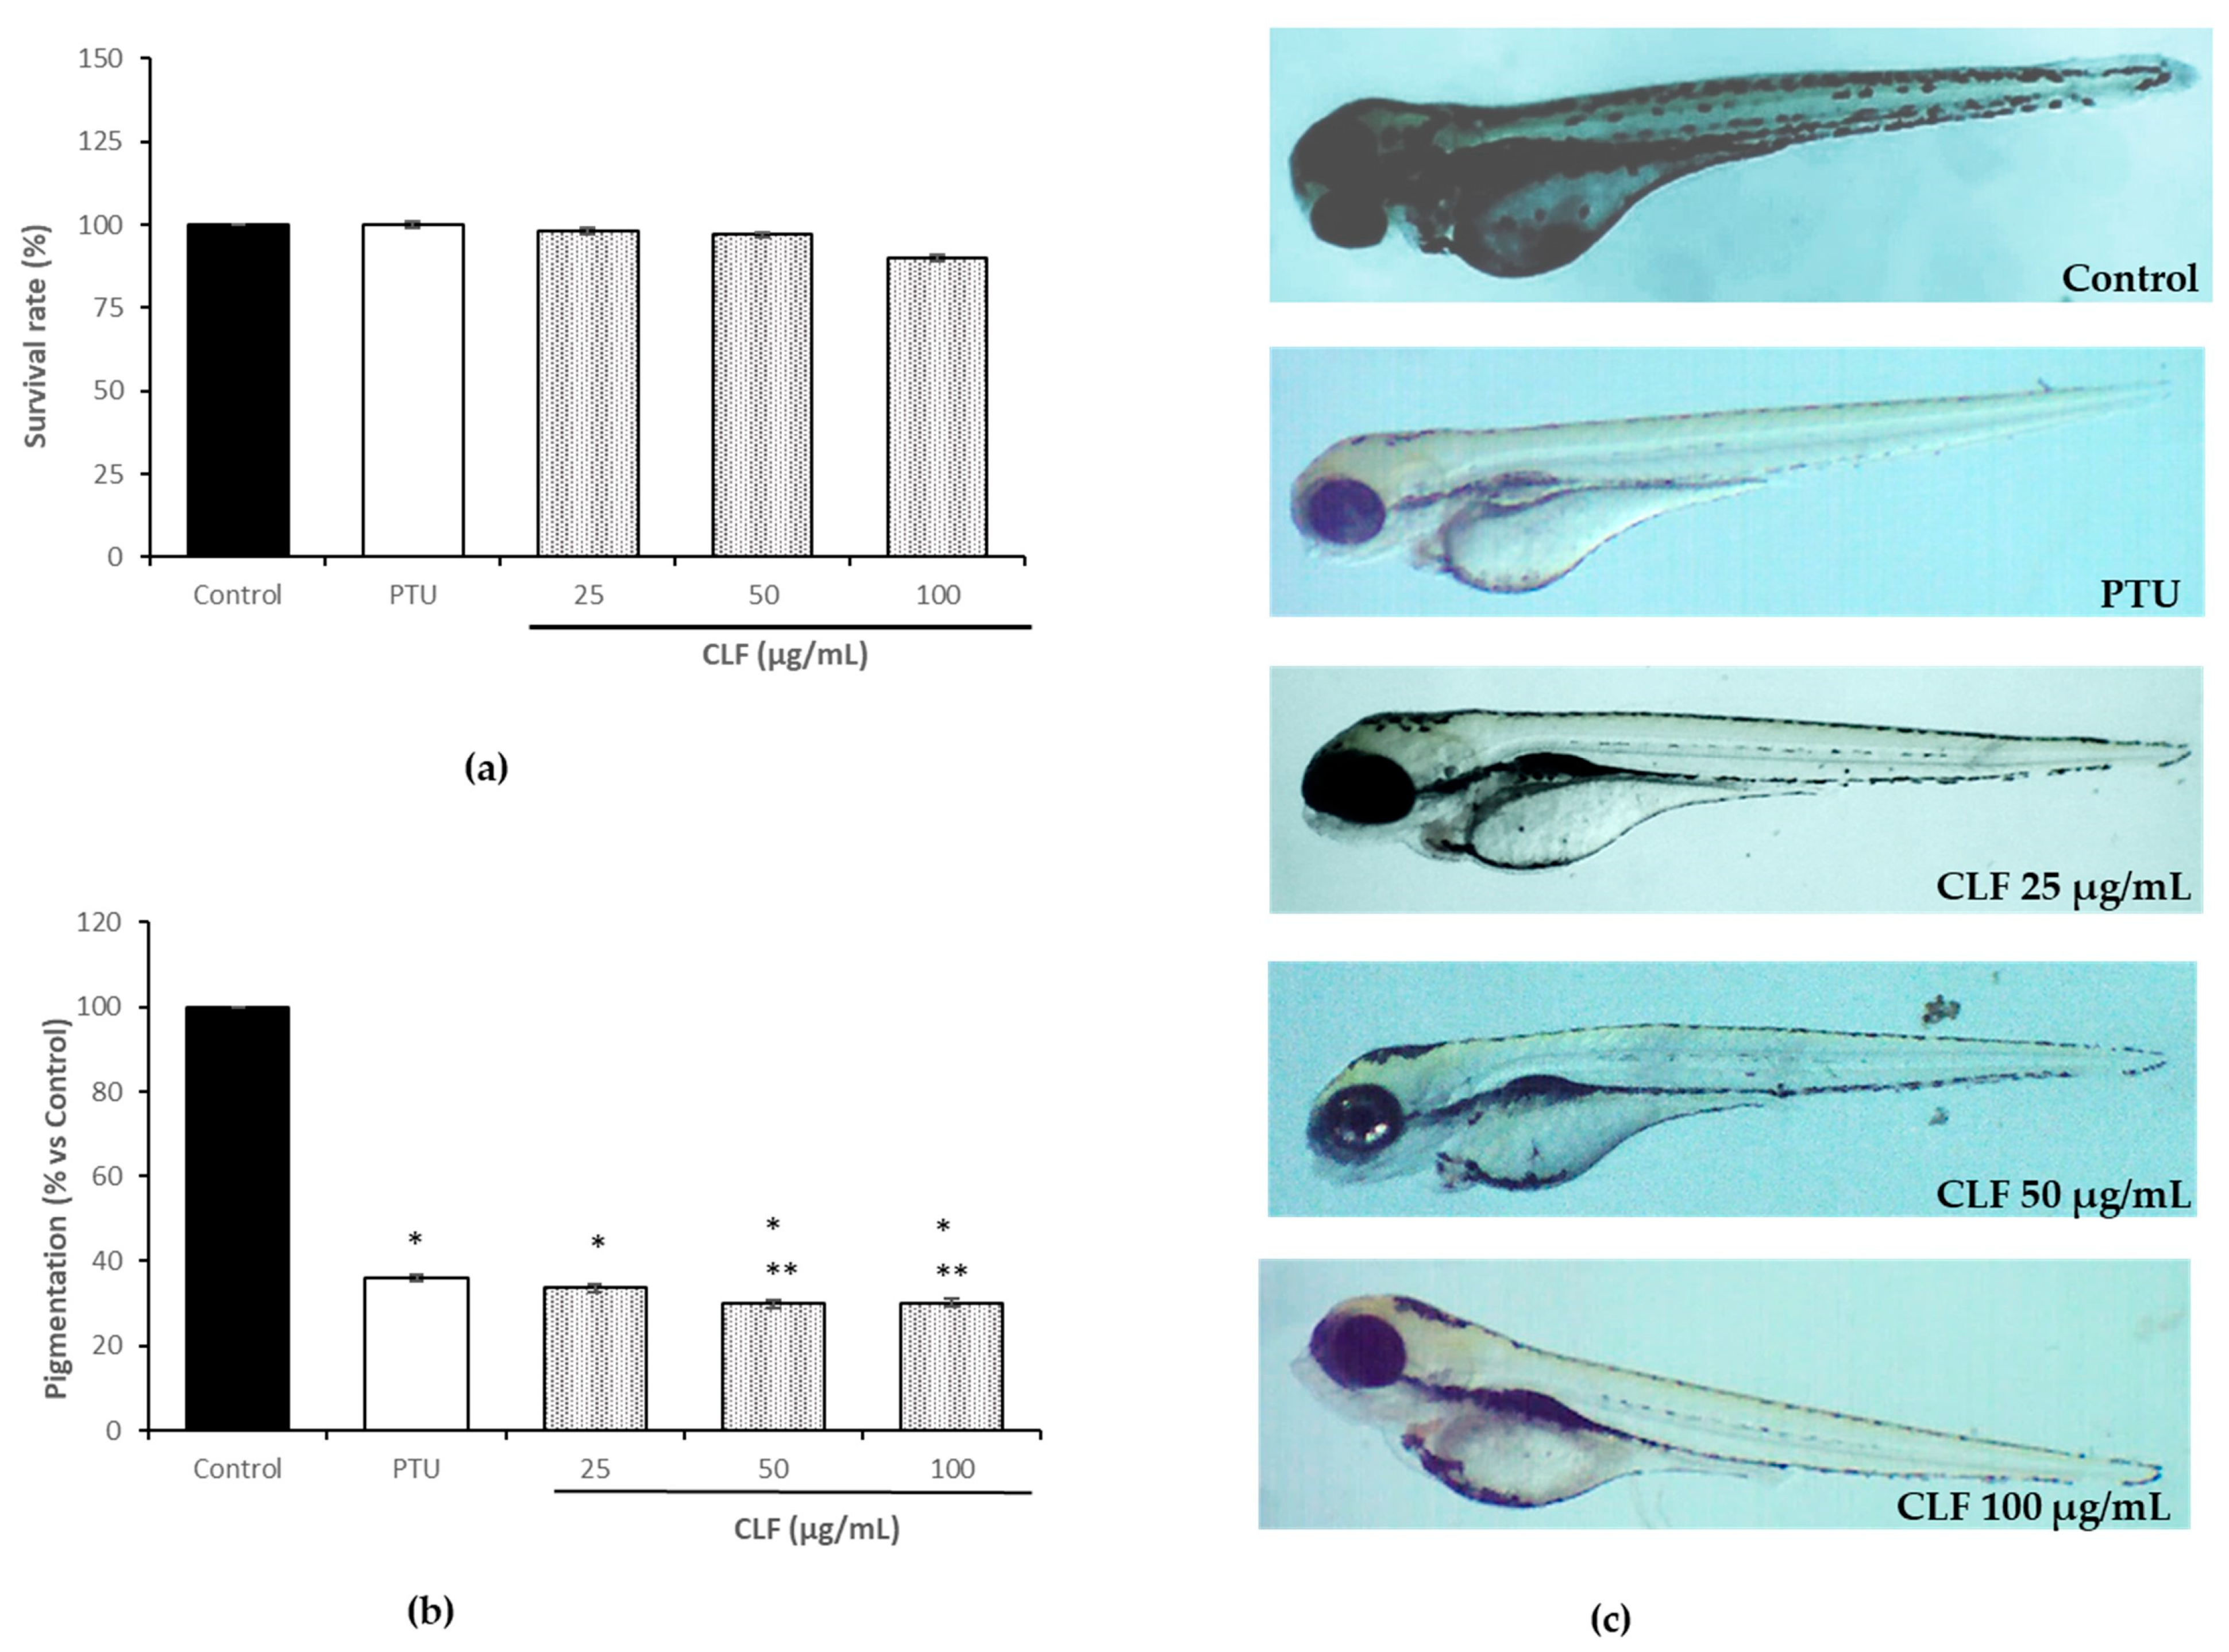
2.6. Inhibitory Effects on Melanogenesis in Zebrafish Embryos

In this study, a toxicological evaluation of zebrafish’s early-stage development was performed before evaluating the anti-melanogenic effects of CLF. In addition to a good survival percentage (90%), the absence of morphological abnormality in treated concentrations of CLF (25–100 µg/mL) until the end of the testing period (72 h post-fertilization, hpf) was observed (Figure 3, Panel a). The same treatment allowed us to evaluate the anti-melanogenic effects on zebrafish. After a visual inspection of the embryos under a stereomicroscope, images were captured and processed to quantify the whitening effects induced via CLF treatment with respect to the control (100% pigmentation) (Figure 3, Panel b and c). Overall, embryo pigmentation was significantly reduced in a dose-dependent manner after treatment with 25 and 50 µg (33.64% and 29.87% vs. control, respectively); however, the highest concentration (100 µg/mL) did not result in a further increase in depigmentation (30.19% vs. control). In general, it was found that treatment with CLF (25–50 µg) was slightly more effective than that with 1-Phenyl-2-thiourea (PTU), used as the reference standard (30 µg/mL, 36.00%).

3. Discussion

Crataegus species (hawthorn) have been used traditionally since ancient times. Hawthorn contains a variety of flavonoids and anthocyanins that appear to be primarily responsible for the cardiac action of the plant [6]. Our research was focused on C. laciniata, a species growing in Sicily (Nebrodi and Madonie mountains) described for the first time by Bernardino ab Ucria [4].
Firstly, we quantified the phenolic and flavonoid contents of a flower ethanolic extract, which proved to be particularly rich in flavonoids (2531.4 mg/100 g DW). Our results are similar to those reported for samples of Crataegus oxyacantha L. flowers from Algeria with a TPC average of 2759.0 mg GAE/100 g DW. However, data regarding TFC (660.7 mg RE/100 g DW) was lower than for our samples of C. laciniata [3]. Among the limited data regarding the flavonoid contents of the flowers of different Crataegus species, Edwards et al. reported lower values ranging from 317.8 to 1710 mg/100 g DW [6]. Therefore, when compared with the literature, variability can be attributed to the different locations and species.
Subsequently, through LC-MS/MS analysis, the phytochemical composition was determined. The phytochemical profile of CLF was rich in polyphenols. The most abundant polyphenols identified in CLF were flavonoid derivatives [7,8]. In addition to hyperoside and vitexin as the main metabolites, luteolin glycosides were detected. These results are in accordance with a previous study of Crataegus oxyacantha flowers that were rich in flavones like vitexin, as well as flavonols like rutin and hyperoside [3]. CLF was also found to be very rich in anthocyanidins, containing delphinidin aglycon [9]. Moreover, catechin and epicatechin polymers that corresponded to procyanidin derivates were identified. A similar procyanidin profile was also reported in flowers of two varieties of C. azarolus (C. azarolus L. var. aronia Batt. and C. azarolus L. var. eu-azarolus Maire) growing in Tunisia [10].
Oxidative stress generates excessive reactive oxygen species, which cause damage to cells, accelerating age-related dysfunctions and producing chronic diseases. To evaluate the antioxidant activity of our extract, we used DPPH, TEAC and FRAP tests. The results indicate that CLF has a good scavenger activity against DPPH (IC50 = 165.25 µg/mL). Interestingly, regarding TEAC assay, CLF possesses an IC50 value of 20.13 µg/mL, comparable to Trolox (IC50 = 13.08 µg/mL), due to the synergistic effects of its mixture of polyphenolic compounds. The same extract also showed a good antioxidant activity in the FRAP test (75.61 TE/g extract), supporting the reducing ability of its compounds.
The health-promoting activities of CLF were also investigated in vitro for two enzymes (α-amylase and α-glucosidase). The inhibition of α-amylase and α-glucosidase have seemed to be an important therapeutic target for the management of diabetes. Post-prandial hyperglycemia is modulated via the inhibition of these enzymes, which results in the delay of the carbohydrate digestion and glucose absorption. As depicted in Table 3, CLF displayed dual α-amylase (IC50 = 517.41 µg/mL) and α-glucosidase (IC50 = 4.56 µg/mL) inhibitory activity. In particular, the strong effect on this latter enzyme is comparable to those obtained with Irish seaweed extracts, reaching IC50 values below 2 µg/mL [11]. The high antihyperglycemic capacity of CLF could be related to its phytochemical composition, rich in glycosides such as hyperoside and vitexin. Indeed, recent studies reported that the α-amylase activity decreased in the presence of hyperoside in a competitive manner [12]. On the other hand, vitexin exhibited a potent inhibitory ability on α-glucosidase, with an uncompetitive mechanism of action [13].
Regarding the anti-melanogenic activity in vitro and in vivo, tests were performed on tyrosinase enzyme (TYR) and zebrafish embryos, respectively. TYR has been recognized as a key target for the screening of novel bioactive agents for dermatological disorders based on melanin accumulation. TYR catalyzes the two limiting reactions of melanin biosynthesis: the hydroxylation of L-tyrosine to L-DOPA (monophenolase activity), which is oxidized to form dopaquinone (diphenolase activity) [14].
The well-known TYR inhibitors, such as kojic acid, could be responsible for adverse effects occurring because of long-term application [15]. Due to these safety concerns, many medicinal plants have been screened using an in vitro TYR inhibition assay to search novel phytocomplexes with skin-whitening properties. Among different Crataegus species, it was previously reported that extracts from C. azarolus L. aerial parts and C. pinnatifida Bunge seeds reduced the melanin content in B16F10 cells by inhibiting the TYR activity [16,17]. On this basis, we investigated the effects of C. laciniata flowers on TYR. The results revealed that CLF inhibits both the monophenolase and the diphenolase activity at low concentrations (IC50 = 67.47 and 103.61 µg/mL, respectively). Considering that hyperoside and vitexin, the main metabolites identified in CLF, are effective TYR inhibitors, their involvement in anti-melanogenic activity cannot be excluded [18,19].
The zebrafish embryo is an accepted model for biochemical studies due to its high physiological and genetic similarity to mammals. For this reason, zebrafish embryo assays emerge as replacement approaches for animal experiments [20]. Zebrafish have several advantages, including small size and easy handling, as well as good absorption of test samples through the skin in the early stage. Moreover, the optically transparent embryogenesis allows us to observe the pigmentation process [21]. Accordingly, in this study, CLF showed strong whitening effects on the pigmentation of early-stage embryos without affecting their development and survival after 48 h of exposure. In similar experimental conditions, dibenzofuran compounds isolated from C. pycnoloba Boiss. and Heldr. aerial parts reduced embryo melanogenesis at 10 µg/mL [20]. Interestingly, the rich polyphenolic phytocomplex of CLF induced embryo depigmentation at an already low dosage (25 µg/mL), being slightly more effective than the standard PTU.

4. Materials and Methods

4.1. Sample Preparation and Extraction

C. laciniata flowers were collected from wild-growing plants in the locality Canna (Madonie, Sicily) at 1610 m (a.s.l.) during June 2022. A voucher specimen identified by Prof. F.M. Raimondo was deposited in PAL-Gr. For the experiments, flowers (5 g) were air-dried in the shade and extracted with 70% (v/v) ethanol (50 mL) via stirring on a plate for 10 min. Subsequently, the mixture was ultrasonicated for 30 min at 25 °C. The obtained extract was concentrated until achieving dryness (yield 12.76%).

4.2. Chemicals and Reagents

All chemicals and reagents, solvents, α-amylase (EC 3.2.1.1), α-glucosidase (EC 3.2.1.20) and mushroom tyrosinase (EC 1.14.18.1) were purchased from Merck (Milan, Italy).

4.3. Determination of Total Phenolic Content (TPC)

TPC was determined using the Folin–Ciocalteu reagent with small modifications [22]: 100 µL of sample solution (1 mg/mL) was initially diluted with 2000 µL of distilled water and subsequently mixed with 200 µL of the Folin–Ciocalteu reagent. After 3 min, 1000 µL of Na2CO3 (15%) was added. The reaction mixture was then incubated in the dark at room temperature for 1 h. At the end, the absorbance of the sample was measured at 765 nm using a spectrophotometer (UV-Spectrophotometer Cary 60, Agilent Technology, Milan, Italy). TPC was expressed in mg gallic acid equivalents (GAE) per 100 g of dry weight (DW) using a calibration curve of this compound.

4.4. Determination of Total Flavonoid Content (TFC)

TFC was determined according to the method of Xiong et al., albeit with some modifications [23]: 100 µL of extract (1 mg/mL) was initially diluted with 400 µL of distilled water and then mixed with 30 µL of NaNO2 (5%). After 5 min, 30 µL of AlCl3 (10%) were combined with the reaction mixture, and 6 min later, 200 µL of NaOH (1 M) and 240 µL of distilled water were finally added. The absorbance of the reaction mixture was then measured spectrophotometrically at 510 nm. The results were expressed as mg rutin equivalents (RE) per 100 g DW.

4.5. LC-MS/MS Qualitative Analysis

The separation system adopted was an Accela (Thermo Fisher Scientific, Milan, Italy) HPLC interfaced through an ESI source to a linear ion trap coupled to a high-resolution mass analyzer (LTQ-Orbitrap XL, Thermo Fisher Scientific, Milan, Italy) operating in negative- and positive-ion modes. HRESIMS data were obtained in both the positive- and negative-ion modes [24]. The MS data were first acquired in the full-mass and data-dependent-scan modes; then, tandem MS experiments were performed to identify the specialized metabolites. A C18 column (Luna C18 150 × 2.0 mm, 3 µm) (Phenomenex®, Castel Maggiore, Bologna, Italy) and a binary mobile phase composed of eluent A (ultrapure water–formic acid 0.1% v/v) and eluent B (ultrapure acetonitrile–formic acid 0.1% v/v) were used. The separation conditions ranged from 5% to 60% of B in 35 min and then to 100% in 15 min. The flow rate was set to 0.200 mL/min, and the injection volume was 10.0 µL [25].

4.6. Determination of Antioxidant Activity

The antioxidant activities of C. laciniata flower extracts were determined using three assays: 1,1-diphenyl- 2-picrylhydrazyl (DPPH) and 2,2′-azino-bis(3-ethylbenzothiazoline-6-sulfonic acid) (ABTS) radical scavenging activity and Fe3+-reducing antioxidant power (FRAP). DPPH scavenging activity was measured using the method of Xiong et al., albeit with minor modifications [23]. In brief, 0.5 mL of sample (50–250 µg/mL) was added to 3.0 mL of DPPH methanolic solution (0.1 mM). After shaking, the mixture was stored in the dark for 30 min at room temperature, and, finally, the absorbance was measured at 517 nm. Ascorbic acid served as the positive control. The percentage of DPPH scavenging activity was calculated using the following formula:
I n h i b i t i o n ( % ) = ( C S ) / C 100
where C = the absorbance of the control, and S = the absorbance of the extract.
Data were expressed as the concentration for 50% scavenging activity of DPPH radical (IC50).
The free radical scavenging activities of extracts were also determined via the TEAC test using ABTS radical following the method reported by Wang et al. [26]. Samples were tested ranging from 12.5 to 125 µg/mL. Trolox was used as a positive control. The percentage of ABTS free radical scavenging activity was calculated using the following formula:
I n h i b i t i o n ( % ) = ( C S ) / C 100
Data were expressed in terms of the decrease in ABTS scavenging activity by 50%.
The FRAP test was evaluated following the method reported by Uysal et al., employing the following mixture as a reagent [27]: 2,4,6-tri(2-pyridyl)-s-triazine, acetate buffer and FeCl3 6H2O. Samples were tested ranging from 12.5 to 125 µg/mL. The results were reported as mg Trolox equivalents (mg TE/g extract).

4.7. α-Amylase Inhibitory Assay

The α-amylase inhibition assay was performed using the 3,5-dinitrosalicylic acid (DNSA) method, albeit with minor modifications [28]. A mixture of 40 µL of C. laciniata flower extract in DMSO (0.25–1.0 mg/mL), 160 µL distilled water and 200 µL α-amylase enzyme (4 U/mL dissolved in buffer Na2HPO4/NaH2PO4 0.02 M containing NaCl 0.006 M, pH 6.9) was incubated at 30 °C for 10 min. Then, 400 µL of potato starch (0.5%, w/v) were added to the mixture and re-incubated via the method previously described.
At the end, 200 μL of mixture was removed, added into a separate tube containing 100 µL of DNSA reagent solution (96 mM 3,5-dinitrosalicylic acid, 5.31 M sodium potassium tartrate in 2 M NaOH) and placed into a water bath at 90 °C. After 15 min, this mixture was diluted with 900 µL distilled water, and the absorbance was measured at 540 nm using a UV-Visible spectrophotometer. The control with 100% enzyme activity was prepared by replacing the extract with DMSO (40 μL). A blank was similarly prepared by replacing the enzyme solution with distilled water to allow absorbance produced by the extract. Acarbose (10–100 µg/mL) was used as a positive control.
The α-amylase inhibitory activity was calculated using the following equation:
I n h i b i t i o n ( % ) = ( C S ) / C 100
where C = the absorbance of the control, and S = the absorbance of the extract—blank
The results are reported as the concentration inhibiting 50% of the enzymatic activity (IC50).

4.8. α-Glucosidase Inhibitory Assay

The α-glucosidase inhibition assay was performed according to the procedure described by Milella et al., albeit with minor modifications [29]. The reaction mixture was prepared with 650 µL of phosphate buffer (0.1 M, pH 6.8), 200 µL of the test sample (1–100 µg/mL) and 100 µL of enzyme solution (0.4 U/mL in buffer) and incubated at 37 °C for 15 min. Then, 300 μL of 4-nitrophenyl α-D-glucopyranoside (2.5 mM in buffer) was added to the mixture and re-incubated via the method previously described. Absorbance was measured at 405 nm. The control with 100% enzyme activity was prepared by replacing the extract with buffer (200 μL). A blank was similarly prepared by replacing the enzyme solution with buffer to determine the absorbance produced by the extract. Acarbose (10–1000 µg/mL) was used as a positive control. The inhibition percentage was calculated via the following equation:
I n h i b i t i o n ( % ) = ( C S ) / C 100
where C = the absorbance of the control, and S = the absorbance of the extract—blank.
The results are reported as IC50.

4.9. Tyrosinase Enzyme Inhibitory Assay

An in vitro assay was performed according to the method of Mirabile et al. [30]. The tyrosinase inhibitory effects of C. lacianiata flower extracts were evaluated based on both the monophenolase and diphenolase activities of a tyrosinase from Agaricus bisporus. The tests were conducted as follows: aliquots (50 µL) of extract (50–250 µg/mL) were mixed with 500 µL of substrate, L-DOPA or L-tyrosine (1.25 mM) and 900 µL of phosphate buffer (50 mM, pH 6.8). After 10 min of incubation at 25 °C, 50 µL of enzyme (333 U/mL) was added to the reaction mixture. To evaluate the inhibitory effects, absorbance was recorded at 475 nm for up to 40 min to evaluate the monophenolase activity, as well as after just 60 s for the diphenolase activity. DMSO and kojic acid (1–25 μg/mL) were used as negative and positive controls.
The inhibitory effects on tyrosinase enzyme activity were calculated using the following equation:
I n h i b i t i o n ( % ) = ( C S ) / C 100
where C = tyrosinase + substrate (L-DOPA or L-tyrosine), and S = tyrosinase + substrate (L-DOPA or L-tyrosine) + sample.
The results are reported as the concentration inhibiting 50% of the enzymatic activity (IC50).

4.10. Zebrafsh Embryo Maintenance and Treatment

Adult zebrafish specimens (male and female) were maintained in a temperature-controlled aquarium (28.5 °C) with light-dark cycles and regularly fed with Artemia salina larvae [31]. After natural deposition, the laid eggs were collected and incubated at 28.5 °C. After 24 h, all the eggs were observed under a stereomicroscope (SMZ-171 Series, Motic, Hong Kong, China) to select the fertilized ones. The vitality test and whitening effect were evaluated in vivo on zebrafish embryos according to the following method [32]. The eggs at 24 hpf (hours post-fertilization) wee manually stripped of the chorion, and the embryos were distributed into 96-well plates (1 embryo per well), randomly divided into four experimental groups (20 embryos per three replicates for each group) and subjected to treatment with CLF (25, 50 and 100 µg/mL), before being solubilized in DMSO (0.2%). Control embryos were incubated with embryo water (negative control). After 48 h of incubation at 28 °C (72 hpf), the effects of the treatment were observed using a stereomicroscope (SMZ-171 Series, Motic) equipped with a digital camera (Moticam® 5 plus) for image acquisition. The abnormal phenotypes and mortality of each treated group were documented. Regarding the whitening effects, the Pillow library for the Python programming language was used to process the acquired images of the CLF treatment (25–100 μg/mL), PTU (30 μg/mL) and controls. The images were converted to gray scale, and the pixel measurements analyzer program was used to count the area of the zebrafish image pigmentation. The quantification of pigmentation was expressed as a percentage change compared to the control group, which was considered to be 100%. All experiments were performed in compliance with the European Directive 2010/63/EU and following the ethical guidelines described by the National Institute of Health Guide for the Care and Use of Laboratory Animals.

4.11. Statistical Analysis

The statistical significance was evaluated via one-way analysis of variance (ANOVA). Data were considered statistically significant for p < 0.05 and p < 0.01.

5. Conclusions

In conclusion, the aim of this study was the investigation of Crataegus laciniata flower (CLF) extract. The obtained results outline that CLF is a rich source of bioactive compounds, which can be used for the treatment of metabolic disorders, as well as skin hyperpigmentation. In addition, its favourable safety profile observed during in vivo experiments might promote future applications in the pharmaceutical and cosmeceutical fields.

Author Contributions

Conceptualization, M.P.G. and S.M.; methodology, S.M., V.D., S.P.A., V.P. and E.R.; formal analysis, S.M. and E.R.; resources, F.M.R.; data curation, S.M., V.D. and M.P.G.; writing—original draft preparation, M.P.G., V.D. and S.M.; writing—review and editing, S.M., V.D., M.P.G. and E.R.; supervision, M.P.G. All authors have read and agreed to the published version of the manuscript.

Funding

This research received no external funding.

Data Availability Statement

Data are contained within this article.

Conflicts of Interest

The authors declare no conflict of interest.

References

  1. Venskutonis, P.R. Phytochemical composition and bioactivities of hawthorn (Crataegus spp.): Review of recent research advances. J. Food Bioact. 2018, 4, 69–87. [Google Scholar] [CrossRef]
  2. Nazhand, A.; Lucarini, M.; Durazzo, A.; Zaccardelli, M.; Cristarella, S.; Souto, S.B.; Silva, A.M.; Severino, P.; Souto, E.B.; Santini, A. Hawthorn (Crataegus spp.): An Updated Overview on Its Beneficial Properties. Forests 2020, 11, 564. [Google Scholar] [CrossRef]
  3. Issaadi, O.; Fibiani, M.; Picchi, V.; Lo Scalzo, R.; Madani, K. Phenolic composition and antioxidant capacity of hawthorn (Crataegus oxyacantha L.) flowers and fruits grown in Algeria. J. Complement. Integr. Med. 2020, 17, 20180125. [Google Scholar] [CrossRef] [PubMed]
  4. Calvo, J.; Ufimov, R.; Aedo, C. Proposal to conserve the name Crataegus laciniata (Rosaceae) with a conserved type. Taxon 2015, 64, 175–176. [Google Scholar] [CrossRef]
  5. Sumner, L.W.; Amberg, A.; Barrett, D.; Beale, M.; Beger, R.; Daykin, C.; Fan, T.; Fiehn, O.; Goodacre, R.; Griffin, J.; et al. Proposed minimum reporting standards for chemical analysis. Metabolomics 2007, 3, 211–221. [Google Scholar] [CrossRef]
  6. Edwards, J.E.; Brown, P.N.; Talent, N.; Dickinson, T.A.; Shipley, P.R. A review of the chemistry of the genus Crataegus. Phytochemistry 2012, 79, 5–26. [Google Scholar] [CrossRef]
  7. Bardakci, H.; Celep, E.; Gözet, T.; Kan, Y.; Kırmızıbekmez, H. Phytochemical characterization and antioxidant activities of the fruit extracts of several Crataegus taxa. S. Afr. J. Bot. 2019, 124, 5–13. [Google Scholar] [CrossRef]
  8. Tsimogiannis, D.; Samiotaki, M.; Panayotou, G.; Oreopoulou, V. Characterization of flavonoid subgroups and hydroxy substitution by HPLC-MS/MS. Molecules 2007, 12, 593–606. [Google Scholar] [CrossRef]
  9. Belkhir, M.; Rebai, O.; Dhaouadi, K.; Congiu, F.; Tuberoso, C.I.G.; Amri, M.; Fattouch, S. Comparative analysis of Tunisian wild Crataegus azarolus (yellow azarole) and Crataegus monogyna (red azarole) leaf, fruit, and traditionally derived syrup: Phenolic profiles and antioxidant and antimicrobial activities of the aqueous-acetone extracts. J. Agric. Food Chem. 2013, 61, 9594–9601. [Google Scholar] [CrossRef]
  10. Bahri-Sahloul, R.; Ammar, S.; Fredj, R.B.; Saguem, S.; Grec, S.; Trotin, F.; Skhiri, F.H. Polyphenol contents and antioxidant activities of extracts from flowers of two Crataegus azarolus L. varieties. Pak. J. Biol. Sci. 2009, 12, 660–668. [Google Scholar] [CrossRef]
  11. Lordan, S.; Smyth, T.J.; Soler-Vila, A.; Stanton, C.; Ross, R.P. The α-amylase and α-glucosidase inhibitory effects of Irish seaweed extracts. Food Chem. 2013, 141, 2170–2176. [Google Scholar] [CrossRef] [PubMed]
  12. Shen, H.; Wang, J.; Ao, J.; Hou, Y.; Xi, M.; Cai, Y.; Li, M.; Luo, A. Structure-activity relationships and the underlying mechanism of α-amylase inhibition by hyperoside and quercetin: Multi-spectroscopy and molecular docking analyses. Spectrochim. Acta A Mol. Biomol. Spectrosc. 2023, 285, 121797. [Google Scholar] [CrossRef] [PubMed]
  13. Ni, M.; Hu, X.; Gong, D.; Zhang, G. Inhibitory mechanism of vitexin on α-glucosidase and its synergy with acarbose. Food Hydrocoll. 2020, 105, 105824. [Google Scholar] [CrossRef]
  14. Thawabteh, A.M.; Jibreen, A.; Karaman, D.; Thawabteh, A.; Karaman, R. Skin Pigmentation Types, Causes and Treatment-A Review. Molecules 2023, 28, 4839. [Google Scholar] [CrossRef] [PubMed]
  15. Cho, K.; Ryu, C.S.; Jeong, S.; Kim, Y. Potential adverse effect of tyrosinase inhibitors on teleosts: A review. Comp. Biochem. Physiol. C Toxicol. Pharmacol. 2020, 228, 108655. [Google Scholar] [CrossRef] [PubMed]
  16. Mustapha, N.; Bze’ouich, I.M.; Ghedira, K.; Hennebelle, T.; Chekir-Ghedira, L. Compounds isolated from the aerial part of Crataegus azarolus inhibit growth of B16F10 melanoma cells and exert a potent inhibition of the melanin synthesis. Biomed. Pharmacother. 2015, 69, 139–144. [Google Scholar] [CrossRef]
  17. Huang, X.-X.; Liu, Q.-B.; Wu, J.; Yu, L.-H.; Cong, Q.; Zhang, Y.; Lou, L.-L.; Li, L.-Z.; Song, S.-J. Antioxidant and tyrosinase inhibitory effects of neolignan glycosides from Crataegus pinnatifida seeds. Planta Med. 2014, 80, 1732–1738. [Google Scholar] [CrossRef]
  18. Ren, G.; Xue, P.; Sun, X.; Zhao, G. Determination of the volatile and polyphenol constituents and the antimicrobial, antioxidant, and tyrosinase inhibitory activities of the bioactive compounds from the by-product of Rosa rugosa Thunb. var. plena Regal tea. BMC Complement. Altern. Med. 2018, 18, 307–315. [Google Scholar] [CrossRef]
  19. Orhan, I.E.; Senol, F.S.; Erdem, S.A.; Tatli, I.I.; Kartal, M.; Alp, S. Tyrosinase and Cholinesterase Inhibitory Potential and Flavonoid Characterization of Viola odorata L. (Sweet Violet). Phytother. Res. 2015, 29, 1304–1310. [Google Scholar] [CrossRef]
  20. Agalou, A.; Thrapsianiotis, M.; Angelis, A.; Papakyriakou, A.; Skaltsounis, A.L.; Aligiannis, N.; Beis, D. Identification of Novel Melanin Synthesis Inhibitors from Crataegus pycnoloba Using an in vivo Zebrafish Phenotypic Assay. Front. Pharmacol. 2018, 9, 265. [Google Scholar] [CrossRef]
  21. Choi, T.Y.; Kim, J.H.; Ko, D.H.; Kim, C.H.; Hwang, J.S.; Ahn, S.; Kim, S.Y.; Kim, C.D.; Lee, J.H.; Yoon, T.J. Zebrafish as a new model for phenotype-based screening of melanogenic regulatory compounds. Pigment. Cell Res. 2007, 20, 120–127. [Google Scholar] [CrossRef] [PubMed]
  22. Singleton, V.L.; Orthofer, R.; Lamuela-Raventos, R.M. Analysis of Total Phenols and Other Oxidation Substrates and Antioxidants by Means of Folin-Ciocalteu Reagent. Methods Enzymol. 1999, 299, 152–178. [Google Scholar] [CrossRef]
  23. Xiong, L.; Yang, J.; Jiang, Y.; Lu, B.; Hu, Y.; Zhou, F.; Mao, S.; Shen, C. Phenolic compounds and antioxidant capacities of 10 common edible flowers from China. J. Food Sci. 2014, 79, C517–C525. [Google Scholar] [CrossRef] [PubMed]
  24. Pizza, C.; Zhou, L.; De Tommasi, N. Plant Metabolites. Triterpenoid Saponins from Calendula arvensis. J. Nat. Prod. 1987, 50, 927–931. [Google Scholar] [CrossRef]
  25. De Leo, M.; Iannuzzi, A.; Germanò, M.P.; Camangi, F.; D’Angelo, V.; Diretto, G.; Sevi, F.; De Tommasi, N.; Braca, A. Comparative chemical analysis of six ancient italian sweet cherry (Prunus avium L.) varieties showing antiangiogenic activity. Food Chem. 2021, 360, 129999. [Google Scholar] [CrossRef]
  26. Wang, S.S.; Wang, D.M.; Pu, W.J.; Li, D.W. Phytochemical profiles, antioxidant and antimicrobial activities of three Potentilla species. BMC Complement. Altern. Med. 2013, 13, 321. [Google Scholar] [CrossRef]
  27. Uysal, S.; Zengin, G.; Locatelli, M.; Bahadori, M.B.; Mocan, A.; Bellagamba, G.; De Luca, E.; Mollica, A.; Aktumsek, A. Cytotoxic and enzyme inhibitory potential of two Potentilla species (P. speciosa L. and P. reptans Willd.) and their chemical composition. Front. Pharmacol. 2017, 8, 290. [Google Scholar] [CrossRef]
  28. Hawash, M.; Jaradat, N.; Elaraj, J.; Hamdan, A.; Lebdeh, S.A.; Halawa, T. Evaluation of the hypoglycemic effect of seven wild folkloric edible plants from Palestine. J. Complement. Integr. Med. 2020, 17, 20190032. [Google Scholar] [CrossRef]
  29. Milella, L.; Milazzo, S.; De Leo, M.; Vera Saltos, M.B.; Faraone, I.; Tuccinardi, T.; Lapillo, M.; De Tommasi, N.; Braca, A. α-Glucosidase and α-Amylase Inhibitors from Arcytophyllum thymifolium. J. Nat. Prod. 2016, 79, 2104–2112. [Google Scholar] [CrossRef]
  30. Mirabile, S.; Ielo, L.; Lombardo, L.; Ricci, F.; Gitto, R.; Germanò, M.P.; Pace, V.; De Luca, L. Leveraging the 3-Chloro-4-fluorophenyl Motif to Identify Inhibitors of Tyrosinase from Agaricus bisporus. Int. J. Mol. Sci. 2023, 24, 7944. [Google Scholar] [CrossRef]
  31. Westerfield, M. The Zebrafish Book. A Guide for the Laboratory Use of Zebrafish (Danio Rerio), 4th ed.; University of Oregon Press: Eugene, OR, USA, 2000. [Google Scholar]
  32. Smeriglio, A.; D’Angelo, V.; Denaro, M.; Trombetta, D.; Raimondo, F.M.; Germanò, M.P. Polyphenol Characterization, Antioxidant and Skin Whitening Properties of Alnus cordata Stem Bark. Chem. Biodivers. 2019, 16, e1900314. [Google Scholar] [CrossRef] [PubMed]
Figure 1. Total phenolic (TPC) and total flavonoid (TFC) contents of C. laciniata flower extract. Data are reported as the mean ± standard deviation (SD) of triplicate experiments (n = 3). TPC are expressed as mg gallic acid equivalents (GAE)/100 g dry weight (DW). TFC are expressed as mg rutin equivalents (RE)/100 g DW.
Plants 13 00034 g001
Figure 2. High-performance liquid chromatography–high-resolution electrospray ionization–mass spectrometry profile of CLF extract. Peaks (141) correspond to compounds listed in Table 1.
Plants 13 00034 g002
Figure 3. (a) The survival rate of zebrafish embryos after 72 h of treatment with PTU and C. laciniata flower extract (25–100 µg/mL). (b) Effects of CLF on the pigmentation of zebrafish embryos after treatment. Pigmentation was expressed as % vs. control. * p < 0.01, vs. control. ** p < 0.05, vs. PTU (c) Images of zebrafish embryos at 72 hpf (magnification 20×) were captured using a stereomicroscope (SMZ-171 Series, Motic, San Antonio, TX, USA) equipped with a digital camera (MotiCam® 5 plus, Motic, San Antonio, TX, USA).
Plants 13 00034 g003
Table 1. Secondary metabolites identified in CLF extract via LC-MS/MS analysis (tr = retention time; MSI = Metabolomics Standards Initiative).
Peakstr (min)[M+H]+[M-H]Fragmentation aCompoundFormulaError (ppm)MSI Level a
118.16517.1550 355Caffeoylquinic acid-O-hexosideC22H28O14−0.342
218.52517.1550 355Caffeoylquinic acid-O-hexoside isomerC22H28O14−0.342
320.77449.1057 b 287Cyanidin-O-hexosideC21H21O11−4.671
422.50 337.0928191;161Coumaraylquinic acidC16H18O82.982
522.94 325.0945161Coumaric acid O-hexosideC15H18O88.322
623.22 515.1176323Dicaffeoylquinic acidC25H24O121.552
724.11 353.0851161Caffeoylquinic acidC16H18O9−4.552
825.33 515.138355;161;191Caffeoylquinc acid O-hexosideC22H28O14−2.972
925.43387.2004 369;207RoseosideC19H30O8−2.442
1026.29 577.1372425;289Procyanidin dimerC30H26O125.542
1126.91 577.1372425;290Procyanidin dimer isomerC30H26O125.542
1227.14611.1580 433RutinC27H30O16−4.351
1328.44291.0863 273;165;151;123CatechinC15H14O6−0.052
1431.06369.1180 145;117Feruloylquinic acidC17H20O9−0.032
1531.63 865.1974695;577;407;287Procyanidin trimerC45H38O180.002
1632.23627.1565 b 465;303Delphinidin-O-dihexosideC27H31O171.592
1732.52449.1078 431,416,383Luteolin-C-hexosideC21H20O11−0.082
1832.7627.1565 b 465;303Delphinidin-O-dihexoside isomerC27H31O171.592
1933.33449.1078 431,416,383Luteolin-C-hexoside isomerC21H20O11−0.082
2035.4565.1552 433;415Apigenin-C-hexoside-O-pentosideC26H28O140.032
2135.8433.1116 415VitexinC21H20O10−3.051
2236.33611.1577 465;303Quercetin-O-hexoside-rhamnosideC27H30O16−4.842
2336.57611.1577 465;303Quercetin-O-hexoside-rhamnoside isomerC27H30O16−4.842
2437.57465.1010 303HyperosideC21H20O12−3.771
2538.09 465.1000301Delphinidin-O-hexoside C21H21O12−5.802
2640.03479.1163 317Methoxyquercetin-O-hexosideC22H22O12−4.382
2740.26449.1078 287Luteolin-O-hexosideC21H20O11−0.082
2840.33625.1732 479;317Methoxyquercetin-O-hexoside-rhamnosideC28H35O16−4.952
2941.44449.1057 287Luteolin-O-hexosideC21H20O11−4.762
3041.46449.1078 287Luteolin-O-hexosideC21H20O11−0.082
3143.4507.2233 463;445;343;301Acetylquercetin-C-hexosideC23H22O13−0.082
3245.37535.1069 287Luteolin-O-malonylhexosideC24H22O14−2.422
3350.12507.2233 463;445Acetylquercetin-C-hexoside isomerC23H22O13−0.082
3454.16 329.2310311;313;293;275Trihydroxyoctadecenoic acidC18H34O5−3.642
3555.7 331.2465313;295;277Trihydroxyoctadecanoic acidC18H36O5−4.222
3656.04 293.2104275Hydroxyoctadecatrienoic acidC18H30O3−2.382
3756.43 311.2212293;275Dihydroxyoctadecatrenoic acidC18H32O4−1.282
3857.5333.2617 315;297;279Trihydroxyoctadecanoic acid isomerC18H36O5−5.402
3959.31289.2367 271;253;235Dihydroxyphenylnonanoic acidC16H32O4−2.072
4061.31309.2074 291;273Dihydroxyoctadecatrenoic acid isomerC18H28O44.542
4162.28309.2074 291;274Dihydroxyoctadecatrenoic acid isomer IIC18H28O44.542
a Sumner et al., 2007 [5]. b m/z values are expressed as [M]+.
Table 2. Antioxidant activity of C. laciniata flower (CLF) extract.
DPPH (IC50 µg/mL) TEAC (IC50 µg/mL)FRAP (TE/g Extract)
CLF165.25 ± 0.1520.13 ± 0.0975.61 ± 0.025
Ascorbic acid16.95 ± 1.20--------
Trolox----13.08 ± 0.02----
Data are reported as the mean ± standard deviation (SD) of triplicate experiments (n = 3). IC50 = concentration giving 50% of the activity; TE = Trolox equivalents.
Table 3. α-amylase and α-glucosidase inhibition of C. laciniata flower (CLF) extract.
α-Amylase (IC50 µg/mL)α-Glucosidase (IC50 µg/mL)
CLF517.41 ± 36.864.56 ± 0.13
Acarbose29.07 ± 1.9436.47 ± 58.82
Data are reported as the mean ± standard deviation (SD) of triplicate experiments (n = 3). IC50 = concentration inhibiting 50% of the enzyme activity.
Table 4. Tyrosinase inhibition of C. laciniata flower (CLF) extract.
Monophenolase (IC50 µg/mL)Diphenolase (IC50 µg/mL)
CLF67.47 ± 3.86103.61 ± 5.46
Kojic acid9.18 ± 1.242.52 ± 0.81
Data are reported as the mean ± standard deviation (SD) of triplicate experiments (n = 3). IC50 = concentration inhibiting 50% of the enzyme activity.
Disclaimer/Publisher’s Note: The statements, opinions and data contained in all publications are solely those of the individual author(s) and contributor(s) and not of MDPI and/or the editor(s). MDPI and/or the editor(s) disclaim responsibility for any injury to people or property resulting from any ideas, methods, instructions or products referred to in the content.

