Abstract
Polycyclic aromatic hydrocarbons (PAHs) form an important group of organic pollutants due to their distribution in the environment and their carcinogenic and/or mutagenic effects. In order to identify at the molecular level some of the players in the biodegradation and tolerance response to PAHs in plants, we have phenotyped 32 Arabidopsis thaliana T-DNA mutant lines corresponding to 16 cytochrome P450 (CYP) genes that showed to be differentially expressed under contrasted stress conditions induced by phenanthrene, a 3-ring PAH. This screening has allowed us to identify CYP75B1 (At5g07990) T-DNA mutants as the only ones being sensitive to phenanthrene-induced stress, supporting that CYP75B1 protein is necessary for PAH tolerance. CYP75B1 codes for a 3′flavonol hydroxylase. CYP75B1 gene was heterologously expressed on yeast in order to investigate whether it affects the A. thaliana response to phenanthrene by participating in its metabolization. Heterologously-produced CYP75B1 enzyme shows to be catalytically efficient against its physiological substrates (e.g., naringenin) but unable to metabolize phenanthrene or 9-phenanthrenol. In contrast, CYP75B1 seems rather involved in phenanthrene tolerance as a crucial element by regulating concentration of antioxidants through the production of 3′-hydroxylated flavonoids such as quercetin and cyanidin. In particular, we report a highly increased generation of reactive oxygen species (H2O2 and singlet oxygen) in cyp75b1 mutants compared to control plants in response to phenanthrene treatment. Overall, CYP75B1 shows to play an important role in the response to the deleterious effects of phenanthrene exposure and this is related to oxidative stress sensitivity rather than metabolization.
1. Introduction
Polycyclic aromatic hydrocarbons (PAHs) are widely distributed (atmosphere, water, soil and marine sediments) environmental pollutants deriving from petrogenic and pyrogenic processes of anthropogenic and/or natural origins [1]. PAHs are one of the largest known classes of chemicals with toxic, mutagenic and/or carcinogenic potential [2], sixteen of them being listed as priority pollutants by the U.S.A. Environmental Protection Agency (EPA) [3]. PAHs are, in fact, highly persistent in the environment as they are difficult to degrade and can accumulate in different compartments of the environment [4]. Although abiotic degradation and soil compartmentalization of PAHs occur, biotic metabolism is also an important route of transformation [4]. Most of the concern for public health in relation to environmental PAHs is restricted to direct exposure of humans to PAHs [5]. However, the most important biotic sink for xenobiotics in the environment is represented by plants, which amount to an estimated 85% of total living biomass [6].
PAHs have a broad impact on overall human but also plant health, both directly and by means of the reactive electrophilic metabolites obtained after PAH transformation by cells [7,8]. These reactive compounds generate oxidative stress and DNA damage, leading to cell death and/or mutations. Furthermore, because they lack an organized excretion system, plants do accumulate most of the absorbed PAHs and the metabolites formed thereof and can thus transmit these further down the food chain. Thus, available information provides evidence for the ability of plants to process and to accumulate PAHs or derived metabolites [9,10]. In contrast, much less is known concerning the underlying biochemical mechanisms, that is, the chemistry used by plants for the transformation and bioconcentration of foreign chemicals. Such knowledge is essential for developing PAH bioremediation strategies for contaminated soil and water, as well as for assessing the risk for public and environmental health linked to both the sink and metabolic capability of plants.
For several decades now, there has been general agreement that xenobiotic metabolism in plants follows a three-phase scheme [11]. Phase I consists of functionalization of a parent compound, by addition of oxygen to form a reactive site, into a less toxic product. Phase II involves conjugation of derived metabolites to a sugar, amino acid or glutathione, which increases the water solubility and reduces toxicity. Phase III involves compartmentation of derived metabolites either as soluble conjugates in the vacuole or as residues covalently bound to cell wall structures. In plants, like in animals, oxidation steps mediated by oxidative enzymes are of prime importance for PAH metabolism since they are very often rate-limiting, and they are prerequisite for further transformation [12,13].
Paramount among the xenobiotic oxidative enzymes in plants and animals are the cytochrome P450-dependent monooxygenases (CYPs), which are key enzymes in Phase I xenobiotic metabolism [11,12,13,14]. An additional aspect of CYP-mediated metabolism of organic pollutants is their participation in xenobiotic activation [14,15]. CYP-mediated xenobiotic metabolism in plants is better documented for herbicides, playing a pivotal role in their biotransformation and constituting a factor of resistance and selectivity toward herbicides [14,15,16]. Participation of plant CYPs in the metabolism of other organic chemicals has been less studied. In the case of PAHs, a few examples reporting their metabolism in microsomal fractions from several plant species are known [17,18,19,20,21,22] but participation of CYPs has only been demonstrated in some cases and, to date, no plant CYP-metabolizing PAHs have been characterized at the molecular level. However, CYP-mediated metabolism of PAHs is well described at both enzymatic and molecular level in other organisms such as humans [23], fish [24], fungi [25] and bacteria [26]. Nevertheless, plant CYPs make up about 1% of all the genes in plant genomes, constituting the largest class of plant enzymes [27]. It has thus been realized that higher plants constitute a source of CYP genes much larger in number and diversity than what is found in animals [28]. Therefore, effort focused on isolating and characterizing plant CYP genes associated with PAH metabolism is still worthy and must continue in the future. In this sense, the use of CYP effectors, sometimes successfully used to characterize and isolate plant CYPs [29,30,31], coupled to emerging omics approaches is a very promising strategy for unraveling molecular mechanisms of PAH metabolism and tolerance in plants [32].
Recently, we showed that phenanthrene tolerance is highly increased by sucrose treatment and we presented the early molecular events concomitant with tolerance to phenanthrene induced by sucrose application [33,34]. Here, we have focused on the role of the CYP complement in A. thaliana on sucrose-induced tolerance to phenanthrene. We have phenotyped 32 knockout mutants corresponding to 16 phenanthrene-regulated CYP genes identified after long-time [35] or short-time exposure [33,34] to phenanthrene either or not under a sucrose background. Only mutants corresponding to one of these genes (CYP75B1), on which we focus here, showed a modified response to phenanthrene. Further genetic, phenotypic and biochemical characterization of CYP75B1 (At5g07990) T-DNA mutants are presented and discussed here.
2. Materials and Methods
2.1. Selection of Homozygote Lines of Arabidopsis T-DNA Insertional CYP Mutants
Arabidopsis thaliana T-DNA insertional mutants were obtained from the SALK, GABI-KAT and SAIL collections (Colombia (Col-0) genetic background), and from the FLAG collection (Wassilewskija (WS) background) (Table S1). Homozygous plants were selected as described by O’Malley et al. [36]. For each mutant, 16 to 20 individual plants were screened. Seed progenies of each mutant were grown on soil in the greenhouse under standard conditions, 16 h of light at 22 °C and 8 h of night at 18 °C, and two-week-old rosette leaves were harvested (3–5 mg) and used for genomic DNA extraction as described by Edwards et al. [37]. Young leaves of the same size were collected in an Eppendorf tube at room temperature without buffer for 15 s, then 400 µL of extracted buffer was added, centrifugated at 13,000 rpm for 1 min. One µL of the supernatant was used for 50 µL of standard PCR reaction. A two-steps genotyping assay was used to identify T-DNA inserts’ homozygous plants from segregating individuals. A first PCR reaction was performed to confirm that the candidate homozygous line contains a T-DNA insert at the predicted chromosomal location. Primers used were designed by SIGnAL (http://signal.salk.edu/tdnaprimers.2.html, accessed on 31 May 2021) to amplify flanking regions of the insertion site (LP + RP; Table S1). A second PCR reaction used a universal specific primer (left border LB primer) that spans the predicted T-DNA insertion site. This PCR reaction selectively amplifies the T-DNA/genomic DNA junction sequence (LB + RP).
2.2. Plant Growth and Chlorophyll Content
Seeds of the appropriate Arabidopsis thaliana line were surface sterilized and sown on Petri dishes containing half-strength Murashige and Skoog [38] medium, supplemented with sugar (either sucrose or mannitol used as osmoticum in controls) [39,40] at 3% (88 mM) for sucrose-mediated tolerance to phenanthrene studies or at 1% for mutant characterization, and either phenanthrene solution or dimethylsulfoxide (DMSO). A 700 mM phenanthrene solution was prepared in DMSO and used to provide the final required concentration in the culture medium. The same amount of DMSO was added in all treatment conditions of each experiment. Petri dishes containing seeds were placed at 4 °C over 48 h in order to break dormancy and to homogenize germination. Plants were grown at 22 °C under a 16 h light period at 110 µmol m−2 s−1. Seedlings were harvested after 8 to 22 days of growth, depending on the experiment.
Seedling fresh weight and chlorophyll content measurements were carried out as described by Shiri et al. [41]. Three biological replicates, ten plants each, were performed per treatment condition. Results represent the mean with the standard error of the mean (SEM). Statistical analyses were conducted using the Wilcoxon test by R-4.3.0 software [42].
2.3. Singlet Oxygen Staining
Three-week-old plantlets grown on control and treatment media were immersed and infiltrated in the dark under vacuum with a solution of 100 µM Singlet Oxygen Sensor Green® reagent (SOSG) (S36002, Invitrogen, Carlsbad, CA, USA) [43] in 50 mM phosphate potassium buffer (pH 7.5). Infiltrated plantlets were then placed again on control and treatment media during 30 min in the light before being photographed under the microscope. Following excitation at 480 nm, the fluorescence emission at 530 nm was then detected by an Olympus BX41 spectrofluorometer (Shinjuku, Japan) coupled with a camera. The presence of red chlorophyll autofluorescence from chloroplasts did not alter the green fluorescence of SOSG. Experiments were repeated three times on at least 10 plantlets.
2.4. Hydrogen Peroxide Staining
The H2O2 staining agent, 3,3′diaminobenzidine (DAB) (D5637, Sigma-Aldrich, St. Louis, MO, USA), was dissolved in H2O and adjusted to pH 3.8 with KOH. The DAB solution was freshly prepared in order to avoid any auto-oxidation [44]. Three-week-old plantlets grown on control and treatment media described in legends were immersed and infiltrated under vacuum with 1.25 mg mL−1 DAB staining solution. Stained plantlets were then bleached in acetic acid-glycerol-ethanol (1/1/3) (v/v/v) solution at 100 °C for 5 min, and then stored in glycerol-ethanol (1/4) (v/v) solution until photographs were taken. H2O2 was visualized as a brown color due to DAB polymerization. Experiments were repeated three times on at least 10 plantlets.
2.5. CYP75B1 Yeast Expression
BamHI and KpnI sites (underlined in primer sequences) were introduced by PCR just upstream of the ATG and downstream of the stop codon of the full-length coding sequences (CDS), respectively, using the primers 5′-CGGGATCCATGGCAACTCTATTTCTCACAATC (sense) and 5′-GGGGTACCTTAACCCGACCCGAGTCC (reverse). The 1542-bp coding sequence (CDS) of CYP75B1 was PCR amplified using Col-0 cDNA and TA-cloned into the pGEM-T Easy vector (Promega, Madison, WI, USA). CDS was subsequently transferred into the pYeDP60 expression vector by restriction/ligation using BamHI and KpnI sites. The Saccharomyces cerevisiae WAT11 strain was transformed with pYedP60 plasmids and selected on minimum SGI medium (20 g L−1 glucose, 7 g L−1 yeast nitrogen base, 1 g L−1 bactocasamino acids and 40 mg L−1 L-tryptophan) as described before [45]. Recombinant protein production and microsome preparation procedures were performed according to Liu et al. [45]. Briefly, 10 mL of SGI liquid culture was used to inoculate 200 mL of YPGE (10 g L−1 yeast extract, 10 g L−1 bactopeptone, 5 g L−1 glucose and 3% ethanol by volume) and, after 30 h growth at 28 °C, recombinant protein production was induced by addition to the medium of 10 mL of 200 g L−1 galactose and incubation for 16 h at 20 °C. For microsome preparation, yeast cells were harvested by centrifugation, washed with TEK buffer (50 mM Tris-HCl pH 7.5, 1 mM EDTA, 100 mM KCl) and resuspended in 2 mL of TES buffer (50 mM Tris-HCl pH 7.5, 1 mM EDTA, 600 mM sorbitol) supplemented with 5 mM 2-mercaptoethanol and 10 g L−1 bovine serum albumin. Cell suspensions were homogenized with 0.5 mm glass beads, cell lysates separated by 20 min centrifugation at 4 °C and 7500× g, and the obtained supernatant filtrated on Miracloth (22–25 µm pore size, Calbiochem, San Diego, CA, USA). Membrane microsomal fractions were then pelleted by centrifugation at 4 °C and 100,000× g, and resuspended in TEG buffer (50 mM Tris-HCl pH 7.5, 0.5 mM EDTA and 30% glycerol by volume) with a Potter-Elvehjem homogenizer (Thermo Fisher Scientific, Waltham, MA, USA). Microsomal membrane preparations containing CYP75B1 recombinant proteins were stored at −20 °C until processing.
2.6. CYP75B1 Enzyme Assays
Naringenin, phenanthrene and 9-phenantrol were obtained from Sigma-Aldrich. Naringenin, phenanthrene and 9-phenantrol metabolization was tested according to Renault et al. [46]. Briefly, standard assay composition (in 100 µL) was as follows: 50 mM KPi buffer (pH 7.4), 500 µM NADPH (omitted in control assay), 200 µM substrate, 5% DMSO (coming from substrate stock solution), 5 pmol CYP75B1 (~5 µL microsomal preparation). Assay mixtures were incubated for 30 min at 28 °C; the enzymatic reactions stopped with 10 µL 50% acetic acid and 40 µL acetonitrile. After centrifugation for 5 min at 13,000× g, the supernatant was recovered and analyzed by reverse-phase HPLC (Alliance 2695, Waters, Milford, MA, USA) with photo-diode array detection (DAD) (Photodiode 2996, Waters) according to Renault et al. [46]. For that purpose, 75 µL of sample was injected onto a KinetexVR core-shell C18 5 µm 4.6 × 150 mm column (Phenomenex, Torrance, CA, USA) maintained at 37 °C. The mobile phase consisted of 0.1% formic acid in water (A) and 0.1% formic acid in acetonitrile (B). Run was performed at a 1 mL min−1 flow rate, starting with a 5–100% B gradient (concave curve 8) for 16 min, and then isocratic conditions using 100% B for 1 min.
3. Results and Discussion
3.1. Phenotypic Characterization of Sucrose-Mediated Tolerance to Phenanthrene
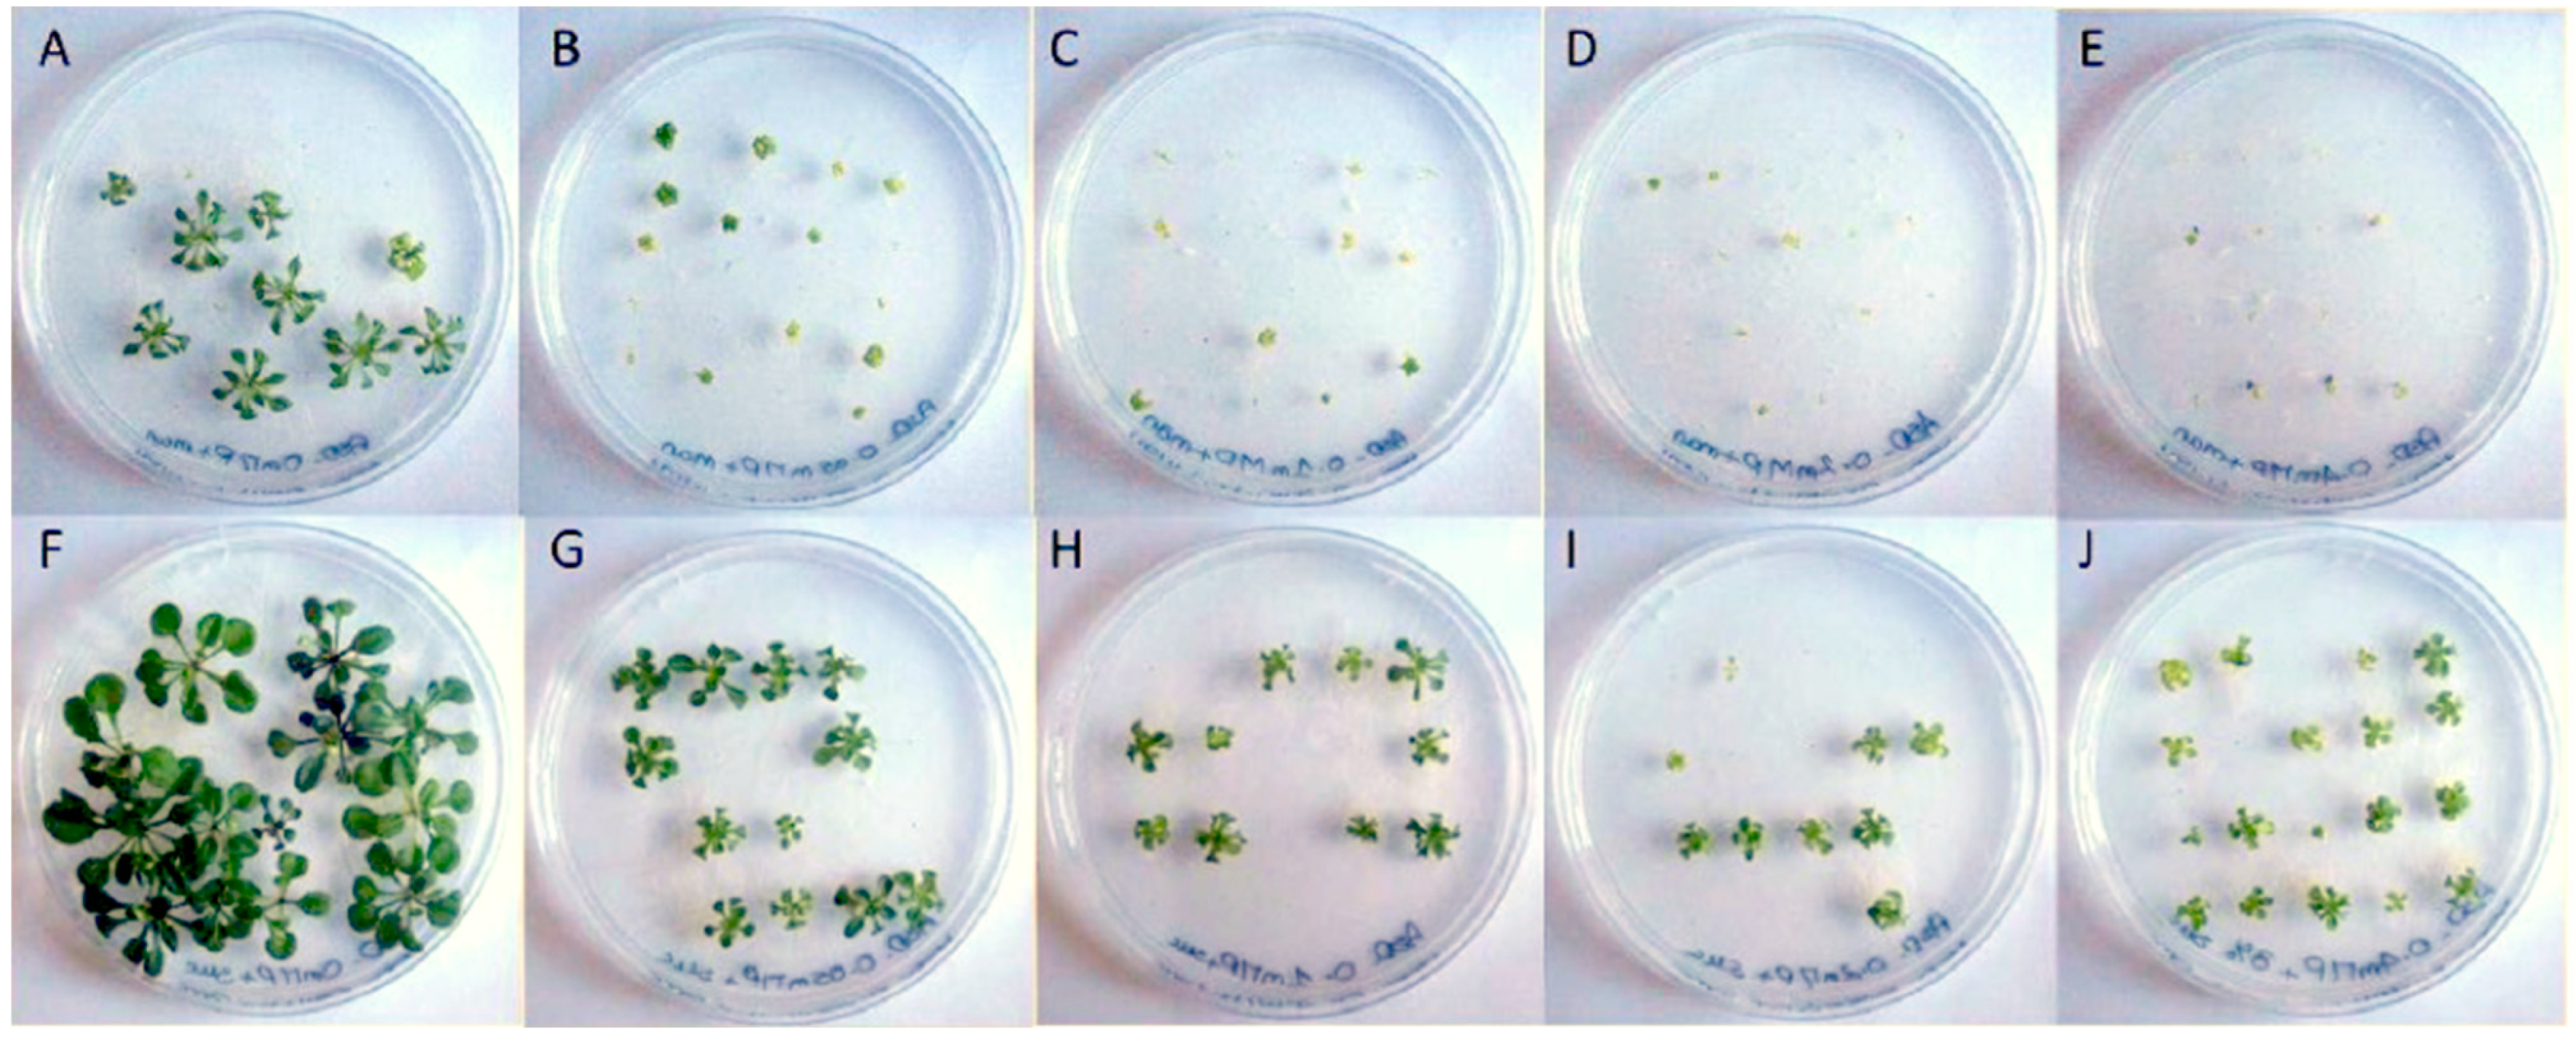
We first analyzed the impact of phenanthrene on A. thaliana growth in the presence or absence of sucrose, and have noted that sucrose alleviates phenanthrene-induced stress. Thus, plants were exposed to different concentrations of phenanthrene (up to 400 µM) in the presence or absence of 3% (88 mM) sucrose. We found that, when phenanthrene was applied, whole seedlings and rosettes were substantially and significantly more developed in seedlings growing in a sucrose-containing medium (Figure 1, Table 1), and this from the lowest phenanthrene concentration at 50 µM. Regardless of phenanthrene concentration, the presence of sucrose in the growing medium avoided plant chlorosis and allowed leaf development (Figure 1). Thus, seedlings exposed to the highest phenanthrene concentration (400 µM) in the presence of sucrose presented a significant increase in chlorophyll content (3.0 times), which remains unchanged compared to untreated plants (153.2 ± 11.3 µg/g FW), and plant fresh weight (2.7 times) compared to seedlings grown on mannitol-supplemented media (Table 1). This capacity of sucrose to induce tolerance to phenanthrene is in good agreement with previous work showing sucrose enhanced tolerance to some organic xenobiotics [47,48].

Figure 1.
Impact of phenanthrene treatment and sucrose-mediated tolerance on A. thaliana rosettes. Phenotypical changes of A. thaliana (Col-0) rosettes under phenanthrene-induced stress with or without sucrose; 22-day-old A. thaliana seedlings were grown on half MS medium. Phenanthrene was supplemented at 0 μM (A,F), 50 μM (B,G), 100 μM (C,H), 200 μM (D,I) and 400 μM (E,J). Control plants (A–E) were grown on non-sucrose medium supplemented with mannitol (88 mM) as an osmoticum, while plants in pictures (F–J) were grown on 3% w/v sucrose-supplemented (88 mM) media.

Table 1.
Impact of phenanthrene treatment and sucrose-mediated tolerance on growth and chlorophylls of A. thaliana seedlings. Fresh weight (mg/seedling) and chlorophyll content (µg/g FW of seedling) of 22-day-old A. thaliana (Col-0) seedlings treated with 400 µM phenanthrene in the presence of 88 mM mannitol (Phe) or of 88 mM sucrose (Phe+Suc) in half MS agar medium. Values correspond to the means ± SEM of three biological replicates (ten plants each). * Indicates a significant difference between Phe- and Phe+Suc-treated plants (i.e., p-value < 0.05).
3.2. Identification of Candidate CYP Genes Affecting Tolerance to Phenanthrene
The superfamily of CYP enzymes is key for xenobiotic metabolism diversity, which depends on the chemical structure of the xenobiotic compound, the organism, environmental conditions, metabolic factors and the regulated expression of these biochemical pathways [49]. Omics approaches have been used to highlight genes coding for common xenobiotic detoxification enzymes and constitute a major strategy for targeting molecular mechanisms involved in organic xenobiotic metabolism and tolerance in plants [32,50]. Previous research works have identified a range of CYP genes differentially expressed (DE) under contrasted phenanthrene-induced stress conditions (Figure S1, Table S2). Thus, we have identified a total of 41 different phenanthrene-regulated CYP genes of which 13 CYP genes were DE by a long-term phenanthrene treatment under a sucrose background (Phe+Suc vs. Such) [35], 21 after a short-term phenanthrene treatment in a sucrose-free medium (Phe vs. Control) [34], and 23 after a short-term phenanthrene treatment under a sucrose background compared to phenanthrene treatment in sucrose-free medium (Phe+Suc vs. Phe) [33].
Treatments sharing more DE CYP genes (nine genes) were Phe vs. Control and Phe+Suc vs. Phe (Figure S1). However, only one gene (CYP89A2) over nine presented the same behavior being inducted by both treatments (Table S2). Among the other eight shared genes, five were inhibited and three inducted in Phe+Suc vs. Phe. On the other hand, Phe vs. Control and Phe+Suc vs. Suc treatments shared five DE CYP genes, with all of them presenting the same behavior under both treatments (Table S2). All that is in good agreement with the fact that under Phe vs. Control and Phe+Suc vs. Suc situations, more stressed plants (Phe and Phe+Suc, respectively) are compared to plants in more optimal conditions (Control and Suc, respectively), whereas in Phe+Suc vs. Phe, plants in tolerance situation (Phe+Suc) are compared to stressed plants (Phe).
Eleven CYP clans are present in vascular plants, the largest ones being clan 71, by far, clan 72 and clan 85 [49]. Among the 41 DE CYPs (Table S1), 29 belong to clan 71 (12 from family CYP71, 4 from family CYP81, 3 from family CYP89, 2 from family CYP76, 2 from family CYP83 and 1 from each of the families CYP73, CYP75, CYP79, CYP98, CYP705 and CYP706), 4 to clan 72 (CYP72A subfamily), 3 to clan 85 (1 from CYP702 family and 2 from CYP708 family), 3 to clan 86 (1 from each CYP86, CYP94 and CYP704 families) and 2 to clan 710 (CYP 710A subfamily). Half of these CYP genes are of completely unknown function. Among known functions, we can find CYPs involved in the metabolism of tryptophan/camalexin, monoterpenes, phytosterols, fatty acids, gibberellins, glucosinolates and phenylpropanoids/flavonoids (Table S2).
3.3. Selection and Phenotyping of Arabidopsis CYP Mutants
In order to perform functional validation of phenanthrene-DE CYPs, we selected homozygous lines and phenotyped 32 T-DNA A. thaliana knockout mutants (Table S1) corresponding to 16 different CYPs among the 41 CYP genes responsive to short- and long-term phenanthrene treatment under either a sucrose or not a sucrose background. CYP selected genes were those for which T-DNA knockout mutants were available and whose expression was highly affected by the different phenanthrene treatments.
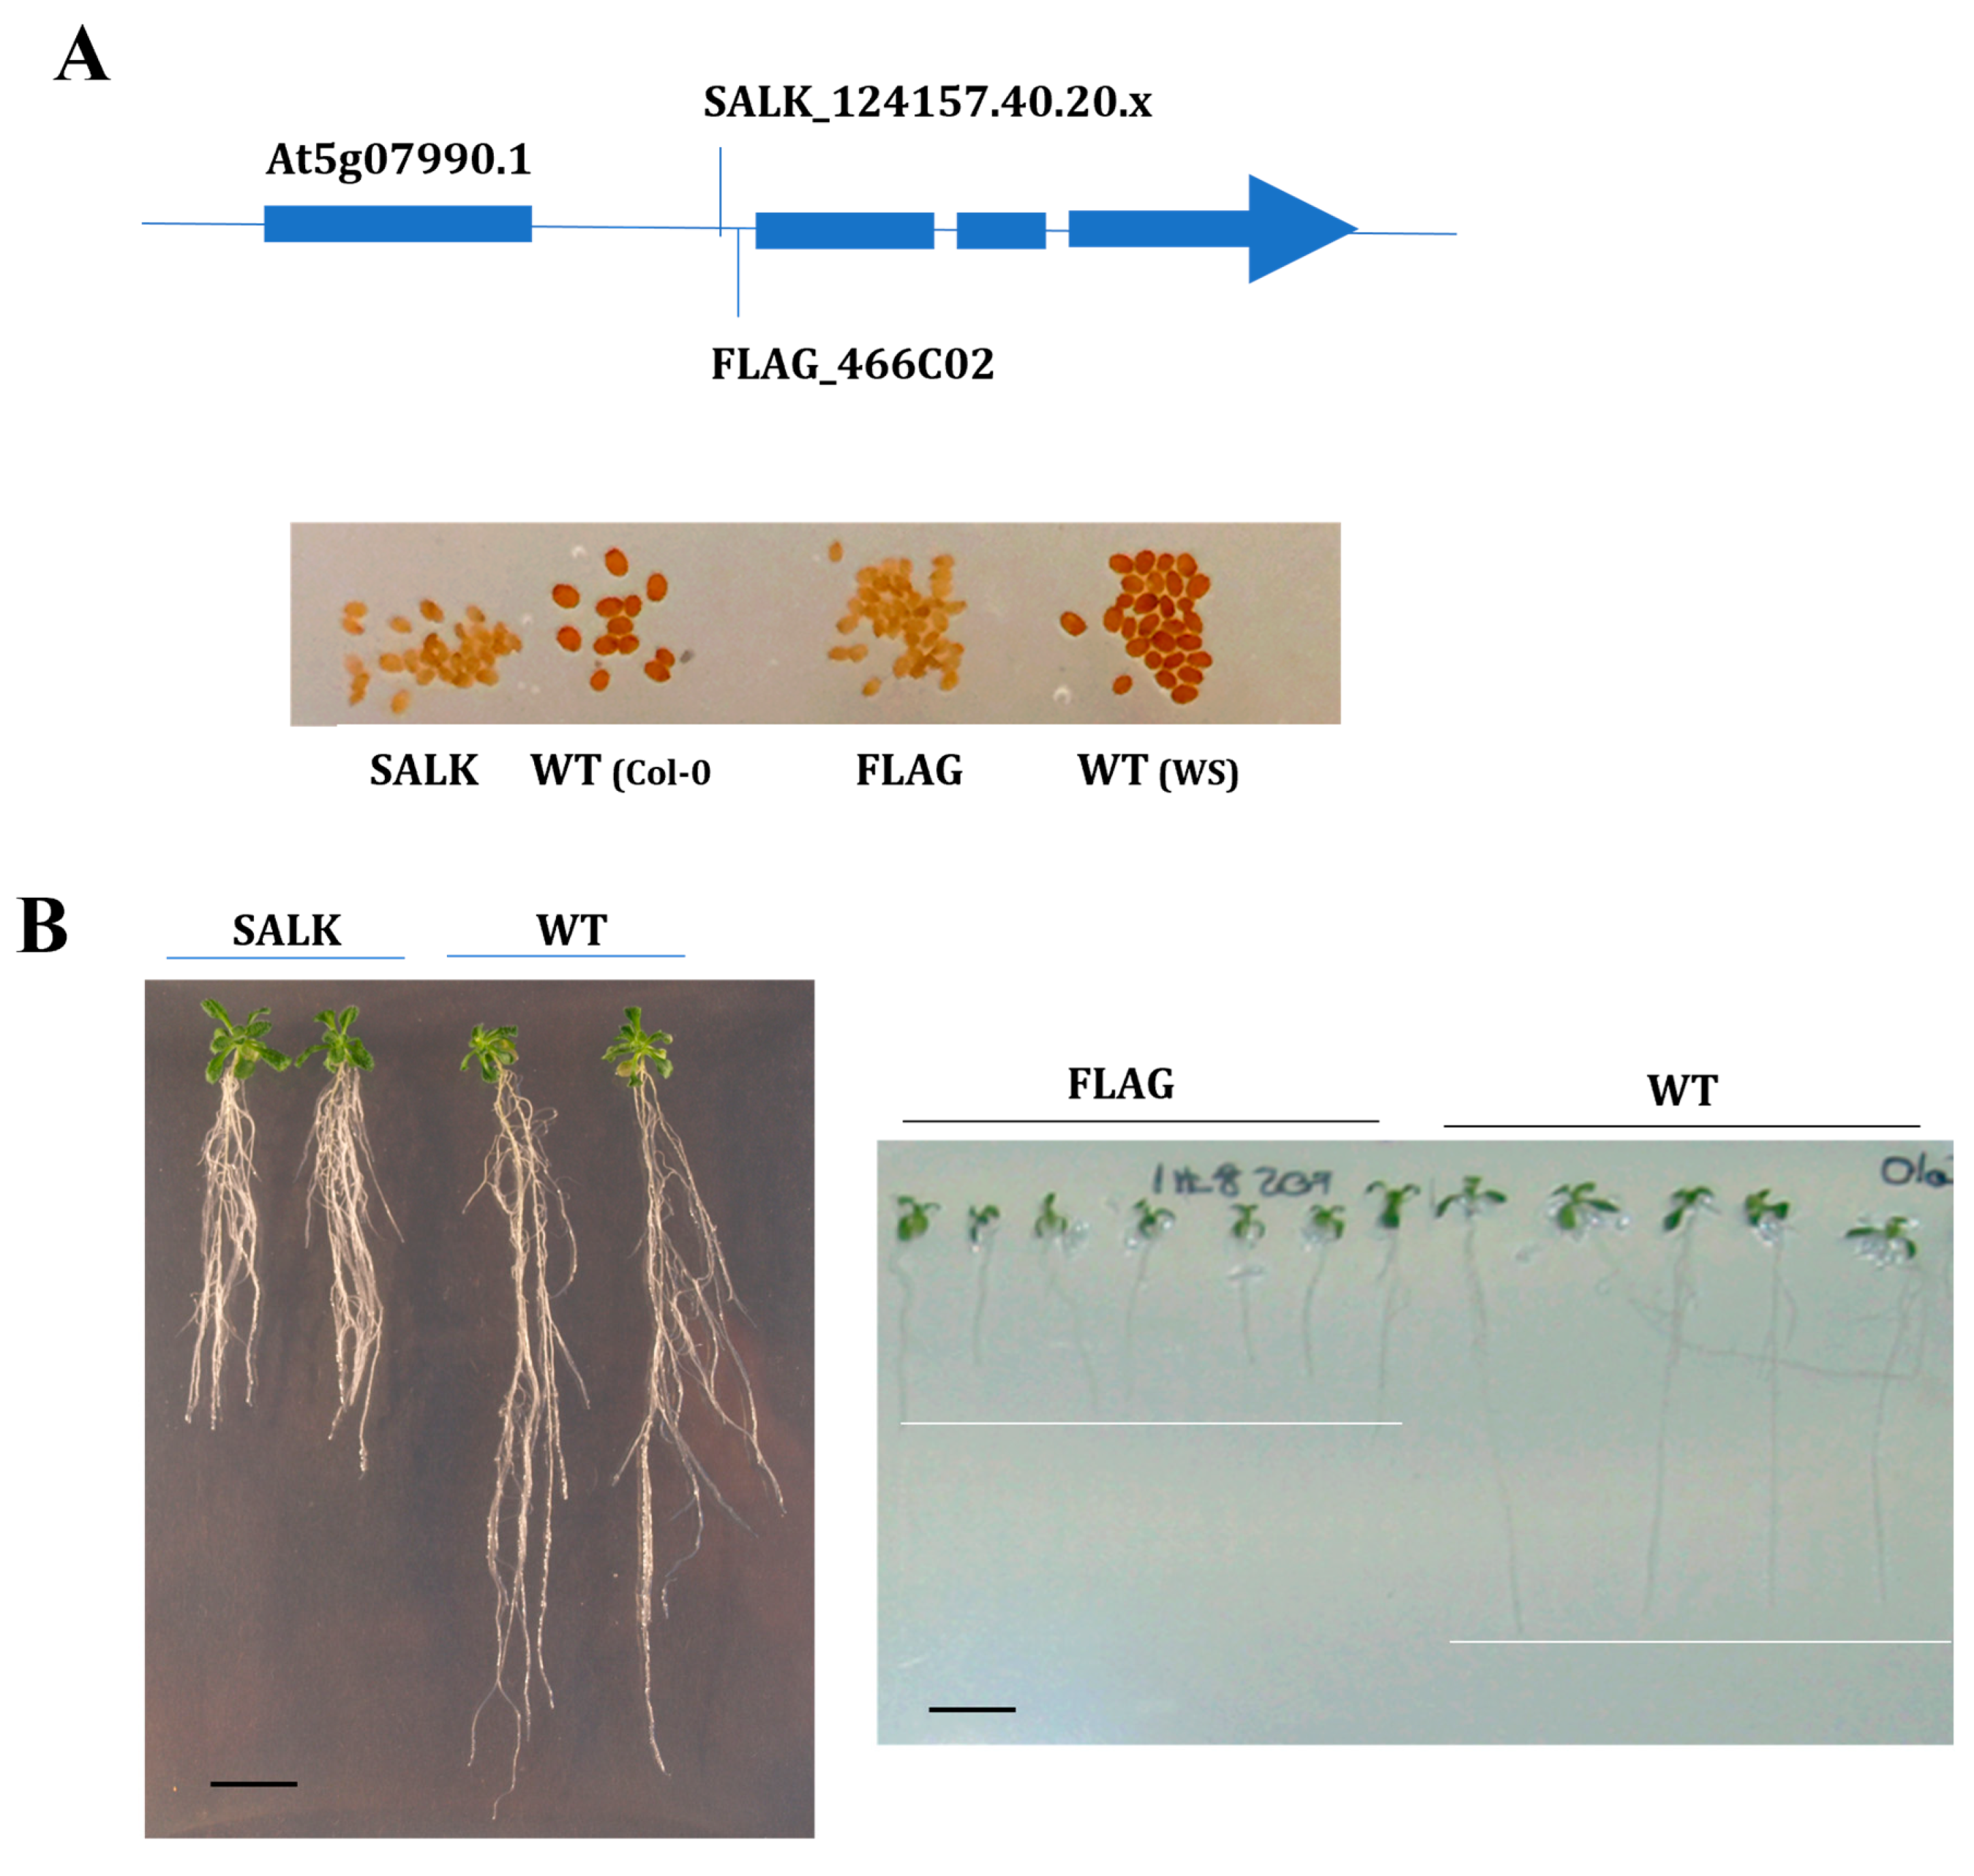
However, among all these mutants, only two of them presented increased sensitivity to phenanthrene-induced stress. Thus, only the two mutants (Figure 2A) corresponding to one of these genes, CYP75B1 (At5g07990), showed a modified response to phenanthrene phenotype presenting a highly reduced growth under 25 µM phenanthrene (Figure 2B). Both mutant seedlings presented similar growth and morphology than the corresponding wild-type seedlings in the absence of phenanthrene stress. CYP75B1 gene expression was only affected by a short-term phenanthrene treatment under a sucrose background compared to phenanthrene treatment in sucrose-free medium, presenting a 3.2-fold increase in expression after 8 h Phe+Suc vs. Phe (Table S2) [33]. Only two other tested CYP genes, CYP83A1 (involved in methionine-derived aliphatic glucosinolate biosynthesis) and CYP708A2 (triterpene thalianol hydroxylase), were also only induced under Phe+Suc vs. Phe (Table S2), but their mutants (Table S1) did not present any modified phenanthrene tolerance phenotype.
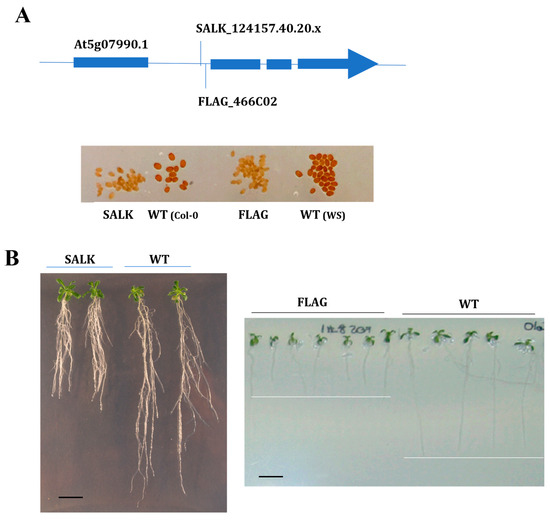
Figure 2.
Functional validation of two alleles of At5g07990 Arabidopsis T-DNA mutants. (A) Homozygous T-DNA insertion mutant lines (SALK_124157.40.20.x and FLAG_466C02) inserted in the first intron of CYP75B1 gene (At5g07990) were selected. Seeds of both mutants show transparent testa (tt) phenotype, while Col-0 (left) and WS (right) show pigmented wild-type phenotype. (B) Phenotypical changes of the mutants SALK_124157.40.20.x and FLAG_466C02 compared to corresponding wild-type (WT) genetic background under phenanthrene-induced (25 µM) stress. Seedlings were grown on agar medium containing 1% sucrose for 5 days, then transferred onto the indicated medium, and 21-day-old and 8-day-old representative SALK_124157.40.20.x and FLAG_466C02 plantlets were shown, respectively. Scale bars = 1 cm.
CYP75B1 codes for a 3′flavonol hydroxylase catalyzing the conversion of naringenin to eriodictyol and of dihydrokaempferol to dihydroquercetin, and is responsible for the A. thaliana tt7 (transparent testa 7) mutation [51]. In addition, it has been recently proposed that CYP75B1 is a mitochondrial CYP that, together with CYP711A1 and CYP90A1, redundantly participates in a mitochondrial ADXR–ADX–P450 (ADRX, adrenodoxin (ADR) reductase) electron transport chain that is essential for maternal gametophytic control of embryogenesis in Arabidopsis [52]. As expected, and in witnessing CYP75B1 dysfunction, seeds of both FLAG and SALK cyp75b1 mutants presented a transparent testa phenotype (yellow/pale-brown seeds) (Figure 2A) derived from the resulting absence of dark-brown flavonoid pigments (i.e., tannins) in the seed coat [53].
3.4. Phenanthrene Metabolization Capacities of CYP75B1
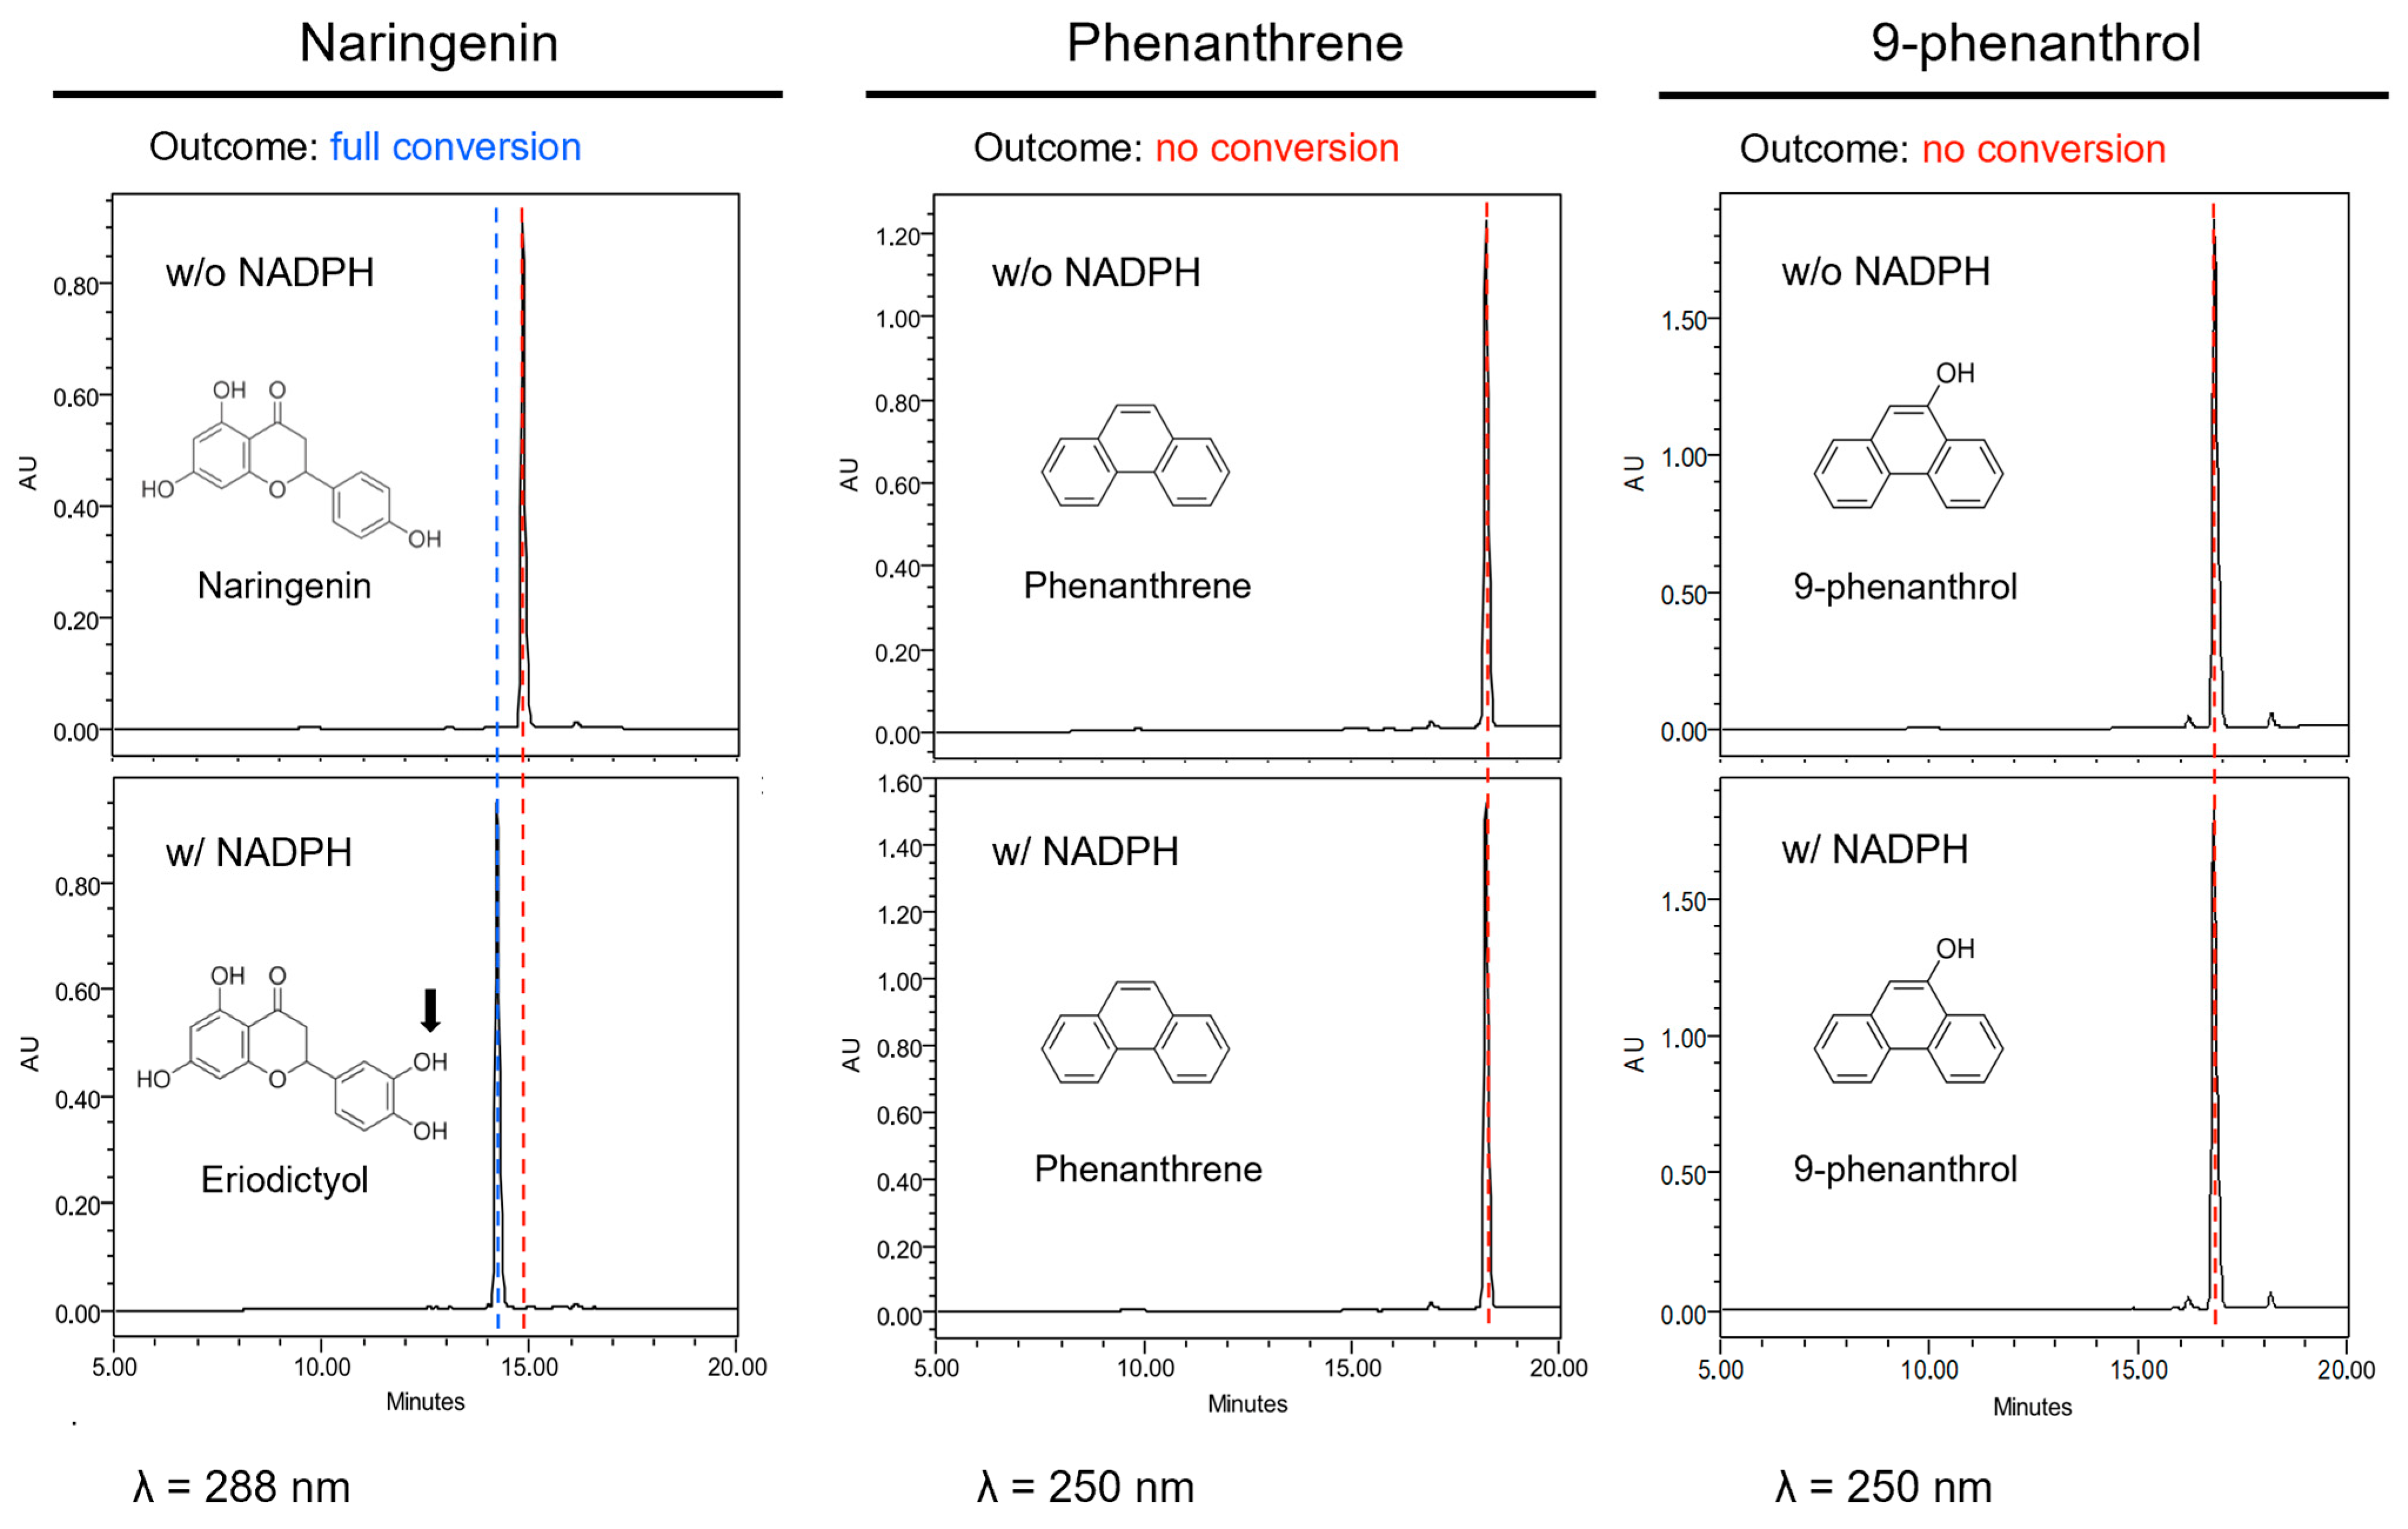
As natural substrates have some similarities to phenanthrene, we first hypothesized that CYP75B1 could metabolize phenanthrene into less toxic derivatives, thus explaining the increased sensitivity to phenanthrene of cyp75b1 mutants. Therefore, microsomes prepared from yeast expressing the CYP75B1 gene were used to assay catalytic activity on phenanthrene and 9-phenanthrol. Naringenin, a physiological substrate of CYP75B1, was tested as control. A rapid conversion into polar metabolites was only obtained with naringenin that was, as expected, converted into eriodyctiol (Figure 3). This conversion required NADPH and was absent when using yeast microsomes from yeast cells transformed with pYedP60 empty vector. Nevertheless, phenanthrene and 9-phenanthrenol were not metabolized by CYP75B1 (Figure 3). To our knowledge, at the gene level, phenanthrene-metabolizing capacities in plants have only been reported for Arabidopsis At5g05600, a putative flavone synthase belonging to the dioxygenase family [54]. In this case, Hernández-Vega et al. [54] reported a toxic accumulation of phenanthrene derivatives resulting from At5g05600 action.
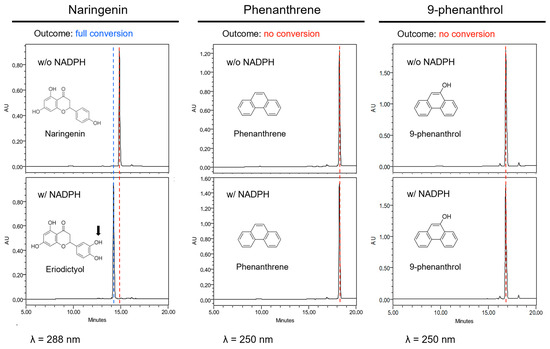
Figure 3.
CYP75B1 metabolization assays. From left to right columns, HPLC-DAD analyses of reaction mixtures after incubation of naringenin, phenanthrene or 9-phenanthrol with a microsomal fraction from yeast cells (Saccharomyces cerevisiae WAT11 strain) expressing CYP75B1 gene in the presence (lower graphics) or absence (upper graphics) of NADPH. Red dashed line, substrate; blue dashed line, product. No product was formed in any case in the absence of NADPH or with microsomes from yeast cells transformed with pYedP60 empty vector.
3.5. The CYP75B1 Gene Mutant Is Affected in Oxidative Stress Response
As the functional analysis of the CYP75B1 gene does not show metabolization of phenanthrene or 9-phenanthrenol, and phenanthrene has shown to provoke oxidative stress in plants and antioxidant mechanisms have been described as an important part of the tolerance response to phenanthrene [55,56,57], we have explored reactive oxygen species (ROS) production in cyp75b1 mutants in response to phenanthrene.
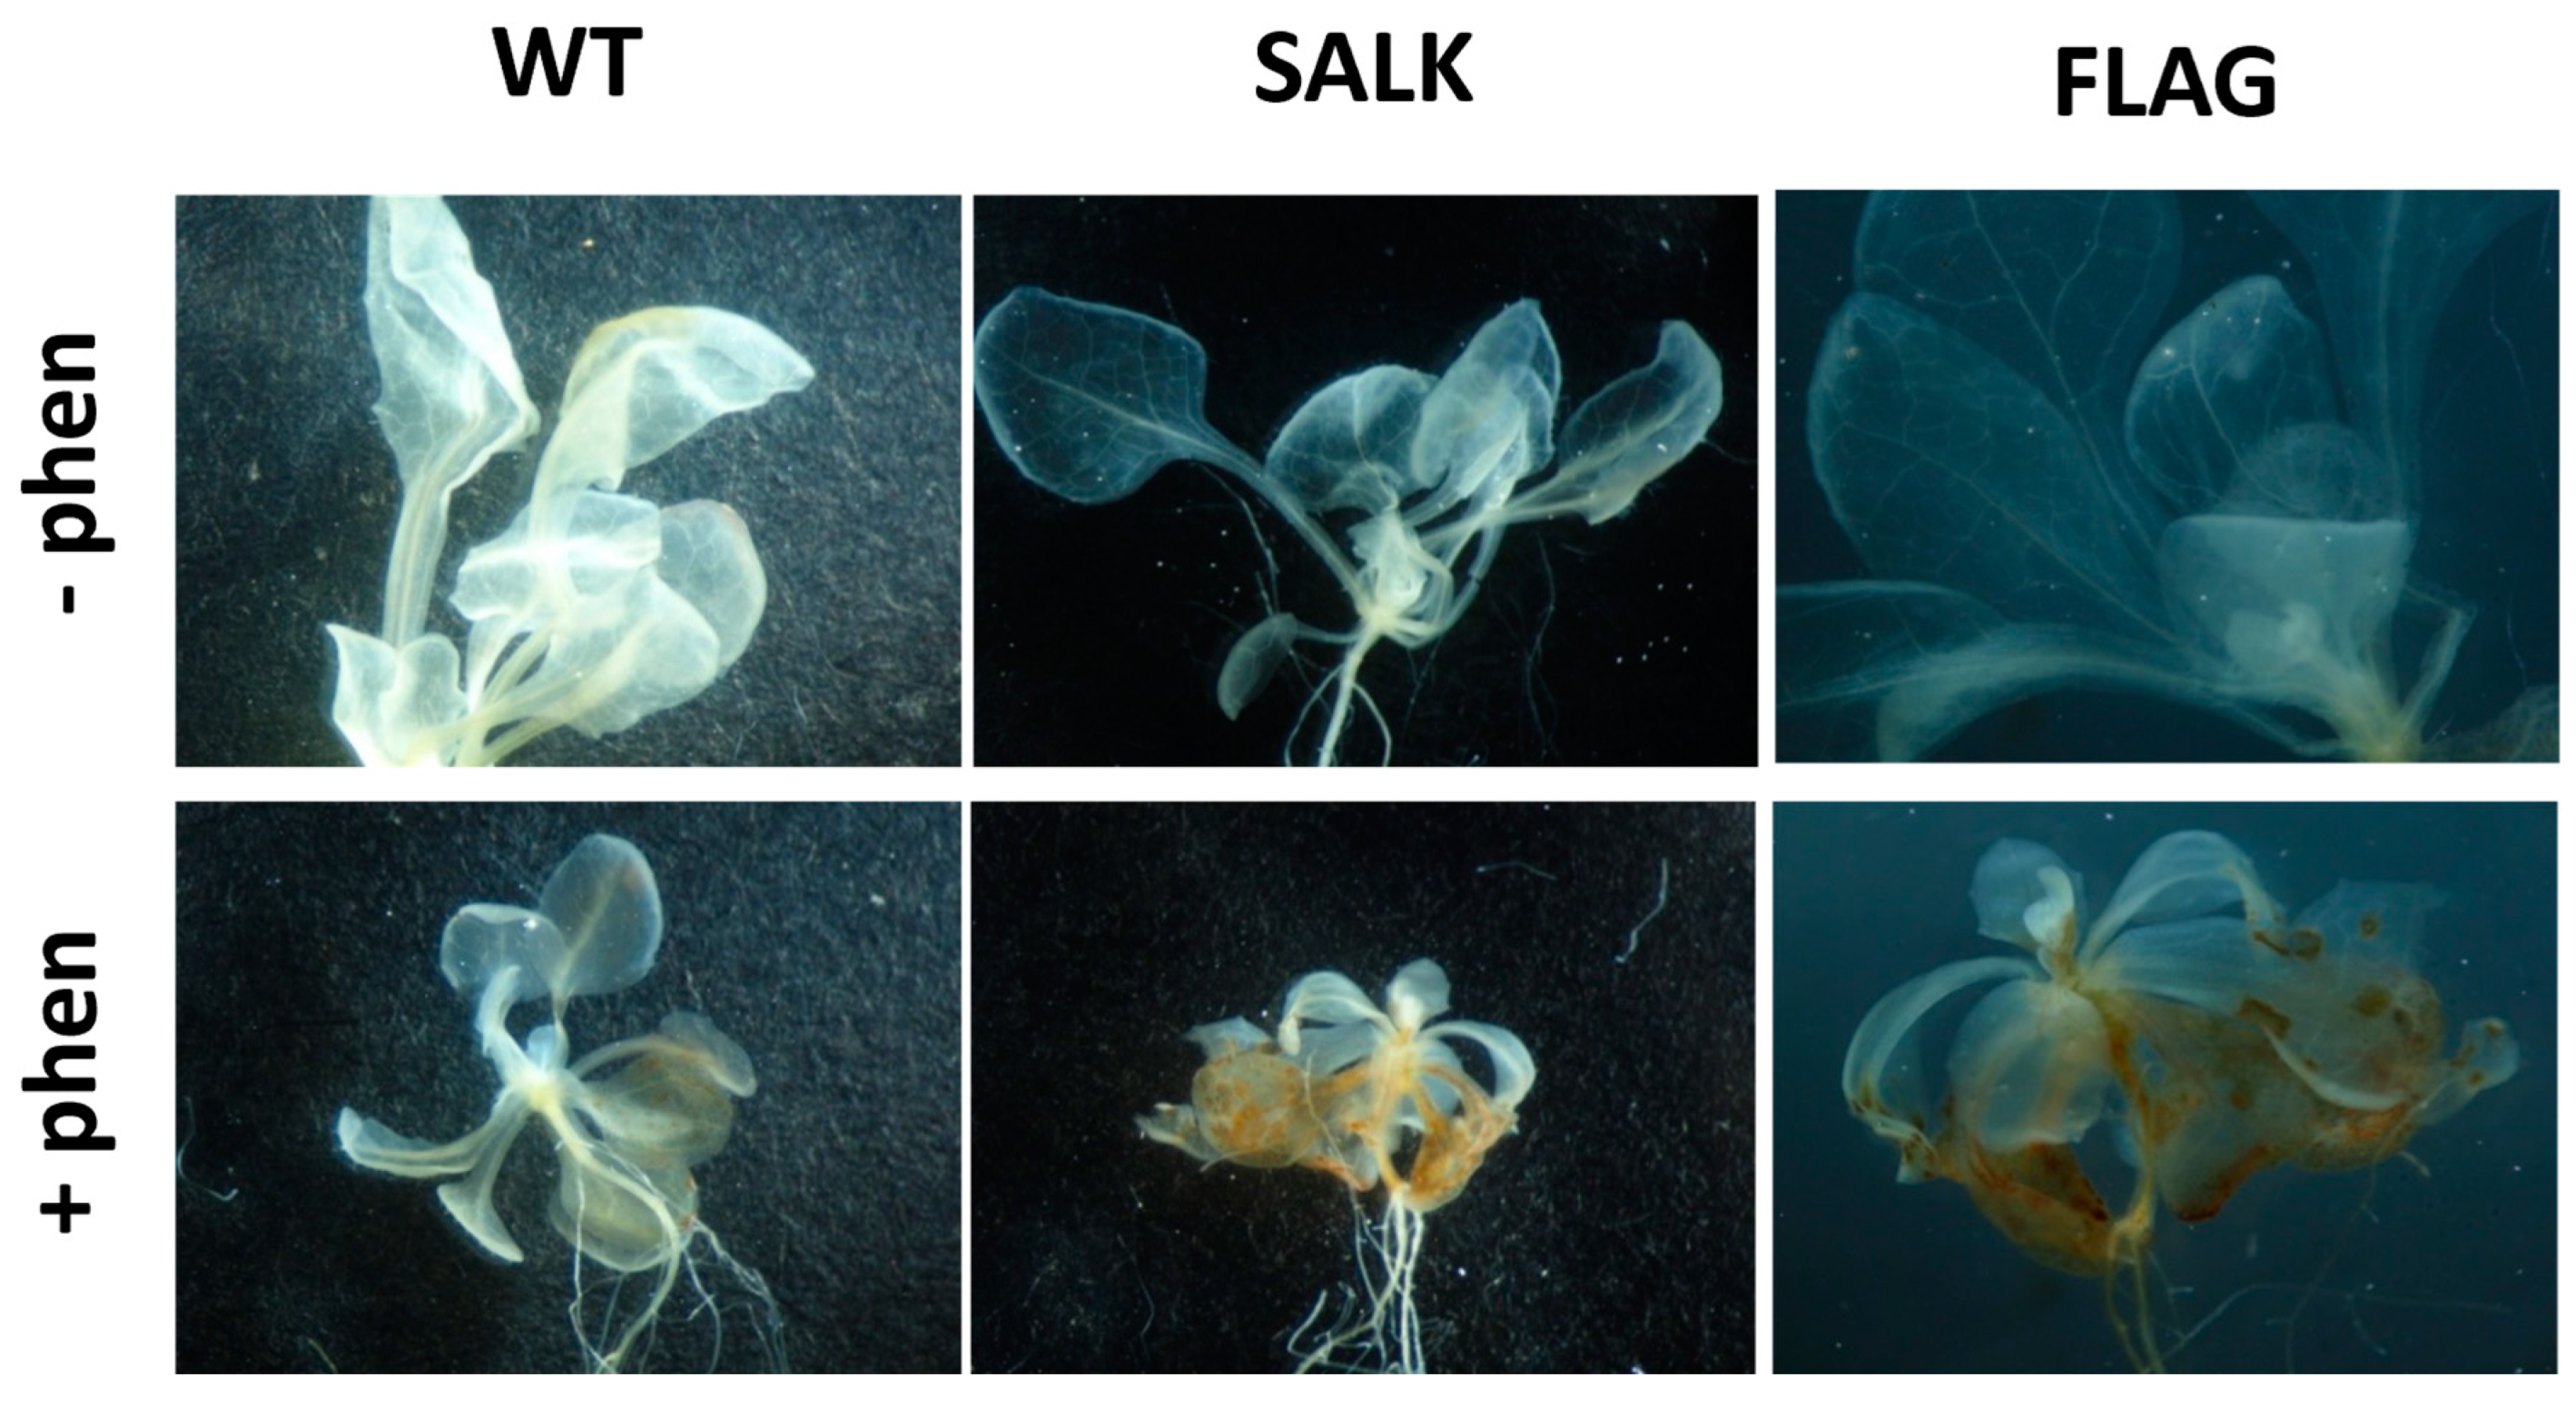
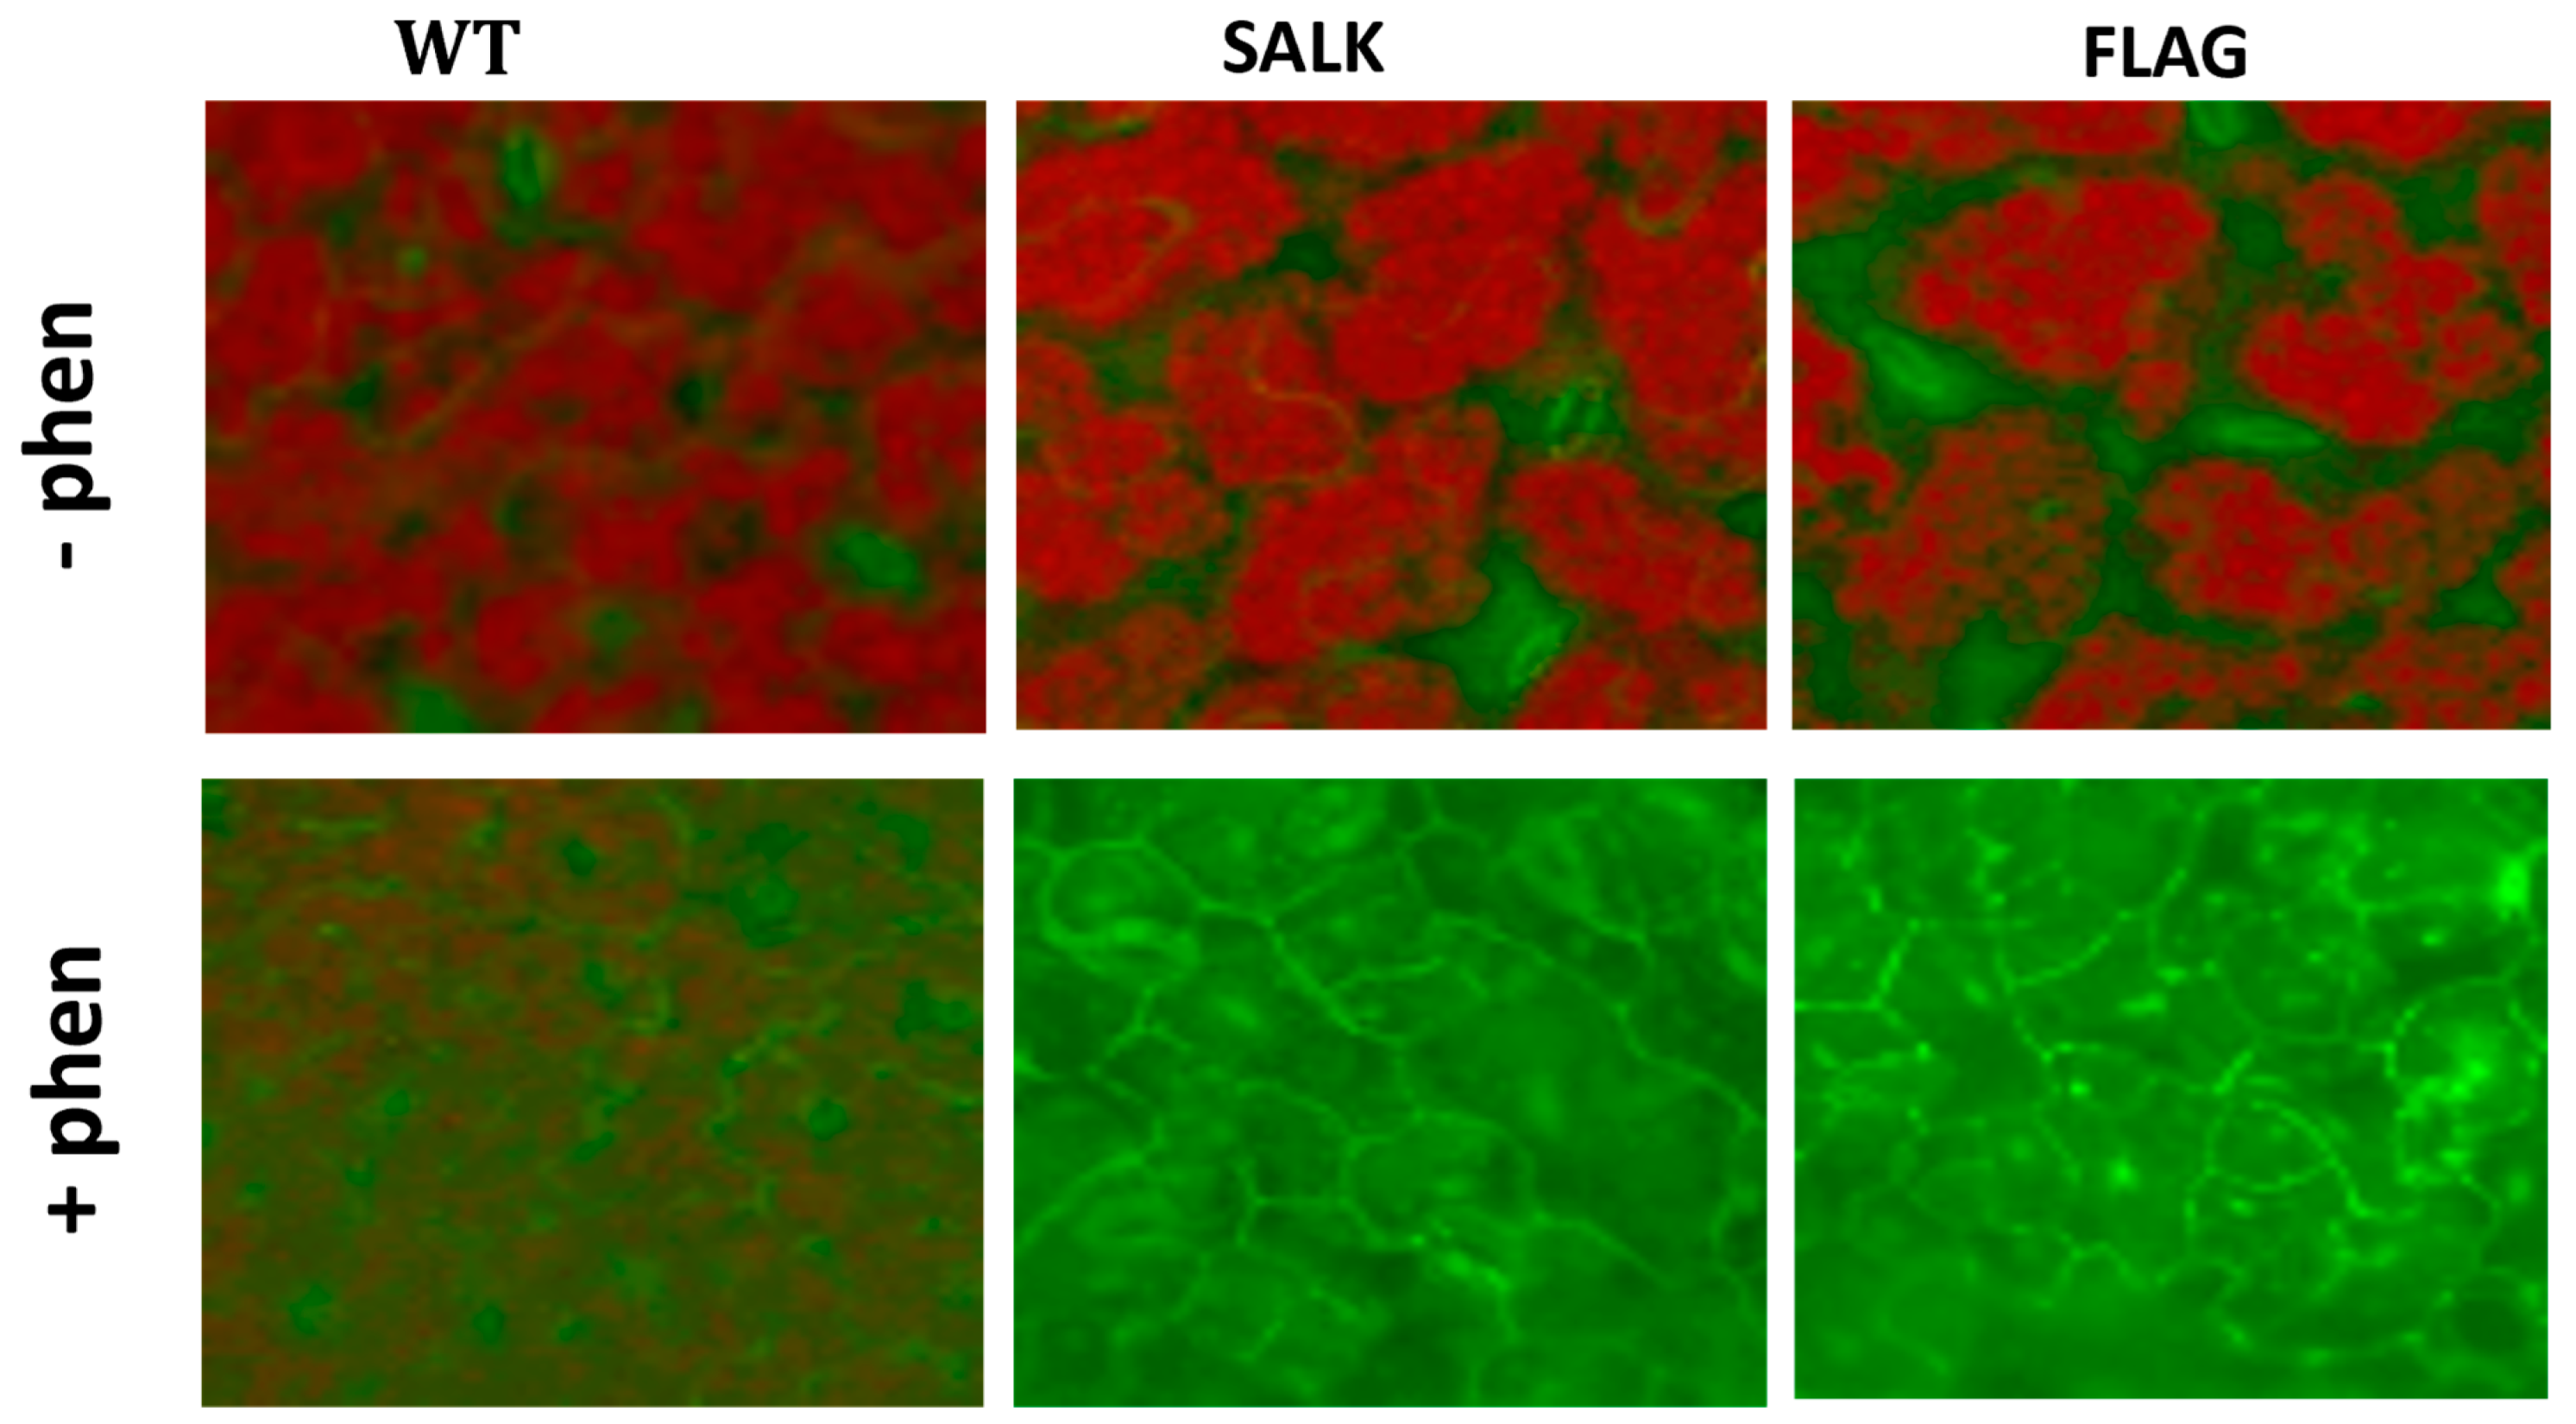
ROS detections have been carried out on 3-week-old wild-type and cyp75b1 A. thaliana plantlets exposed or not to 50 µM phenanthrene. After treatment, the release of H2O2 was visualized by optical microscopy as a dark brown pigment that forms in plant tissues after reaction with DAB (Figure 4). An increase in H2O2 release in both wild-type and cyp75b1 plants after phenanthrene treatment was observed (Figure 4). However, H2O2 levels are clearly higher in phenanthrene-stressed cyp75b1 mutants compared to wild-type. On the other hand, singlet oxygen (1O2) in plant tissues was monitored using the SOSG fluorescent probe. Again, as observed for H2O2, even if phenanthrene treatment resulted in 1O2 production in wild-type plants, the generation of 1O2 was particularly increased in phenanthrene-stressed cyp75b1 mutants (Figure 5). Thus, associated with reduced plant growth, phenanthrene treatment leads to an exacerbated increase in cellular generation and release of H2O2 and singlet oxygen in cyp75b1 mutants, verifying the known increase in oxidative stress caused by phenanthrene as the result of the generation of ROS [35,57,58,59].

Figure 4.
Visualization of hydrogen peroxide detected by 3,3-diaminobenzidine (DAB) staining. Detections have been carried out on 3-week-old Arabidopsis thaliana plantlets grown in half MS (1% sucrose) containing (+phen) or not (−phen) 50 µM phenanthrene. SALK and FLAG state for the mutant lines SALK_124157.40.20.x and FLAG_466C02, respectively, and WT for the corresponding Col-0 and WS wild-type for SALK and FLAG, respectively. Experiments were repeated three times with at least 10 plants and representative results are shown.
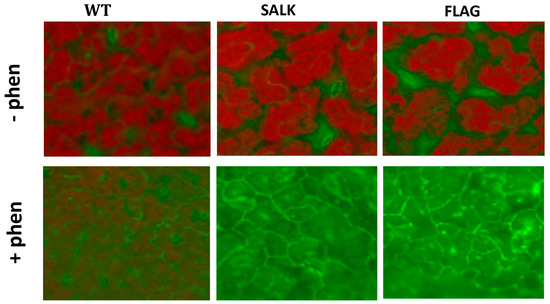
Figure 5.
Visualization of singlet oxygen detected with the SOSG fluorescent probe. Detections have been carried out on 3-week-old Arabidopsis thaliana plantlets grown in half MS (1% sucrose) containing (+phen) or not (−phen) 50 µM phenanthrene. The fluorescence of SOSG corresponds to the green coloration, while the red color corresponds to chlorophyll autofluorescence. SALK and FLAG state for the mutant lines SALK_124157.40.20.x and FLAG_466C02, respectively, and WT for the corresponding Col-0 and WS wild-type for SALK and FLAG, respectively Experiments were repeated three times with at least 10 plants and representative micrographs of individual plantlets are shown.
In view of these results, we propose that enhanced sensitivity of cyp75b1 mutants to phenanthrene-induced stress is related to oxidative stress susceptibility. A wide spectrum of evidence points to anthocyanins as being involved in stress tolerance [60,61]. Sucrose-induced tolerance to phenanthrene could then result from sucrose up-regulation of anthocyanin biosynthetic structural genes and subsequent anthocyanin accumulation [62]. The increased ROS level in cyp75b1 mutants could thus be explained by the absence of antioxidant 3′hydroxylated flavonoids resulting directly or indirectly from a CYP75B1 enzymatic reaction in planta. Precisely, the blockade in the 3′ hydroxylation step in tt7 mutants, which are mutated in the CYP75B1 gene, leads to the synthesis of pelargonidin and kaempferol instead of 3′hydroxylated cyanidin and quercetin [53,63]. In the sense of a reduced antioxidant capacity derived from altered flavonoids in cyp75b1 mutants, it has been shown that quercetin and derivatives (dihydroxy B-ring-substituted flavonoids, i.e., presenting the catechol group in the B-ring), considered “effective antioxidants”, are by far better antioxidants than kaempferol and derivatives (monohydroxy B-ring flavonoids), which are considered “poor antioxidants”. Thus, quercetin and its derivatives are among the most powerful ROS scavengers within flavonoids, effective against stress-generated H2O2 and 1O2, for example, but also against the production of ROS by the Fenton reaction [64,65]. Furthermore, the catechol group confers on them a greater ability to modulate a stress-induced redistribution of growth [66,67].
3.6. Phenanthrene Sensitivity of A. thaliana Mutants Impaired in 3′-Hydroxylated Flavonoid Production
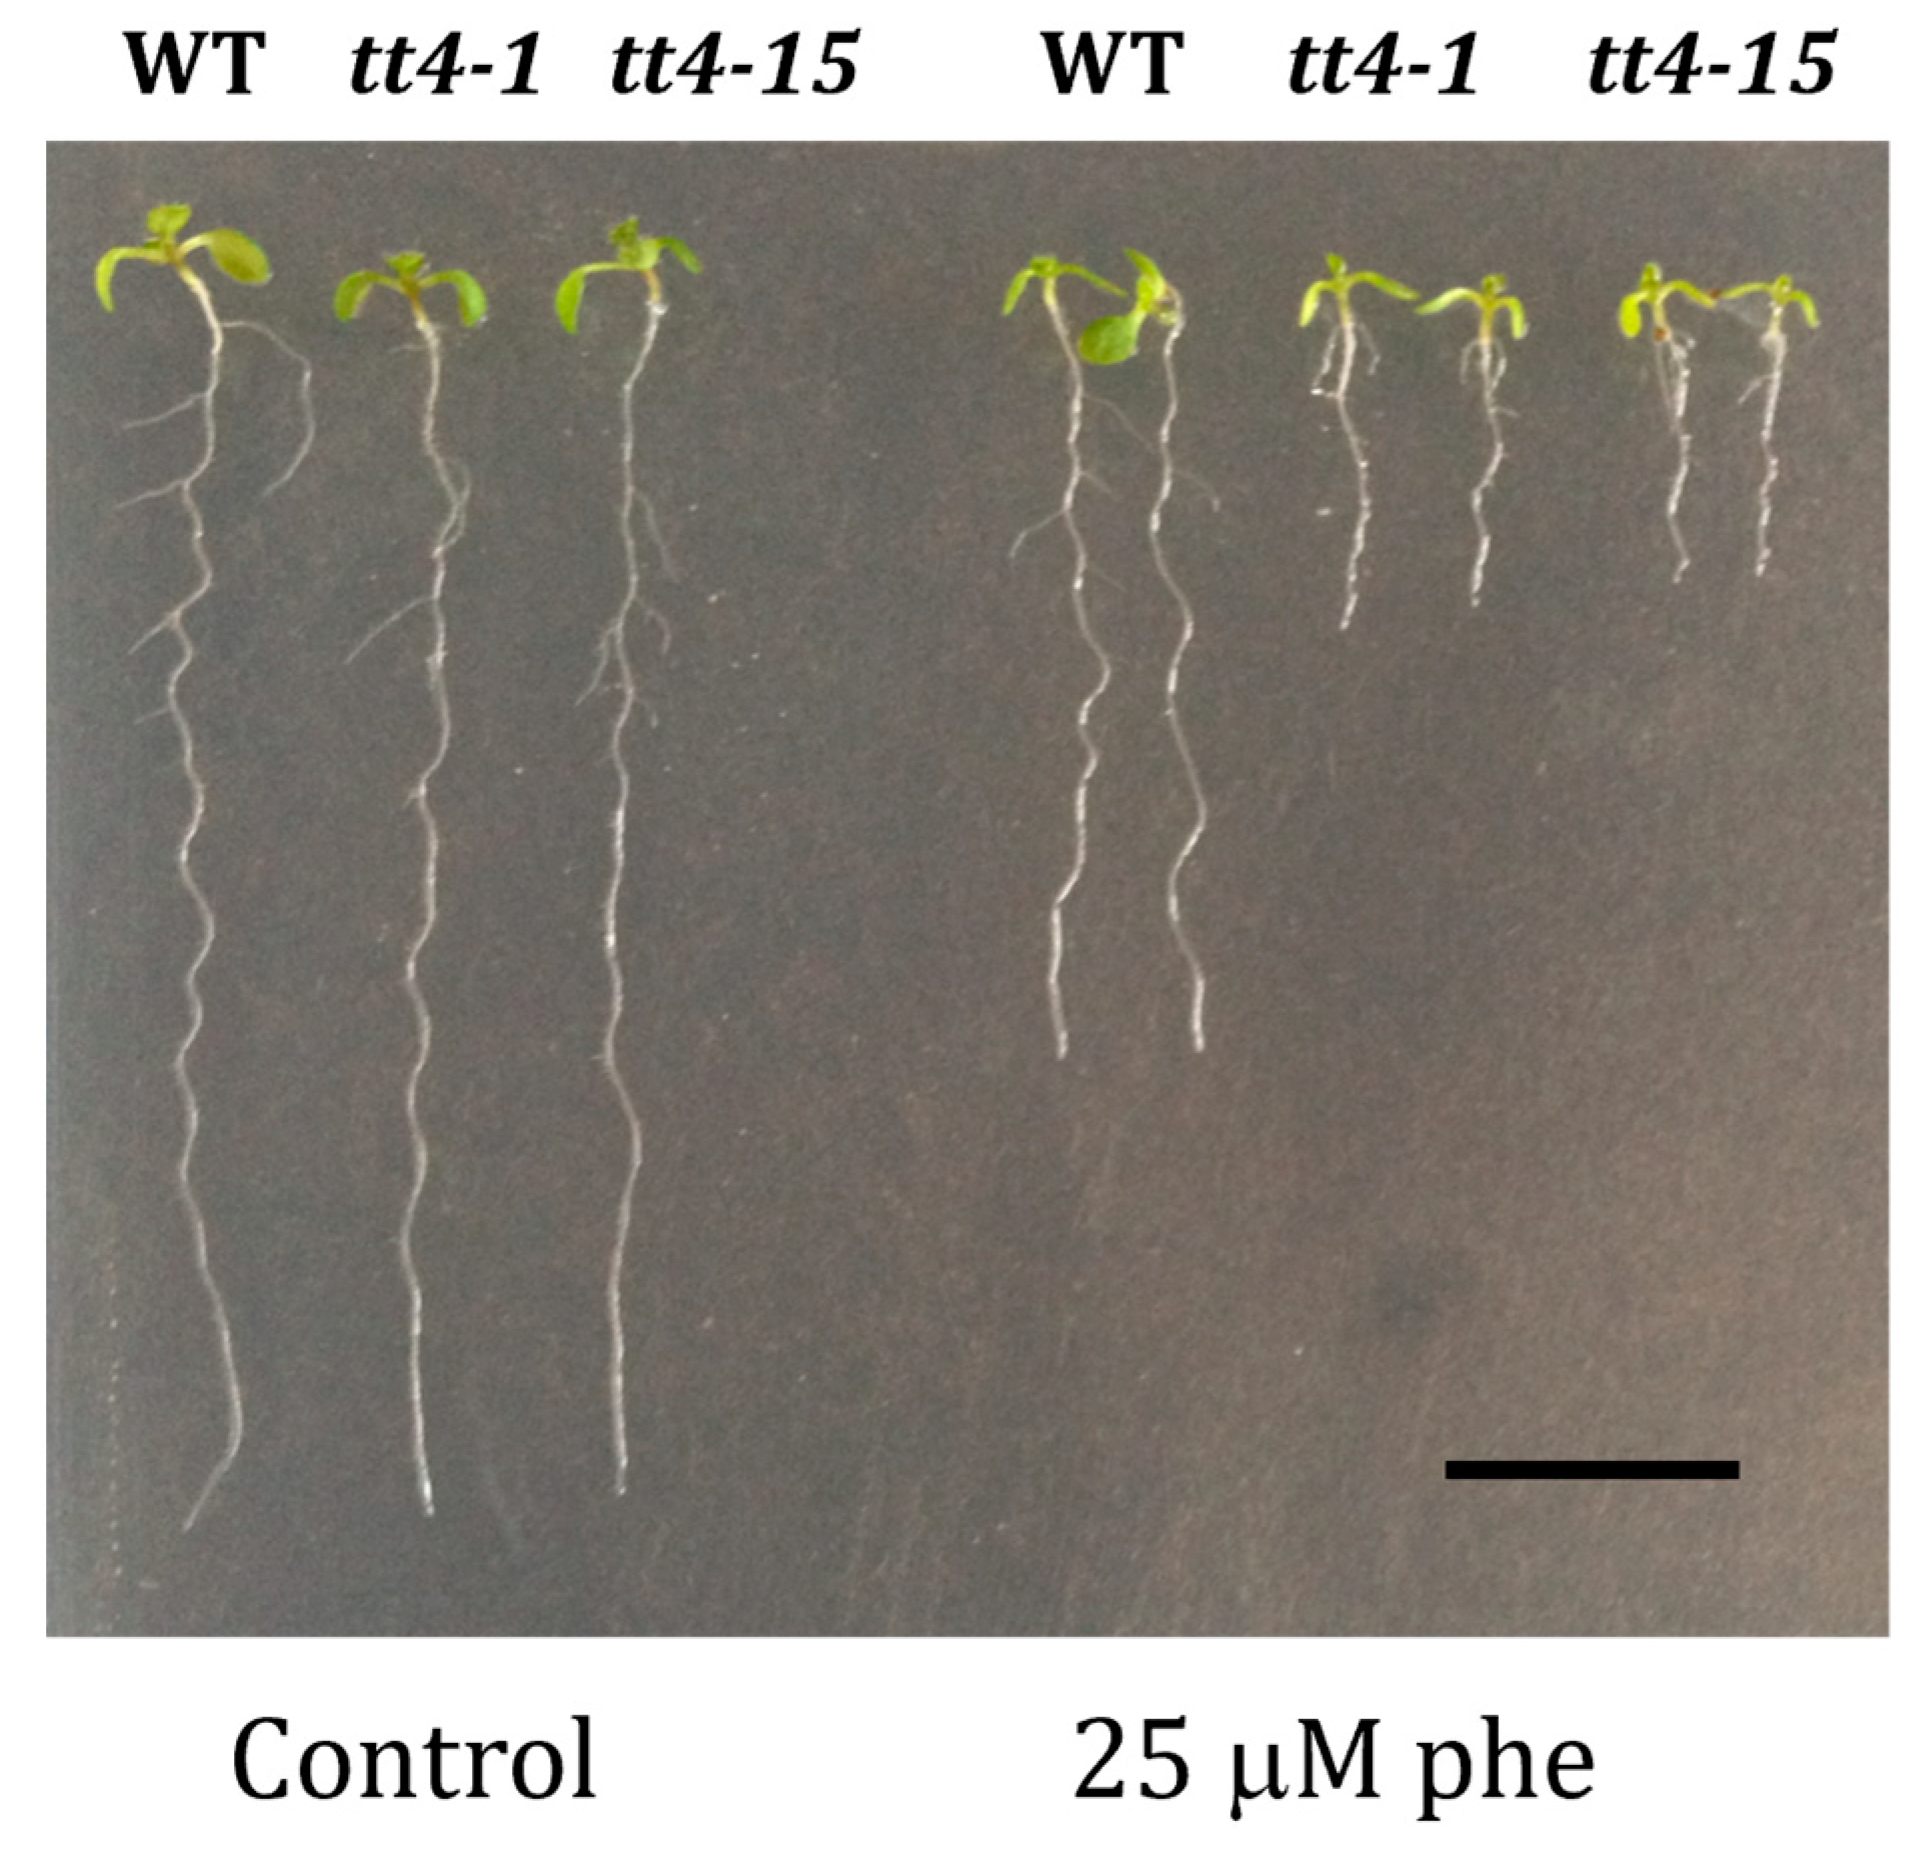
In order to check whether the increased sensitivity to phenanthrene of cyp75b1 mutants was shared by other mutants affected in 3′-hydroxylated flavonoid production, we investigated the response to phenanthrene of tt4 mutants (two alleles, tt4-1 and tt4-15), which are affected in chalcone synthase (At5g13930). These tt4 mutants accumulate no flavonoids and are thus, together with tt7 mutants, the only other mutants of the proanthocyanidin pathway that do not produce quercetin [53]. Consistently with this fact and the tt7 growth phenotype in response to phenanthrene, tt4 mutants also showed impaired growth under phenanthrene treatment (Figure 6).
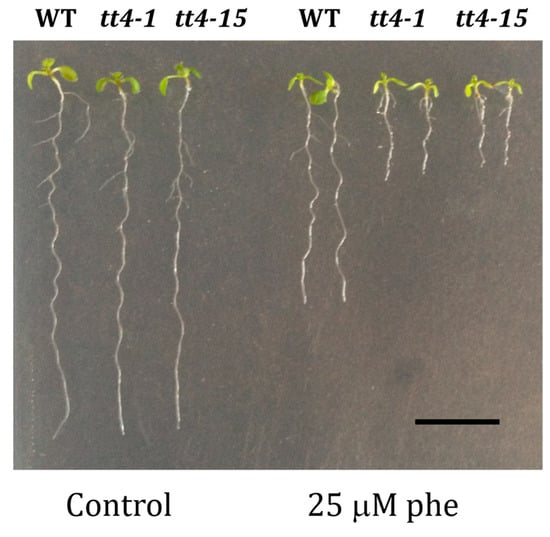
Figure 6.
Functional validation of two alleles of the tt4 T-DNA mutants. Homozygous T-DNA insertion mutant lines (tt4-1 and tt4-15). Phenotypical changes of the mutants tt4-1 and tt4-15 compared to corresponding wild-type (WT) Ler genetic background, respectively, under control (0 µM phe) and phenanthrene-induced stress (25 µM phe) were performed. Seeds were grown on agar MS medium containing 1% sucrose for 5 days, then transferred onto MS medium containing or not the indicated phenanthrene concentration; 10-day-old representative tt4-1 and tt4-15 plantlets are shown. Scale bars = 1 cm.
In good agreement with our results, Bashandy et al. [68] described that the reduced flavonoid content conferred by tt4 mutation provoked the reduction in tolerance to UV (UV-C) light, and Chapman and Muday [69] showed that the fluorescence level of a general ROS sensor (2′,7′-dichlorodihydro-fluorescein diacetate (CM H2DCF-DA) was elevated in flavonol mutants (tt4 and tt7) and reduced by antioxidants (ascorbic acid). However, Chapman and Muday [69] found reduced superoxide radical (O2•-) accumulation within lateral root primordia of tt7-2 compared with wild-type, but not in the tt4 mutant, consistent with the opposite effects of these mutants on lateral root emergence (increased lateral root emergence in tt4 and reduced numbers of lateral roots in tt7-2). In addition, antioxidant treatment reduces the lateral root number and ROS levels in tt4. These results support a model in which the increased level of kaempferol in the lateral root primordia of tt7-2 reduces superoxide concentration and ROS-stimulated lateral root emergence, pointing to different antioxidant properties of 3′-hydroxylated or not 3′-hydroxylated flavonoids with different effects depending on organ and/or developmental stage.
4. Conclusions
Phenanthrene is a PAH molecule that negatively impacts plant growth and chlorophyll content of A. thaliana plants, and enhances in planta ROS production (H2O2 and 1O2). These impacts are counterbalanced by sucrose treatment, which stimulates phenanthrene tolerance through its action as a signaling molecule inducting an array of tolerance mechanisms such as antioxidant and detoxification pathways, notably including cytochrome P450s.
Here, for the first time, we have shown that CYP75B1 does not metabolize phenanthrene but its associated endogenous metabolic capacity to produce 3′-hydroxylated flavonoids (quercetin and derivatives) enhances plant growth and ROS scavenging, alleviating oxidative stress generated by phenanthrene. Accordingly, CYP75B1 and derived flavonoids could be exploited to protect plants from the oxidative damage generated by PAHs and to potentially enhance phytoremediation capacities.
Supplementary Materials
The following supporting information can be downloaded at: https://www.mdpi.com/article/10.3390/plants13121692/s1, Figure S1: Venn diagrams of differentially expressed CYPs under contrasted phenanthrene treatments. CYP genes differentially expressed under (A) a long-term (30 d) phenanthrene treatment under a sucrose background [35], (B) a short-term (up to 24 h) phenanthrene treatment in a sucrose-free medium [34] and (C) a short-term (up to 8 h) sucrose treatment under a phenanthrene background [33]; Table S1: List of Arabidopsis thaliana T-DNA insertional mutants from the SALK, GABI-KAT and SAIL collections (Col-0 genetic background) and from the FLAG collection (Wassilewskija background), and of primers used for mutant tests by PCR; Table S2: List of differentially expressed CYP genes in phenanthrene-stressed plants. Retained CYP genes were differentially expressed in short- [33] or long-term [35] protective conditions (‘phenanthrene + sucrose’ vs. ‘phenanthrene’) or phenanthrene-induced stress condition (‘phenanthrene’ vs. ‘control’) [34]. In blue, CYP genes retained for mutant analyses. log2 FC: Fold change (positive for up-regulation and negative for down-regulation).
Author Contributions
F.C.-H.: Conceptualization, Data curation, Formal analysis, Visualization, Writing—original draft, Writing—review and editing. A.E.A.: Conceptualization, Data curation, Funding acquisition, Investigation, Methodology, Visualization, Writing—original draft. All authors have read and agreed to the published version of the manuscript.
Funding
This work was funded by the Axson BS-Coatings firm (http://www.bs-coatings.com/) and the French government through the Agence Nationale de la Recherche (CIFRE no. 1017/2009).
Data Availability Statement
Data are contained within the article and Supplementary Materials.
Acknowledgments
The authors would like to warmly thank Hugues Renault for his advice and discussion, and Anne-Sophie Dumas for plant growth.
Conflicts of Interest
The authors declare that they have no known competing financial interests or personal relationships that could have appeared to influence the work reported in this paper.
References
- Lawal, A.T. Polycyclic aromatic hydrocarbons. A review. Cogent Environ. Sci. 2017, 3, 1339841. [Google Scholar] [CrossRef]
- Guo, Y.; Wu, K.S.; Huo, X.; Xu, X. Sources, distribution, and toxicity of polycyclic aromatic hydrocarbons. J. Environ. Health 2011, 73, 22–25. [Google Scholar]
- Keith, L.H. The source of U.S. EPA’s sixteen PAH priority pollutants. Polycyc. Aromat. Compd. 2015, 35, 147–160. [Google Scholar] [CrossRef]
- Manzetti, S. Polycyclic aromatic hydrocarbons in the environment: Environmental fate and transformation. Polycyc. Aromat. Compd. 2013, 33, 311–330. [Google Scholar] [CrossRef]
- Jacob, J. The significance of polycyclic aromatic hdyrocarbons as environmental carcinogens. 35 years research on PAH—A perspective. Polycyc. Aromat. Compd. 2008, 28, 242–272. [Google Scholar] [CrossRef]
- Bar-On, Y.M.; Phillips, R.; Milo, R. The biomass distribution on Earth. Proc. Natl. Acad. Sci. USA 2018, 115, 6506–6511. [Google Scholar] [CrossRef]
- Chibwe, L.; Geier, M.C.; Nakamura, J.; Tanguay, R.L.; Aitken, M.D.; Simonich, S.L.M. Aerobic Bioremediation of PAH Contaminated Soil Results in Increased Genotoxicity and Developmental Toxicity. Environ. Sci. Technol. 2015, 49, 13889–13898. [Google Scholar] [CrossRef]
- Xue, W.; Warshawsky, D. Metabolic activation of polycyclic and heterocyclic aromatic hydrocarbons and DNA damage: A review. Toxicol. Appl. Pharmacol. 2005, 206, 73–93. [Google Scholar] [CrossRef]
- Gworek, B.; Klimczak, K.; Kijeńska, M.; Gozdowski, D. Comparison of PAHs uptake by selected Monocotyledones and Dicotyledones from municipal and industrial sewage sludge. Environ. Sci. Pollut. Res. 2016, 23, 19461–19470. [Google Scholar] [CrossRef]
- Tian, L.; Yin, S.; Ma, Y.; Kang, H.; Zhang, X.; Tan, H.; Meng, H.; Liu, C. Impact factor assessment of the uptake and accumulation of polycyclic aromatic hydrocarbons by plant leaves: Morphological characteristics have the greatest impact. Sci. Total Environ. 2019, 652, 1149–1155. [Google Scholar] [CrossRef]
- Sandermann, H. Higher plant metabolism of xenobiotics: The “green liver” concept. Pharmacogenetics 1994, 4, 225–241. [Google Scholar] [CrossRef]
- Barone, R.; de Biasi, M.-G.; Piccialli, V.; de Napoli, L.; Oliviero, G.; Borbone, N.; Piccialli, G. Degradation of some representative polycyclic aromatic hydrocarbons by the water-soluble protein extracts from Zea mays L. cv PR32-B10. Chemosphere 2016, 160, 258–265. [Google Scholar] [CrossRef]
- Liu, R.; Dai, Y.; Sun, L. Effect of rhizosphere enzymes on phytoremediation in PAH-contaminated soil using five plant species. PLoS ONE 2015, 10, e0120369. [Google Scholar] [CrossRef]
- Powles, S.B.; Yu, Q. Evolution in Action: Plants Resistant to Herbicides. Annu. Rev. Plant Biol. 2010, 61, 317–347. [Google Scholar] [CrossRef]
- Reed, L.; Arlt, V.M.; Phillips, D.H. The role of cytochrome P450 enzymes in carcinogen activation and detoxication: An in vivo–in vitro paradox. Carcinogenesis 2018, 39, 851–859. [Google Scholar] [CrossRef]
- Siminszky, B. Plant cytochrome P450-mediated herbicide metabolism. Phytochem. Rev. 2006, 5, 445–458. [Google Scholar] [CrossRef]
- Chiapella, C.; Ysern, P.; Riera, J.; Llagostera, M. A plant metabolic activation system from Persea americana with cytochrome P450-dependent and peroxidase activities. Mutat. Res. 1995, 329, 11–18. [Google Scholar] [CrossRef]
- Chroma, L.; Mackova, M.; Kucerova, P.; in der Wiesche, C.; Burkhard, J.; Macek, T. Enzymes in Plant Metabolism of PCBs and PAHs. Acta Biotechnol. 2002, 22, 35–41. [Google Scholar] [CrossRef]
- Higashi, K.; Nakashima, K.; Karasaki, Y.; Fukunaga, M.; Mizuguchi, Y. Activation of benzo(a)pyrene by microsomes of higher plant tissues and their mutagenesis. Biochem. Int. 1981, 2, 373–380. [Google Scholar]
- Higashi, K. Metabolic activation of environmental chemicals by microsomal enzymes of higher plants. Mutagen. Res. 1988, 197, 273–288. [Google Scholar] [CrossRef]
- Marabini, L.; Radice, S.; Cipelletti, B.; Chiesara, E. Different amounts of cytochrome P-450 dependent monooxygenases in tulip bulbs, pea seedlings and maize endosperm cells. Plant Sci. 1994, 99, 135–140. [Google Scholar] [CrossRef]
- Trenck, T.; Sandermann, H. Oxygenation of benzo[a]pyrene by plant microsomal fractions. FEBS Lett. 1980, 119, 227–231. [Google Scholar] [CrossRef]
- Anttila, S.; Raunio, H.; Hakkola, J. Cytochrome P450-mediated pulmonary metabolism of carcinogens. Amer. J. Respir. Cell Mol. Biol. 2011, 44, 583–590. [Google Scholar] [CrossRef]
- Arellano-Aguilar, O.; Montoya, R.M.; Garcia, C.M. Endogenous functions and expression of cytochrome P450 enzymes in teleost fish: A review. Rev. Fish. Sci. 2009, 17, 541–556. [Google Scholar] [CrossRef]
- Syed, K.; Doddapaneni, H.; Subramanian, V.; Lam, Y.W.; Yadav, J.S. Genome-to-function characterization of novel fungal P450 monooxygenases oxidizing polycyclic aromatic hydrocarbons (PAHs). Biochem. Biophys. Res. Commun. 2010, 399, 492–497. [Google Scholar] [CrossRef]
- Chauhan, A.; Fazlurrahman Oakeshott, J.G.; Jain, R.K. Bacterial metabolism of polycyclic aromatic hydrocarbons: Strategies for bioremediation. Indian J. Microbiol. 2008, 48, 95–113. [Google Scholar] [CrossRef]
- Nelson, D.; Werck-Reichhart, D. A P450-centric view of plant evolution. Plant J. 2011, 66, 194–211. [Google Scholar] [CrossRef]
- Nelson, D.R. Progress in tracing the evolutionary paths of cytochrome P450. Biochim. Biophys. Acta Proteins Proteom. 2011, 1814, 14–18. [Google Scholar] [CrossRef]
- Cabello-Hurtado, F.; Durst, F.; Jorrín, J.V.; Werck-Reichhart, D. Coumarins in helianthus tuberosus: Characterization, induced accumulation and biosynthesis. Phytochemistry 1998, 49, 1029–1036. [Google Scholar] [CrossRef]
- Robineau, T.; Batard, Y.; Nedelkina, S.; Cabello-Hurtado, F.; LeRet, M.; Sorokine, O.; Didierjean, L.; Werck-Reichhart, D. The chemically inducible plant cytochrome P450 CYP76B1 actively metabolises phenylureas and other xenobiotics. Plant Physiol. 1998, 118, 1049–1056. [Google Scholar] [CrossRef]
- Yamada, T.; Kambara, Y.; Imaishi, H.; Ohkawa, H. Molecular cloning of novel cytochrome P450 species induced by chemical treatments in cultured tobacco cells. Pestic. Biochem. Physiol. 2000, 68, 11–25. [Google Scholar] [CrossRef]
- El Amrani, A.; Dumas, A.-S.; Wick, L.Y.; Yergeau, E.; Berthomé, R. “Omics” insights into PAH degradation toward improved green remediation biotechnologies. Environ. Sci. Technol. 2015, 49, 11281–11291. [Google Scholar] [CrossRef]
- Berthomé, R.; Dumas, A.-S.; Jardé, E.; Ryzhenko, N.; Barbas, E.; El Amrani, A. Wide genome transcription and metabolome profiles reprogrammed by sucrose under xenobiotic constraints. bioRxiv 2022. [Google Scholar] [CrossRef]
- Dumas, A.-S.; Taconnat, L.; Barbas, E.; Rigaill, G.; Catrice, O.; Bernard, D.; Benamar, A.; Macherel, D.; El Amrani, A.; Berthomé, R. Unraveling the early molecular and physiological mechanisms involved in response to phenanthrene exposure. BMC Genom. 2016, 17, 818. [Google Scholar] [CrossRef]
- Weisman, D.; Alkio, M.; Colón-Carmona, A. Transcriptional responses to polycyclic aromatic hydrocarbon-induced stress in Arabidopsis thaliana reveal the involvement of hormone and defense signaling pathways. BMC Plant Biol. 2010, 10, 59. [Google Scholar] [CrossRef]
- O’Malley, R.C.; Barragan, C.C.; Ecker, J.R. A user’s guide to the Arabidopsis T-DNA insertion mutant collections. Methods Mol. Biol. 2015, 1284, 323–342. [Google Scholar] [CrossRef]
- Edwards, K.; Johnstone, C.; Thompson, C. A simple and rapid method for the preparation of plant genomic DNA for PCR analysis. Nucl. Acid Res. 1991, 19, 1349. [Google Scholar] [CrossRef]
- Murashige, T.; Skoog, F. A revised medium for rapid growth and bio assays with tobacco tissue cultures. Physiol. Plant. 1962, 15, 473–497. [Google Scholar] [CrossRef]
- Borsani, O.; Valpuesta, V.; Botella, M.A. Evidence for a role of salicylic acid in the oxidative damage generated by NaCl and osmotic stress in Arabidopsis seedlings. Plant Physiol. 2001, 126, 1024–1030. [Google Scholar] [CrossRef]
- Sulmon, C.; Gouesbet, G.; El Amrani, A.; Couée, I. Sugar-induced tolerance to the herbicide atrazine in Arabidopsis seedlings involves activation of oxidative and xenobiotic stress responses. Plant Cell Rep. 2006, 25, 489–498. [Google Scholar] [CrossRef]
- Shiri, M.; Rabhi, M.; El Amrani, A.; Abdelly, C. The halophyte cakile maritima reduces phenanthrene phytotoxicity. Int. J. Phytoremediat. 2015, 17, 925–928. [Google Scholar] [CrossRef]
- R Core Team. R: A Language and Environment for Statistical Computing; R Foundation for Statistical Computing: Vienna, Austria, 2018; Available online: https://www.R-project.org (accessed on 8 May 2023).
- Flors, C.; Fryer, M.J.; Waring, J.; Reeder, B.; Bechtold, U.; Mullineaux, P.M.; Nonell, S.; Wilson, M.T.; Baker, N.R. Imaging the production of singlet oxygen in vivo using a new fluorescent sensor, Singlet Oxygen Sensor Green®. J. Exp. Bot. 2006, 57, 1725–1734. [Google Scholar] [CrossRef]
- Fryer, M.J.; Oxborough, K.; Mullineaux, P.M.; Baker, N.R. Imaging of photo-oxidative stress responses in leaves. J. Exp. Bot. 2002, 53, 1249–1254. [Google Scholar] [CrossRef]
- Liu, Z.; Tavares, R.; Forsythe, E.S.; André, F.; Lugan, R.; Jonasson, G.; Boutet-Mercey, S.; Tohge, T.; Beilstein, M.A.; Werck-Reichhart, D.; et al. Evolutionary interplay between sister cytochrome P450 genes shapes plasticity in plant metabolism. Nat. Commun. 2016, 7, 13026. [Google Scholar] [CrossRef]
- Renault, H.; De Marothy, M.; Jonasson, G.; Lara, P.; Nelson, D.R.; Nilsson, I.; André, F.; von Heijne, G.; Werck-Reichhart, D. Gene duplication leads to altered membrane topology of a cytochrome P450 enzyme in seed plants. Mol. Biol. Evol. 2017, 34, 2041–2056. [Google Scholar] [CrossRef]
- Gullner, G.; Gyulai, G.; Bittsánszky, A.; Kiss, J.; Heszky, L.; Kőmíves, T. Enhanced inducibility of glutathione S-transferase activity by paraquat in poplar leaf discs in the presence of sucrose. Phyton-Ann. Rei Bot. A 2005, 45, 39–44. [Google Scholar]
- Ramel, F.; Sulmon, C.; Cabello-Hurtado, F.; Taconnat, L.; Martin-Magniette, M.-L.; Renou, J.-P.; El Amrani, A.; Couée, I.; Gouesbet, G. Genome-wide interacting effects of sucrose and herbicide-mediated stress in Arabidopsis thaliana: Novel insights into atrazine toxicity and sucrose-induced tolerance. BMC Genom. 2007, 8, 450. [Google Scholar] [CrossRef]
- Hansen, C.C.; Nelson, D.R.; Møller, B.L.; Werck-Reichhart, D. Plant cytochrome P450 plasticity and evolution. Mol. Plant 2021, 14, 1244–1265. [Google Scholar] [CrossRef]
- Widdup, E.E.; Chatfield-Reed, K.; Henry, D.; Chua, G.; Samuel, M.A.; Muench, D.G. Identification of detoxification pathways in plants that are regulated in response to treatment with organic compounds isolated from oil sands process-affected water. Chemosphere 2015, 139, 47–53. [Google Scholar] [CrossRef]
- Schoenbohm, C.; Martens, S.; Eder, C.; Forkmann, G.; Weisshaar, B. Identification of the Arabidopsis thaliana flavonoid 3′-hydroxylase gene and functional expression of the encoded P450 enzyme. Biol. Chem. 2000, 381, 749–753. [Google Scholar] [CrossRef]
- Bellido, A.M.; Distéfano, A.M.; Setzes, N.; Cascallares, M.M.; Oklestkova, J.; Novak, O.; Ramirez, J.A.; Zabaleta, E.J.; Fiol, D.F.; Pagnussat, G.C. A mitochondrial ADXR–ADX–P450 electron transport chain is essential for maternal gametophytic control of embryogenesis in Arabidopsis. Proc. Natl. Acad. Sci. USA 2022, 119, e2000482119. [Google Scholar] [CrossRef]
- Abrahams, S.; Tanner, G.J.; Larkin, P.J.; Ashton, A.R. Identification and biochemical characterization of mutants in the proanthocyanidin pathway in Arabidopsis. Plant Physiol. 2002, 130, 561–576. [Google Scholar] [CrossRef]
- Hernández-Vega, J.C.; Cadya, B.; Kayanjaa, G.; Mauriello, A.; Cervantes, N.; Gillespie, A.; Lavia, L.; Trujillo, J.; Alkio, M.; Colón-Carmona, A. Detoxification of polycyclic aromatic hydrocarbons (PAHs) in Arabidopsis thaliana involves a putative flavonol synthase. J. Hazard. Mater. 2017, 321, 268–280. [Google Scholar] [CrossRef]
- Liu, H.; Weisman, D.; Ye, Y.B.; Cui, B.; Huang, Y.H.; Colón-Carmona, A.; Wang, Z.H. An oxidative stress response to polycyclic aromatic hydrocarbon exposure is rapid and complex in Arabidopsis thaliana. Plant Sci. 2009, 176, 375–382. [Google Scholar] [CrossRef]
- Mandal, V.; Chouhan, K.V.S.; Tandey, R.; Sen, K.K.; Kala, H.K.; Mehta, R. Critical analysis and mapping of research trends and impact assessment of polyaromatic hydrocarbon accumulation in leaves: Let history tell the future. Environ. Sci. Pollut. Res. 2018, 25, 22464–22474. [Google Scholar] [CrossRef]
- Shen, Y.; Li, J.; Gu, R.; Yue, L.; Wang, H.; Zhan, X.; Xing, B. Carotenoid and superoxide dismutase are the most effective antioxidants participating in ROS scavenging in phenanthrene accumulated wheat leaf. Chemosphere 2018, 197, 513–525. [Google Scholar] [CrossRef]
- Jin, L.; Che, X.; Zhang, Z.; Li, Y.; Gao, H.; Zhao, S. The mechanisms by which phenanthrene affects the photosynthetic apparatus of cucumber leaves. Chemosphere 2017, 168, 1498–1505. [Google Scholar] [CrossRef]
- Liu, H.; Weisman, D.; Tang, L.; Tan, L.; Zhang, W.-K.; Wang, Z.-H.; Huang, Y.-H.; Lin, W.-X.; Liu, X.-M.; Colón-Carmona, A. Stress signaling in response to polycyclic aromatic hydrocarbon exposure in Arabidopsis thaliana involves a nucleoside diphosphate kinase, NDPK-3. Planta 2015, 241, 95–107. [Google Scholar] [CrossRef]
- Khusnutdinov, E.; Sukhareva, A.; Panfilova, M.; Mikhaylova, E. Anthocyanin biosynthesis genes as model genes for genome editing in plants. Int. J. Mol. Sci. 2021, 22, 8752. [Google Scholar] [CrossRef]
- Kovinich, N.; Kayanja, G.; Chanoca, A.; Riedl, K.; Otegui, M.S.; Grotewold, E. Not all anthocyanins are born equal: Distinct patterns induced by stress in Arabidopsis. Planta 2014, 240, 931–940. [Google Scholar] [CrossRef]
- Solfanelli, C.; Poggi, A.; Loreti, E.; Alpi, A.; Perata, P. Sucrose-specific induction of the anthocyanin biosynthetic pathway in Arabidopsis. Plant Physiol. 2006, 140, 637–646. [Google Scholar] [CrossRef]
- Peer, W.A.; Brown, D.E.; Tague, B.W.; Muday, G.K.; Taiz, L.; Murphy, A.S. Flavonoid accumulation patterns of transparent testa mutants of Arabidopsis. Plant Physiol. 2001, 126, 536–548. [Google Scholar] [CrossRef]
- Agati, G.; Azzarello, E.; Pollastri, S.; Tattini, M. Flavonoids as antioxidants in plants: Location and functional significance. Plant Sci. 2012, 196, 67–76. [Google Scholar] [CrossRef]
- Boots, A.W.; Haenen, G.R.M.M.; Bast, A. Health effects of quercetin: From antioxidant to nutraceutical. Eur. J. Pharmacol. 2008, 585, 325–337. [Google Scholar] [CrossRef]
- Pollastri, S.; Tattini, M. Flavonols: Old compounds for old roles. Ann. Bot. 2011, 108, 1225–1233. [Google Scholar] [CrossRef]
- Potters, G.; Pasternak, T.P.; Guisez, Y.; Palme, K.J.; Jansen, M.A.K. Stress-induced morphogenic responses: Growing out of trouble? Trends Plant Sci. 2007, 12, 98–105. [Google Scholar] [CrossRef]
- Bashandy, T.; Taconnat, L.; Renou, J.-P.; Meyer, Y.; Reichheld, J.P. Accumulation of flavonoids in an ntra ntrb mutant leads to tolerance to UV-C. Mol. Plant 2009, 2, 249–258. [Google Scholar] [CrossRef]
- Chapman, J.M.; Muday, G.K. Flavonols modulate lateral root emergence by scavenging reactive oxygen species in Arabidopsis thaliana. J. Biol. Chem. 2021, 296, 100222. [Google Scholar] [CrossRef]
Disclaimer/Publisher’s Note: The statements, opinions and data contained in all publications are solely those of the individual author(s) and contributor(s) and not of MDPI and/or the editor(s). MDPI and/or the editor(s) disclaim responsibility for any injury to people or property resulting from any ideas, methods, instructions or products referred to in the content. |
© 2024 by the authors. Licensee MDPI, Basel, Switzerland. This article is an open access article distributed under the terms and conditions of the Creative Commons Attribution (CC BY) license (https://creativecommons.org/licenses/by/4.0/).