
Study of the Spectral Characteristics of Crops of Winter Wheat Varieties Infected with Pathogens of Leaf Diseases
 , , ,
, , ,
Abstract
:1. Introduction
- (1)
- Study the nature of similarities and differences in the spectral characteristics of crops of winter wheat varieties in individual years of research;
- (2)
- Study the relationship between the spectral characteristics of winter wheat crops and disease intensity in individual years of research;
- (3)
- Study the relationship between spectral characteristics and disease intensity of each individual variety during three years of research;
- (4)
- Assess the possibility of differentiating crops according to the degree of pathogen development.
2. Results

| Pathogen | Spectral Range, nm | ||||||||||||
|---|---|---|---|---|---|---|---|---|---|---|---|---|---|
| 490 | 550 | 660 | 700 | 720 | 845 | 1245 | 1445 | 1675 | 2005 | 2035 | 2295 | 2345 | |
| Bezostaya 100 | |||||||||||||
| Powdery mildew | 0.84 * | 0.84 * | 0.84 * | 0.84 * | 0.84 * | 0.61 | 0.81 * | 0.41 | 0.75 | 0.46 | 0.58 | 0.32 | 0.46 |
| Yellow spot | 0.78 | 0.78 | 0.78 | 0.78 | 0.78 | 0.34 | 0.44 | 0.14 | 0.37 | −0.03 | 0.14 | −0.1 | −0.03 |
| Septoria | 0.31 | 0.31 | 0.31 | 0.31 | 0.31 | 0.03 | 0.14 | −0.14 | 0.03 | −0.26 | −0.26 | −0.49 | −0.43 |
| Yellow rust | −0.46 | −0.46 | −0.46 | −0.46 | −0.46 | 0.15 | 0.21 | 0.03 | 0.21 | 0.7 | 0.39 | 0.39 | 0.58 |
| Brown rust | −0.65 | −0.65 | −0.65 | −0.65 | −0.65 | −0.65 | −0.65 | −0.65 | −0.65 | −0.39 | −0.65 | −0.65 | −0.65 |
| Generalized categories | 0.66 | 0.66 | 0.66 | 0.66 | 0.66 | 0.71 | 0.89 * | 0.37 | 0.77 | 0.6 | 0.6 | 0.31 | 0.54 |
| Svarog | |||||||||||||
| Powdery mildew | 0.52 | 0.52 | 0.52 | 0.81 * | 0.52 | 0.26 | 0.52 | 0.52 | −0.81 * | 0.81 * | 0.12 | 0.06 | −0.31 |
| Yellow spot | 0.7 | 0.7 | 0.7 | 0.52 | 0.7 | 0.94 * | 0.7 | 0.7 | −0.39 | 0.52 | 0.82 | 0.52 | - |
| Septoria | 0.66 | 0.66 | 0.66 | 0.43 | 0.66 | 0.77 | 0.66 | 0.66 | −0.49 | 0.43 | 0.43 | 0.03 | −0.66 |
| Yellow rust | −0.88 * | −0.88 * | −0.88 * | −0.52 | −0.88 * | −0.7 | −0.88 * | −0.88 * | 0.03 | −0.52 | −0.64 | −0.52 | 0.54 |
| Brown rust | −0.13 | −0.13 | −0.13 | −0.39 | −0.13 | 0.39 | −0.13 | −0.13 | 0.39 | −0.39 | 0.39 | 0.13 | - |
| Generalized categories | 0.49 | 0.49 | 0.49 | 0.77 | 0.49 | 0.31 | 0.49 | 0.49 | −0.83 * | 0.77 | 0.14 | 0.03 | 0.2 |
| Grom | |||||||||||||
| Powdery mildew | −0.58 | −0.72 | −0.67 | −0.52 | −0.72 | −0.23 | −0.64 | −0.41 | −0.67 | 0.17 | −0.12 | −0.72 | −0.81 * |
| Yellow spot | 0.38 | 0.75 | 0.55 | 0.81 * | 0.75 | −0.46 | 0.06 | 0.93 * | 0.55 | −0.64 | 0.12 | 0.75 | 0.41 |
| Septoria | −0.09 | −0.09 | −0.03 | −0.31 | −0.09 | 0.26 | 0.26 | −0.43 | −0.03 | 0.09 | −0.09 | −0.09 | 0.37 |
| Yellow rust | −0.52 | −0.76 | −0.52 | −0.88 * | −0.76 | 0.21 | −0.21 | −0.88 * | −0.52 | 0.27 | −0.27 | −0.76 | −0.21 |
| Brown rust | 0.1 | 0.51 | 0.34 | 0.68 | 0.51 | −0.78 | −0.3 | 0.85 * | 0.34 | −0.54 | 0.34 | 0.51 | 0.17 |
| Generalized categories | −0.37 | −0.14 | −0.09 | −0.09 | −0.14 | −0.66 | −0.49 | 0.03 | −0.09 | −0.14 | 0.37 | −0.14 | 0.09 |
3. Discussion
3.1. Assessment of the Mutual Influence of Variety Factors and Disease Development on the Spectral Characteristics of Winter Wheat Crops
3.2. Comparison of the Spectral Characteristics of Crops of the Studied Varieties across the Time Period of Each Individual Year of Research
- -
- The nature of the influence of the pathogenic background on the spectral characteristics of winter wheat crops was determined by the complex interaction of disease development in a specific year of research. For instance, in 2021, the differences in the spectral characteristics of the control and infected backgrounds were determined by mutual manifestations of yellow and brown rusts in the latter. In 2022, the greatest impact was exerted by a negative correlation between the development of yellow rust and septoria, and in 2023 powdery mildew and brown rust;
- -
- A clear and pronounced influence of varietal characteristics on the spectral properties of winter wheat was observed over three years. In most cases, this manifested itself as an immunological reaction of a particular variety to the influence of pathogen development. Different cultivars with similar pathogen indicators often exhibited strong differences in spectral response;
- -
- A regular and clear division of the spectral properties of winter wheat crops according to the intensity of the disease was observed only at a level of pathogen development of more than 5%. Moreover, this gradation was clearest in the spectral channels of the near-infrared range and at a wavelength of 720 nm. The most pronounced differentiation of crops according to generalized groups appeared in the 2345 nm spectral channel.
- -
- When the pathogenic background was below 5%, as in 2022 and 2023, the reflectivity of crops was largely determined by the influence of the variety factor or the interaction of the variety factor and disease intensity;
- -
- Tan spot showed no significant correlations with SBC variables, even at its highest level in 2023. In all likelihood, this pathogen is the most variety-specific, i.e., it is determined most by the immunological reaction of a particular variety;
- -
- A high level of correlation with variable SBC values of the 1445 nm spectral channel was revealed for leaf rust in 2021 and 2023.
3.3. Comparison of the Spectral Characteristics of Each Individual Variety over Three Years of Research
- -
- A fairly clear correlation and differentiation of spectral characteristics according to the development degree of individual pathogens was revealed for crops of each individual variety;
- -
- The spectral properties of each individual variety were determined by the different direction of the correlation relationship of disease intensity indicators in the general pathogenic background. Moreover, the nature of this relationship was different for the compared varieties, even with similar indicators of external disease manifestation. For instance, a pronounced and statistically significant correlation of external signs of powdery mildew manifestation with variable values of SBC spectral channels of the visible and near-infrared ranges appeared for the Bezostaya 100 variety. Such a relationship was not found in crops of the Svarog variety, though they were characterized by the highest rates of powdery mildew intensity. But a high level of statistically significant and negatively directed correlation of variable SBC values of most spectral channels with symptoms of yellow rust development was revealed. Moreover, the gradation of yellow rust development indicators in the Bezostaya 100 and Svarog varieties was almost identical;
- -
- The clearest and most consistent differentiation of the spectral characteristics of winter wheat varieties was manifested by pathogen intensity. Thus, crops of the Bezostaya 100 variety were well differentiated by the intensity of powdery mildew, tan spot and septoria into groups with indicators of 0–1 and 2–10%. Crops of the Svarog variety were clearly divided according to the intensity of yellow rust with a gradation of 0, 1–2 and 6%. Crops with minimum and maximum indicators were differentiated according to general categories of disease intensity.
3.4. Prospects for Further Development of Research
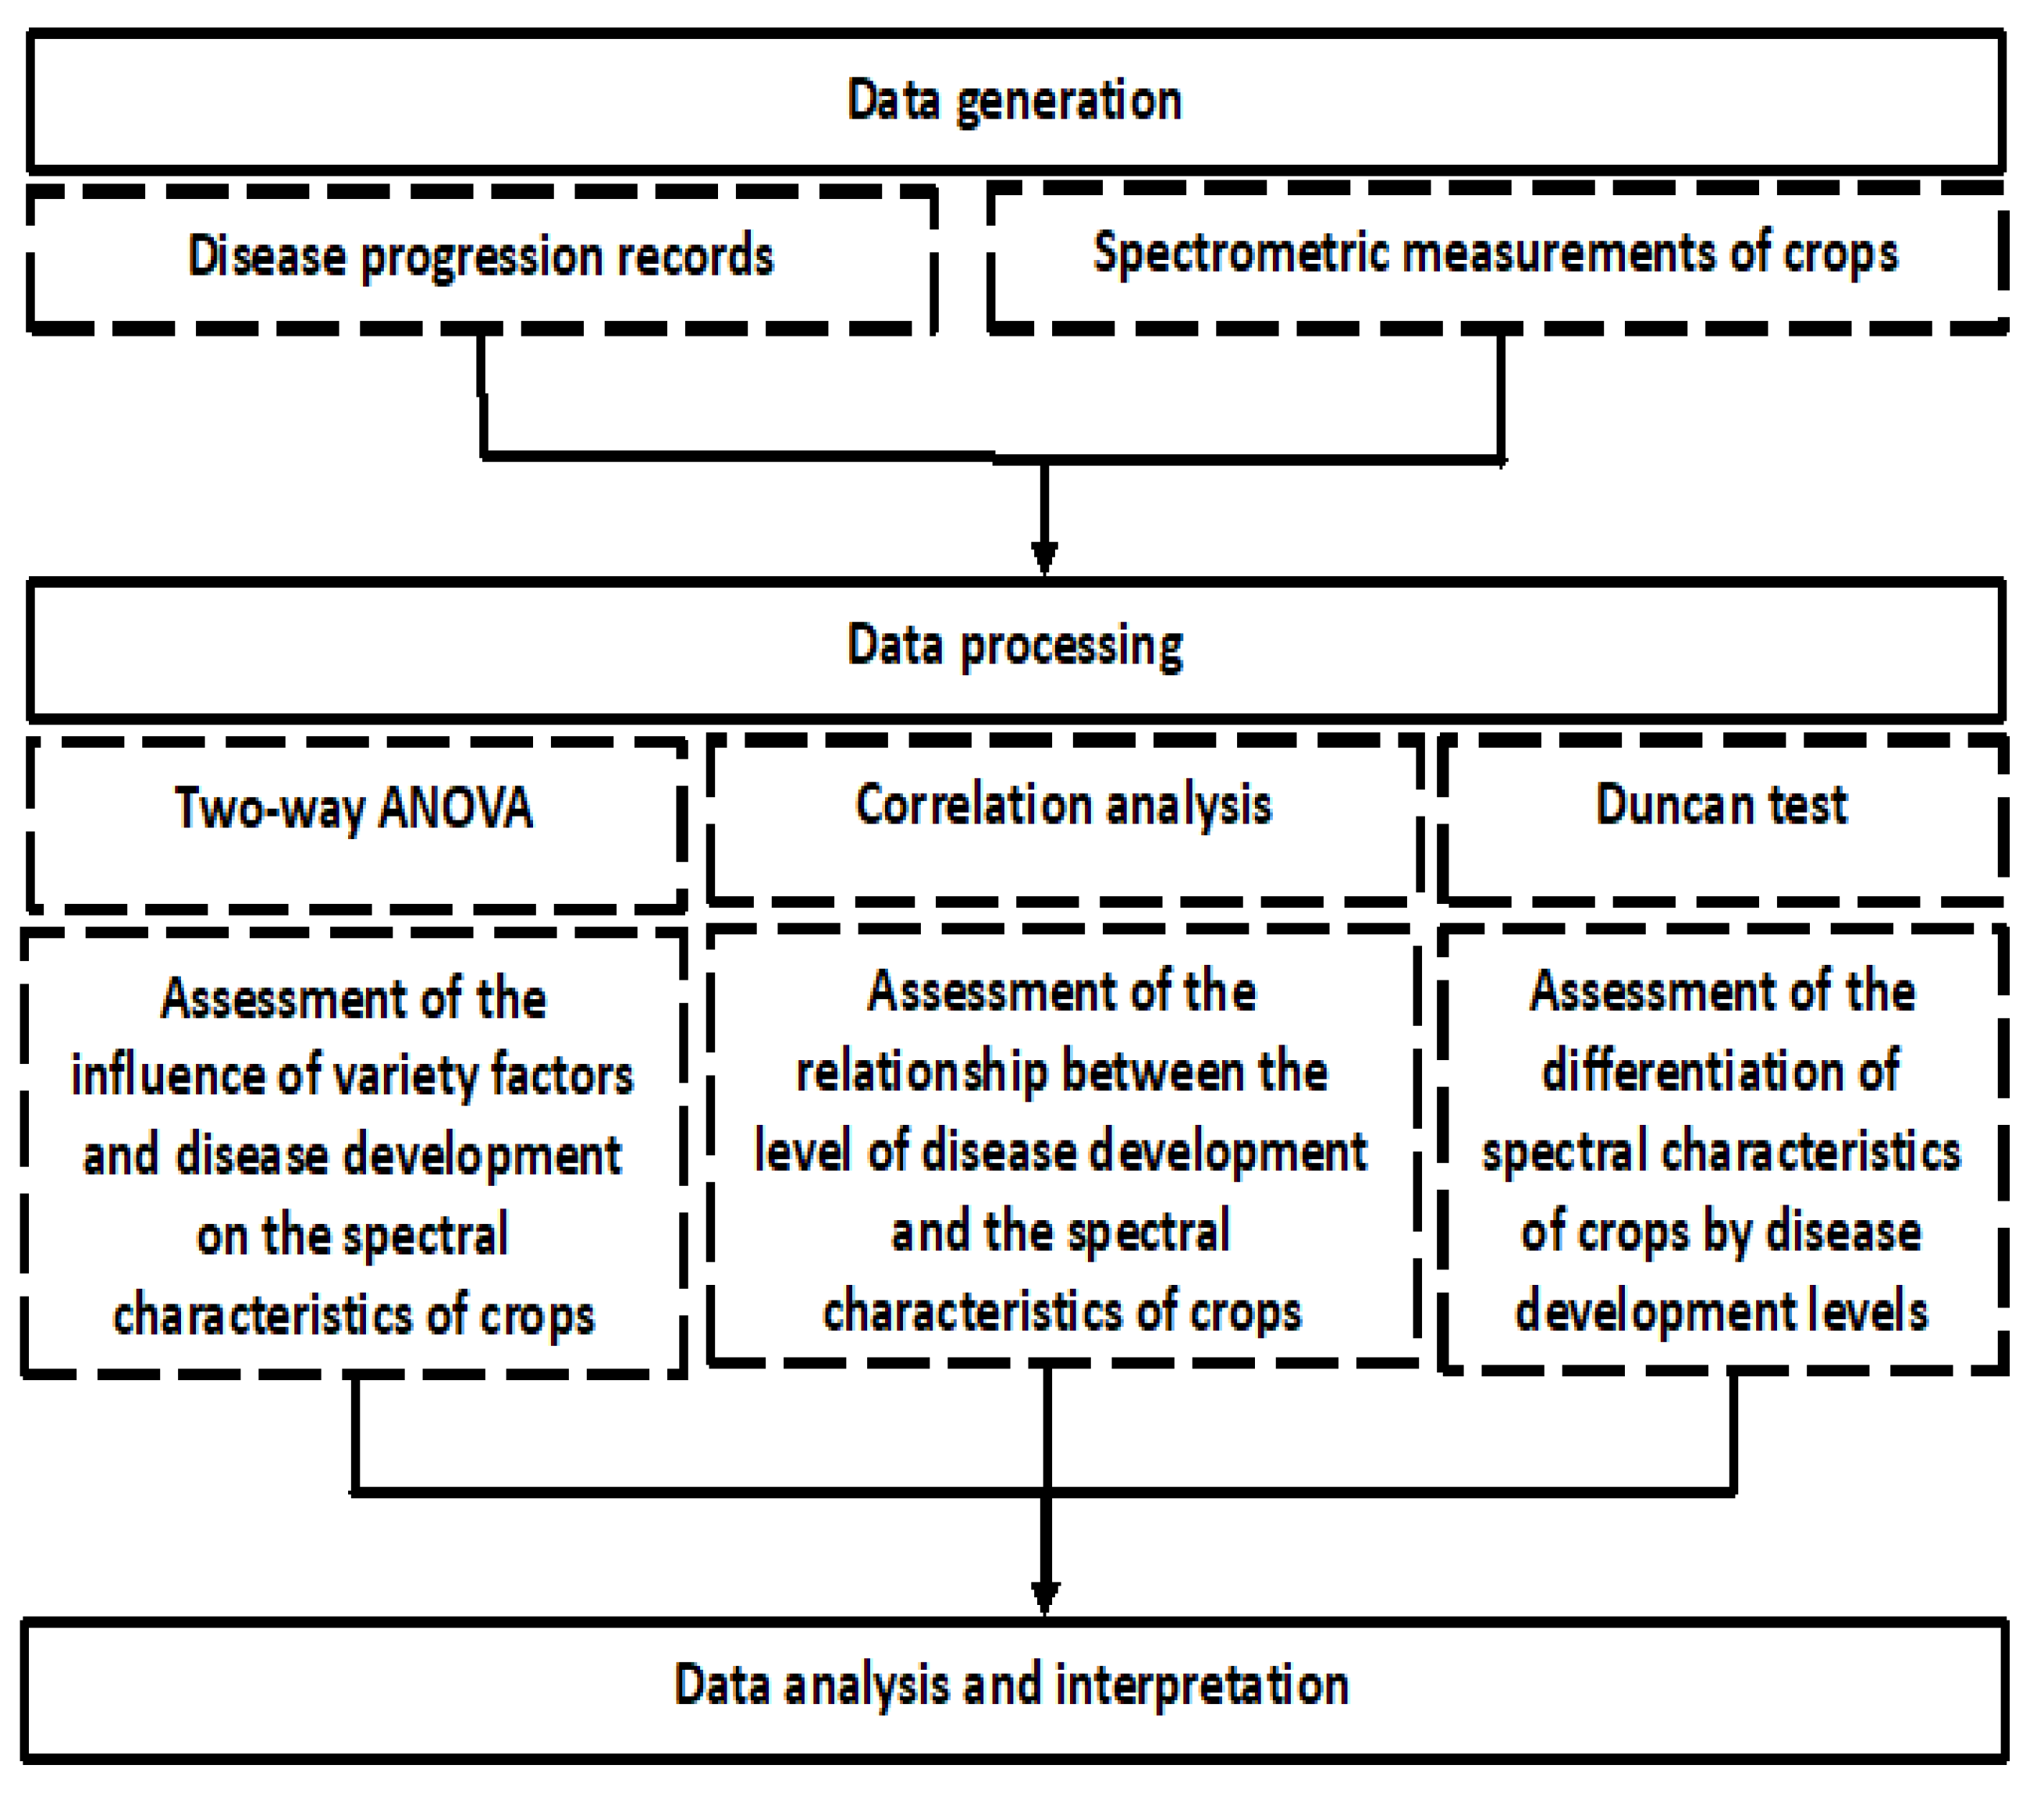
4. Materials and Methods
4.1. Organization of Test Plots and Experimental Design
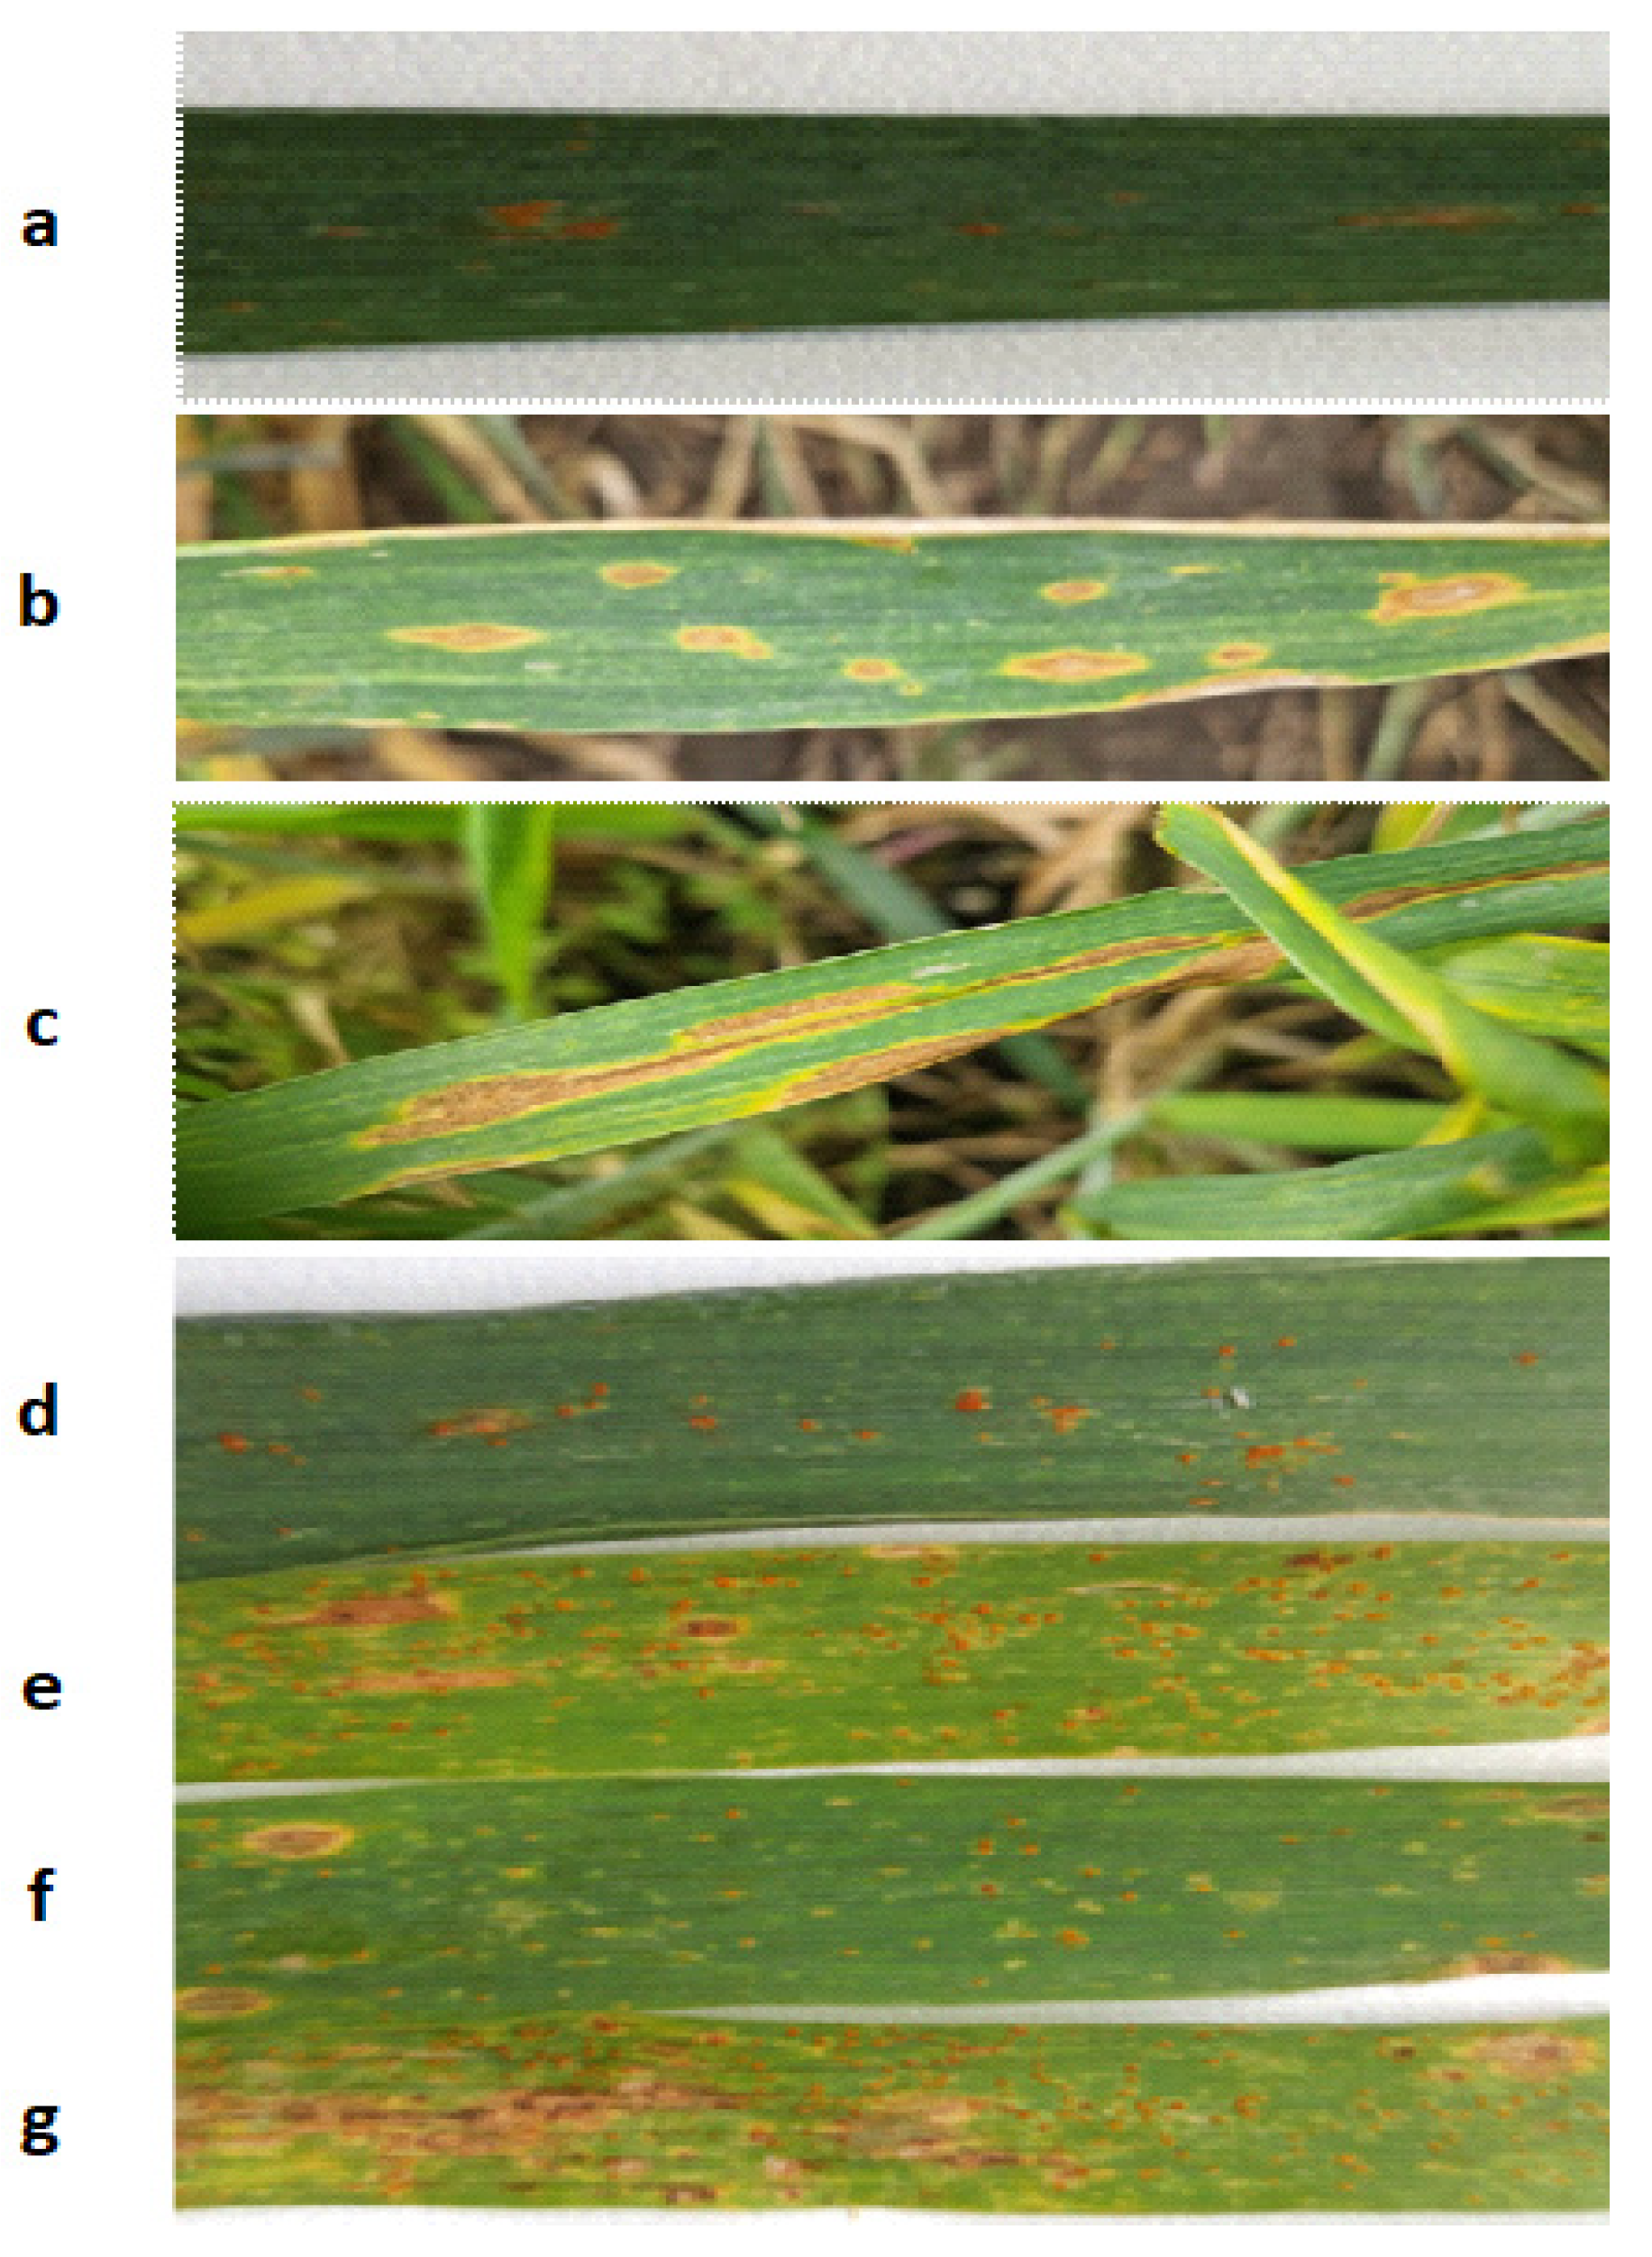
4.2. Field Experiments
4.3. Ground-Based Spectrometric Measurements
| Variety | Experience Option | Powdery Mildew | Septoria | Yellow Tan | Yellow Rust | Brown Rust | General Categories |
|---|---|---|---|---|---|---|---|
| 2021 | |||||||
| Bezostaya 100 | Control | 0.01 | 0.8 | 0 | 0 | 0 | 1 |
| Svarog | 0.01 | 1 | 0 | 0 | 0 | 1 | |
| Grom | 0.01 | 2.1 | 0.01 | 0 | 0 | 2 | |
| Bezostaya 100 | Infected | 0.01 | 1.9 | 0 | 0.3 | 0.3 | 4 |
| Svarog | 0.01 | 2.3 | 1.9 | 0.2 | 0.05 | 3 | |
| Grom | 0 | 4.1 | 0.3 | 0.2 | 0 | 5 | |
| 2022 | |||||||
| Bezostaya 100 | Control | 0.8 | 0.26 | - | 1.48 | - | 1 |
| Svarog | 4.02 | 1.87 | - | 2.21 | - | 3 | |
| Grom | 2.82 | 2.06 | - | 1.06 | - | 2 | |
| Bezostaya 100 | Infected | 2 | 0.94 | - | 7.72 | - | 5 |
| Svarog | 4.42 | 0.87 | - | 6.41 | - | 5 | |
| Grom | 1.76 | 4.2 | - | 0.78 | - | 4 | |
| 2023 | |||||||
| Bezostaya 100 | Control | 3.43 | 1.23 | 1.87 | - | 0 | 2 |
| Svarog | 10.23 | 3.03 | 0.77 | - | 0 | 3 | |
| Grom | 2.6 | 0 | 2.03 | - | 0.77 | 1 | |
| Bezostaya 100 | Infected | 12.93 | 3.77 | 10.03 | - | 0 | 4 |
| Svarog | 28.17 | 3.35 | 6.03 | - | 0 | 6 | |
| Grom | 0 | 2.2 | 18.37 | - | 15.9 | 5 | |
4.4. Data Processing
5. Conclusions
Author Contributions
Funding
Data Availability Statement
Conflicts of Interest
Appendix A
| R, % | Spectral Range, nm | |||||||
|---|---|---|---|---|---|---|---|---|
| 490 | 550 | 660 | 720 | 845 | 1445 | 1675 | 2345 | |
| Septoria | ||||||||
| 0.5 | 0.018 ± 0.001 ab | 0.043 ± 0.003 a | 0.018 ± 0.002 a | 0.128 ± 0.006 a | 0.460 ± 0.020 a | 0.053 ± 0.005 bc | 0.141 ± 0.012 ab | 0.039 ± 0.004 bc |
| 1 | 0.020 ± 0.001 b | 0.051 ± 0.002 b | 0.023 ± 0.001 b | 0.147 ± 0.004 b | 0.439 ± 0.014 a | 0.060 ± 0.004 c | 0.153 ± 0.008 b | 0.042 ± 0.003 b |
| 1.5 | 0.016 ± 0.001 a | 0.042 ± 0.003 a | 0.016 ± 0.002 a | 0.127 ± 0.006 a | 0.419 ± 0.020 a | 0.037 ± 0.005 a | 0.112 ± 0.012 a | 0.025 ± 0.004 a |
| 2 | 0.021 ± 0.001 b | 0.043 ± 0.003 a | 0.021 ± 0.002 ab | 0.122 ± 0.006 a | 0.463 ± 0.020 a | 0.043 ± 0.005 ab | 0.126 ± 0.012 ba | 0.030 ± 0.004 ab |
| 4 | 0.017 ± 0.001 ab | 0.038 ± 0.003 a | 0.017 ± 0.002 a | 0.113 ± 0.006 a | 0.422 ± 0.020 a | 0.039 ± 0.005 ab | 0.116 ± 0.012 a | 0.026 ± 0.004 a |
| Yellow rust | ||||||||
| 1 | 0.019 ± 0.001 ab | 0.041 ± 0.002 a | 0.019 ± 0.001 a | 0.118 ± 0.004 a | 0.442 ± 0.015 a | 0.041 ± 0.004 ab | 0.121 ± 0.008 a | 0.028 ± 0.003 a |
| 1.5 | 0.018 ± 0.001 ab | 0.043 ± 0.003 a | 0.018 ± 0.002 ab | 0.128 ± 0.006 ab | 0.460 ± 0.021 a | 0.053 ± 0.005 bc | 0.141 ± 0.012 ab | 0.039 ± 0.004 b |
| 2 | 0.016 ± 0.001 a | 0.042 ± 0.003 a | 0.016 ± 0.002 a | 0.127 ± 0.006 ab | 0.419 ± 0.021 a | 0.037 ± 0.005 a | 0.112 ± 0.012 a | 0.025 ± 0.004 a |
| 7 | 0.020 ± 0.001 b | 0.051 ± 0.002 b | 0.023 ± 0.001 b | 0.147 ± 0.004 b | 0.439 ± 0.015 a | 0.060 ± 0.004 c | 0.153 ± 0.008 b | 0.042 ± 0.003 b |
| Generalized categories | ||||||||
| 1 | 0.018 ± 0.002 ab | 0.043 ± 0.003 a | 0.018 ± 0.002 ab | 0.128 ± 0.005 a | 0.460 ± 0.014 a | 0.053 ± 0.004 bc | 0.141 ± 0.008 ab | 0.039 ± 0.003 bc |
| 2 | 0.017 ± 0.001 ab | 0.038 ± 0.002 a | 0.017 ± 0.001 ab | 0.113 ± 0.003 a | 0.422 ± 0.013 a | 0.039 ± 0.001 ab | 0.116 ± 0.004 a | 0.026 ± 0.001 a |
| 3 | 0.021 ± 0.001 b | 0.043 ± 0.001 a | 0.021 ± 0.001 bc | 0.122 ± 0.005 a | 0.463 ± 0.016 a | 0.043 ± 0.002 ab | 0.126 ± 0.006 ab | 0.030 ± 0.002 ab |
| 4 | 0.016 ± 0.001 a | 0.042 ± 0.002 a | 0.016 ± 0.001 a | 0.127 ± 0.005 a | 0.419 ± 0.022 a | 0.037 ± 0.002 a | 0.112 ± 0.006 a | 0.025 ± 0.001 a |
| 5 | 0.020 ± 0.001 b | 0.051 ± 0.002 b | 0.023 ± 0.001 b | 0.147 ± 0.006 b | 0.439 ± 0.018 a | 0.060 ± 0.006 c | 0.153 ± 0.013 b | 0.042 ± 0.005 c |
| R, % | Spectral Range, nm | |||||||
|---|---|---|---|---|---|---|---|---|
| 490 | 550 | 660 | 720 | 845 | 1445 | 1675 | 2345 | |
| Powdery mildew | ||||||||
| 0 | 0.023 ± 0.001 b | 0.056 ± 0.002 b | 0.028 ± 0.001 bc | 0.156 ± 0.005 b | 0.406 ± 0.011 a | 0.076 ± 0.005 a | 0.155 ± 0.004 b | 0.040 ± 0.005 ab |
| 3 | 0.020 ± 0.000 a | 0.046 ± 0.001 a | 0.021 ± 0.000 a | 0.128 ± 0.002 a | 0.383 ± 0.008 a | 0.074 ± 0.014 a | 0.123 ± 0.003 a | 0.020 ± 0.010 a |
| 4 | 0.024 ± 0.001 b | 0.063 ± 0.003 c | 0.030 ± 0.002 c | 0.176 ± 0.009 cd | 0.440 ± 0.018 b | 0.059 ± 0.003 a | 0.153 ± 0.010 b | 0.036 ± 0.003 ab |
| 10 | 0.022 ± 0.001 ab | 0.057 ± 0.001 b | 0.023 ± 0.001 a | 0.164 ± 0.003 bc | 0.500 ± 0.009 c | 0.067 ± 0.005 a | 0.157 ± 0.004 b | 0.032 ± 0.004 ab |
| 12 | 0.024 ± 0.000 b | 0.057 ± 0.000 b | 0.027 ± 0.000 b | 0.164 ± 0.001 bc | 0.477 ± 0.002 c | 0.056 ± 0.001 a | 0.150 ± 0.002 b | 0.033 ± 0.001 ab |
| 30 | 0.027 ± 0.001 c | 0.066 ± 0.002 c | 0.029 ± 0.001 bc | 0.180 ± 0.004 d | 0.536 ± 0.015 d | 0.069 ± 0.006 a | 0.178 ± 0.006 c | 0.045 ± 0.006 b |
| Septoria | ||||||||
| 0 | 0.020 ± 0.000 a | 0.046 ± 0.001 a | 0.021 ± 0.000 a | 0.128 ± 0.002 a | 0.383 ± 0.008 a | 0.074 ± 0.014 a | 0.123 ± 0.003 a | 0.020 ± 0.010 a |
| 2 | 0.024 ± 0.001 c | 0.063 ± 0.003 c | 0.030 ± 0.002 c | 0.176 ± 0.009 c | 0.440 ± 0.018 b | 0.059 ± 0.003 a | 0.153 ± 0.010 b | 0.036 ± 0.003 b |
| 3 | 0.022 ± 0.000 bc | 0.056 ± 0.001 b | 0.025 ± 0.001 b | 0.160 ± 0.003 b | 0.453 ± 0.010 b | 0.072 ± 0.004 a | 0.156 ± 0.003 b | 0.036 ± 0.003 b |
| 4 | 0.025 ± 0.000 c | 0.062 ± 0.001 c | 0.028 ± 0.000 bc | 0.172 ± 0.003 b | 0.507 ± 0.009 c | 0.062 ± 0.003 a | 0.164 ± 0.004 b | 0.039 ± 0.003 b |
| Generalized categories | ||||||||
| 1 | 0.020 ± 0.000 a | 0.046 ± 0.001 a | 0.021 ± 0.000 a | 0.128 ± 0.002 a | 0.383 ± 0.008 a | 0.074 ± 0.014 a | 0.123 ± 0.003 a | 0.020 ± 0.010 a |
| 2 | 0.024 ± 0.001 b | 0.063 ± 0.003 c | 0.030 ± 0.002 c | 0.176 ± 0.009 cd | 0.440 ± 0.018 b | 0.059 ± 0.003 a | 0.153 ± 0.010 b | 0.036 ± 0.003 ab |
| 3 | 0.022 ± 0.001 ab | 0.057 ± 0.001 b | 0.023 ± 0.001 a | 0.164 ± 0.003 bc | 0.500 ± 0.009 c | 0.067 ± 0.005 a | 0.157 ± 0.004 b | 0.032 ± 0.004 ab |
| 4 | 0.024 ± 0.000 b | 0.057 ± 0.000 b | 0.027 ± 0.000 b | 0.164 ± 0.001 bc | 0.477 ± 0.002 c | 0.056 ± 0.001 a | 0.150 ± 0.002 b | 0.033 ± 0.001 ab |
| 5 | 0.023 ± 0.001 b | 0.056 ± 0.002 b | 0.028 ± 0.001 bc | 0.156 ± 0.005 b | 0.406 ± 0.011 a | 0.076 ± 0.005 a | 0.155 ± 0.004 b | 0.040 ± 0.005 b |
| 6 | 0.027 ± 0.001 c | 0.066 ± 0.002 c | 0.029 ± 0.001 bc | 0.180 ± 0.004 d | 0.536 ± 0.015 d | 0.069 ± 0.006 a | 0.178 ± 0.006 c | 0.045 ± 0.006 b |
| R, % | Spectral Range, nm | |||||||
|---|---|---|---|---|---|---|---|---|
| 490 | 550 | 660 | 720 | 845 | 1445 | 1675 | 2345 | |
| Powdery mildew | ||||||||
| 0 | 0.017 ± 0.001 a | 0.041 ± 0.002 a | 0.019 ± 0.001 a | 0.123 ± 0.005 a | 0.411 ± 0.020 a | 0.048 ± 0.007 a | 0.113 ± 0.007 a | 0.040 ± 0.005 a |
| 1 | 0.018 ± 0.002 a | 0.043 ± 0.003 a | 0.018 ± 0.002 a | 0.128 ± 0.005 a | 0.460 ± 0.014 ab | 0.053 ± 0.004 a | 0.141 ± 0.008 b | 0.020 ± 0.010 bc |
| 2 | 0.022 ± 0.001 b | 0.053 ± 0.002 b | 0.025 ± 0.001 b | 0.153 ± 0.003 b | 0.466 ± 0.018 ab | 0.072 ± 0.003 b | 0.179 ± 0.006 c | 0.036 ± 0.003 c |
| 4 | 0.024 ± 0.001 b | 0.063 ± 0.003 c | 0.030 ± 0.002 c | 0.176 ± 0.009 b | 0.440 ± 0.018 ab | 0.059 ± 0.003 bc | 0.153 ± 0.010 bc | 0.032 ± 0.004 bc |
| 12 | 0.024 ± 0.000 b | 0.057 ± 0.000 bc | 0.027 ± 0.000 bc | 0.164 ± 0.001 b | 0.477 ± 0.002 b | 0.056 ± 0.001 a | 0.150 ± 0.002 b | 0.033 ± 0.001 b |
| Yellow spot | ||||||||
| 0 | 0.018 ± 0.001 a | 0.027 ± 0.031 a | 0.020 ± 0.001 a | 0.130 ± 0.004 a | 0.432 ± 0.013 a | 0.054 ± 0.004 a | 0.133 ± 0.007 a | 0.028 ± 0.006 a |
| 2 | 0.024 ± 0.001 b | 0.037 ± 0.046 b | 0.030 ± 0.002 c | 0.176 ± 0.009 b | 0.440 ± 0.018 ab | 0.059 ± 0.003 a | 0.153 ± 0.010 a | 0.036 ± 0.003 a |
| 10 | 0.024 ± 0.000 b | 0.038 ± 0.039 b | 0.027 ± 0.000 b | 0.164 ± 0.001 b | 0.477 ± 0.002 b | 0.056 ± 0.001 a | 0.150 ± 0.002 a | 0.033 ± 0.001 a |
| Septoria | ||||||||
| 0 | 0.018 ± 0.002 a | 0.043 ± 0.003 a | 0.018 ± 0.002 a | 0.113 ± 0.143 a | 0.460 ± 0.014 ab | 0.053 ± 0.004 a | 0.141 ± 0.008 a | 0.039 ± 0.003 a |
| 1 | 0.020 ± 0.001 ab | 0.048 ± 0.002 ab | 0.022 ± 0.001 ab | 0.133 ± 0.151 ab | 0.459 ± 0.015 ab | 0.063 ± 0.006 a | 0.149 ± 0.009 a | 0.033 ± 0.009 a |
| 2 | 0.022 ± 0.001 ab | 0.056 ± 0.003 b | 0.027 ± 0.002 b | 0.141 ± 0.177 b | 0.421 ± 0.016 a | 0.054 ± 0.004 a | 0.139 ± 0.009 a | 0.030 ± 0.004 a |
| 4 | 0.024 ± 0.000 b | 0.057 ± 0.000 b | 0.027 ± 0.000 b | 0.162 ± 0.166 b | 0.477 ± 0.002 b | 0.056 ± 0.001 a | 0.150 ± 0.002 a | 0.033 ± 0.001 a |
| Generalized categories | ||||||||
| 1 | 0.019 ± 0.001 ab | 0.045 ± 0.002 ab | 0.021 ± 0.001 ab | 0.134 ± 0.005 ab | 0.454 ± 0.022 b | 0.057 ± 0.009 bc | 0.128 ± 0.008 b | 0.020 ± 0.013 ab |
| 2 | 0.015 ± 0.001 a | 0.038 ± 0.002 a | 0.017 ± 0.001 a | 0.111 ± 0.005 a | 0.367 ± 0.024 a | 0.039 ± 0.010 a | 0.098 ± 0.008 a | 0.012 ± 0.010 a |
| 3 | 0.022 ± 0.001 bc | 0.053 ± 0.002 bc | 0.025 ± 0.001 bc | 0.153 ± 0.003 bc | 0.466 ± 0.018 b | 0.072 ± 0.003 c | 0.179 ± 0.006 c | 0.051 ± 0.003 d |
| 4 | 0.018 ± 0.002 a | 0.043 ± 0.003 a | 0.018 ± 0.002 a | 0.128 ± 0.005 ab | 0.460 ± 0.014 b | 0.053 ± 0.004 ab | 0.141 ± 0.008 b | 0.039 ± 0.003 cd |
| 5 | 0.024 ± 0.001 c | 0.063 ± 0.003 d | 0.030 ± 0.002 d | 0.176 ± 0.009 c | 0.440 ± 0.018 b | 0.059 ± 0.003 bc | 0.153 ± 0.010 bc | 0.036 ± 0.003 bcd |
| 6 | 0.024 ± 0.000 c | 0.057 ± 0.000 cd | 0.027 ± 0.000 d | 0.164 ± 0.001 c | 0.477 ± 0.002 b | 0.056 ± 0.001 b | 0.150 ± 0.002 bc | 0.033 ± 0.001 bc |
| R, % | Spectral Range, nm | |||||||
|---|---|---|---|---|---|---|---|---|
| 490 | 550 | 660 | 720 | 845 | 1445 | 1675 | 2345 | |
| Yellow rust | ||||||||
| 0 | 0.024 ± 0.001 c | 0.060 ± 0.001 b | 0.025 ± 0.001 c | 0.169 ± 0.003 c | 0.514 ± 0.009 b | 0.068 ± 0.004 b | 0.164 ± 0.004 b | 0.039 ± 0.004 a |
| 1 | 0.021 ± 0.001 bc | 0.051 ± 0.002 ab | 0.021 ± 0.001 bc | 0.150 ± 0.006 bc | 0.506 ± 0.017 b | 0.041 ± 0.008 ab | 0.140 ± 0.007 ab | 0.034 ± 0.009 a |
| 2 | 0.019 ± 0.002 ab | 0.049 ± 0.005 a | 0.021 ± 0.002 ab | 0.140 ± 0.011 ab | 0.412 ± 0.029 a | 0.047 ± 0.008 ab | 0.127 ± 0.018 a | 0.033 ± 0.007 a |
| 6 | 0.016 ± 0.001 a | 0.042 ± 0.002 a | 0.016 ± 0.001 a | 0.127 ± 0.005 a | 0.419 ± 0.022 a | 0.037 ± 0.002 a | 0.112 ± 0.006 a | 0.025 ± 0.001 a |
| Generalized categories | ||||||||
| 1 | 0.021 ± 0.001 b | 0.052 ± 0.003 bc | 0.023 ± 0.001 b | 0.152 ± 0.008 bc | 0.494 ± 0.030 b | 0.066 ± 0.015 b | 0.146 ± 0.011 bc | 0.038 ± 0.011 a |
| 2 | 0.021 ± 0.001 b | 0.051 ± 0.002 bc | 0.021 ± 0.001 b | 0.150 ± 0.006 bc | 0.506 ± 0.017 b | 0.041 ± 0.008 ab | 0.140 ± 0.007 bc | 0.034 ± 0.009 a |
| 3 | 0.019 ± 0.002 ab | 0.049 ± 0.005 ab | 0.021 ± 0.002 b | 0.140 ± 0.011 ab | 0.412 ± 0.029 a | 0.047 ± 0.008 ab | 0.127 ± 0.018 ab | 0.033 ± 0.007 a |
| 4 | 0.016 ± 0.001 a | 0.042 ± 0.002 a | 0.016 ± 0.001 a | 0.127 ± 0.005 a | 0.419 ± 0.022 a | 0.037 ± 0.002 a | 0.112 ± 0.006 a | 0.025 ± 0.001 a |
| 5 | 0.022 ± 0.001 b | 0.057 ± 0.001 c | 0.023 ± 0.001 b | 0.164 ± 0.003 cd | 0.500 ± 0.009 b | 0.067 ± 0.005 b | 0.157 ± 0.004 cd | 0.032 ± 0.004 a |
| 6 | 0.027 ± 0.001 c | 0.066 ± 0.002 d | 0.029 ± 0.001 c | 0.180 ± 0.004 d | 0.500 ± 0.009 b | 0.069 ± 0.006 b | 0.178 ± 0.006 d | 0.045 ± 0.006 a |
| R, % | Spectral Range, nm | |||||||
|---|---|---|---|---|---|---|---|---|
| 490 | 550 | 660 | 720 | 845 | 1445 | 1675 | 2345 | |
| Yellow rust | ||||||||
| 0 | 0.022 ± 0.000 b | 0.051 ± 0.001 b | 0.025 ± 0.001 b | 0.143 ± 0.003 b | 0.408 ± 0.008 a | 0.072 ± 0.006 a | 0.141 ± 0.003 b | 0.030 ± 0.005 a |
| 2 | 0.022 ± 0.001 b | 0.048 ± 0.002 b | 0.023 ± 0.001 b | 0.136 ± 0.007 b | 0.472 ± 0.024 b | 0.056 ± 0.005 a | 0.144 ± 0.009 b | 0.039 ± 0.009 a |
| 3 | 0.019 ± 0.001 a | 0.041 ± 0.001 a | 0.019 ± 0.001 a | 0.118 ± 0.003 a | 0.442 ± 0.012 ab | 0.041 ± 0.001 a | 0.121 ± 0.004 a | 0.028 ± 0.001 a |
| Brown rust | ||||||||
| 0 | 0.022 ± 0.001 ab | 0.047 ± 0.002 a | 0.023 ± 0.001 a | 0.133 ± 0.004 a | 0.464 ± 0.011 a | 0.050 ± 0.003 a | 0.137 ± 0.005 b | 0.032 ± 0.004 a |
| 1 | 0.020 ± 0.000 a | 0.046 ± 0.001 a | 0.021 ± 0.000 a | 0.129 ± 0.002 a | 0.386 ± 0.008 a | 0.073 ± 0.014 ab | 0.124 ± 0.003 a | 0.016 ± 0.010 ab |
| 2 | 0.022 ± 0.001 b | 0.056 ± 0.002 b | 0.027 ± 0.001 b | 0.153 ± 0.005 b | 0.402 ± 0.011 b | 0.076 ± 0.005 b | 0.152 ± 0.005 c | 0.042 ± 0.005 b |
| Generalized categories | ||||||||
| 1 | 0.025 ± 0.001 c | 0.054 ± 0.002 c | 0.027 ± 0.001 c | 0.150 ± 0.006 cd | 0.487 ± 0.020 c | 0.058 ± 0.007 a | 0.152 ± 0.008 c | 0.031 ± 0.010 a |
| 2 | 0.022 ± 0.001 b | 0.048 ± 0.002 b | 0.023 ± 0.001 b | 0.136 ± 0.007 bc | 0.472 ± 0.024 c | 0.056 ± 0.005 a | 0.144 ± 0.009 bc | 0.039 ± 0.009 a |
| 3 | 0.017 ± 0.001 a | 0.038 ± 0.002 a | 0.017 ± 0.001 a | 0.113 ± 0.003 a | 0.422 ± 0.013 ab | 0.039 ± 0.001 a | 0.116 ± 0.004 a | 0.026 ± 0.001 a |
| 4 | 0.021 ± 0.001 b | 0.043 ± 0.001 b | 0.021 ± 0.001 b | 0.122 ± 0.005 ab | 0.463 ± 0.016 bc | 0.043 ± 0.002 a | 0.126 ± 0.006 ab | 0.030 ± 0.002 a |
| 5 | 0.020 ± 0.000 ab | 0.046 ± 0.001 ab | 0.021 ± 0.000 b | 0.128 ± 0.002 ab | 0.383 ± 0.008 a | 0.074 ± 0.014 a | 0.123 ± 0.003 a | 0.020 ± 0.010 a |
| Spectral Channels | Pathogen | ||||
|---|---|---|---|---|---|
| Powdery Mildew | Tan Spot | Septoria | Yellow Rust | Brown Rust | |
| 490 | 0.14 | 0.66 * | 0.35 | −0.56 * | −0.17 |
| 520 | 0.22 | 0.74 * | 0.25 | −0.66 * | −0.07 |
| 550 | 0.32 | 0.70 * | 0.24 | −0.59 * | −0.13 |
| 575 | 0.34 | 0.68 * | 0.22 | −0.52 * | −0.12 |
| 660 | 0.09 | 0.69 * | 0.30 | −0.56 * | −0.07 |
| 700 | 0.32 | 0.68 * | 0.15 | −0.53 * | −0.06 |
| 720 | 0.31 | 0.63 * | 0.21 | −0.53 * | −0.18 |
| 845 | 0.15 | 0.23 | 0.42 | −0.28 | −0.44 |
| 920 | 0.19 | 0.22 | 0.40 | −0.28 | −0.46 |
| 1085 | 0.23 | 0.31 | 0.40 | −0.27 | −0.44 |
| 1135 | 0.19 | 0.28 | 0.33 | −0.22 | −0.46 |
| 1215 | 0.22 | 0.44 | 0.35 | −0.39 | −0.38 |
| 1245 | 0.22 | 0.44 | 0.35 | −0.39 | −0.38 |
| 1285 | 0.23 | 0.44 | 0.32 | −0.40 | −0.37 |
| 1445 | −0.02 | 0.52 * | −0.18 | −0.56 * | 0.18 |
| 1675 | 0.13 | 0.48 * | 0.19 | −0.39 | −0.22 |
| 1725 | 0.12 | 0.50 * | 0.21 | −0.40 | −0.20 |
| 2005 | 0.06 | −0.09 | −0.07 | 0.16 | −0.33 |
| 2035 | 0.20 | 0.31 | −0.05 | −0.20 | −0.21 |
| 2295 | −0.27 | 0.44 | 0.03 | −0.29 | 0.00 |
| 2345 | −0.03 | 0.27 | 0.11 | 0.04 | −0.18 |
References
- Kokhmetova, A.; Atishova, M.; Sapakhova, Z.; Kremneva, O.Y.; Volkova, G.V. Evaluation of wheat cultivars growing in Kazakhstan and Russia for resistance to tan spot. J. Plant Pathol. 2017, 99, 161–167. [Google Scholar] [CrossRef]
- Kolmer, J.A.; Hughes, M.E. Physiologic specialization of Puccinia triticina on wheat in the United States in 2012. Plant Dis. 2014, 98, 1145–1150. [Google Scholar] [CrossRef] [PubMed]
- Volkova, G.V.; Shulyakovskaya, L.N.; Kudinova, O.A.; Matveeva, I.P. Yellow rust of wheat in the Kuban. Plant Prot. Quar. 2018, 4, 22. [Google Scholar] [CrossRef]
- Kremneva, O.Y.; Volkova, G.V.; Kovalenko, N.M. The dynamics of the racial composition of Pyrenophora tritici-repentis in the North Caucasus region. Mycol. Phytopathol. 2019, 53, 246–253. [Google Scholar] [CrossRef]
- Kremneva, O.Y.; Danilov, R.Y.; Gasiyan, K.E.; Ponomarev, A.V. Spore-trapping device: An efficient tool to manage fungal diseases in winter wheat crops. Plants 2023, 12, 391. [Google Scholar] [CrossRef]
- FAO (Food and Agriculture Organization of the United Nations). Available online: https://www.fao.org/home/en/ (accessed on 12 June 2022).
- Fedorenko, V.F.; Mishurov, N.P.; Nemenushchaya, L.A. Promising Technologies for the Diagnosis of Pathogens of Agricultural Plants: Scientific, Analyte, Review; FGBNU «Rosinformagrotekh»: Moscow, Russia, 2018; p. 68. [Google Scholar]
- Sanin, S. Biological, agroecological and ecological aspects of phytosanitary monitoring. Plant Prot. News 1999, 1, 62–67. [Google Scholar]
- Abrosimov, A.V.; Dvorkin, B.A. Prospects of application of remote sensing data from space to improve the efficiency of agriculture in Russia. Geomatika 2009, 4, 45–49. [Google Scholar]
- Antonov, V.N.; Sladkikh, L.A. Monitoring of crop condition and forecasting of productivity of spring wheat by remote sensing data. Geomatika 2009, 4, 50–53. [Google Scholar]
- Thenkabail, P.S.; Lyon, J.G.; Huete, A. Hyperspectral Remote Sensing of Vegetation; CRC Press: Boca Raton, FL, USA, 2011. [Google Scholar]
- Lowe, A.; Harrison, N.; French, A.P. Hyperspectral image analysis techniques for the detection and classification of the early onset of plant disease and stress. Plant Methods 2017, 13, 80–91. [Google Scholar] [CrossRef]
- Avinash, P.; Ramathilaga, A.; Valarmathi, P. Hyperspectral remote sensing for discrimination for plant disease forecasting: Review. J. Pharmacogn. Phytochem. 2022, 11, 208–215. [Google Scholar]
- Cheshkova, A.F. A review of hyperspectral image analysis techniques for plant disease detection and identification. Vavilov J. Genet. Breed. 2022, 26, 202–213. [Google Scholar] [CrossRef] [PubMed]
- Wan, L.; Li, H.; Li, C.; Wang, A.; Yang, Y.; Wang, P. Hyperspectral Sensing of Plant Diseases: Principle and Methods. Agronomy 2022, 12, 1451. [Google Scholar] [CrossRef]
- Danilov, R.Y.; Kremneva, O.Y.; Ismailov, V.Y.; Tretyakov, V.A.; Rizvanov, A.A.; Krivoshein, V.; Pachkin, A.A. General methods and results of ground hyperspectral studies of seasonal changes in the reflective properties of crops and certain types of weeds. Curr. Probl. Remote Sens. Earth Space 2020, 1, 113–127. [Google Scholar] [CrossRef]
- Danilov, R.Y.; Kremneva, O.Y.; Pachkin, A.A. Identification of the Spectral Patterns of Cultivated Plants and Weeds: Hyperspectral Vegetation Indices. Agronomy 2023, 13, 859. [Google Scholar] [CrossRef]
- Delwiche, S.R.; Kim, M.S. Biological Quality and Precision Agriculture. II; DeShazer, J.A., Meyer, G.E., Eds.; SPIE: Bellingham, WA, USA, 2000; Volume 4203. [Google Scholar]
- Barbedo, J.G.A.; Tibola, C.S.; Fernandes, J.M.C. Detecting Fusarium head blight in wheat kernels using hyperspectral imaging. Biosyst. Eng. 2015, 131, 65–76. [Google Scholar] [CrossRef]
- Alisaac, E.; Behmann, J.; Kuska, M.T.; Dehne, H.-W.; Mahlein, A.-K. Hyperspectral quantification of wheat resistance to Fusariumhead blight: Comparison of two Fusarium species. Eur. J. Plant Pathol. 2018, 152, 869–884. [Google Scholar] [CrossRef]
- Mahlein, A.-K.; Alisaac, E.; Al Masri, A.; Behmann, J.; Dehne, H.-W.; Oerke, E.-C. Comparison and Combination of Thermal, Fluorescence, and Hyperspectral Imaging for Monitoring Fusarium Head Blight of Wheat on Spikelet Scale. Sensors 2019, 19, 2281. [Google Scholar] [CrossRef] [PubMed]
- Ma, H.; Huang, W.; Jing, Y.; Pignatti, S.; Laneve, G.; Dong, Y.; Ye, H.; Liu, L.; Guo, A.; Jiang, J. Identification of Fusarium Head Blight in Winter Wheat Ears Using Continuous Wavelet Analysis. Sensors 2019, 20, 20. [Google Scholar] [CrossRef] [PubMed]
- Zhang, J.; Pu, R.; Huang, W.; Yuan, L.; Luo, J.; Wang, J. Using in-situ hyperspectral data for detecting and discriminating yellow rust disease from nutrient stresses. Field Crops Res. 2012, 134, 165–174. [Google Scholar] [CrossRef]
- Zhang, N.; Pan, Y.; Feng, H.; Zhao, X.; Yang, X.; Ding, C.; Yang, G. Development of Fusarium head blight classification index using hyperspectral microscopy images of winter wheat spikelets. Biosyst. Eng. 2019, 186, 83–99. [Google Scholar] [CrossRef]
- Zhang, X.; Han, L.; Dong, Y.; Shi, Y.; Huang, W.; Han, L.; González-Moreno, P.; Ma, H.; Ye, H.; Sobeih, T.A. Deep Learning-Based Approach for Automated Yellow Rust Disease Detection from High-Resolution Hyperspectral UAV Images. Remote Sens. 2019, 11, 1554. [Google Scholar] [CrossRef]
- Krishna, G.; Sahoo, R.N.; Pargal, S.; Gupta, V.K.; Sinha, P.; Bhagat, S.; Sahara, M.S.; Singh, R.; Chattopadhyay, C. Assessing Wheat Yellow Rust Disease through Hyperspectral Remote Sensing. ISPRS Int. Arch. Photogramm. Remote Sens. Spat. Inf. Sci. 2014, XL-8, 1413–1416. [Google Scholar] [CrossRef]
- Guo, A.; Huang, W.; Ye, H.; Dong, Y.; Ma, H.; Ren, Y.; Ruan, C. Identification of Wheat Yellow Rust Using Spectral and Texture Features of Hyperspectral Images. Remote Sens. 2020, 12, 1419. [Google Scholar] [CrossRef]
- Guo, A.; Huang, W.; Dong, Y.; Ye, H.; Ma, H.; Liu, B.; Wu, B.; Ren, Y.; Ruan, C.; Geng, Y. Wheat Yellow Rust Detection Using UAV-Based Hyperspectral Technology. Remote Sens. 2021, 13, 123. [Google Scholar] [CrossRef]
- Kremneva, O.Y.; Tutubalina, O.V.; Sereda, I.I.; Danilov, R.Y.; Zimin, M.V.; Kurilov, A.A. Studies of changes in the spectral characteristics of winter wheat varieties depending on the degree of infection with pathogens. Curr. Probl. Remote Sens. Earth Space 2020, 3, 149–161. [Google Scholar] [CrossRef]
- Sereda, I.I.; Danilov, R.Y.; Kremneva, O.Y.; Zimin, M.V.; Podushin, Y.V. Development of Methods for Remote Monitoring of Leaf Diseases in Wheat Agrocenoses. Plants 2023, 12, 3223. [Google Scholar] [CrossRef] [PubMed]
- Bohnenkamp, D.; Behmann, J.; Mahlein, A.-K. In-Field Detection of Yellow Rust in Wheat on the Ground Canopy and UAV Scale. Remote Sens. 2019, 11, 2495. [Google Scholar] [CrossRef]
- Kang, Y.; Anderegg, J.; Mikaberidze, A.; Karisto, P.; Masche, F.; McDonald, B.A.; Walter, A.; Hund, A. Hyperspectral canopy sensing of Wheat Septoria tritici Blotch Disease. Front. Plant Sci. 2018, 9, 1195. [Google Scholar] [CrossRef]
- Odilbekov, F.; Armoniené, R.; Henriksson, T.; Chawade, A. Proximal phenotyping and machine learning methods to identify Septoria tritici blotch disease symptoms in wheat. Front. Plant Sci. 2018, 9, 685. [Google Scholar] [CrossRef]
- Kremneva, O.Y.; Danilov, R.Y.; Sereda, I.I.; Tutubalina, O.V.; Pachkin, A.A.; Zimin, M.V. Spectral characteristics of winter wheat varieties depending on the development degree of Pyrenophora tritici-repentis. Precis. Agric. 2022, 24, 830–852. [Google Scholar] [CrossRef]
- Carter, G.A.; Spiering, B.A. Optical Properties of Intact Leaves for Estimating Chlorophyll Concentration. J. Environ. Qual. 2002, 31, 1424. [Google Scholar] [CrossRef]
- Stellacci, A.M.; Castrignanò, A.; Troccoli, A.; Basso, B.; Buttafuoco, G. Selecting optimal hyperspectral bands to discriminate nitrogen status in durum wheat: A comparison of statistical approaches. Environ. Monit. Assess. 2016, 188, 1–15. [Google Scholar] [CrossRef] [PubMed]
- Weatherbase. Krasnodar. Russia Köppen Climate Classification (Weatherbase). Available online: https://www.weatherbase.com/ (accessed on 12 April 2024).
- Valkov, V.F.; Shtompel, Y.A.; Trubilin, I.T. Soils of the Krasnodar Region Their Utilisation and Protection; SKNTs VSh: Rostov-on-Don, Russia, 1996; p. 192. [Google Scholar]
- Anpilogova, L.K.; Volkova, G.V. Methods for Creating Artificial Infectious Backgrounds and Assessing Wheat Varieties for Resistance to Harmful Diseases (Spike Fusarium, Rust, Powdery Mildew); VNIIBZR, RASKHN: Krasnodar, Russia, 2000; 28p. [Google Scholar]
- Peterson, R.F.; Cambell, A.B.; Hannah, A.E. A diagrammatic scale for estimating rust intensity on leaves and stems of cereals. Can. J. Res. 1948, 26, 496–500. [Google Scholar] [CrossRef]
- Roelfs, A.P.; Singh, R.P.; Saari, E.E. Rust Diseases of Wheat: Concepts and Methods of Disease Management; CIMMYT: Mexico City, Mexico, 1992; ISBN 968612747X. [Google Scholar]
- Eyal, Z.; Scharen, A.L.; Prescott, J.M.; van Ginkel, M. The Septoria Diseases of Wheat: Concepts and Methods of Disease Management; CIMMYT: Mexico City, Mexico, 1987. [Google Scholar]
- ASD. Fieldspec® 3 User Manual; ASD Document 600540 Rev. J; ASD Inc.: Boulder, CO, USA, 2010; 110p, Available online: http://www.geo-informatie.nl/courses/grs60312/material2017/manuals/600540-JFieldSpec3UserManual.pdf (accessed on 10 June 2023).


| Spectral Channels | Variety | Infectious Background | Variety * Infectious Background | ||||||
|---|---|---|---|---|---|---|---|---|---|
| 2021 | 2022 | 2023 | 2021 | 2022 | 2023 | 2021 | 2022 | 2023 | |
| 490 | * | - | * | * | - | * | - | * | * |
| 520 | * | - | * | * | - | * | - | * | * |
| 550 | * | * | * | * | - | * | - | * | * |
| 575 | * | * | * | * | - | * | - | * | * |
| 660 | * | - | * | * | * | * | - | * | * |
| 700 | * | * | * | * | * | * | - | * | * |
| 720 | * | * | * | * | - | * | - | * | * |
| 845 | * | - | * | - | - | * | - | - | - |
| 920 | * | * | * | - | - | * | - | - | - |
| 1085 | * | * | * | - | - | * | - | - | - |
| 1135 | * | * | * | * | - | * | - | - | - |
| 1215 | * | * | * | * | - | * | - | - | - |
| 1245 | * | * | * | * | - | * | - | - | - |
| 1285 | * | * | * | * | - | * | - | - | - |
| 1445 | - | * | * | - | * | - | - | * | - |
| 1675 | * | * | * | * | - | * | - | * | * |
| 1725 | * | * | * | - | - | * | - | * | * |
| 2005 | * | * | - | - | - | - | - | - | - |
| 2035 | - | * | - | * | * | * | - | * | * |
| 2295 | * | * | - | - | * | - | - | * | - |
| 2345 | - | * | - | - | - | * | - | - | - |
| Variety | Experience Option | Spectral Range, nm | ||||||||
|---|---|---|---|---|---|---|---|---|---|---|
| 490 | 550 | 660 | 720 | 845 | 1445 | 1675 | 2345 | |||
| 2021 | ||||||||||
| Bezostaya 100 | Control | 0.019 b | 0.045 b | 0.021 b | 0.134 b | 0.454 b | 0.057 a | 0.128 b | 0.020 a | |
| Svarog | 0.021 bc | 0.052 c | 0.023 b | 0.152 b | 0.494 b | 0.066 a | 0.146 b | 0.038 a | ||
| Grom | 0.025 d | 0.054 c | 0.027 c | 0.150 b | 0.487 b | 0.058 a | 0.152 b | 0.031 a | ||
| Bezostaya 100 | Infected | 0.015 a | 0.038 a | 0.017 a | 0.111 a | 0.367 a | 0.039 a | 0.098 a | 0.012 a | |
| Svarog | 0.021 bc | 0.051 bc | 0.021 b | 0.150 b | 0.506 b | 0.041 a | 0.140 b | 0.034 a | ||
| Grom | 0.022 c | 0.048 bc | 0.023 b | 0.136 b | 0.472 b | 0.056 a | 0.144 b | 0.039 a | ||
| 2022 | ||||||||||
| Bezostaya 100 | Control | 0.018 ab | 0.043 ab | 0.018 a | 0.128 ab | 0.460 a | 0.053 b | 0.141 a | 0.039 b | |
| Svarog | 0.016 a | 0.042 ab | 0.016 a | 0.127 ab | 0.419 a | 0.037 a | 0.112 a | 0.025 a | ||
| Grom | 0.021 b | 0.043 ab | 0.021 a | 0.122 ab | 0.463 a | 0.043 ab | 0.126 a | 0.030 ab | ||
| Bezostaya 100 | Infected | 0.022 b | 0.053 c | 0.025 b | 0.153 c | 0.466 a | 0.072 c | 0.179 b | 0.051 c | |
| Svarog | 0.019 ab | 0.049 bc | 0.021 a | 0.140 bc | 0.412 a | 0.047 ab | 0.127 a | 0.033 ab | ||
| Grom | 0.017 ab | 0.038 a | 0.017 a | 0.113 ab | 0.422 a | 0.039 a | 0.116 a | 0.026 a | ||
| 2023 | ||||||||||
| Bezostaya 100 | Control | 0.024 b | 0.063 c | 0.030 c | 0.176 cd | 0.440 b | 0.059 a | 0.153 b | 0.036 a | |
| Svarog | 0.022 ab | 0.057 b | 0.023 a | 0.164 bc | 0.500 c | 0.067 a | 0.157 b | 0.032 ab | ||
| Grom | 0.020 a | 0.046 a | 0.021 a | 0.128 a | 0.383 a | 0.074 a | 0.123 a | 0.020 ab | ||
| Bezostaya 100 | Infected | 0.024 b | 0.057 b | 0.027 b | 0.164 bc | 0.477 c | 0.056 a | 0.150 b | 0.033 ab | |
| Svarog | 0.027 c | 0.066 c | 0.029 bc | 0.180 d | 0.536 d | 0.069 a | 0.178 c | 0.045 c | ||
| Grom | 0.023 b | 0.056 b | 0.028 bc | 0.156 b | 0.406 a | 0.076 a | 0.155 b | 0.040 c | ||
| Pathogen | Spectral Range, nm | ||||||||||||
|---|---|---|---|---|---|---|---|---|---|---|---|---|---|
| 490 | 550 | 660 | 700 | 720 | 845 | 1245 | 1445 | 1675 | 2005 | 2035 | 2295 | 2345 | |
| 2021 | |||||||||||||
| Powdery mildew | −0.39 | 0.13 | −0.39 | 0.13 | 0.13 | 0.13 | −0.13 | 0.13 | −0.13 | 0.13 | 0.39 | −0.39 | −0.65 |
| Yellow spot | 0.46 | 0.33 | 0.46 | 0.33 | 0.21 | 0.58 | 0.27 | −0.27 | 0.27 | 0.33 | −0.09 | 0.7 | 0.52 |
| Septoria | 0.49 | 0.2 | 0.49 | 0.2 | 0.09 | 0.31 | 0.26 | −0.37 | 0.26 | 0.26 | −0.37 | 0.66 | 0.54 |
| Yellow rust | −0.46 | −0.62 | −0.46 | −0.62 | −0.62 | −0.31 | −0.62 | −0.93 * | −0.62 | −0.22 | −0.93 * | −0.31 | −0.15 |
| Brown rust | −0.68 | −0.51 | −0.68 | −0.51 | −0.51 | −0.17 | −0.68 | −0.85 * | −0.68 | −0.1 | −0.68 | −0.51 | −0.51 |
| Generalized categories | 0.03 | −0.35 | 0.03 | −0.35 | −0.43 | −0.23 | −0.23 | −0.72 | −0.23 | −0.17 | −0.75 | 0.17 | 0.17 |
| 2022 | |||||||||||||
| Powdery mildew | 0.03 | 0.31 | 0.03 | 0.31 | 0.2 | −0.54 | −0.66 | −0.31 | −0.31 | −0.66 | −0.31 | −0.14 | −0.31 |
| Yellow spot | - | - | - | - | - | - | - | - | - | - | - | - | - |
| Septoria | −0.2 | −0.49 | −0.2 | −0.49 | −0.77 | 0.09 | −0.26 | −0.66 | −0.66 | −0.26 | −0.66 | −0.77 | −0.66 |
| Yellow rust | 0.43 | 0.77 | 0.43 | 0.77 | 0.94 * | 0.03 | 0.14 | 0.54 | 0.54 | 0.14 | 0.54 | 0.71 | 0.54 |
| Brown rust | - | - | - | - | - | - | - | - | - | - | - | - | - |
| Generalized categories | 0.43 | 0.7 | 0.43 | 0.7 | 0.64 | −0.12 | −0.14 | 0.2 | 0.2 | −0.14 | 0.2 | 0.32 | 0.2 |
| 2023 | |||||||||||||
| Powdery mildew | 0.49 | 0.71 | 0.14 | 0.14 | 0.71 | 0.94 * | 0.94 * | −0.49 | 0.6 | −0.14 | −0.09 | −0.14 | 0.2 |
| Yellow spot | 0.2 | −0.09 | 0.14 | 0.14 | −0.09 | −0.2 | −0.2 | 0.31 | −0.09 | 0.09 | 0.6 | 0.26 | 0.49 |
| Septoria | 0.49 | 0.54 | 0.14 | 0.14 | 0.54 | 0.77 | 0.77 | −0.49 | 0.43 | 0.2 | 0.26 | −0.14 | 0.37 |
| Yellow rust | - | - | - | - | - | - | - | - | - | - | - | - | - |
| Brown rust | −0.54 | −0.78 | −0.3 | −0.3 | −0.78 | −0.78 | −0.78 | 0.85 * | −0.3 | −0.3 | 0.17 | 0.34 | −0.07 |
| Generalized categories | 0.6 | 0.49 | 0.43 | 0.43 | 0.49 | 0.6 | 0.6 | 0.14 | 0.71 | 0.03 | 0.77 | 0.54 | 0.83 * |
Disclaimer/Publisher’s Note: The statements, opinions and data contained in all publications are solely those of the individual author(s) and contributor(s) and not of MDPI and/or the editor(s). MDPI and/or the editor(s) disclaim responsibility for any injury to people or property resulting from any ideas, methods, instructions or products referred to in the content. |
© 2024 by the authors. Licensee MDPI, Basel, Switzerland. This article is an open access article distributed under the terms and conditions of the Creative Commons Attribution (CC BY) license (https://creativecommons.org/licenses/by/4.0/).
Share and Cite
Danilov, R.; Kremneva, O.; Sereda, I.; Gasiyan, K.; Zimin, M.; Istomin, D.; Pachkin, A. Study of the Spectral Characteristics of Crops of Winter Wheat Varieties Infected with Pathogens of Leaf Diseases. Plants 2024, 13, 1892. https://doi.org/10.3390/plants13141892
Danilov R, Kremneva O, Sereda I, Gasiyan K, Zimin M, Istomin D, Pachkin A. Study of the Spectral Characteristics of Crops of Winter Wheat Varieties Infected with Pathogens of Leaf Diseases. Plants. 2024; 13(14):1892. https://doi.org/10.3390/plants13141892
Chicago/Turabian StyleDanilov, Roman, Oksana Kremneva, Igor Sereda, Ksenia Gasiyan, Mikhail Zimin, Dmitry Istomin, and Alexey Pachkin. 2024. "Study of the Spectral Characteristics of Crops of Winter Wheat Varieties Infected with Pathogens of Leaf Diseases" Plants 13, no. 14: 1892. https://doi.org/10.3390/plants13141892