
Moderately Elevated Temperature Offsets the Adverse Effects of Waterlogging Stress on Tomato

 , ,
, ,
Abstract
:1. Introduction
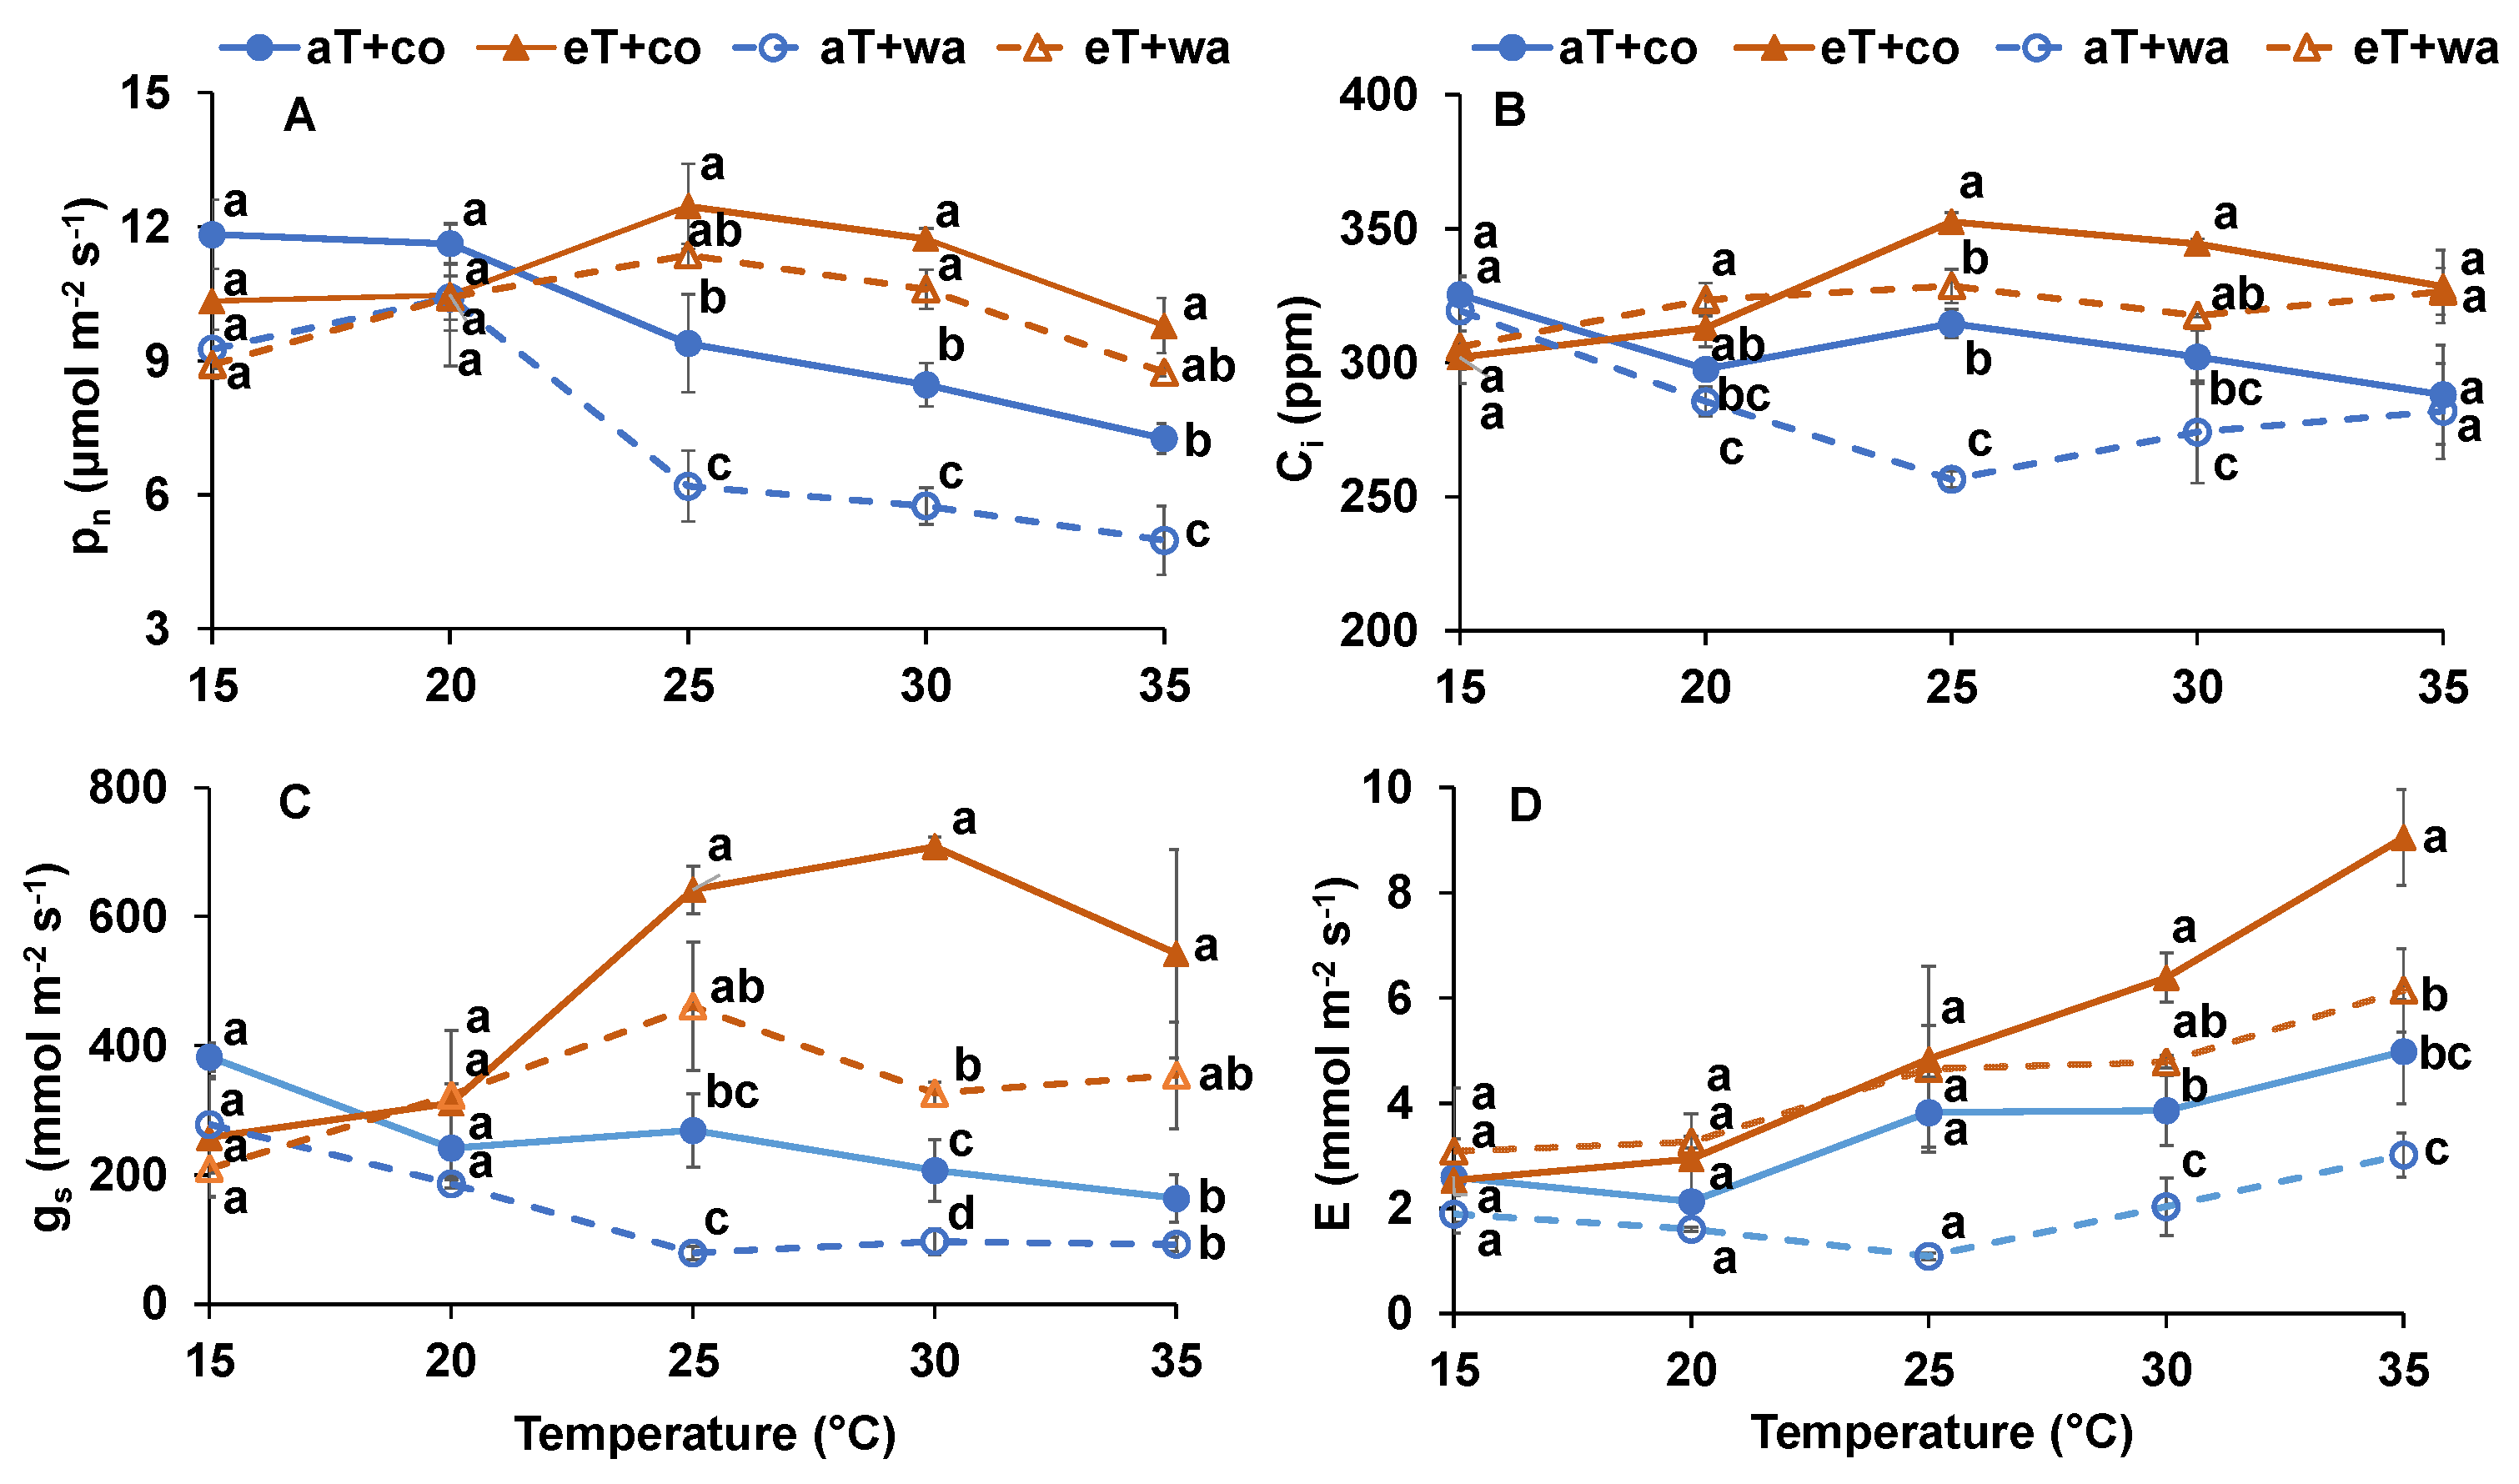
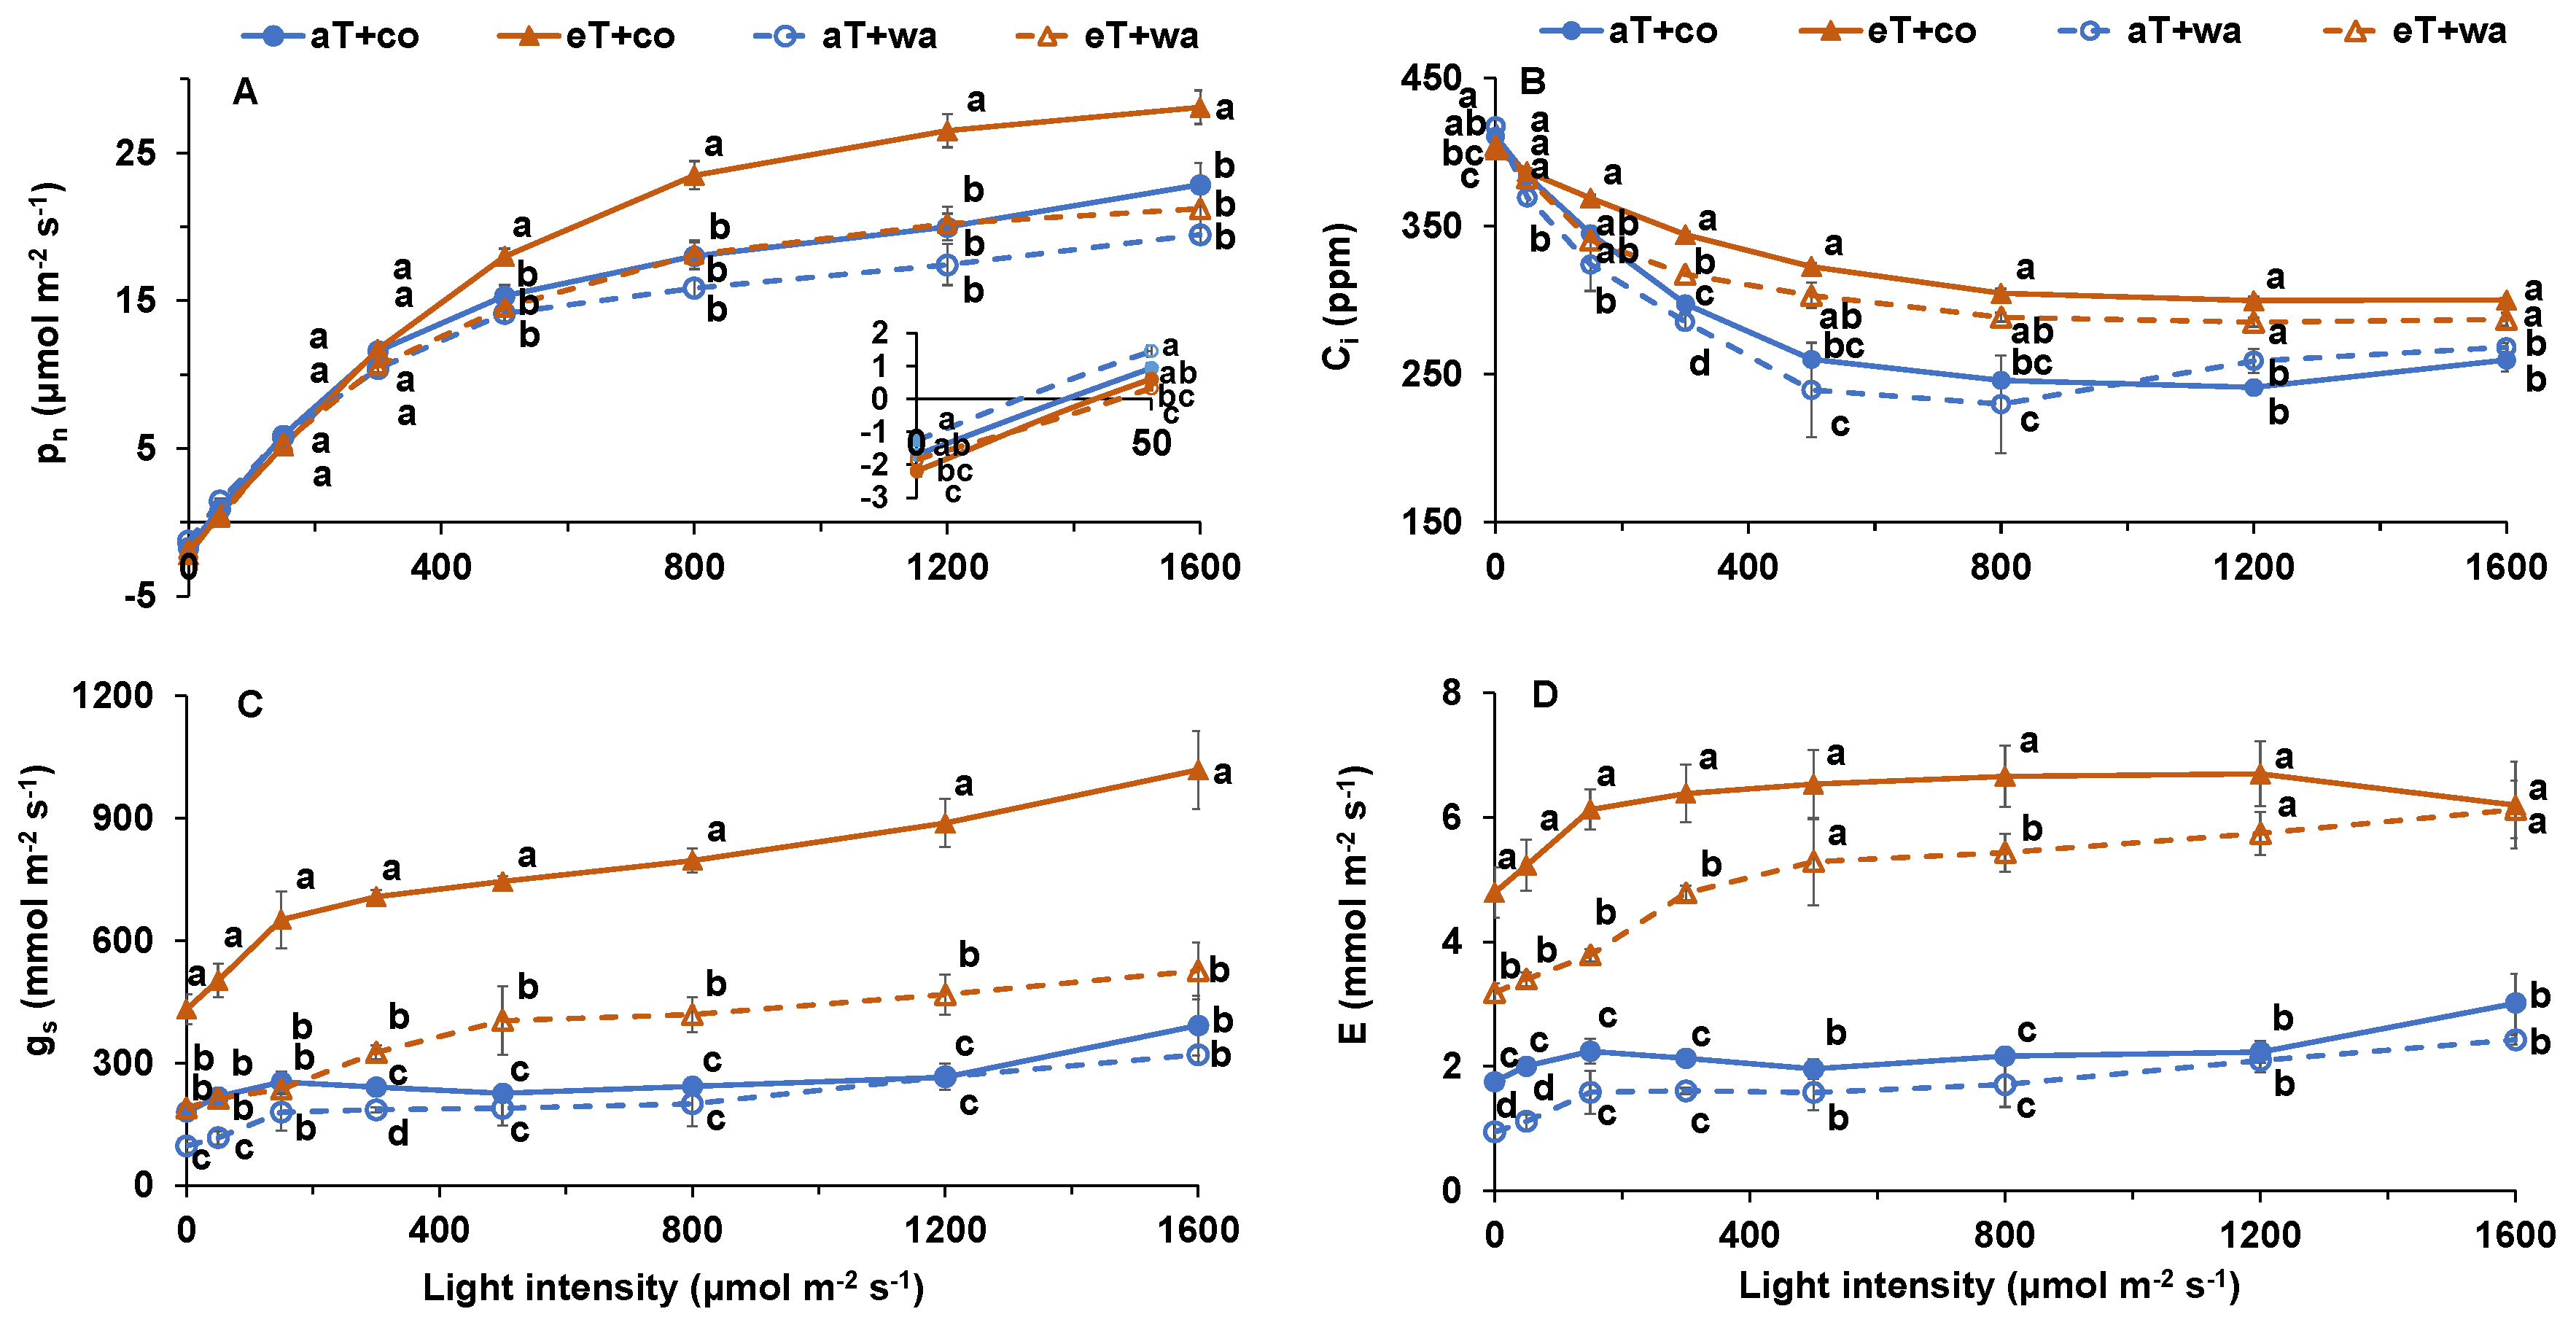
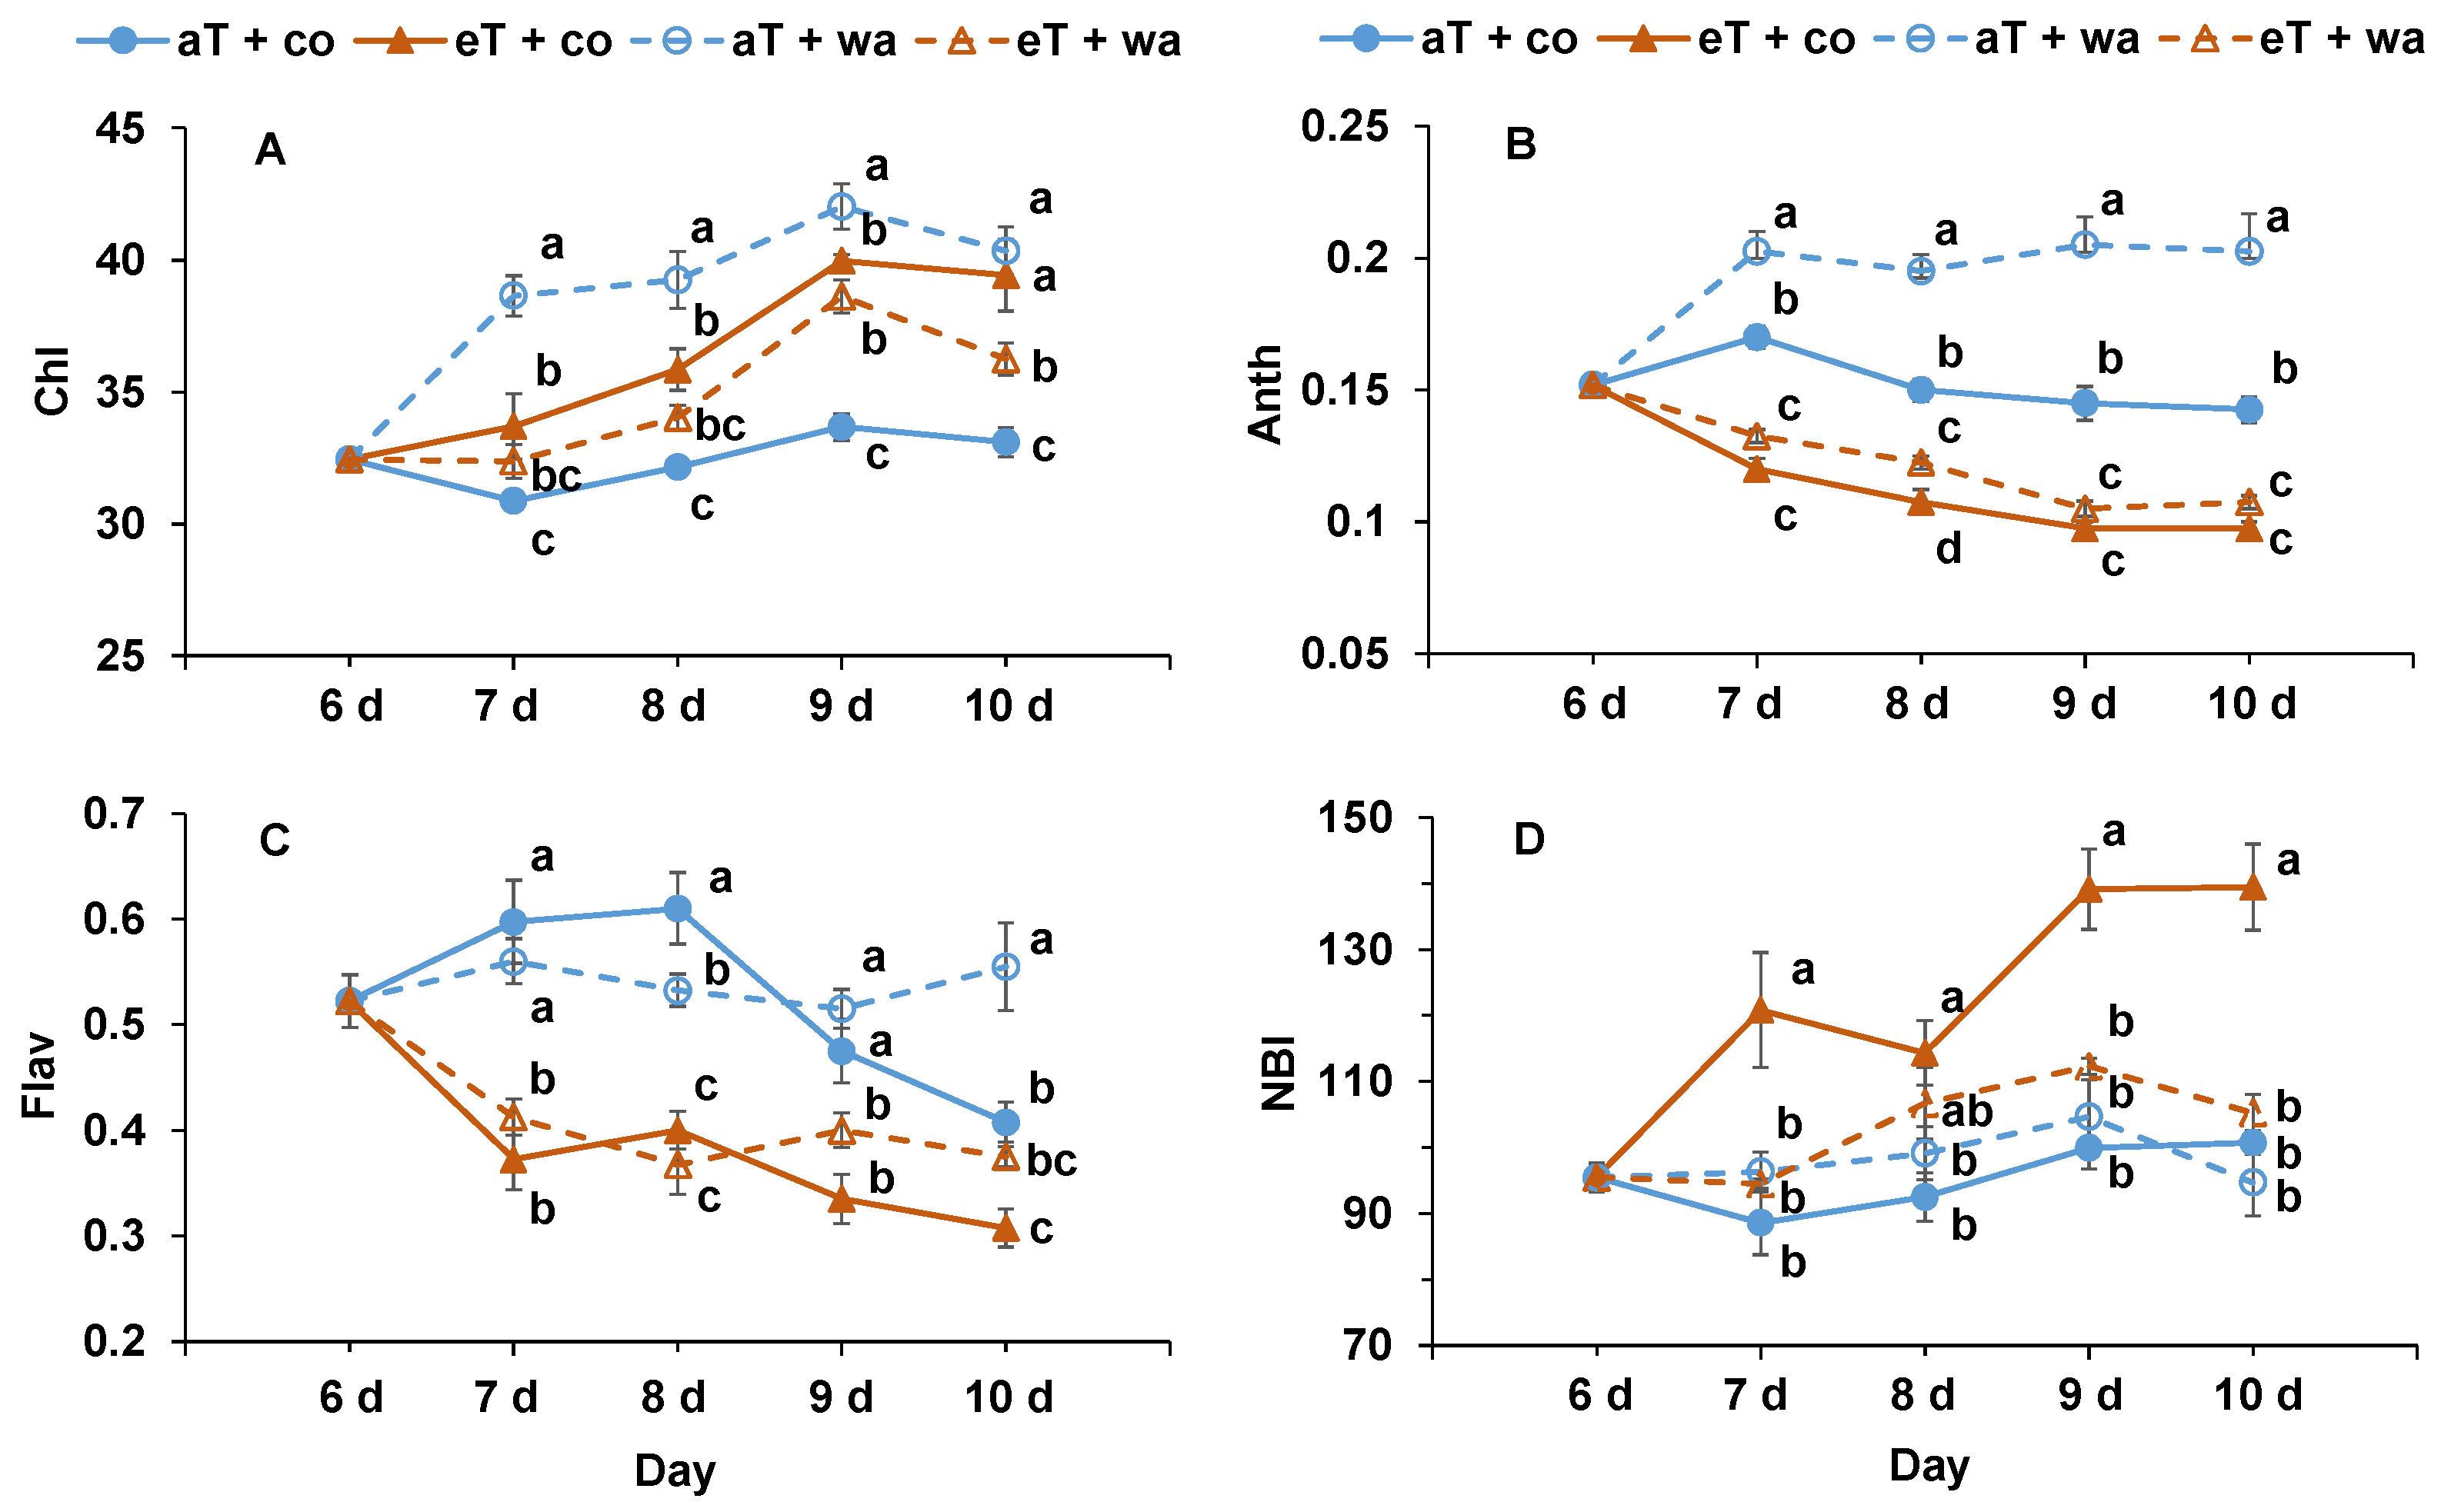
2. Results
3. Discussion
4. Materials and Methods
4.1. Plant Growth and Experimental Design
4.2. Gas Exchange Measurements
4.3. Metabolite Measurements
4.4. Plant Harvest
4.5. Data Analysis
Author Contributions
Funding
Data Availability Statement
Acknowledgments
Conflicts of Interest
References
- IPCC (Intergovernmental Panel on Climate Change). Global Warming of 1.5 °C: An IPCC Special Report on the Impacts of Global Warming of 1.5 °C above Pre-Industrial Levels and Related Global Greenhouse Gas Emission Pathways, in the Context of Strengthening the Global Response to the Threat of Climate Change, Sustainable Development, and Efforts to Eradicate Poverty; Masson-Delmotte, V., Zhai, P., Pörtner, H.-O., Roberts, D., Skea, J., Shukla, P.R., Pirani, A., Moufouma-Okia, W., Péan, C., Pidcoc, R., Eds.; IPCC: Geneva, Switzerland, 2018; 630p. [Google Scholar]
- Secretariat, I.P.; Gullino, M.L.; Albajes, R.; Al-Jboory, I.; Angelotti, F.; Chakraborty, S.; Garrett, K.A.; Hurley, B.P.; Juroszek, P.; Makkouk, K.; et al. Scientific review of the impact of climate change on plant pests. In Proceedings of the Secretariat of the International Plant Protection Convention, Rome, Italy, 3–5 November 2021; FAO: Rome, Italy, 2021. [Google Scholar]
- Allakhverdiev, S.I.; Kreslavski, V.D.; Klimov, P.V.V.; Los, D.A.; Carpentier, R.; Mohanty, P. Heat stress: An overview of molecular responses in photosynthesis. Photosynth. Res. 2008, 98, 541–550. [Google Scholar] [CrossRef] [PubMed]
- Zhou, R.; Wang, Q.; Jiang, F.; Cao, X.; Sun, M.; Liu, M.; Wu, Z. Identification of miRNAs and their targets in wild tomato at moderately and acutely elevated temperatures by high-throughput sequencing and degradome analysis. Sci. Rep. 2016, 6, 33777. [Google Scholar] [CrossRef] [PubMed]
- Bailey-Serres, J.; Fukao, T.; Gibbs, D.J.; Holdsworth, M.J.; Lee, S.C.; Licausi, F.; van Dongen, J.T. Making sense of low oxygen sensing. Trends Plant Sci. 2012, 17, 129–138. [Google Scholar] [CrossRef] [PubMed]
- Mondal, S.; Khan, M.I.R.; Dixit, S.; Cruz, P.C.S.; Septiningsih, E.M.; Ismail, A.M. Growth, productivity and grain quality of AG1 and AG2 QTLs introgression lines under flooding in direct-seeded rice system. Field Crops Res. 2020, 248, 107713. [Google Scholar] [CrossRef]
- Zhao, N.; Li, C.; Yan, Y.; Wang, H.; Wang, L.; Jiang, J.; Chen, S.; Chen, F. The transcriptional coactivator CmMBF1c is required for waterlogging tolerance in Chrysanthemum morifolium. Hortic. Res. 2022, 9, uhac215. [Google Scholar] [CrossRef] [PubMed]
- Sasidharan, R.; Bailey-Serres, J.; Ashikari, M.; Atwell, B.J.; Colmer, T.D.; Fagerstedt, K.; Voesenek, L.A. Community recommendations on terminology and procedures used in flooding and low oxygen stress research. New Phytol. 2017, 214, 1403–1407. [Google Scholar] [CrossRef] [PubMed]
- van Veen, H.; Akman, M.; Jamar, D.C.; Vreugdenhil, D.; Kooiker, M.; van Tienderen, P.; Sasidharan, R. Group VII ethylene response factor diversification and regulation in four species from flood-prone environments. Plant Cell Environ. 2014, 37, 2421–2432. [Google Scholar] [CrossRef] [PubMed]
- Pan, J.; Sharif, R.; Xu, X.; Chen, X. Mechanisms of waterlogging tolerance in plants: Research progress and prospects. Front. Plant Sci. 2021, 11, 627331. [Google Scholar] [CrossRef] [PubMed]
- Kuai, J.; Liu, Z.; Wang, Y.; Meng, Y.; Chen, B.; Zhao, W.; Oosterhuis, D.M. Waterlogging during flowering and boll forming stages affects sucrose metabolism in the leaves subtending the cotton boll and its relationship with boll weight. Plant Sci. 2014, 223, 79–98. [Google Scholar] [CrossRef]
- Yan, K.; Zhao, S.; Cui, M.; Han, G.; Wen, P. Vulnerability of photosynthesis and photosystem I in Jerusalem artichoke (Helianthus tuberosus L.) exposed to waterlogging. Plant Physiol. Biochem. 2018, 125, 239–246. [Google Scholar] [CrossRef]
- Zhou, R.; Yu, X.; Kjær, K.H.; Rosenqvist, E.; Ottosen, C.O.; Wu, Z. Screening and validation of tomato genotypes under heat stress using Fv/Fm to reveal the physiological mechanism of heat tolerance. Environ. Exp. Bot. 2015, 118, 1–11. [Google Scholar] [CrossRef]
- Kołton, A.; Kęska, K.; Czernicka, M. Selection of tomato and cucumber accessions for waterlogging sensitivity through morpho-physiological assessment at an early vegetative stage. Agronomy 2020, 10, 1490. [Google Scholar] [CrossRef]
- Yin, J.; Niu, L.; Li, Y.; Song, X.; Ottosen, C.O.; Wu, Z.; Zhou, R. The effects of waterlogging stress on plant morphology, leaf physiology and fruit yield in six tomato genotypes at anthesis stage. Veg. Res. 2023, 3, 31. [Google Scholar] [CrossRef]
- Zhou, R.; Niu, L.; Yin, J.; Jiang, F.; Wang, Y.; Zhao, T.; Zhu, W. Differences in physiological responses of two tomato genotypes to combined waterlogging and cadmium stresses. Antioxidants 2023, 12, 1205. [Google Scholar] [CrossRef] [PubMed]
- Lin, H.H.; Lin, K.H.; Syu, J.Y.; Tang, S.Y.; Lo, H.F. Physiological and proteomic analysis in two wild tomato lines under waterlogging and high temperature stress. J. Plant Biochem. Biotechnol. 2016, 25, 87–96. [Google Scholar] [CrossRef]
- Mittler, R. Abiotic stress, the field environment and stress combination. Trends Plant Sci. 2006, 11, 15–19. [Google Scholar] [CrossRef] [PubMed]
- Zhou, R.; Yu, X.; Song, X.; Rosenqvist, E.; Wan, H.; Ottosen, C.O. Salinity, waterlogging, and elevated [CO2] interact to induce complex responses in cultivated and wild tomato. J. Exp. Bot. 2022, 73, 5252–5263. [Google Scholar] [CrossRef] [PubMed]
- Pandey, P.; Ramegowda, V.; Senthil-Kumar, M. Shared and unique responses of plants to multiple individual stresses and stress combinations: Physiological and molecular mechanisms. Front. Plant Sci. 2015, 6, 723. [Google Scholar] [CrossRef] [PubMed]
- Niu, L.; Jiang, F.; Yin, J.; Wang, Y.; Li, Y.; Yu, X.; Zhou, R. ROS-mediated waterlogging memory, induced by priming, mitigates photosynthesis inhibition in tomato under waterlogging stress. Front. Plant Sci. 2023, 14, 1238108. [Google Scholar] [CrossRef]
- Barrett-Lennard, E.G. The interaction between waterlogging and salinity in higher plants: Causes, consequences and implications. Plant Soil 2003, 253, 35–54. [Google Scholar] [CrossRef]
- Sasidharan, R.; Voesenek, L.A.; Perata, P. Plant performance and food security in a wetter world. New Phytol. 2021, 229, 5–7. [Google Scholar] [CrossRef] [PubMed]
- Bradford, K.J.; Hsiao, T.C. Stomatal behavior and water relations of waterlogged tomato plants. Plant Physiol. 1982, 70, 1508–1513. [Google Scholar] [CrossRef] [PubMed]
- Haldimann, P.; Feller, U.R.S. Growth at moderately elevated temperature alters the physiological response of the photosynthetic apparatus to heat stress in pea (Pisum sativum L.) leaves. Plant Cell Environ. 2005, 28, 302–317. [Google Scholar] [CrossRef]
- Yuan, M.; Cai, C.; Wang, X.; Li, G.; Wu, G.; Wang, J.; Sun, Y. Warm air temperatures increase photosynthetic acclimation to elevated CO2 concentrations in rice under field conditions. Field Crops Res. 2021, 262, 108036. [Google Scholar] [CrossRef]
- Hikosaka, K.; Ishikawa, K.; Borjigidai, A.; Muller, O.; Onoda, Y. Temperature acclimation of photosynthesis: Mechanisms involved in the changes in temperature dependence of photosynthetic rate. J. Exp. Bot. 2006, 57, 291–302. [Google Scholar] [CrossRef] [PubMed]
- Berry, J.; Bjorkman, O. Photosynthetic response and adaptation to temperature in higher plants. Annu. Rev. Plant Physiol. 1980, 31, 491–543. [Google Scholar] [CrossRef]
- Sharkey, T.D.; Bernacchi, C.J.; Farquhar, G.D.; Singsaas, E.L. Fitting photosynthetic carbon dioxide response curves for C3 leaves. Plant Cell Environ. 2007, 30, 1035–1040. [Google Scholar] [CrossRef]


| Group | Topt (°C) | Rd/ (μmol m−2 s−1) | Φ/ (mol/mol) | LCP/ (μmol m−2 s−1) | Amax/ (μmol m−2 s−1) |
|---|---|---|---|---|---|
| aT + co | 16.7 ± 1.69 b | 1.89 ± 0.064 a | 0.066 ± 0.0053 a | 30.2 ± 1.42 b | 28.8 ± 2.59 ab |
| eT + co | 26.4 ± 1.27 a | 2.19 ± 0.214 a | 0.054 ± 0.0017 b | 41.2 ± 2.93 a | 33.7 ± 0.89 a |
| aT + wa | 19.2 ± 0.32 b | 1.24 ± 0.154 b | 0.060 ± 0.0031 ab | 21.4 ± 2.05 c | 23.3 ± 1.74 b |
| eT + wa | 23.7 ± 1.57 a | 1.96 ± 0.124 a | 0.053 ± 0.0023 b | 37.8 ± 1.31 a | 26.2 ± 0.97 b |
Disclaimer/Publisher’s Note: The statements, opinions and data contained in all publications are solely those of the individual author(s) and contributor(s) and not of MDPI and/or the editor(s). MDPI and/or the editor(s) disclaim responsibility for any injury to people or property resulting from any ideas, methods, instructions or products referred to in the content. |
© 2024 by the authors. Licensee MDPI, Basel, Switzerland. This article is an open access article distributed under the terms and conditions of the Creative Commons Attribution (CC BY) license (https://creativecommons.org/licenses/by/4.0/).
Share and Cite
Wen, J.; Sui, S.; Tian, J.; Ji, Y.; Wu, Z.; Jiang, F.; Ottosen, C.-O.; Zhong, Q.; Zhou, R. Moderately Elevated Temperature Offsets the Adverse Effects of Waterlogging Stress on Tomato. Plants 2024, 13, 1924. https://doi.org/10.3390/plants13141924
Wen J, Sui S, Tian J, Ji Y, Wu Z, Jiang F, Ottosen C-O, Zhong Q, Zhou R. Moderately Elevated Temperature Offsets the Adverse Effects of Waterlogging Stress on Tomato. Plants. 2024; 13(14):1924. https://doi.org/10.3390/plants13141924
Chicago/Turabian StyleWen, Junqin, Shumei Sui, Jie Tian, Yanhai Ji, Zhen Wu, Fangling Jiang, Carl-Otto Ottosen, Qiwen Zhong, and Rong Zhou. 2024. "Moderately Elevated Temperature Offsets the Adverse Effects of Waterlogging Stress on Tomato" Plants 13, no. 14: 1924. https://doi.org/10.3390/plants13141924