
Genetic Characterization and Chemical Identification of Moroccan Cannabis sativa (L.) Seeds: Extraction, and In Vitro and In Silico Biological Evaluation
 , , , , , and
Abstract
:1. Introduction
2. Material and Methods
2.1. Reagents and Materials
2.2. Plant Material
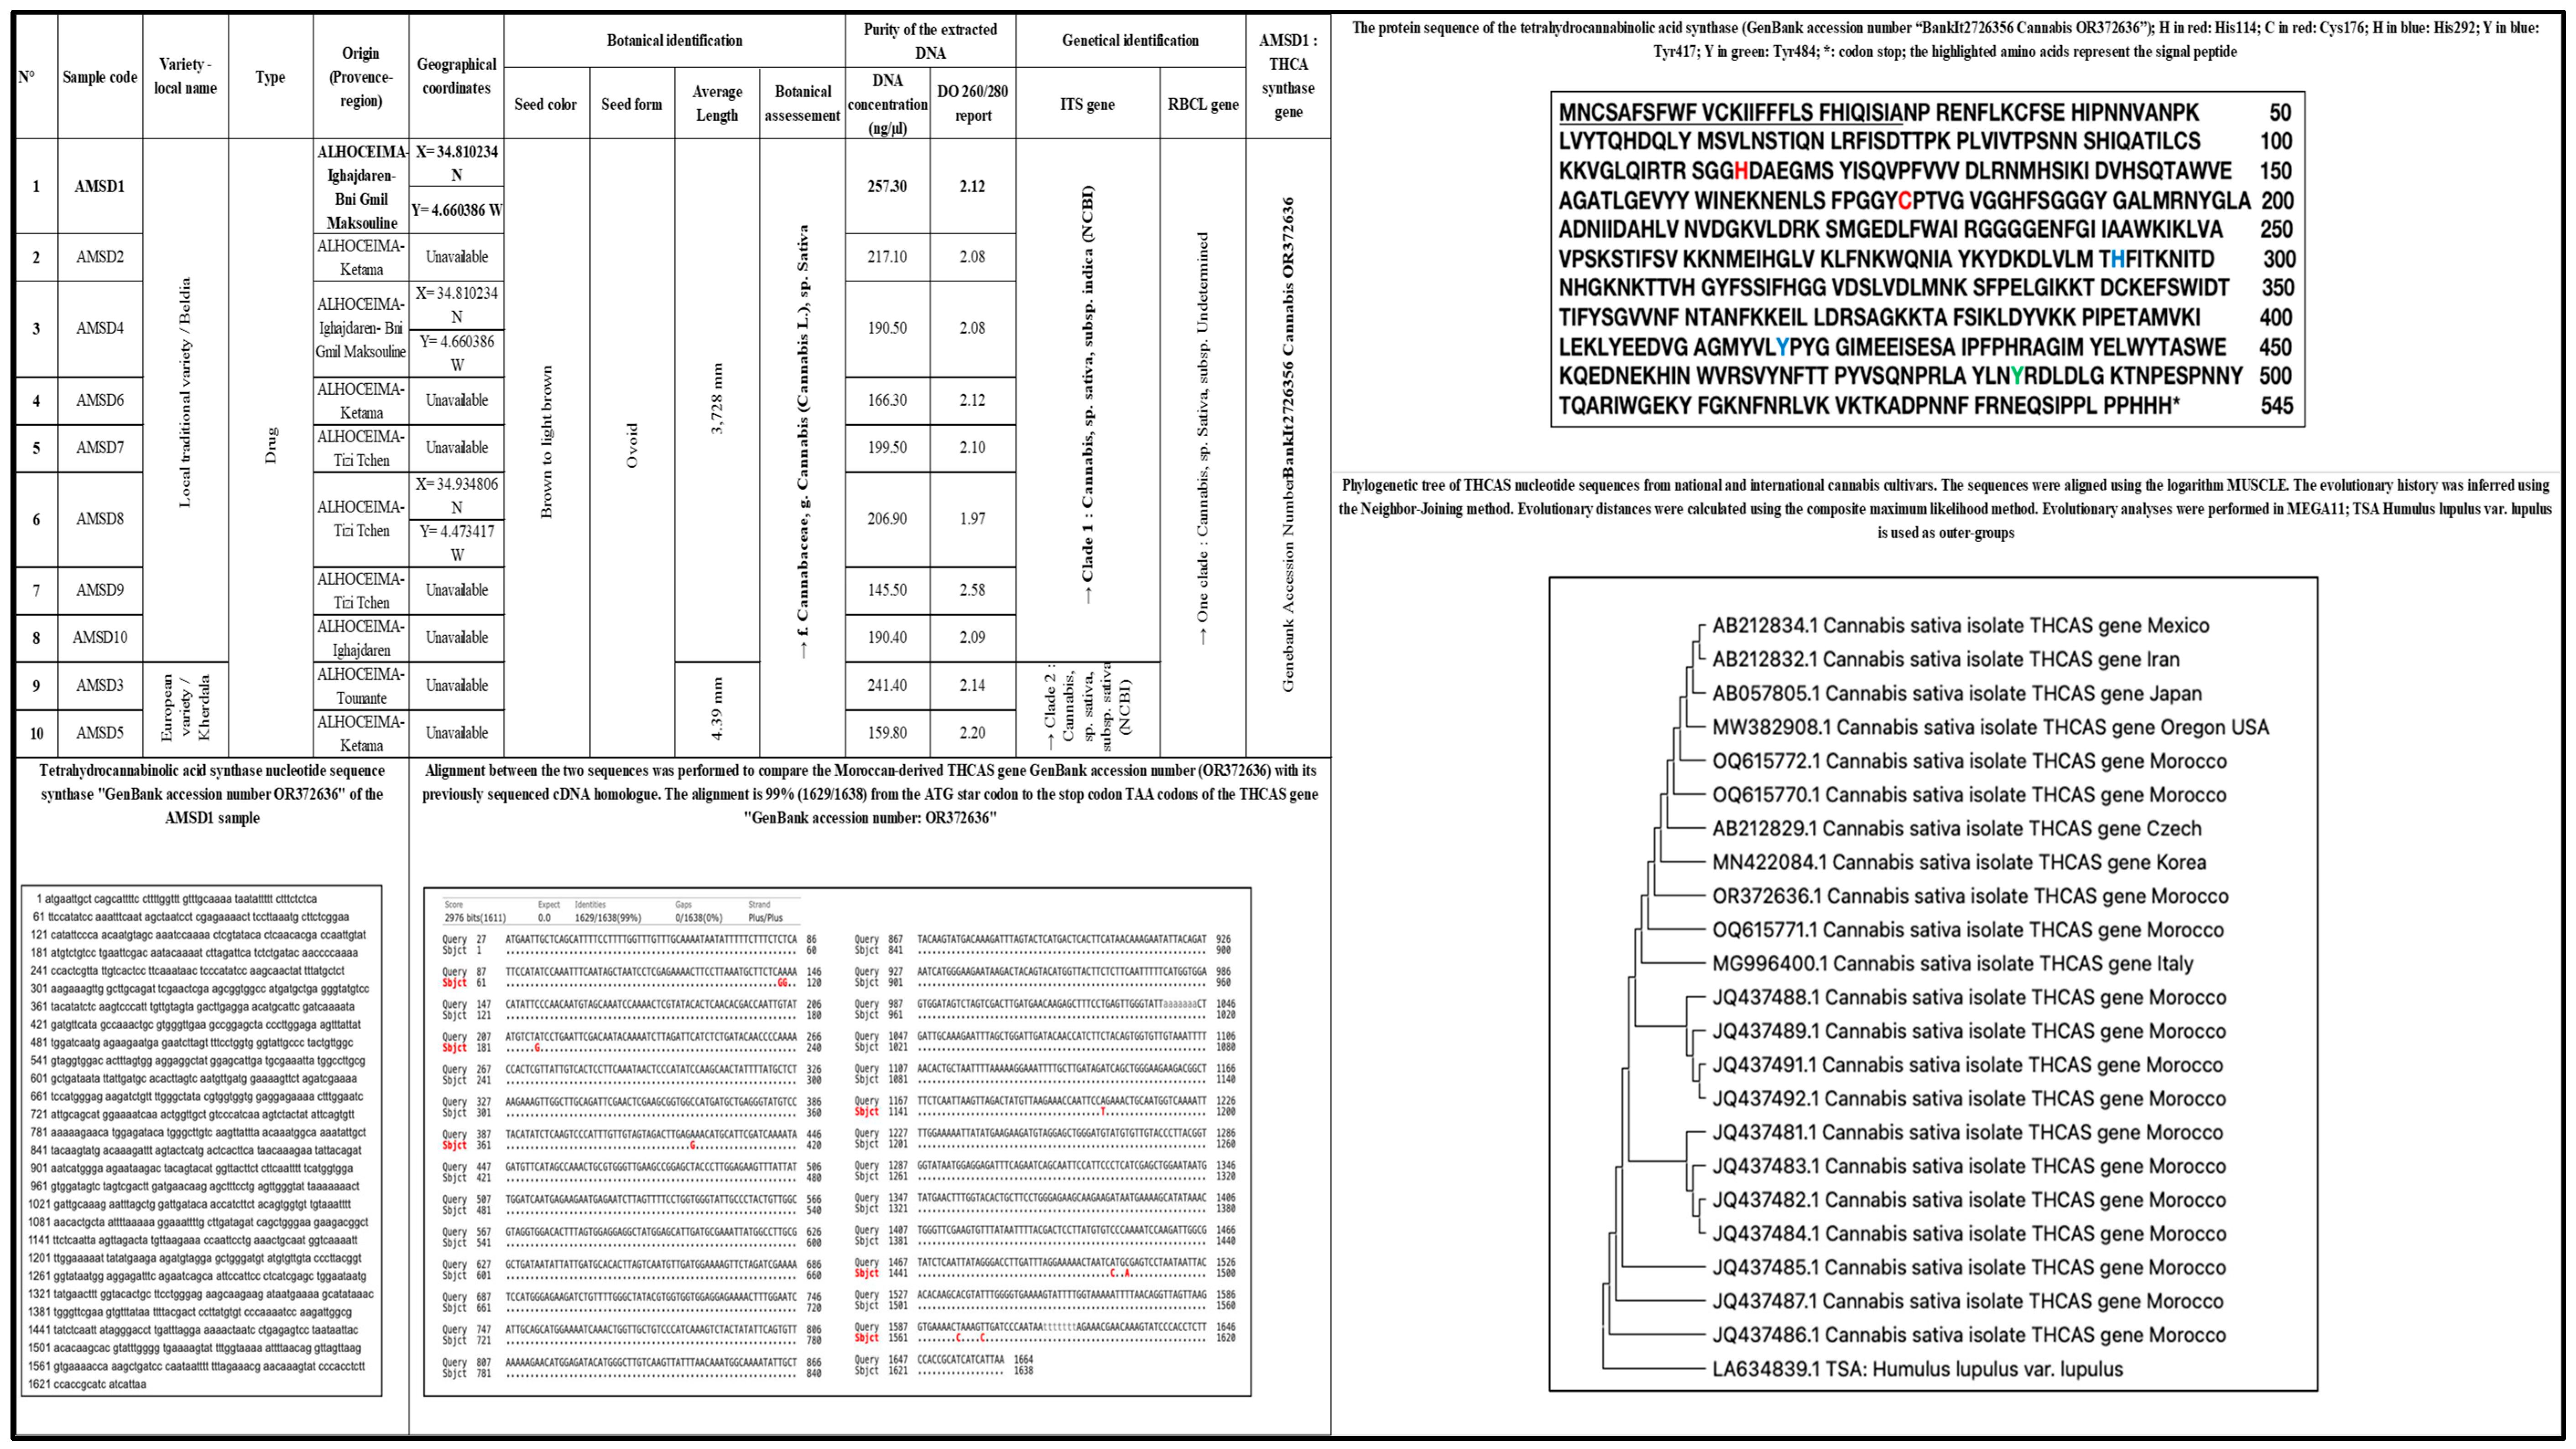
2.3. Identification of Plant Material
2.3.1. Botanical Identification
2.3.2. Genetic Identification
DNA Extraction, Quantification, and Amplification
Sequencing and Data Analysis
2.4. Nutritional Quality of Cannabis Seeds
2.5. Phytochemical Analysis of Cannabis Seeds Extracts
2.5.1. Colorimetric Dosage
Total Polyphenol Content (TPC)
Total Flavonoid Content (TFC)
Total Flavones Content (TF)
Total Anthocyanin Content (TAC)
2.5.2. Chromatographic Analysis
HPLC-ESI-FULL-MS Analysis
Specific GC-MS-MS (TQ) Analysis
2.6. Biological Activities
2.6.1. Antioxidant Effect
2.6.2. Antimicrobial Activity
2.6.3. Cytotoxicity
2.6.4. Antiviral Activity
2.7. Molecular Docking
2.8. Statistical Analysis
3. Results and Discussion
3.1. Plant Identification
3.2. Elemental Nutritional Composition
3.3. Chemical Characterization
3.3.1. Quantitative Phytochemical Screening (TPC, TFC, TF, TAC)
3.3.2. HPLC-ESI-FULL-MS Analysis
3.3.3. Specific GC-MS-MS (TQ) Analysis
3.4. Biological Activities
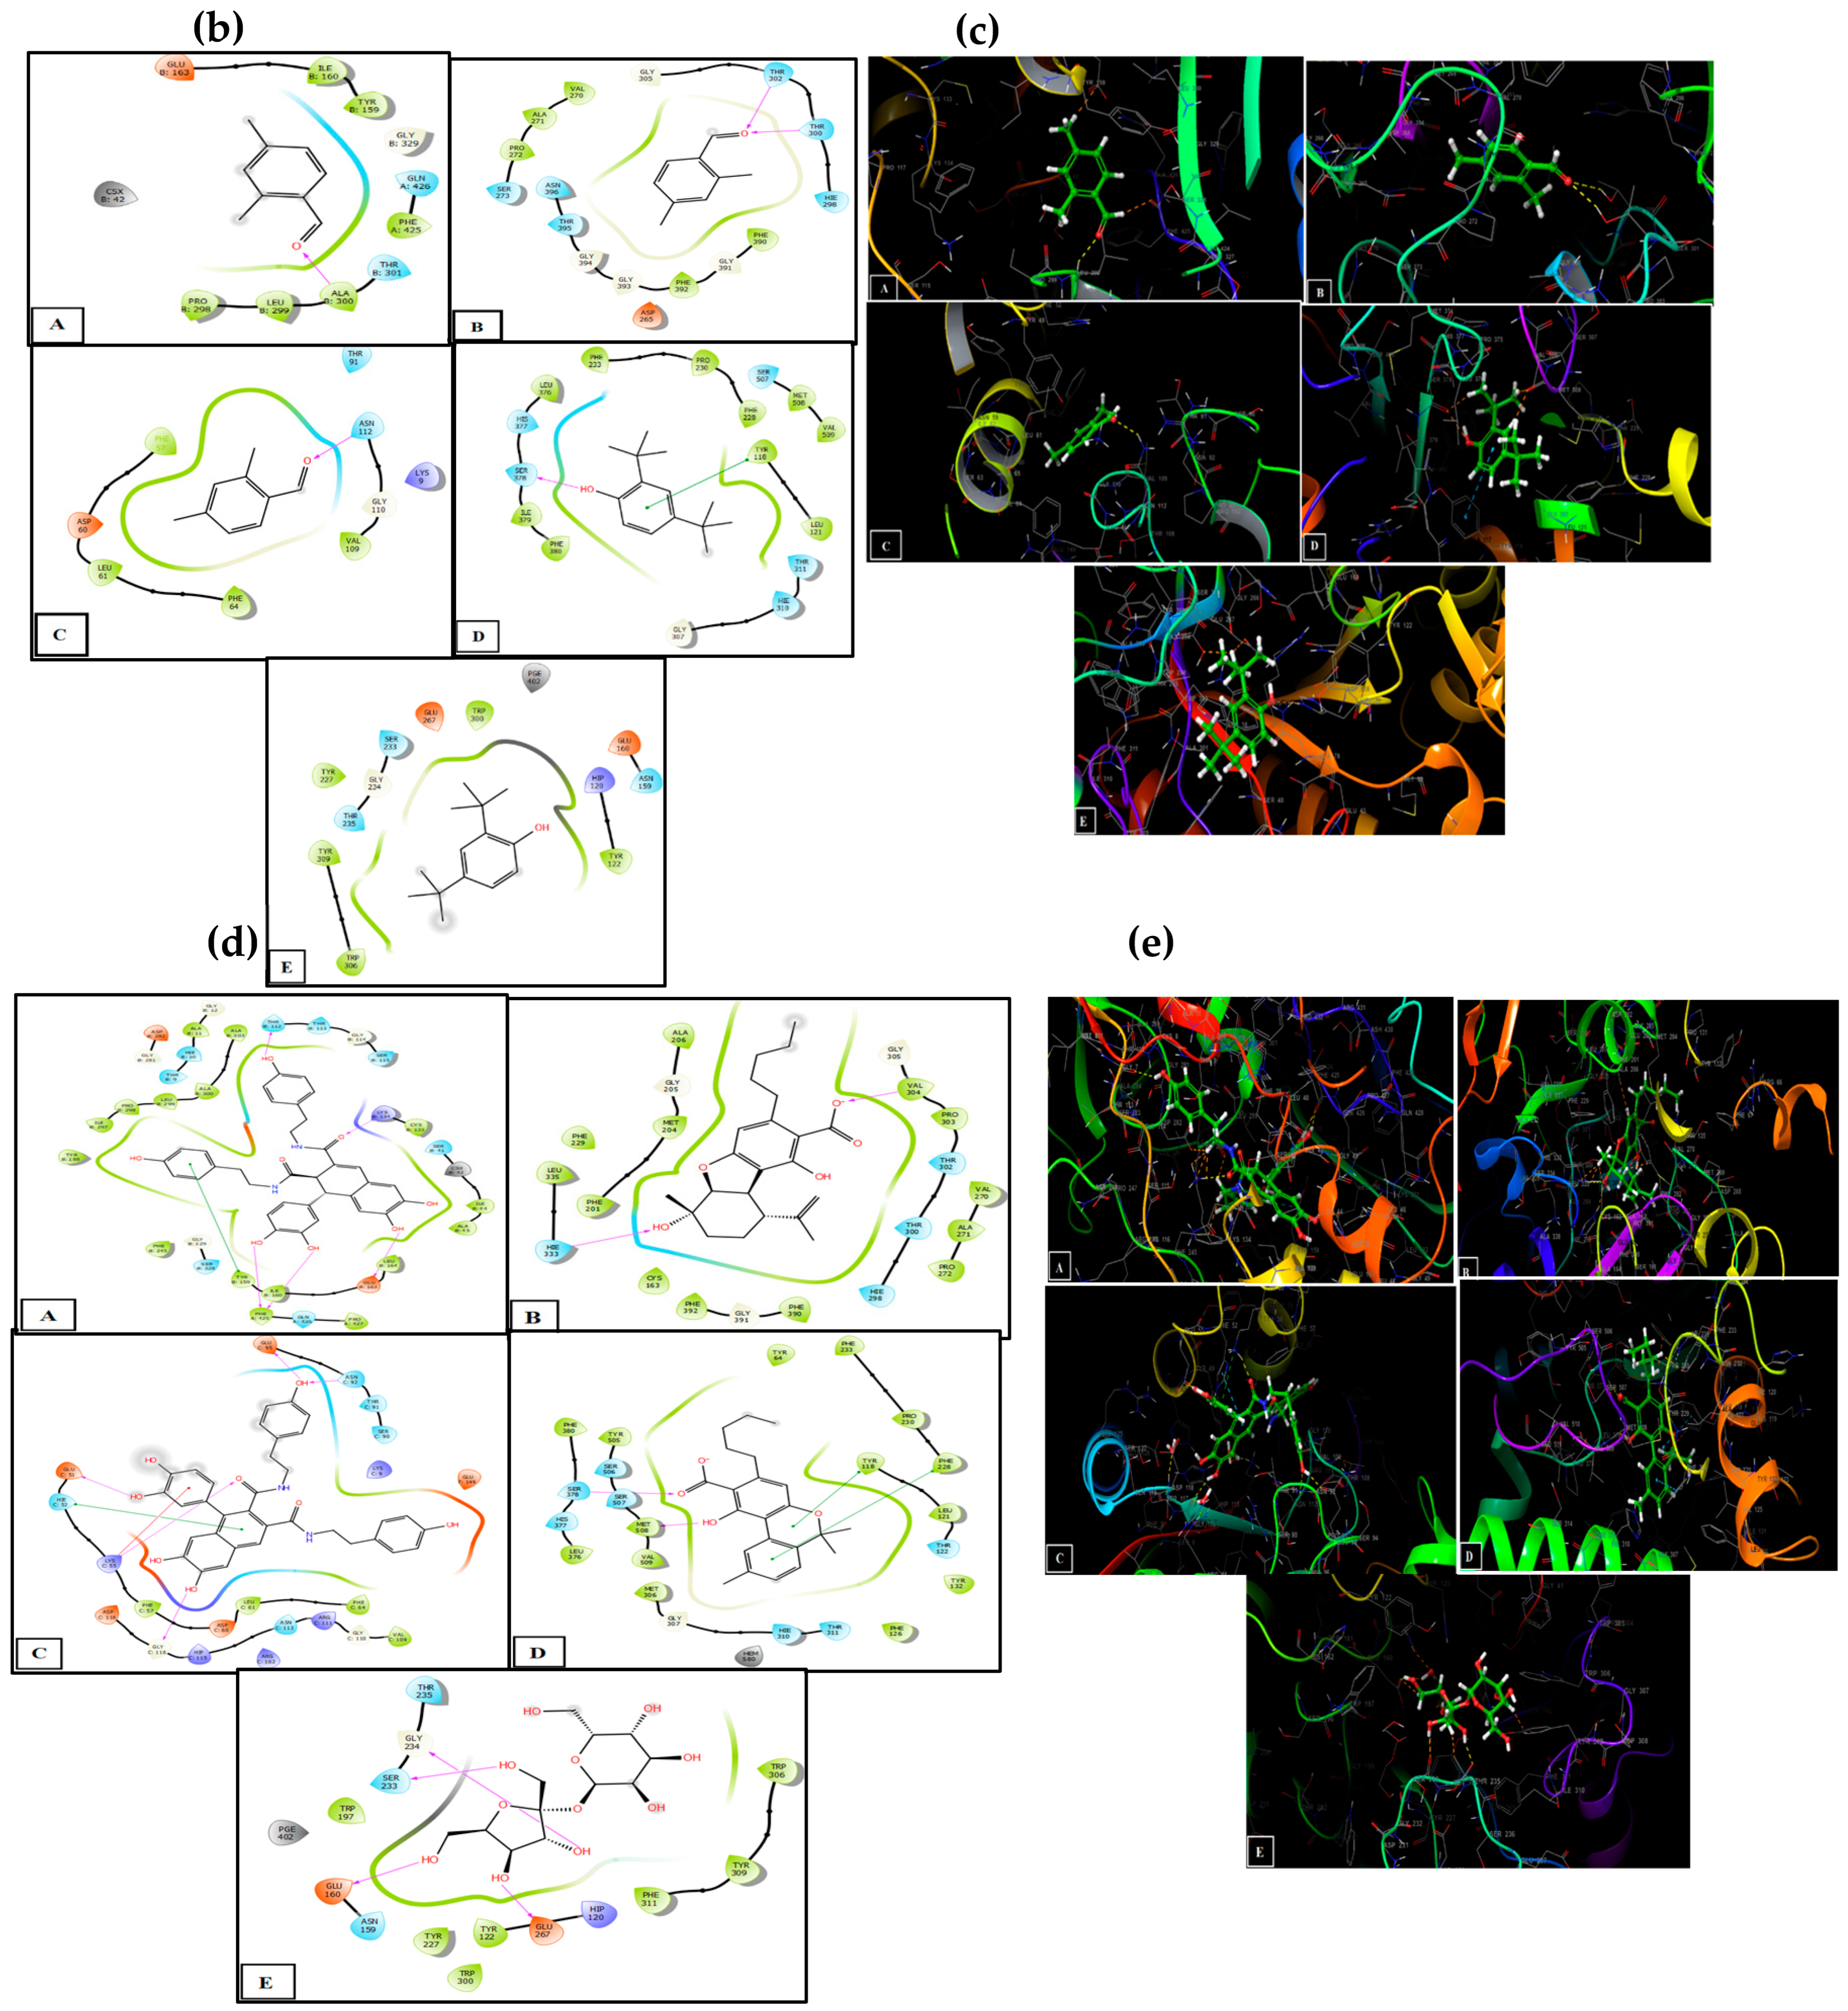
3.5. Molecular Docking in the Active Sites
4. Conclusions
Supplementary Materials
Author Contributions
Funding
Data Availability Statement
Acknowledgments
Conflicts of Interest
References
- BULLETIN OFFICIEL, Dahir N° 1-21-59 Du 3 Hija 1442 (14 Juillet 2021) Portant Promulgation de La Loi N° 13-21 Relative Aux Usages Licites Du Cannabis. 2021. Available online: http://www.sgg.gov.ma/BO/bo_fr/2021/BO_7022_Fr.pdf (accessed on 13 June 2023).
- Thomas, B.; ElSohly, M. The Botany of Cannabis sativa L. In The Analytical Chemistry of Cannabis; Elsevier: Amsterdam, The Netherlands, 2016; pp. 1–26. ISBN 978-0-12-804646-3. [Google Scholar]
- Pollio, A. The Name of Cannabis: A Short Guide for Nonbotanists. Cannabis Cannabinoid Res. 2016, 1, 234–238. [Google Scholar] [CrossRef] [PubMed]
- Small, E.; Cronquist, A. A Practical and Natural Taxonomy for Cannabis. Taxon 1976, 25, 405–435. [Google Scholar] [CrossRef]
- Small, E. Evolution and Classification of Cannabis sativa (Marijuana, Hemp) in Relation to Human Utilization. Bot. Rev. 2015, 81, 189–294. [Google Scholar] [CrossRef]
- Hillig, K.W. A Chemotaxonomic Analysis of Terpenoid Variation in Cannabis. Biochem. Syst. Ecol. 2004, 32, 875–891. [Google Scholar] [CrossRef]
- Clarke, R.; Merlin, M. Cannabis Domestication, Breeding History, Present-Day Genetic Diversity, and Future Prospects. Crit. Rev. Plant Sci. 2016, 35, 293–327. [Google Scholar] [CrossRef]
- Clarke, R.; Merlin, M. Cannabis: Evolution and Ethnobotany; University of California Press: Berkeley, CA, USA, 2016; ISBN 978-0-520-29248-2. [Google Scholar]
- Richard, D.; Senon, J.L. Le Cannabis: Revue Bibliographique Générale. Rev. Toxibase 1995, 1, 1–25. [Google Scholar]
- Devi, V. Comparative Study of Different Extraction Processes for Hemp (Cannabis sativa) Seed Oil Considering Physical, Chemical and Industrial-Scale Economic Aspects. J. Clean. Prod. 2019, 207, 645–657. [Google Scholar] [CrossRef]
- Callaway, J.C. Hempseed as a Nutritional Resource: An Overview. Euphytica 2004, 140, 65–72. [Google Scholar] [CrossRef]
- Leizer, C.; Ribnicky, D.; Poulev, A.; Dushenkov, S.; Raskin, I. The Composition of Hemp Seed Oil and Its Potential as an Important Source of Nutrition. J. Nutraceuticals Funct. Med. Foods 2000, 2, 35–53. [Google Scholar] [CrossRef]
- Saitou, N.; Nei, M. The Neighbor-Joining Method: A New Method for Reconstructing Phylogenetic Trees. Mol. Biol. Evol. 1987, 4, 406–425. [Google Scholar] [CrossRef]
- Tamura, K.; Nei, M.; Kumar, S. Prospects for Inferring Very Large Phylogenies by Using the Neighbor-Joining Method. Proc. Natl. Acad. Sci. USA 2004, 101, 11030–11035. [Google Scholar] [CrossRef] [PubMed]
- Tamura, K.; Stecher, G.; Kumar, S. MEGA11: Molecular Evolutionary Genetics Analysis Version 11. Mol. Biol. Evol. 2021, 38, 3022–3027. [Google Scholar] [CrossRef]
- Stecher, G.; Tamura, K.; Kumar, S. Molecular Evolutionary Genetics Analysis (MEGA) for macOS. Mol. Biol. Evol. 2020, 37, 1237–1239. [Google Scholar] [CrossRef]
- Kojoma, M.; Seki, H.; Yoshida, S.; Muranaka, T. DNA Polymorphisms in the Tetrahydrocannabinolic Acid (THCA) Synthase Gene in “Drug-Type” and “Fiber-Type” Cannabis sativa L. Forensic. Sci. Int. 2006, 159, 132–140. [Google Scholar] [CrossRef] [PubMed]
- Horwitz, W. Official Methods of Analysis of AOAC International, 17th ed.; AOAC International: Gaithersburg, MD, USA, 2000. [Google Scholar]
- Alonso-Esteban, J.I.; Pinela, J.; Ćirić, A.; Calhelha, R.C.; Soković, M.; Ferreira, I.C.F.R.; Barros, L.; Torija-Isasa, E.; Sánchez-Mata, M.d.C. Chemical Composition and Biological Activities of Whole and Dehulled Hemp (Cannabis sativa L.) Seeds. Food Chem. 2022, 374, 131754. [Google Scholar] [CrossRef] [PubMed]
- Singleton, V.L.; Orthofer, R.; Lamuela-Raventós, R.M. Analysis of Total Phenols and Other Oxidation Substrates and Antioxidants by Means of Folin-Ciocalteu Reagent. In Methods in Enzymology; Oxidants and Antioxidants Part A; Academic Press: Cambridge, MA, USA, 1999; Volume 299, pp. 152–178. [Google Scholar]
- Chang, C.-C.; Yang, M.-H.; Wen, H.-M.; Chern, J.-C. Estimation of Total Flavonoid Content in Propolis by Two Complementary Colometric Methods. J. Food Drug Anal. 2002, 10, 3. [Google Scholar] [CrossRef]
- Iqbal, E.; Salim, K.A.; Lim, L.B.L. Phytochemical Screening, Total Phenolics and Antioxidant Activities of Bark and Leaf Extracts of Goniothalamus Velutinus (Airy Shaw) from Brunei Darussalam. J. King Saud Univ.-Sci. 2015, 27, 224–232. [Google Scholar] [CrossRef]
- Tepe, B.; Sokmen, M.; Akpulat, H.A.; Sokmen, A. In Vitro Antioxidant Activities of the Methanol Extracts of Five Allium Species from Turkey. Food Chem. 2005, 92, 89–92. [Google Scholar] [CrossRef]
- Cando, D.; Morcuende, D.; Utrera, M.; Estévez, M. Phenolic-rich extracts from Willowherb (Epilobium hirsutum L.) inhibit lipid oxidation but accelerate protein carbonylation and discoloration of beef patties. Eur. Food Res. Technol. 2014, 238, 741–751. [Google Scholar] [CrossRef]
- Mašković, P.Z.; Manojlović, N.T.; Mandić, A.I.; Mišan, A.Č.; Milovanović, I.L.; Radojković, M.M.; Cvijović, M.S.; Solujić, S.R. Phytochemical Screening and Biological Activity of Extracts of Plant Species Halacsya Sendtneri (Boiss.) Dörfl. Chem. Ind. 2012, 66, 43–51. [Google Scholar] [CrossRef]
- El Moussaoui, A.; Jawhari, F.Z.; Almehdi, A.M.; Elmsellem, H.; Fikri Benbrahim, K.; Bousta, D.; Bari, A. Antibacterial, Antifungal and Antioxidant Activity of Total Polyphenols of Withania Frutescens.L. Bioorganic Chem. 2019, 93, 103337. [Google Scholar] [CrossRef] [PubMed]
- Mooko, T.; Bala, A.; Tripathy, S.; Kumar, C.S.; Mahadevappa, C.P.; Chaudhary, S.K.; Matsabisa, M.G. Cannabis sativa L. Flower and Bud Extracts Inhibited In Vitro Cholinesterases and β-Secretase Enzymes Activities: Possible Mechanisms of Cannabis Use in Alzheimer Disease. Endocr. Metab. Immune Disord.-Drug Targets 2022, 22, 297–309. [Google Scholar] [CrossRef] [PubMed]
- Kwon, P.S.; Oh, H.; Kwon, S.-J.; Jin, W.; Zhang, F.; Fraser, K.; Hong, J.J.; Linhardt, R.J.; Dordick, J.S. Sulfated Polysaccharides Effectively Inhibit SARS-CoV-2 in Vitro. Cell Discov. 2020, 6, 1–4. [Google Scholar] [CrossRef] [PubMed]
- Aboul-Soud, M.A.M.; Ennaji, H.; Kumar, A.; Alfhili, M.A.; Bari, A.; Ahamed, M.; Chebaibi, M.; Bourhia, M.; Khallouki, F.; Alghamdi, K.M.; et al. Antioxidant, Anti-Proliferative Activity and Chemical Fingerprinting of Centaurea Calcitrapa against Breast Cancer Cells and Molecular Docking of Caspase-3. Antioxidants 2022, 11, 1514. [Google Scholar] [CrossRef] [PubMed]
- Herrera-Calderon, O.; Chacaltana-Ramos, L.J.; Huayanca-Gutiérrez, I.C.; Algarni, M.A.; Alqarni, M.; Batiha, G.E.-S. Chemical Constituents, In Vitro Antioxidant Activity and In Silico Study on NADPH Oxidase of Allium sativum L. (Garlic) Essential Oil. Antioxidants 2021, 10, 1844. [Google Scholar] [CrossRef] [PubMed]
- Bouslamti, M.; Metouekel, A.; Chelouati, T.; El Moussaoui, A.; Barnossi, A.E.; Chebaibi, M.; Nafidi, H.-A.; Salamatullah, A.M.; Alzahrani, A.; Aboul-Soud, M.A.M.; et al. Solanum Elaeagnifolium Var. Obtusifolium (Dunal) Dunal: Antioxidant, Antibacterial, and Antifungal Activities of Polyphenol-Rich Extracts Chemically Characterized by Use of In Vitro and In Silico Approaches. Molecules 2022, 27, 8688. [Google Scholar] [CrossRef] [PubMed]
- Yan, J.; Liu, W.; Li, Y.; Lai, H.-L.; Zheng, Y.; Huang, J.-W.; Chen, C.-C.; Chen, Y.; Jin, J.; Li, H.; et al. Functional and Structural Analysis of Pichia Pastoris-Expressed Aspergillus Niger 1,4-β-Endoglucanase. Biochem. Biophys. Res. Commun. 2016, 475, 8–12. [Google Scholar] [CrossRef]
- Talukdar, R.; Padhi, S.; Rai, A.K.; Masi, M.; Evidente, A.; Jha, D.K.; Cimmino, A.; Tayung, K. Isolation and Characterization of an Endophytic Fungus Colletotrichum Coccodes Producing Tyrosol From Houttuynia Cordata Thunb. Using ITS2 RNA Secondary Structure and Molecular Docking Study. Front. Bioeng. Biotechnol. 2021, 9, 650247. [Google Scholar] [CrossRef]
- Mello, I.C.T.; Ribeiro, A.S.D.; Dias, V.H.G.; Silva, R.; Sabino, B.D.; Garrido, R.G.; Seldin, L.; de Moura Neto, R.S. A Segment of rbcL Gene as a Potential Tool for Forensic Discrimination of Cannabis sativa Seized at Rio de Janeiro, Brazil. Int. J. Leg. Med. 2016, 130, 353–356. [Google Scholar] [CrossRef]
- Anabalón, L.; Solano, J.; Encina-Montoya, F.; Bustos, M.; Figueroa, A.; Gangitano, D. Cannabis Seeds Authentication by Chloroplast and Nuclear DNA Analysis Coupled with High-Resolution Melting Method for Quality Control Purposes. Cannabis Cannabinoid Res. 2022, 7, 548–556. [Google Scholar] [CrossRef] [PubMed]
- Bachir, F.; Eddouks, M.; Arahou, M.; Fekhaoui, M. Origin, Early History, Cultivation, and Characteristics of the Traditional Varieties of Moroccan Cannabis sativa L. Cannabis Cannabinoid Res. 2022, 7, 603–615. [Google Scholar] [CrossRef] [PubMed]
- Sirikantaramas, S.; Morimoto, S.; Shoyama, Y.; Ishikawa, Y.; Wada, Y.; Shoyama, Y.; Taura, F. The gene controlling marijuana psychoactivity: Molecular cloning and heterologous expression of Delta1-tetrahydrocannabinolic acid synthase from Cannabis sativa L. Biol. Chem. 2004, 279, 39767–39774. [Google Scholar] [CrossRef] [PubMed]
- Shoyama, Y.; Tamada, T.; Kurihara, K.; Takeuchi, A.; Taura, F.; Arai, S.; Blaber, M.; Shoyama, Y.; Morimoto, S.; Kuroki, R. Structure and function of ∆1-tetrahydrocannabinolic acid (THCA) synthase, the enzyme controlling the psychoactivity of Cannabis sativa. Mol. Biol. 2012, 423, 96–105. [Google Scholar] [CrossRef] [PubMed]
- Badrana, F.; Mokhtari, A.; Safini, N.; Soulaymani, A.; Fahime, E.E.; Amri, H.E. Systematic Review and Meta-Analysis for the Biotechnological Production of THC in Morocco. E3S Web Conf. 2021, 319, 02012. [Google Scholar] [CrossRef]
- Taura, F.; Morimoto, S.; Shoyama, Y.; Mechoulam, S. First direct evidence for the mechanism of.Delta.1-tetrahydrocannabinolic acid biosynthesis. Am. Chem. Soc. 1995, 117, 9766–9767. [Google Scholar] [CrossRef]
- Alaoui, M.A.E.; Melloul, M.; Hakki, E.E.; Udupa, S.M.; Stambouli, H.; Bouri, A.E.; Amine, S.A.; Soulaymani, A.; Fahime, E.E. Study of Moroccan Cannabis sativa DNA Polymorphism in the THCA Synthase Gene from Seized Moroccan Cannabis Resin (Hashish). J. Plant Biol. Res. 2016, 5, 1–11. [Google Scholar]
- Badrana, F.; Fahime, E.M.E.; Mokhtari, A.; Soulaymani, A.; Safini, N.; Chaouni, B.; Malka, G.; Amri, H.E. In Silico and in Vitro Analysis of THCA Synthase Gene in Moroccan Cannabis Sativa, L. F1000Research 2022, 11, 840. [Google Scholar] [CrossRef]
- Regulation (EC) No 1924/2006 of the European Parliament and of the Council of 20 December 2006 on Nutrition and Health Claims Made on Foods. 2006, Volume 404. Available online: http://data.europa.eu/eli/reg/2006/1924/oj (accessed on 13 June 2023).
- Leonard, W.; Zhang, P.; Ying, D.; Fang, Z. Hempseed in Food Industry: Nutritional Value, Health Benefits, and Industrial Applications. Compr. Rev. Food Sci. Food Saf. 2020, 19, 282–308. [Google Scholar] [CrossRef]
- Menezes, I.M.N.R.; Nascimento, P.d.A.; Yamamoto, C.I.; Oliveira, A. Evaluation of Trace Elements in Cannabis Products. J. Food Compos. Anal. 2022, 113, 104721. [Google Scholar] [CrossRef]
- Babiker, E.E.; Uslu, N.; Al Juhaimi, F.; Mohamed Ahmed, I.A.; Ghafoor, K.; Özcan, M.M.; Almusallam, I.A. Effect of Roasting on Antioxidative Properties, Polyphenol Profile and Fatty Acids Composition of Hemp (Cannabis sativa L.) Seeds. LWT 2021, 139, 110537. [Google Scholar] [CrossRef]
- Faugno, S.; Piccolella, S.; Sannino, M.; Principio, L.; Crescente, G.; Baldi, G.M.; Fiorentino, N.; Pacifico, S. Can agronomic practices and cold-pressing extraction parameters affect phenols and polyphenols content in hempseed oils? Ind. Crops Prod. 2019, 130, 511–519. [Google Scholar] [CrossRef]
- Frassinetti, S.; Moccia, E.; Caltavuturo, L.; Gabriele, M.; Longo, V.; Bellani, L.; Giorgi, G.; Giorgetti, L. Nutraceutical Potential of Hemp (Cannabis sativa L.) Seeds Sprouts. Food Chem. 2018, 262, 56–66. [Google Scholar] [CrossRef] [PubMed]
- Benkirane, C.; Mansouri, F.; Ben Moumen, A.; Taaifi, Y.; Melhaoui, R.; Caid, H.S.; Fauconnier, M.-L.; Elamrani, A.; Abid, M. Phenolic profiles of non-industrial hemp (Cannabis sativa L.) seed varieties collected from four different Moroccan regions. Int. J. Food Sci. Technol. 2023, 58, 1367–1381. [Google Scholar] [CrossRef]
- Smeriglio, A.; Galati, E.M.; Monforte, M.T.; Lanuzza, F.; D’Angelo, V.; Circosta, C. Polyphenolic Compounds and Antioxidant Activity of Cold-Pressed Seed Oil from Finola Cultivar of Cannabis sativa L. Phytother. Res. 2016, 30, 1298–1307. [Google Scholar] [CrossRef] [PubMed]
- Njeru, S.N.; Muema, J.M. In Vitro Cytotoxicity of Aspilia Pluriseta Schweinf. Extract Fractions. BMC Res. Notes 2021, 14, 57. [Google Scholar] [CrossRef]
- François, N.; Charity, N.; Orina, F.; Meryl, C.; Nicholas, A.; Jones, O.; Kigondu, E. Antimycobacterial Activities, Cytotoxicity and Phytochemical Screening of Extracts for Three Medicinal Plants Growing in Kenya. J. Med. Plants Res. 2020, 14, 129–143. [Google Scholar] [CrossRef]
- Uthaya Kumar, S.; Subramanion, J.L.; Kavitha, N.; Chen, Y.; Kanwar, J.; Sasidharan, S. Genoprotection and Cytotoxicity of Cassia Surattensis Seed Extract on Vero Cell Evaluated by Comet and Cytotoxicity Assays. Proc. Natl. Acad. Sci. USA India Sect. B Biol. Sci. 2016, 88, 313–320. [Google Scholar] [CrossRef]

| Elements | Ca | Cr | Cu | Fe | K | Mg | Mn | Mo | Na | P | Zn |
|---|---|---|---|---|---|---|---|---|---|---|---|
| Nutrient concentration (mg/kg) | 573.408 | <LOD | <LOD | 25.328 | 3755.999 | 727.008 | 26.974 | <LOD | 309.504 | 2085.695 | 47.615 |
| Intake | 5.791 | - | - | 0.256 | 37.936 | 7.343 | 0.272 | - | 3.126 | 21.066 | 0.481 |
| Recommended daily intake (FDA) | 1300 | - | - | 18 | 4700 | 420 | 2.3 | - | - | 1250 | 11 |
| Nutritional % | 0.445 | ND | ND | 1.421 | 0.807 | 1.748 | 11.846 | ND | - | 1.685 | 4.372 |
| Cannabis Seed Extracts | ||||||||||
|---|---|---|---|---|---|---|---|---|---|---|
| AMSD1 Hexane | AMSD1 Diethyl-ether | AMSD1 Acetone | AMSD1 Chlorofom | AMSD1 Ethanol | AMSD1 Methanol | AMSD1 Water | ||||
| Extracts TPC, TFC, TF, and TAC concentration | ||||||||||
| TPC (mg EGA/g) | 322.750 ± 28.70 | 358.260 ± 20.96 | 291.160 ± 15.37 | 128.410 ± 93.86 | 395.390 ± 104.88 | 307.250 ± 89.49 | 72.470 ± 1.74 | |||
| TFC (mg EQ/g) | 24.004 ± 0.62 | 65.052 ± 8.73 | 58.049 ± 2.64 | 69.809 ± 3.60 | 54.266 ± 2.02 | 69.247 ± 2.32 | 14.753 ± 5.81 | |||
| TF (mg EQ/g) | 16.663 ± 3.50 | 60.371 ± 0.00 | 27.899 ± 2.46 | 53.592 ± 14.44 | 11.382 ± 0.39 | 19.996 ± 0.90 | 0.146 ± 0.68 | |||
| TAC (mg/L) | 0.004 ± 0.07 | 0.028 ± 0.08 | 0.150 ± 0.12 | 0.039 ± 0.08 | 0.534 ± 0.93 | 0.055 ± 0.05 | 0.038 ± 0.45 | |||
| Antioxidant activity (TAC: (µg EAA/mg). DPPH: IC50 µg/mL and FRAP: EC50 µg/mL) | Positive controls | |||||||||
| BHT | Quercetine | Ascorbic acid | ||||||||
| TAC | 243.430 ± 3.60 a | 235.478 ± 0.45 a | 253.611 ± 23.39 a | 246.612 ± 9.90 a | 300.694 ± 92.68 a | 133.677 ± 5.85 b | 187.440 ± 82.78 b | 691.47 ± 2.81 c | 483.63 ± 7.59 c | 943.83 ± 10.41 d |
| DPPH | 50 ± 12.73 a | 33.76 ± 0.35 a | 29.82 ± 0.26 a | 136 ± 14.14 b | 31.63 ± 0.53 a | 20.28 ± 3.25 a | 209.63 ± 12.05 c | 17.68 ± 2.54 a | 24.54 ± 2.89 a | 29.16 ± 0.96 a |
| FRAP | 520.5 ± 13.44 b | 236.63 ± 5.13 a | 159.5 ± 13.44 a | 165.99 ± 7.09 a | 300.61 ± 14.69 a | 797.12 ± 18.55 c | 484 ± 18.38 b | 256.44 ± 13.53 a | 186 ± 8.49 a | 258.45 ± 11.94 a |
| Cytotoxicity: CC50 (µg/mL) | ||||||||||
| 200 | 200 | 200 | 200 | >200 | 200 | 25 | ||||
| N° | Proposed Compounds | Rt (min) | MS (m/z) | MS (Fragments) | Area % per Seeds Extract Type | Match Factor (%) | ||||||
|---|---|---|---|---|---|---|---|---|---|---|---|---|
| AMSD1-Hexane | AMSD1 -Diethyl ether | AMSD1-Acetone | AMSD1-Chlorofom | AMSD1-Ethanol | AMSD1-Methanol | AMSD1-Wather | ||||||
| 1 | Nd | 2.47 | 658.2 | 328.9/279.9 | - | - | - | - | - | - | 3.1 | |
| 2 | Tetrasaccharide hydrate | 3.7 | 683.2 | 439.1/341.1 | - | - | 1.26 | 1.5 | 10.25 | 12.35 | 6.84 | 60 |
| 3 | Nd | 5.8 | 431.9 | 334.2/194 | - | - | - | 1.32 | - | - | 8.36 | |
| 4 | nd | 15 | 390.2 | 292.1/194 | - | - | 3.42 | - | - | - | 5.74 | |
| 5 | Cannabisin B | 17.51 | 595.4 | 494.1/396.1/298.1 | - | - | 15.2 | - | 18.41 | 18.36 | - | 61 |
| 6 | Cannabisin C | 21.55 | 609.1 | 363.2/265.1 | - | - | - | - | 2.14 | - | - | 70 |
| 7 | Cannabisin A | 22.77 | 593.7 | 409.1/356.1/311.2 | - | - | - | - | 2.1 | - | - | 70 |
| 8 | Phosphatidylinositol | 26.89 | 833.6 | nd | 25.11 | 21.36 | - | - | - | - | - | |
| 9 | Cannabielsoic Acid A | 27.03 | 373.5 | 299.2/194.2 | - | - | 12.65 | 10.13 | - | 15.74 | - | 61 |
| 10 | Cannabinolic Acid, | 29.26 | 353.2 | nd | 23.05 | 23.85 | 18.35 | 17.25 | 15.36 | 10.36 | 30.84 | |
| 11 | Cannabisin B [isomer 1] | 30.44 | 595.4 | 395.1/298.1 | 20.28 | 26.18 | 20.13 | 25.13 | - | 20.04 | 25.36 | 60 |
| 12 | Cannabidiolic acid, CBDA | 30.93 | 357.1 | 301.2 | 20.3 | 19.2 | 17.85 | 30.1 | 20.35 | 10.09 | - | 60 |
| 13 | Dihydrocannabinol | 32.37 | 311.1 | 279.2 | 10.75 | 8.12 | 8.23 | 7.3 | 18.14 | 10.9 | - | 60 |
| Compund | MS (m/z) | MS Fragments (m/z) | Match Factor (%) | |||
|---|---|---|---|---|---|---|
| Number | Chemical Name | Cas Number | Chemical Classification | |||
| 1 | Phytane | 638-36-8 | Isoprenoid alkane | 282 | 57, 85, 99, 127, 141, 183, 197, 282 | 93 |
| 2 | Benzenepropanoic acid Or Methyl 3-(3,5-di-tert-butyl-4-hydroxyphenyl) propionate | 6386-38-5 | Alkylbenzene (class of phenolic esters) | 292 | 57, 91, 117, 147, 203, 219, 277, 292 | 69 |
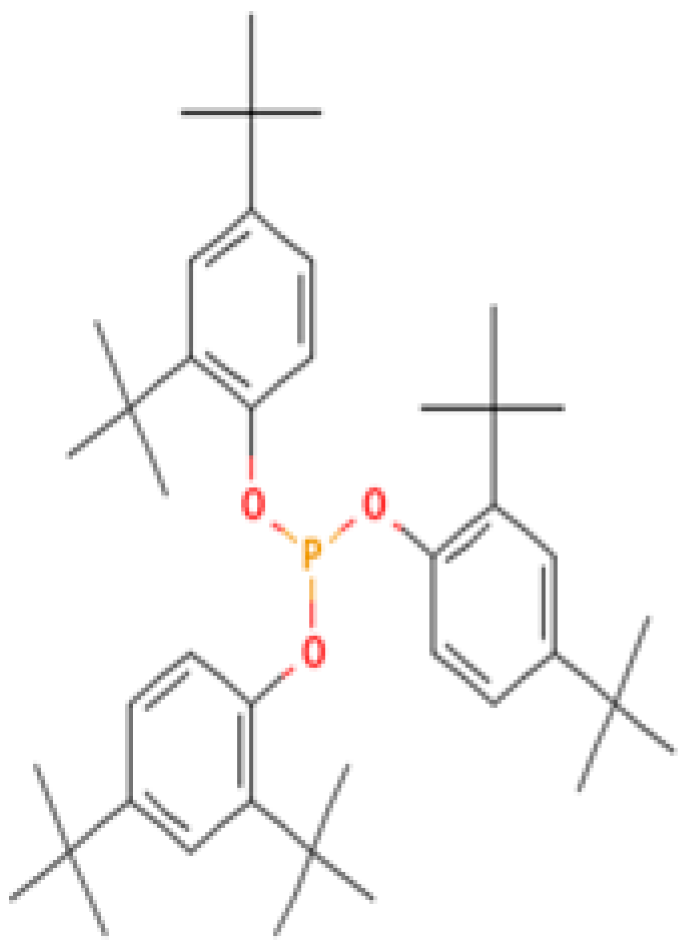
| 3 | Tris(2,4-di-tert-butylphenyl) phosphite | 31570-04-4 | Alkylbenzene (class of phosphites) | 441 | 57, 91, 147, 191, 237, 308, 426, 441 | 85 |
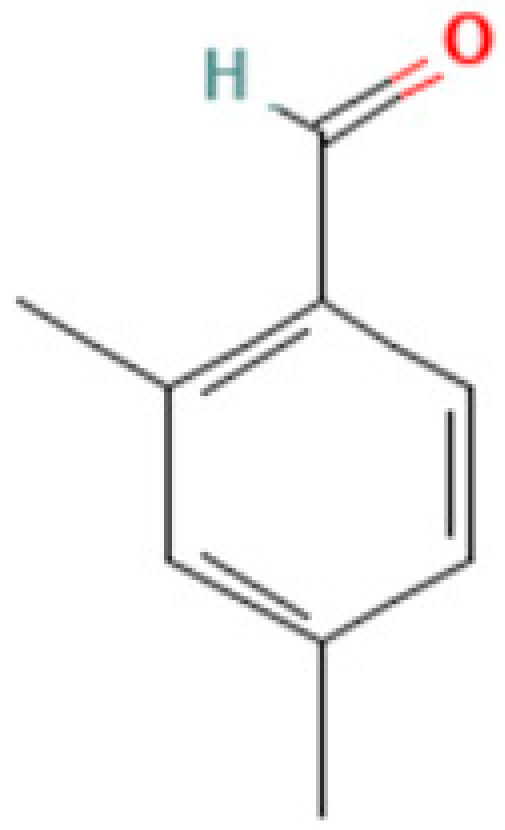
| 4 | 2,4-DBAL or 2,4-Dimethylbenzaldehyde | 15764-16-6 | Carbonyl (class of aromatic aldehydes) | 134 | 51,77, 105, 133, 134, | 92 |
| 5 | Linoleic acid | 56259-07-5 | Polyunsaturated fatty acid | 265 | 67, 75, 95, 129, 150, 178, 220, 262, 265 | 76 |
| 6 | Palmitic Acid | 57-10-3 | Saturated fatty acid | 241 | 55, 73, 117, 132, 145, 185, 201, 215, 241 | 87 |
| 7 | Stearic acid | 18748-91-9 | Saturated fatty acid | 269 | 55, 73, 117, 132, 145, 185, 201, 269 | 75 |
| 8 | 16-Methyl-heptadecanecarboxylic acid | 0-00-0 | Saturated fatty acid | 269 | 55, 73, 117, 132, 145, 185, 201, 215, 243, 257, 269 | 72 |
| 9 | Elaidamide | 301-02-0 | Fatty acid amide | 281 | 59, 75, 112, 126, 154, 184, 192, 222, 238, 264, 281 | 93 |
| 10 | Palmitamide or Hexadecanamide | 629-54-9 | Fatty acid amide | 255 | 59, 72, 114, 128, 142, 170, 198, 212, 255 | 85 |
| 11 | Nonadecanamide | 58185-32-3 | Fatty amide | 297 | 59, 72, 97, 124, 152, 166, 208, 222, 236, 268, 297 | 80 |
| 12 | Oleamide | 301-02-0 | Fatty amide | 281 | 59, 72, 112, 126, 154, 198, 222, 238, 264, 281 | 91 |
| 13 | Oleionitril | 112-91-4 | Fatty nitrile | 263 | 55, 83, 97, 122, 150, 164, 206, 220, 234, 263 | 81 |
| 14 | Monopalmitin | 542-44-9 | Satureted fatty acid ester: a triglyceride | 300 | 57, 73, 103, 129, 147, 157, 203, 239, 257, 279, 300 | 61 |
| 15 | 7,9-Di-tert-butyl-1-oxaspiro [4.5] deca-6,9-diene-2,8-dione | 82304-66-3 | Oxaspiro compound | 276 | 57, 91, 109, 135, 161, 175, 205, 217, 233, 261, 276 | 76 |
| 16 | 4,5,7-Tris(1,1-dimethylethyl)-3,4-dihydro-1,4-epoxynaphthalene-1(2H)-methanol | 56771-86-9 | Organic compound | 344 | 57, 85, 115, 129, 145, 185, 197, 229, 241, 260, 301, 316, 329, 344 | 87 |
| 17 | 2-Palmitoylglycerol | 23470-00-0 | Organic compound | 387 | 57, 73, 103, 129, 147, 175, 203, 218, 239, 313, 387 | 79 |
| 18 | 3-Trifluoromethylbenzylamine, N, N-dinonyl | 0-00-0 | Organic compound | 427 | 55, 109, 159, 202, 228, 268, 314, 340, 384, 426, 427 | 66 |
| 19 | Carbonic acid, monoamide, N-octadecyl-, 2-ethylhexyl ester | 0-00-0 | Fatty acid amide | 425 | 57, 74, 112, 186, 268, 314, 352, 396, 425 | 60 |
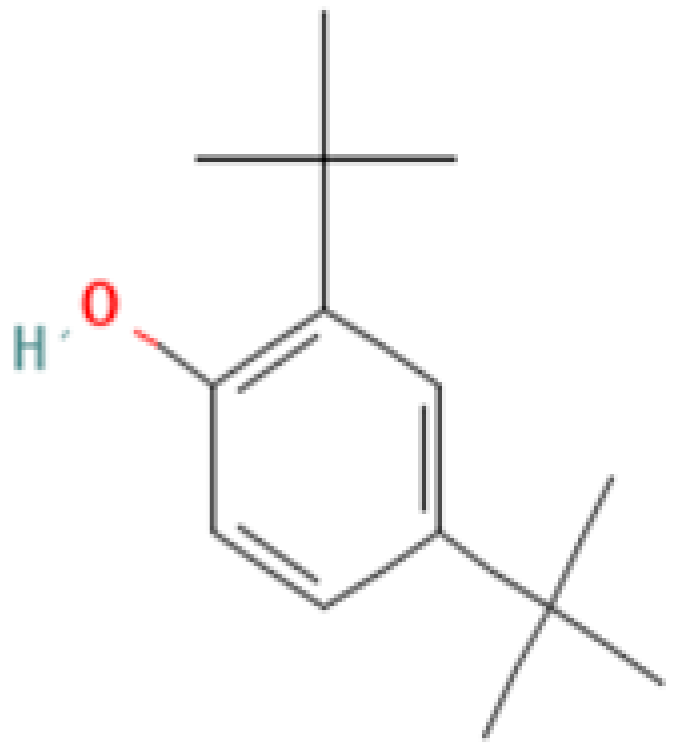
| 21 | 2,4-Di-tert-butylphenol | 96-76-4 | Phenol | 206 | 57, 74, 107, 135, 163, 175, 191, 206 | 92 |
| 22 | Ethanamine | 2477-39-6 | Amine | 103 | 59, 73, 100, 103 | 93 |
| 23 | 5-(2-Methylpropyl) nonane | 62185-53-9 | Alkyl nonane | 184 | 57, 85, 98, 126, 141 | 92 |
| 24 | Sucrose | 57-50-1 | Glycosyl glycoside | 222 | 73, 103, 129, 147, 191, 217, 222 | 84 |
| Important compunds Structure Interest | ||||||
| 4,5,7-Tris(1,1-dimethylethyl) -3,4-dihydro-1,4-epoxynaphthalene-1(2H) -methanol (Cas n°: 56771-86-9) | Oleamide (Cas n°: 301-02-0) | 2-Palmitoylglycerol (Cas n°: 23470-00-0) | Benzenepropanoic acid (Cas n°: 6386-38-5) | Lowinox 242 (Cas n°: 31570-04-4) | 2,4-DBAL (Cas n°: 15764-16-6) | 2,4-Di-tert-butylphenol (Cas n°: 96-76-4) |
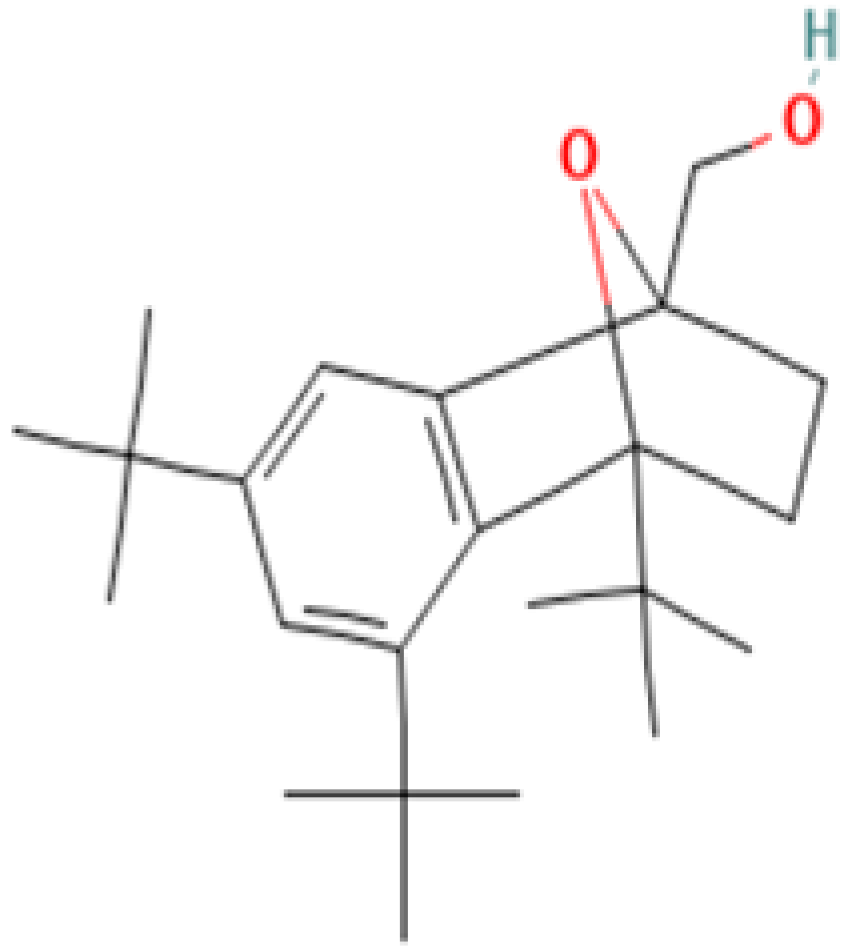 | 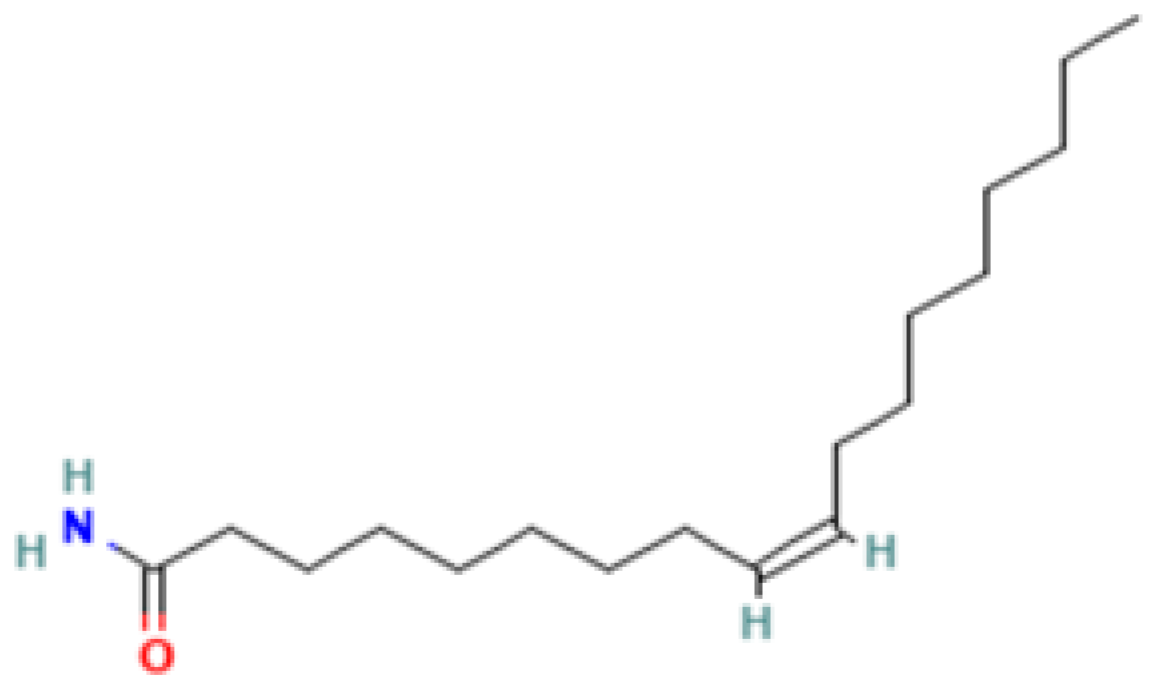 | 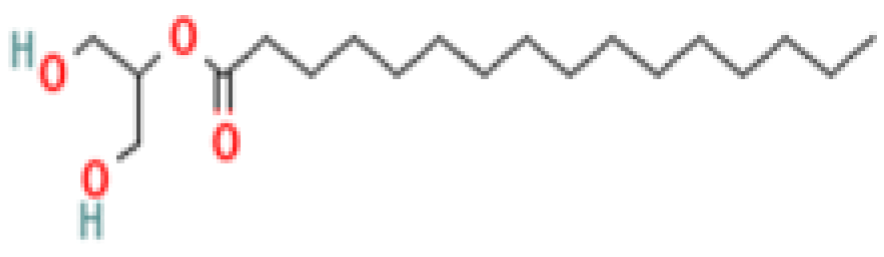 |  |  |  |  |
| -Potential health benefits as an antioxidant | -Food additive -Associated with sleep regulation and anti-inflammatory effects | -Ligand for cannabinoid receptors -Potential role in inflammation modulation | -Antioxydant | -Antioxidant properties and preservation of food products | Antioxydant Food additive | Antioxydant |
| (a) Docking Results with Ligands in the Active Sites | ||||||
|---|---|---|---|---|---|---|
| Cannabis sativa (L.) Seeds Fractions | Identified Compounds | 2CDU | 1FJ4 | 3Q8U | 5I77 | 5FSA |
| Glide Gscore (Kcal/mol) | ||||||
| Volatile compounds detected by GC-MS-MS | 2,4-Dimethylbenzaldehyde | −5.928 | −6.684 | −5.747 | −4.351 | −5.319 |
| 2,4-Di-tert-butylphenol | −5.886 | −6.386 | −3.925 | −5.307 | −7.964 | |
| 2-Palmitoylglycerol | −4.016 | −3.646 | −3.203 | - | −5.496 | |
| 3-Trifluoromethylbenzylamine, N,N-dinonyl | −5.813 | −3.272 | −3.087 | −1.687 | −7.725 | |
| 4,5,7-Tris(1,1-dimethylethyl)-3,4-dihydro-1,4-epoxynaphthalene-1(2H)-methanol | −5.066 | - | −4.327 | −2.924 | −7.733 | |
| 5-(2-Methylpropyl)nonane | −3.032 | −4.336 | −2.904 | −2.084 | −4.31 | |
| 7,9-Di-tert-butyl-1-oxaspiro [4.5]deca-6,9-diene-2,8-dione | −4.986 | −4.481 | −4.094 | −3.834 | −6.115 | |
| Carbonic acid, monoamide, N-octadecyl-, 2-ethylhexyl ester | −5.01 | - | −2.767 | - | −7.149 | |
| Elaidamide | −0.544 | −0.968 | −0.216 | - | −2.635 | |
| Ethanamine | −4.282 | −4.658 | −3.813 | −5.315 | −4.856 | |
| Hexadecanamide | −0.088 | −1.266 | −0.168 | - | −2.365 | |
| Linoleic acid | −1.262 | −1.59 | −1.394 | 0.975 | −2.356 | |
| Methyl 3-(3,5-di-tert-butyl-4-hydroxyphenyl)propionate | −5.298 | −4.225 | −4.591 | −3.651 | −7.654 | |
| Monopalmitin | −4.232 | −3.247 | −3.43 | −2.727 | −4.874 | |
| Nonadecanamide | −0.451 | −0.895 | 0.328 | - | −2.044 | |
| Oleamide | −0.654 | −1.771 | −0.606 | 0.183 | −2.076 | |
| Oleonitrile | 0.411 | 0.121 | - | - | −1.522 | |
| Palmitic Acid | −0.559 | −0.627 | −0.748 | 1.384 | −1.118 | |
| Phytane | −0.543 | −1.562 | −0.163 | 0.405 | −2.944 | |
| Stearic acid | −0.212 | 0.899 | −0.79 | - | −1.622 | |
| Sucrose | −5.85 | −5.077 | −4.266 | −4.813 | −6.103 | |
| Non-volatile compounds detected by HPLC-ESI-FULL-MS | 1-16:0-2-18:2-Phosphatidylinositol | −4.498 | - | −4.721 | - | −7.728 |
| 7,8-Dihydrocannabinol | −4.576 | −5.639 | −4.703 | −4.184 | −8.211 | |
| Cannabidiolic acid | −5.548 | −5.63 | −5.249 | −2.936 | −8.029 | |
| Cannabielsoic acid A | −4.821 | −7.241 | −4.015 | −2.994 | −6.635 | |
| Cannabinolic acid | −5.49 | −5.519 | −5.693 | −3.331 | −8.66 | |
| Cannabisin A | −9.681 | - | −6.988 | −3.696 | −8.273 | |
| Cannabisin-B | −9.709 | −5.762 | −6.298 | −4.809 | −8.538 | |
| Cannabisin-C | −9.083 | - | −6.271 | - | −8.448 | |
| Tetrasaccharide hydrate | −5.303 | −5.937 | −5.107 | −4.769 | −6.209 | |
 | ||||||
Disclaimer/Publisher’s Note: The statements, opinions and data contained in all publications are solely those of the individual author(s) and contributor(s) and not of MDPI and/or the editor(s). MDPI and/or the editor(s) disclaim responsibility for any injury to people or property resulting from any ideas, methods, instructions or products referred to in the content. |
© 2024 by the authors. Licensee MDPI, Basel, Switzerland. This article is an open access article distributed under the terms and conditions of the Creative Commons Attribution (CC BY) license (https://creativecommons.org/licenses/by/4.0/).
Share and Cite
Metouekel, A.; Badrana, F.; Kachkoul, R.; Chebaibi, M.; Akhazzane, M.; El Moussaoui, A.; Touil, N.; El Amri, H.; El Fahime, E.; El Kazzouli, S.; et al. Genetic Characterization and Chemical Identification of Moroccan Cannabis sativa (L.) Seeds: Extraction, and In Vitro and In Silico Biological Evaluation. Plants 2024, 13, 1938. https://doi.org/10.3390/plants13141938
Metouekel A, Badrana F, Kachkoul R, Chebaibi M, Akhazzane M, El Moussaoui A, Touil N, El Amri H, El Fahime E, El Kazzouli S, et al. Genetic Characterization and Chemical Identification of Moroccan Cannabis sativa (L.) Seeds: Extraction, and In Vitro and In Silico Biological Evaluation. Plants. 2024; 13(14):1938. https://doi.org/10.3390/plants13141938
Chicago/Turabian StyleMetouekel, Amira, Fadwa Badrana, Rabie Kachkoul, Mohamed Chebaibi, Mohamed Akhazzane, Abdelfattah El Moussaoui, Nadia Touil, Hamid El Amri, Elmostafa El Fahime, Saïd El Kazzouli, and et al. 2024. "Genetic Characterization and Chemical Identification of Moroccan Cannabis sativa (L.) Seeds: Extraction, and In Vitro and In Silico Biological Evaluation" Plants 13, no. 14: 1938. https://doi.org/10.3390/plants13141938