
Densification of Genetic Map and Stable Quantitative Trait Locus Analysis for Amino Acid Content of Seed in Soybean (Glycine max L.)


Abstract
:1. Introduction
2. Results
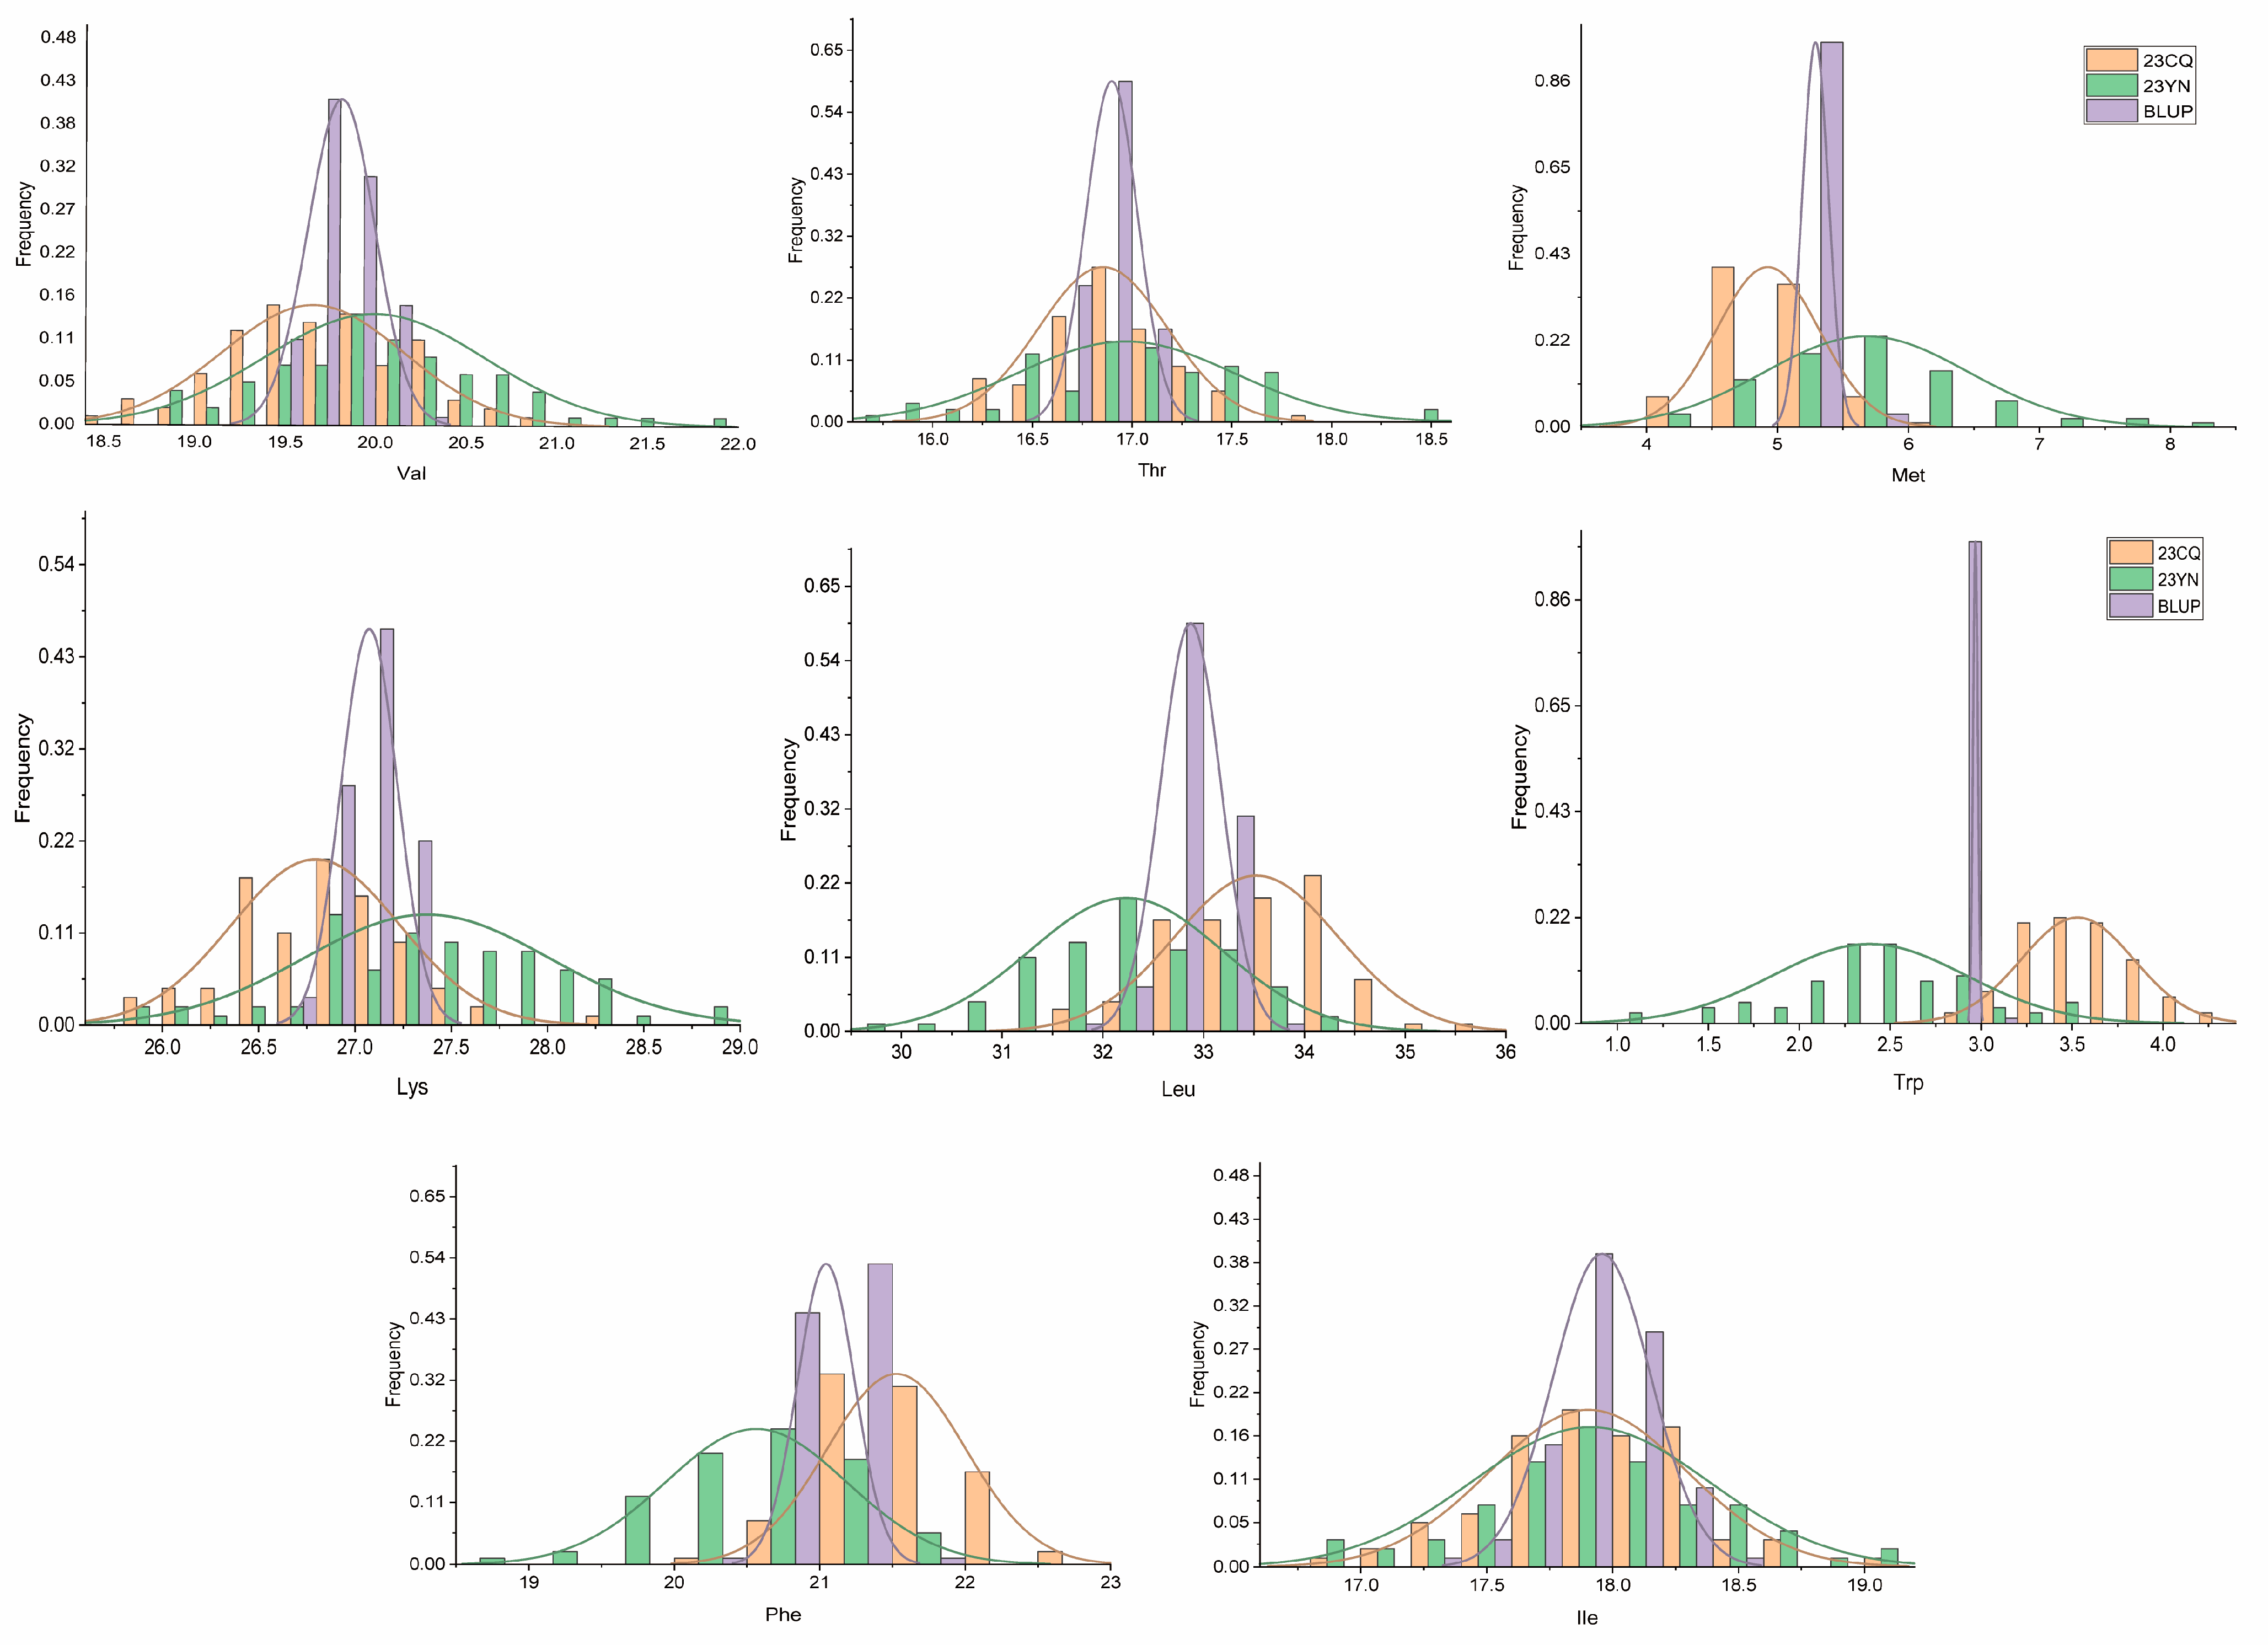
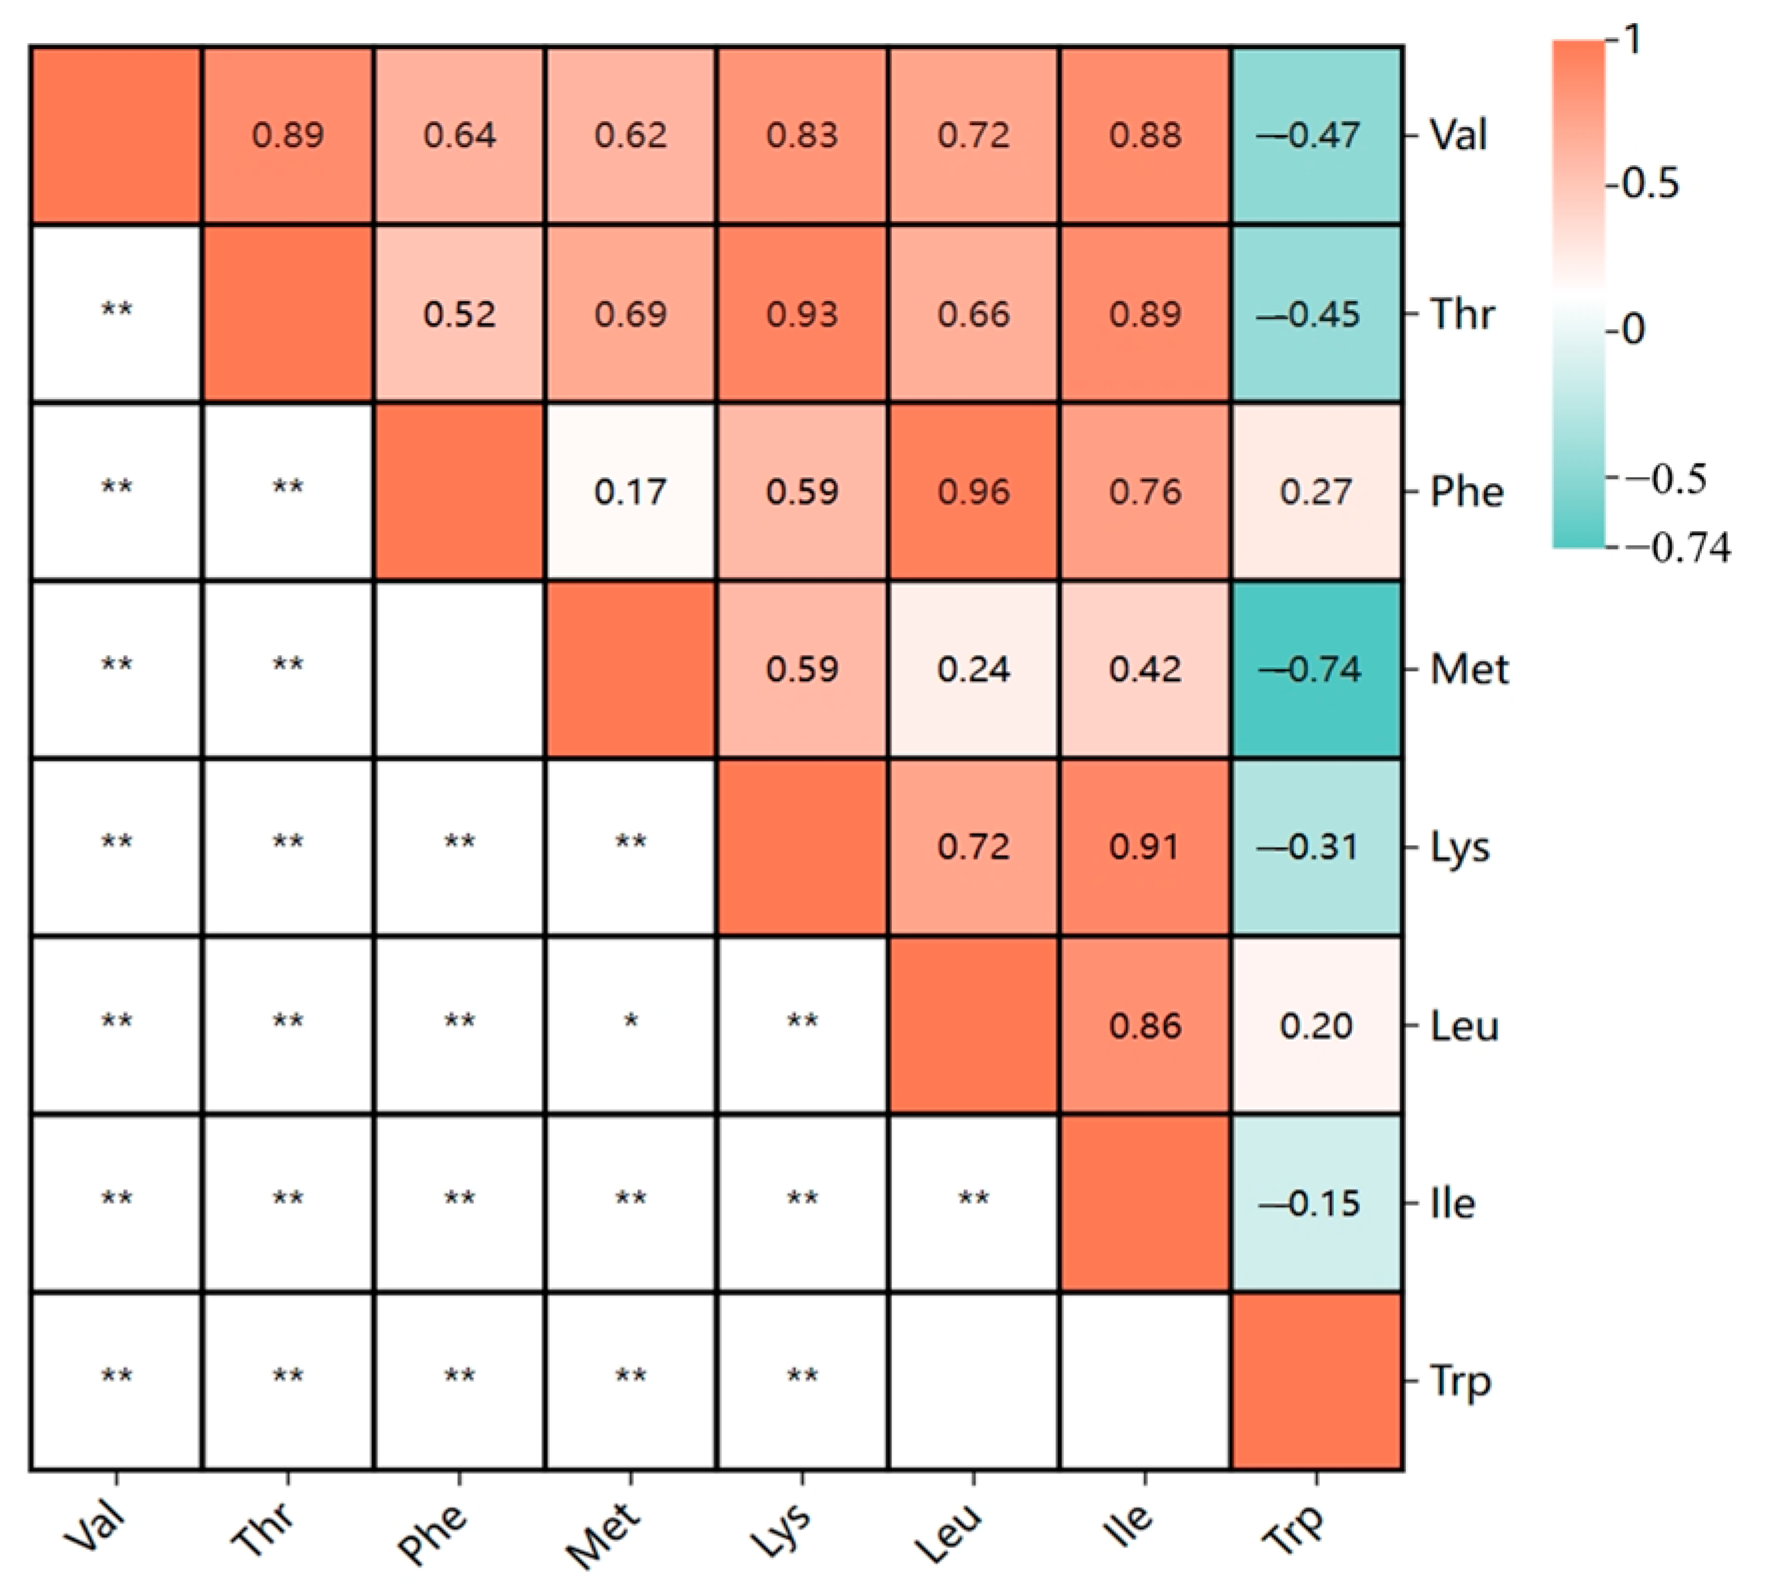
2.1. Trait Phenotype Analysis
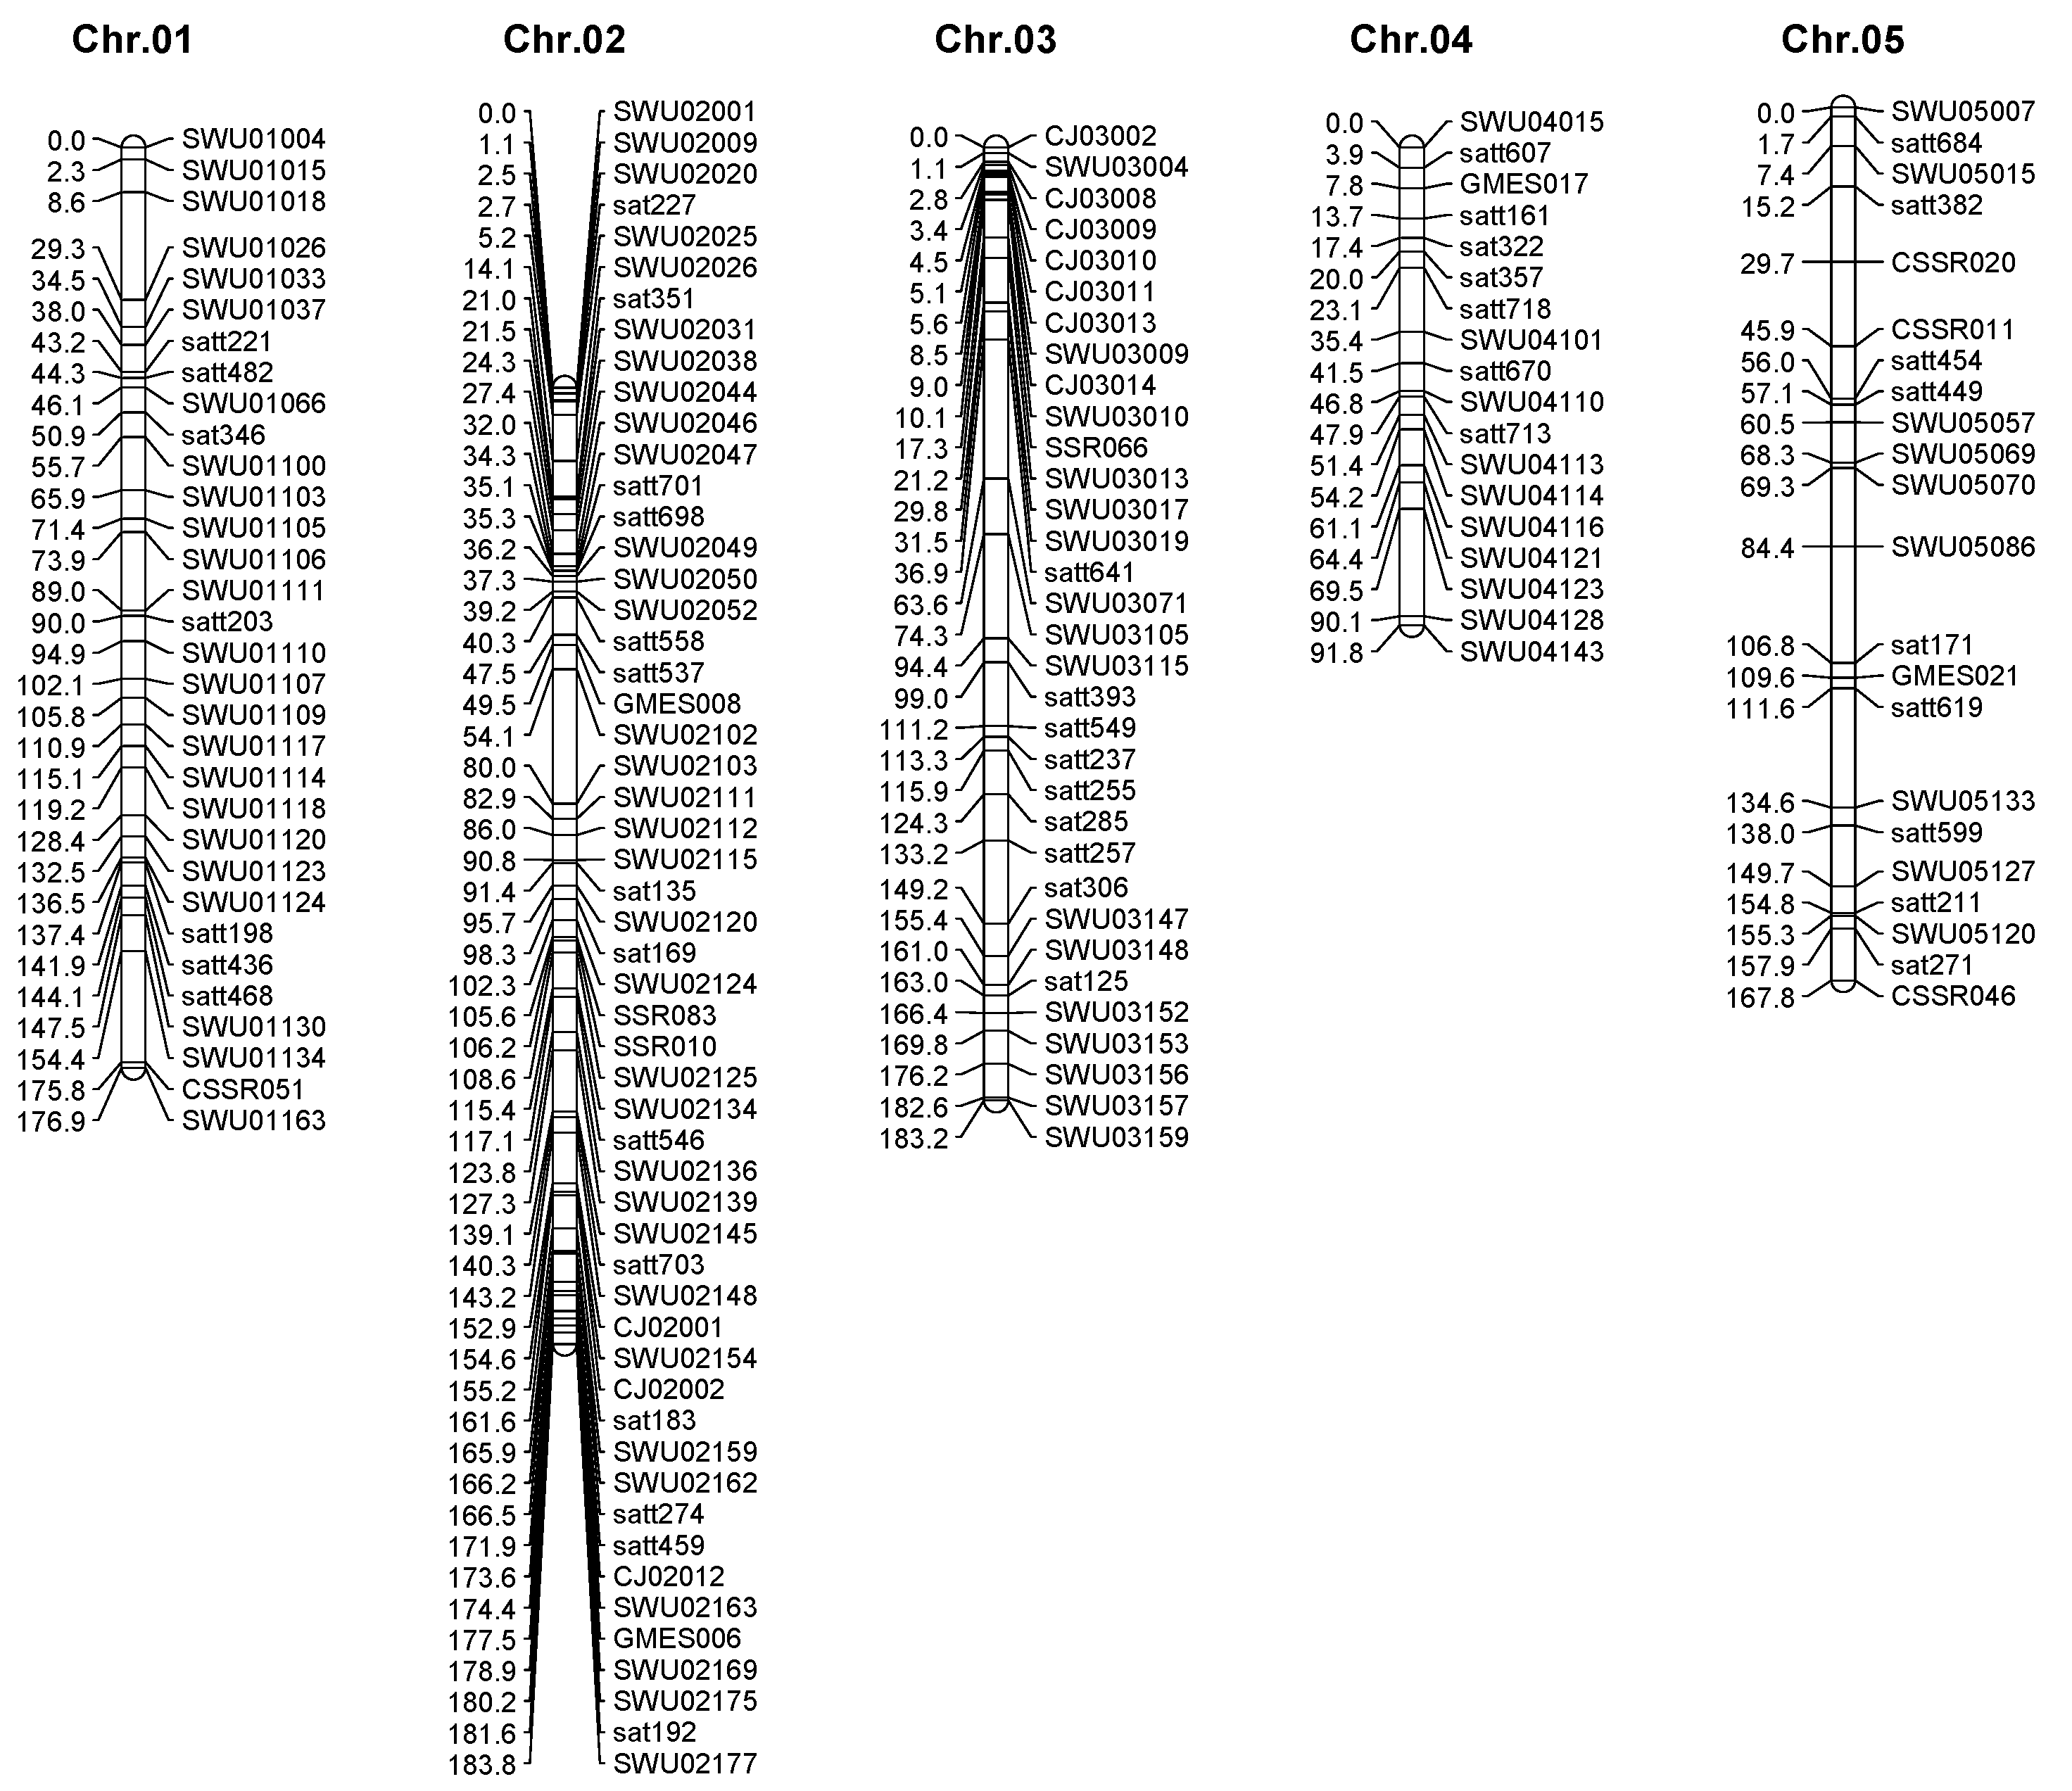
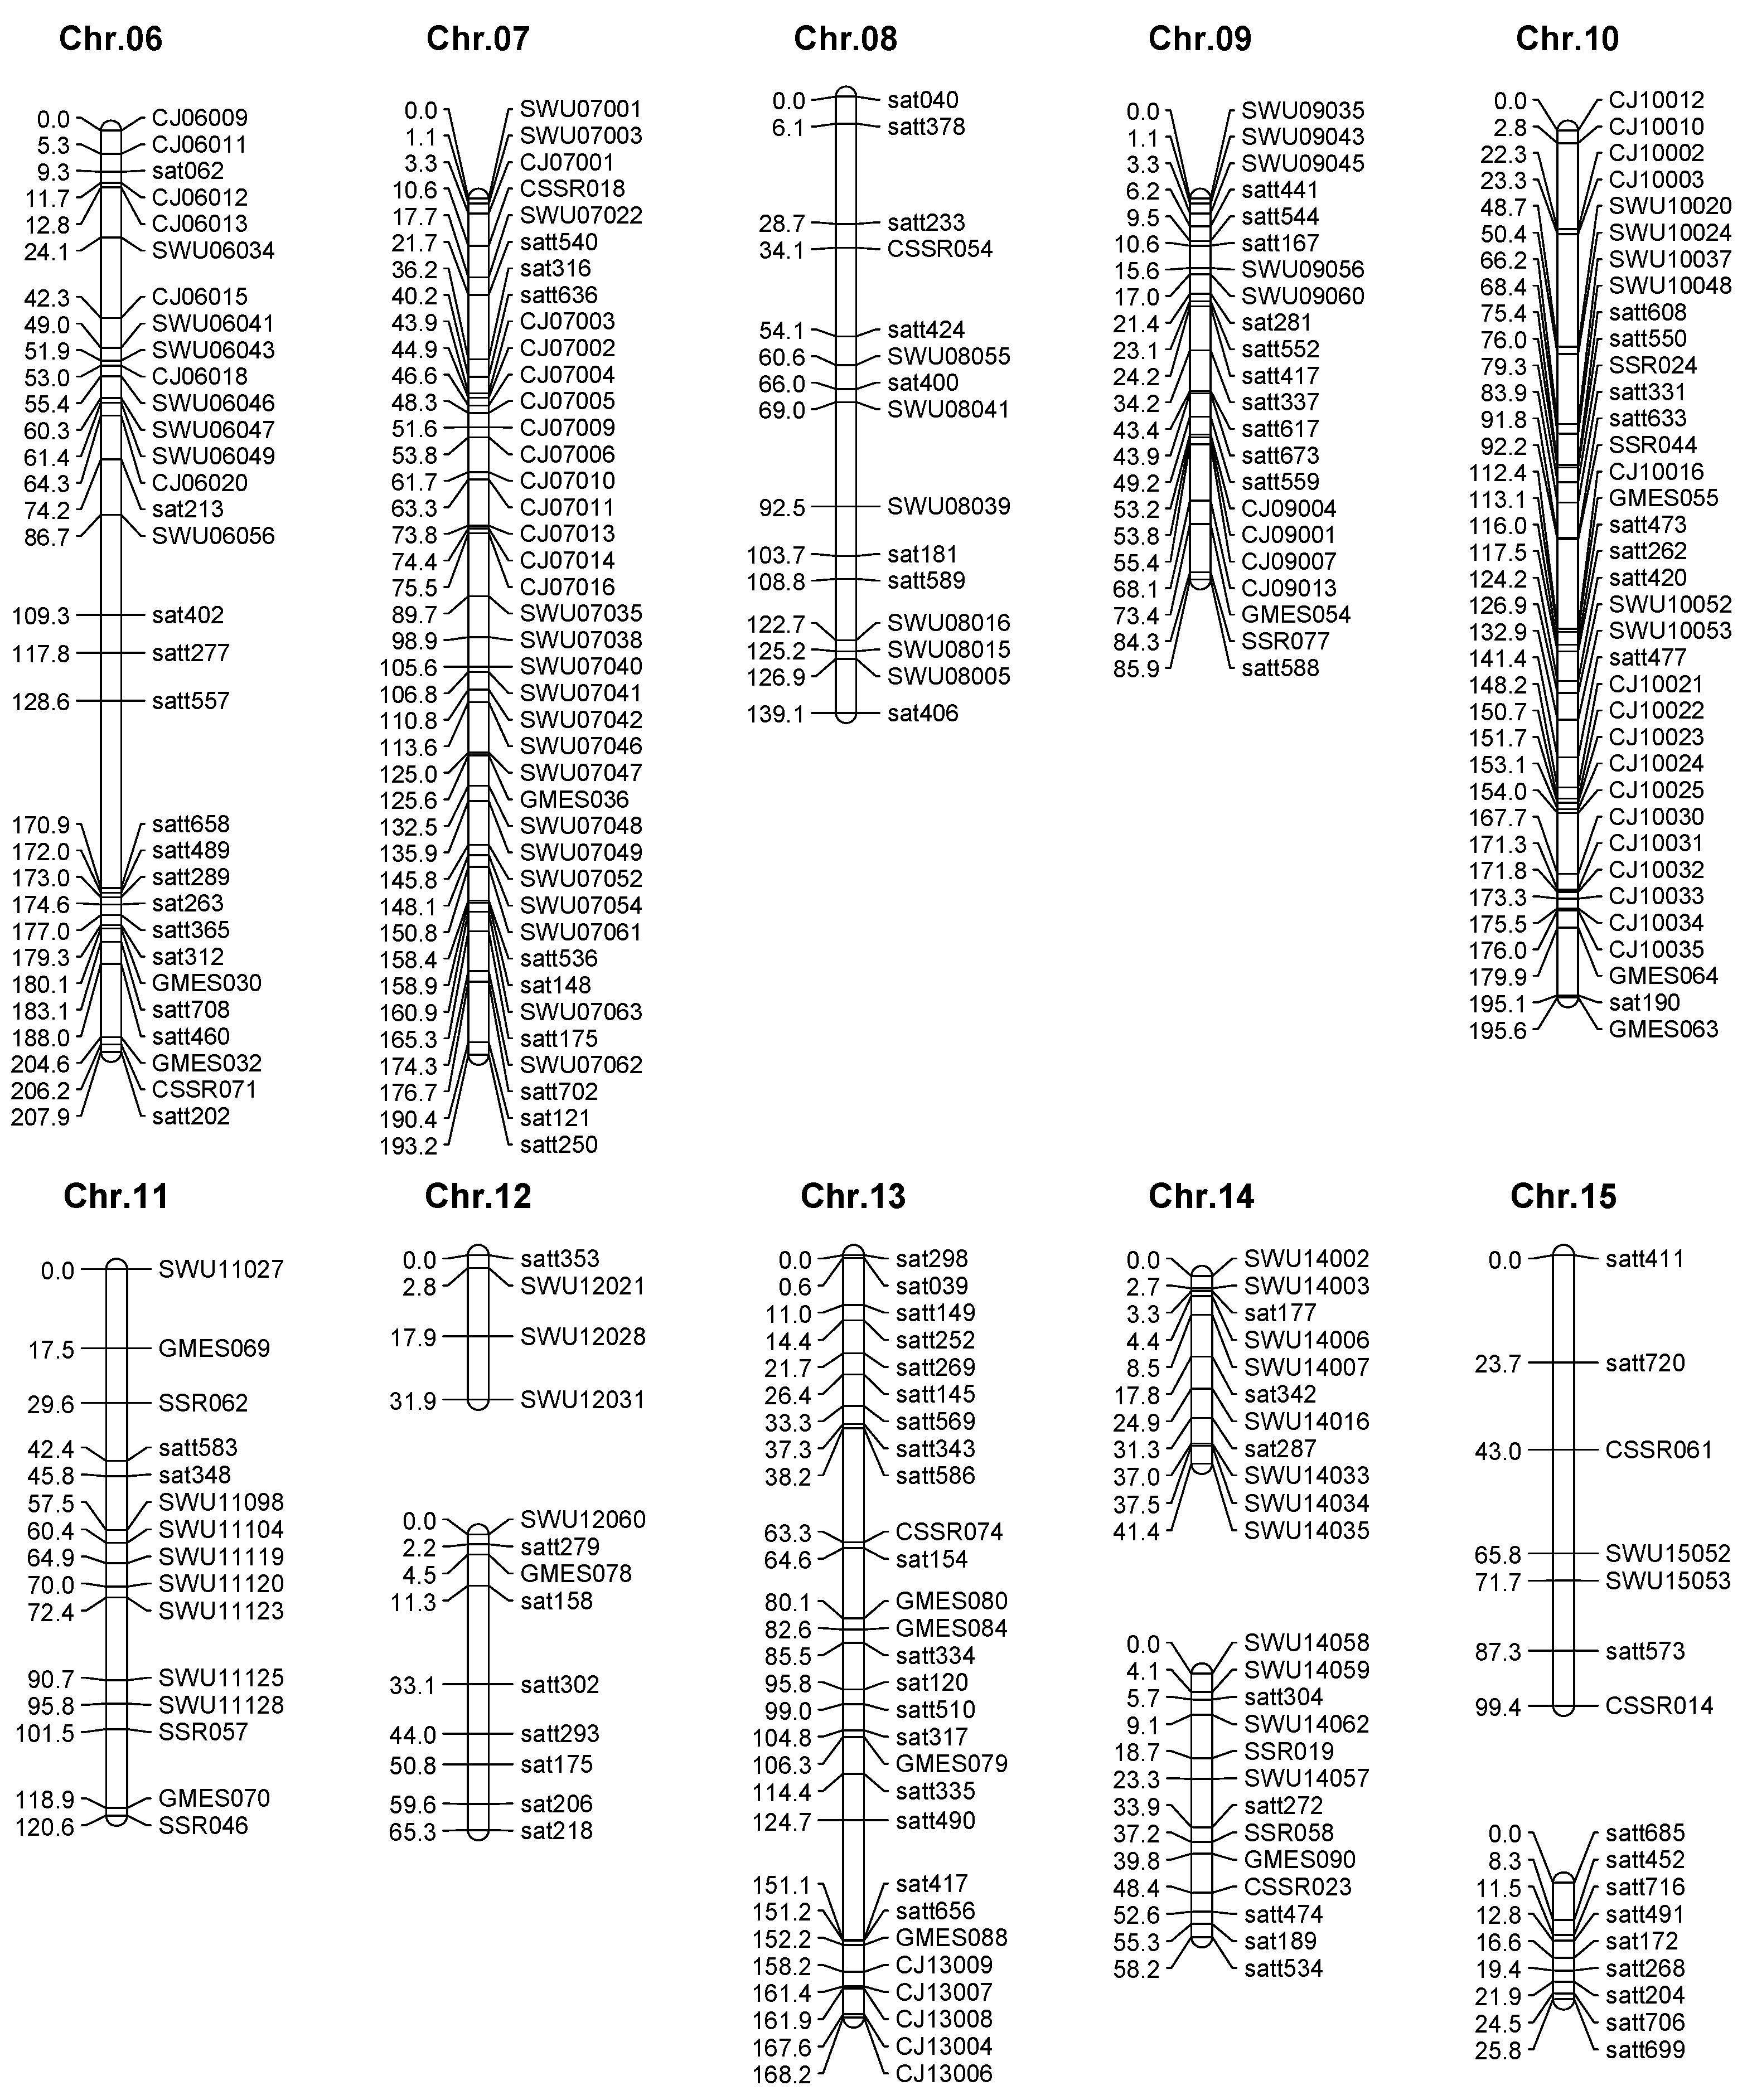
2.2. Genetic Map Construction
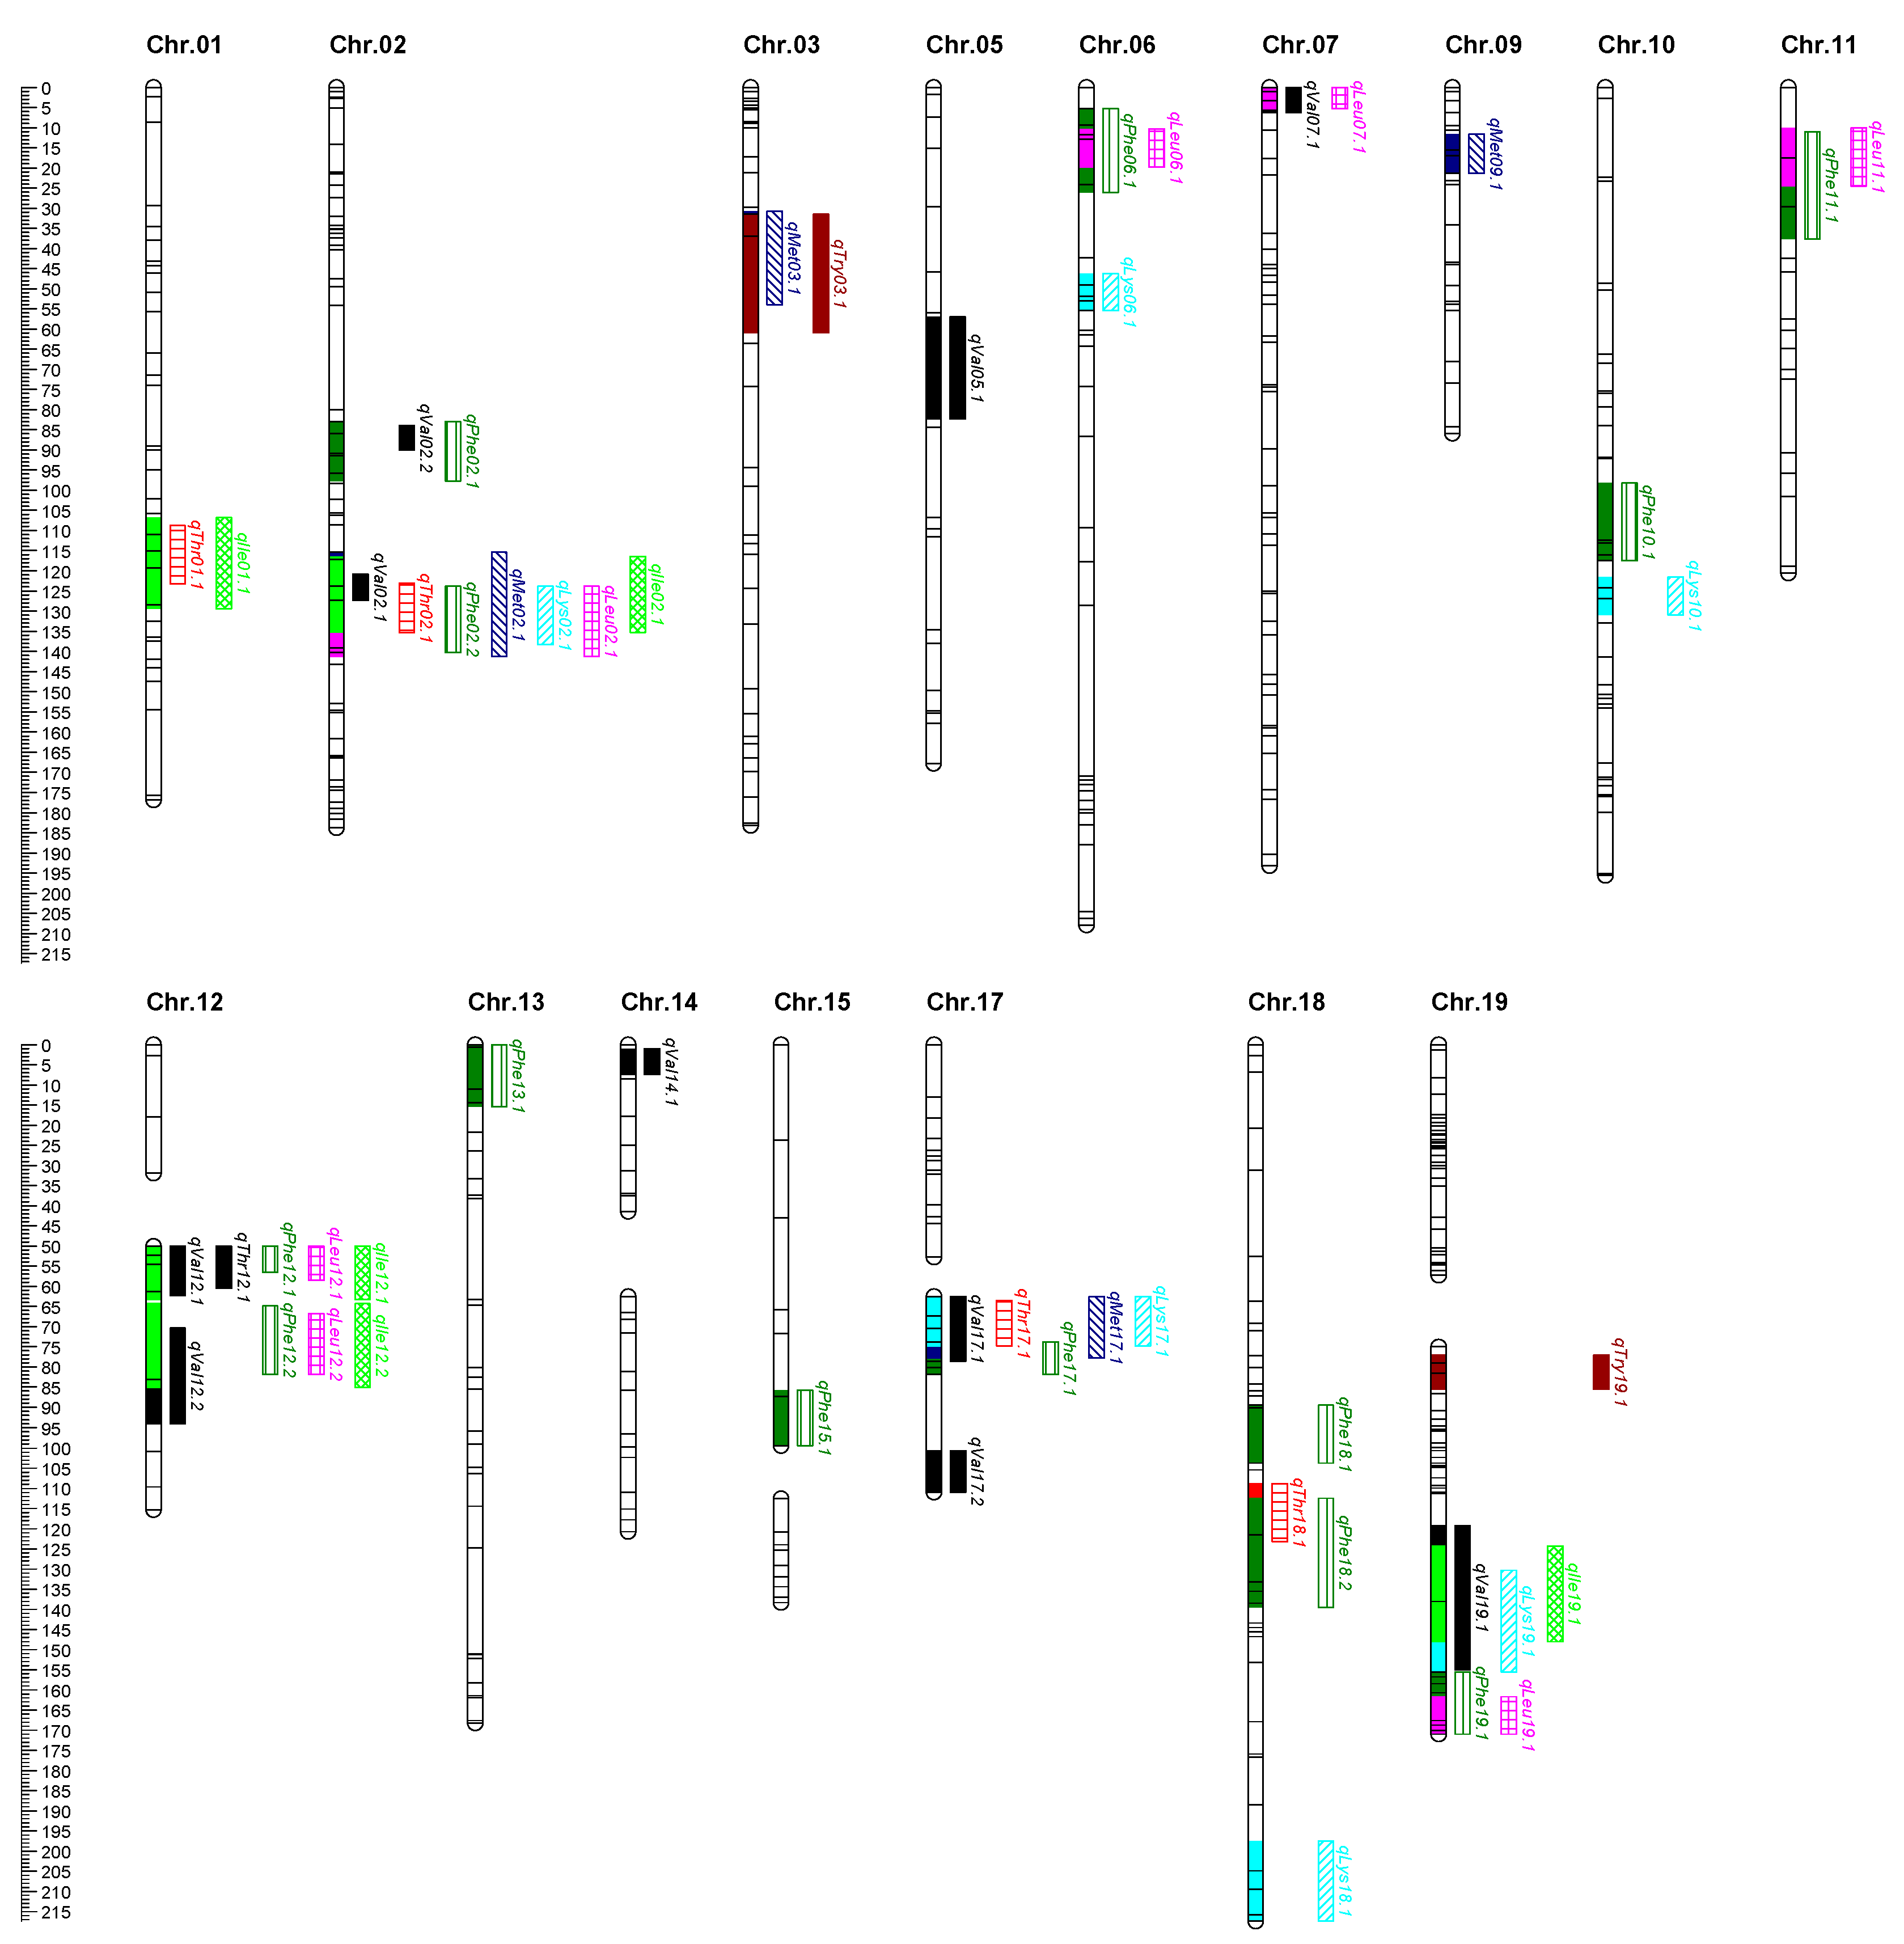
2.3. QTLs Identified for Essential Amino Acids
2.4. Identification and Analysis of QTL Clusters
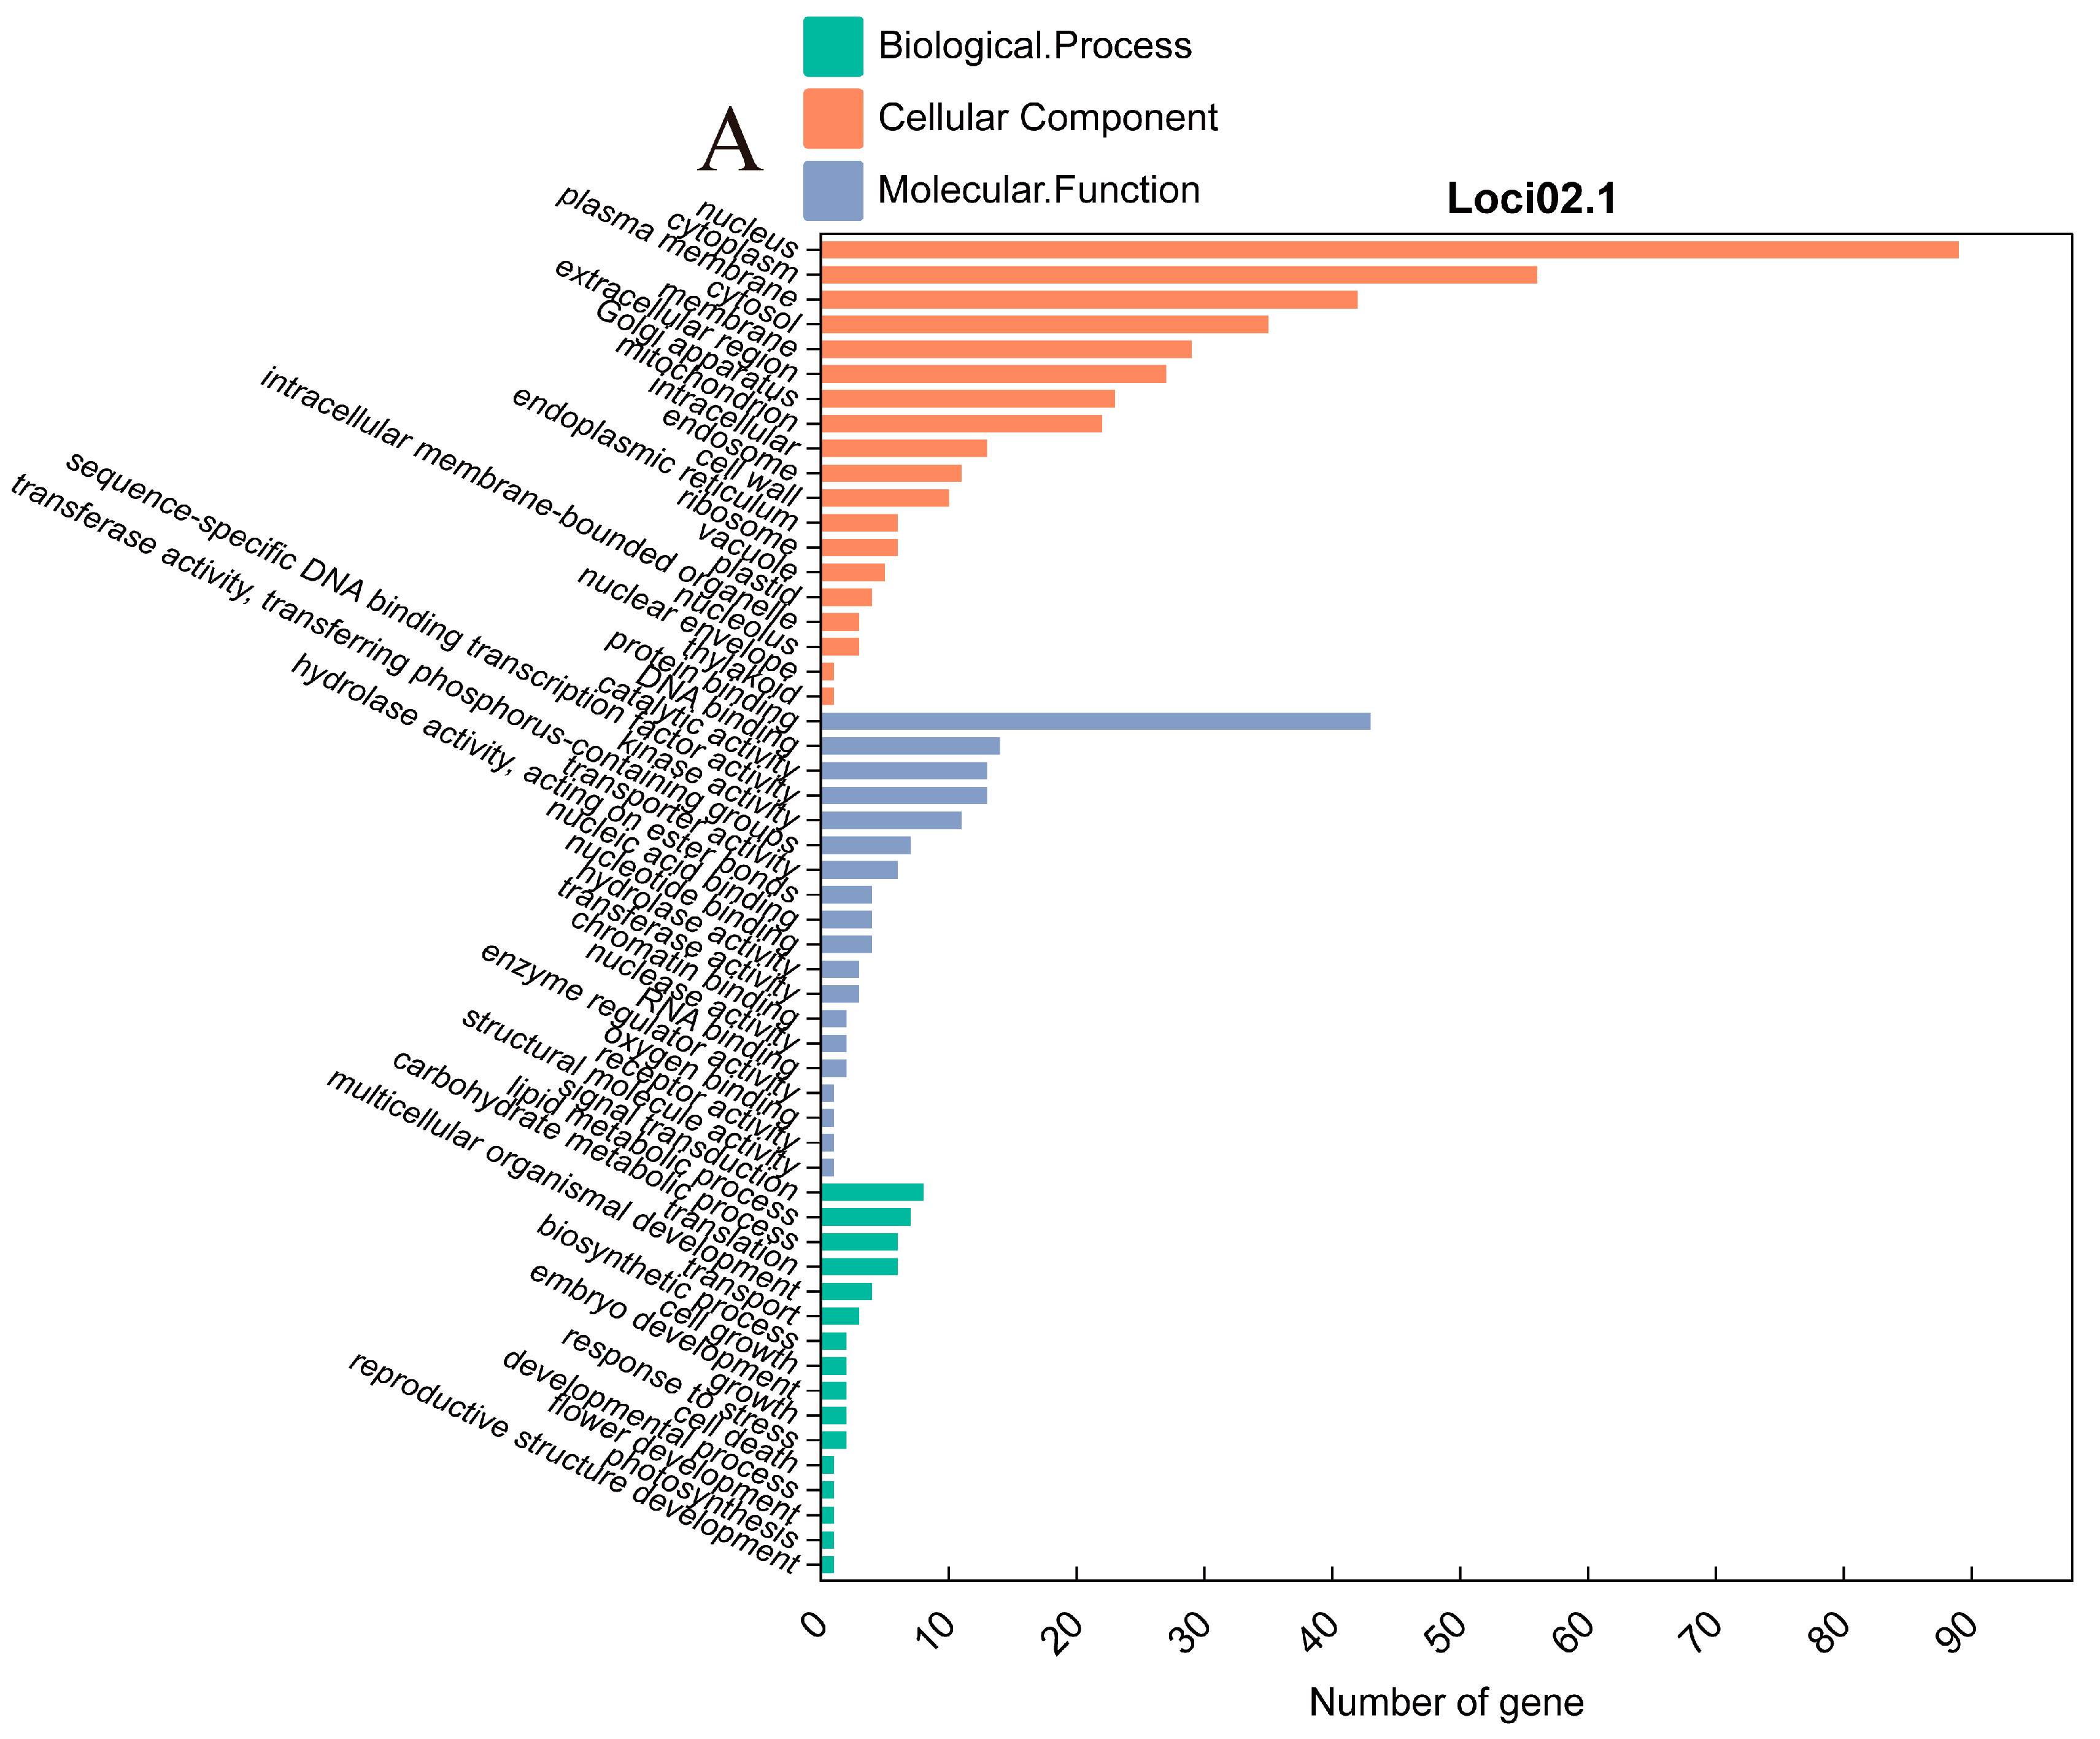
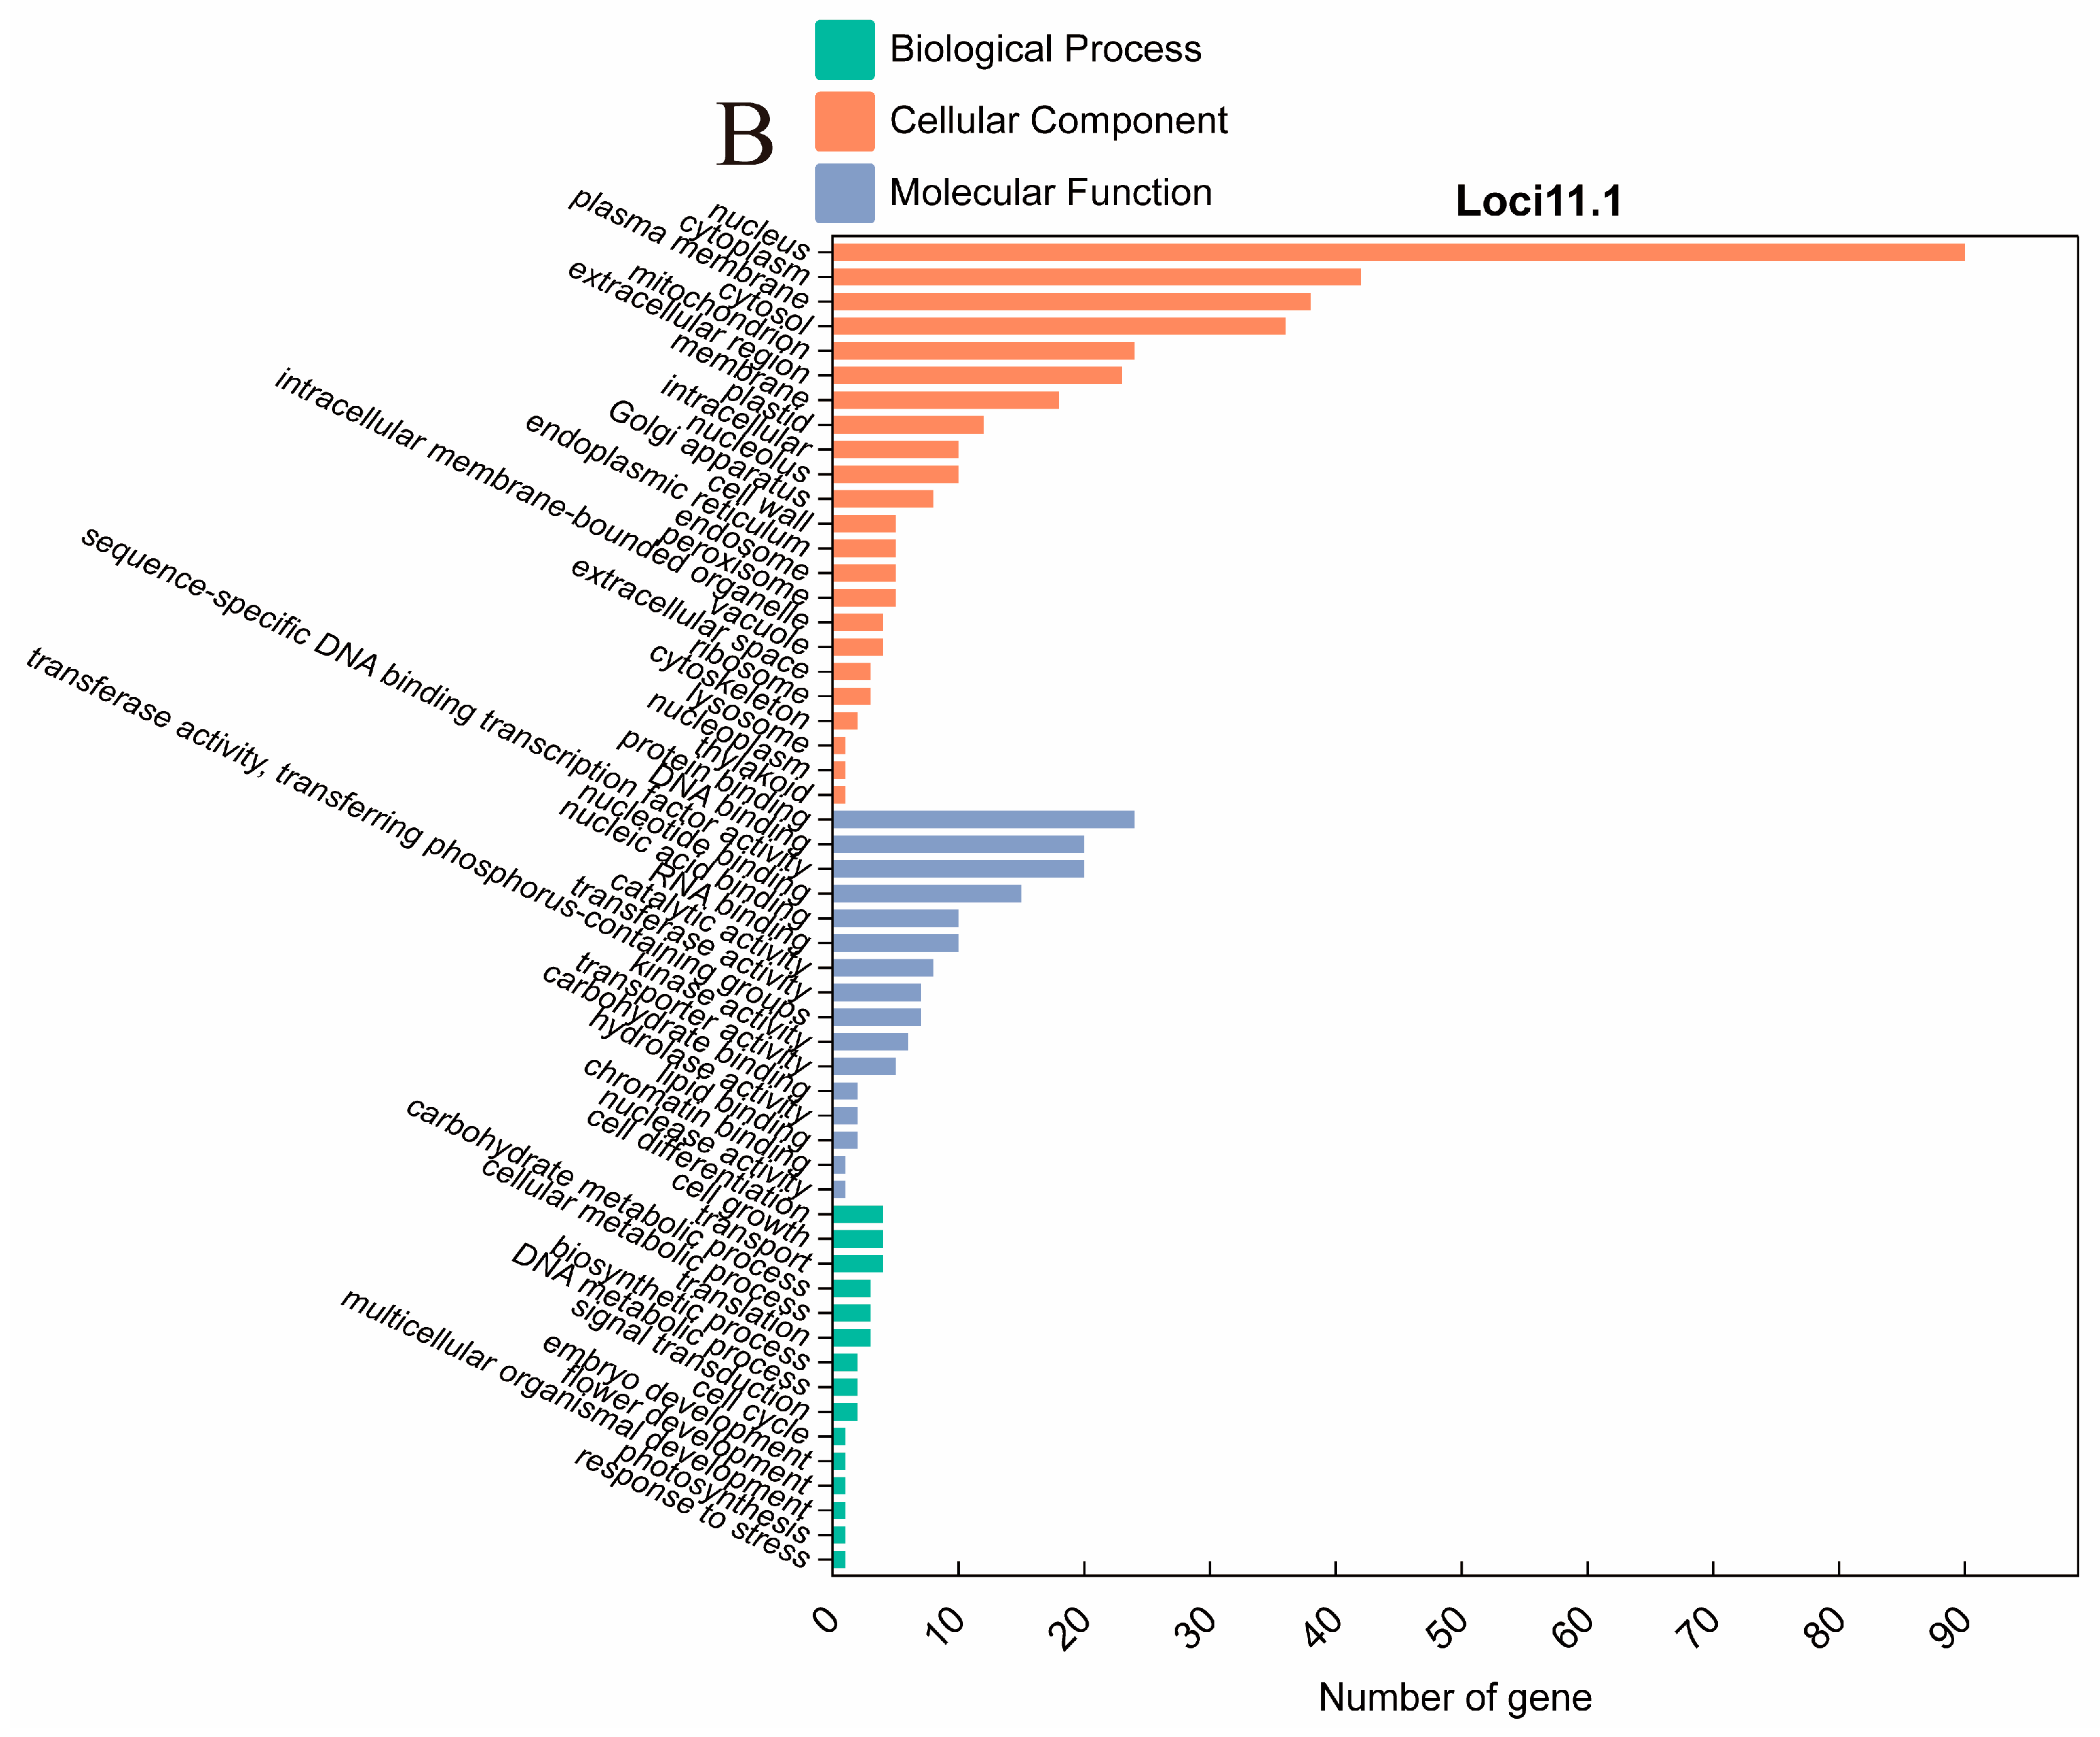
2.5. Candidate Gene Prediction
3. Discussion
4. Materials and Methods
4.1. Plant Materials
4.2. DNA Extraction and Genotyping
4.3. Determination of Traits
4.4. Map Construction and QTL Detection
4.5. QTL Cluster Identification
4.6. Candidate Gene Prediction
5. Conclusions
Supplementary Materials
Author Contributions
Funding
Institutional Review Board Statement
Informed Consent Statement
Data Availability Statement
Conflicts of Interest
References
- Clemente, T.E.; Cahoon, E.B. Soybean Oil: Genetic Approaches for Modification of Functionality and Total Content. Plant Physiol. 2009, 151, 1030–1040. [Google Scholar] [CrossRef] [PubMed]
- Anderson, E.J.; Ali, L.; Beavis, W.D.; Chen, P.; Clemente, T.E.; Diers, B.W.; Graef, G.L.; Grassini, P.; Hyten, D.L.; McHale, L.K.; et al. Soybean [Glycine max(L.) Merr.] Breeding: History, Improvement, Production and Future Opportunities. In Advances in Plant Breeding Strategies: Legumes; Al-Khayri, J., Jain, S., Johnson, D., Eds.; Springer: Cham, Switzerland, 2019. [Google Scholar] [CrossRef]
- Kim, I.-S.; Kim, C.-H.; Yang, W.-S. Physiologically Active Molecules and Functional Properties of Soybeans in Human Health—A Current Perspective. Int. J. Mol. Sci. 2021, 22, 4054. [Google Scholar] [CrossRef] [PubMed]
- Biesalski, H.K.; Grimm, P.; Nowitzki-Grimm, S. Taschenatlas Ernährung, 8th ed.; Georg Thieme Verlag KG, Rüdigerstr: Stuttgart, Germany, 2020; pp. 124–142. [Google Scholar]
- Verstringe, S.; Vandercruyssen, R.; Carmans, H.; Rusu, A.V.; Bruggeman, G.; Trif, M. Alternative Proteins for Food and Feed. In Biodiversity, Functional Ecosystems and Sustainable Food Production; Galanakis, C.M., Ed.; Springer: Cham, Switzerland, 2023. [Google Scholar] [CrossRef]
- Kuepper, B.; Riemersma, M. European Soy Monitor. Insights on the European Supply Chain and the Use of Responsible and Deforestation-free Soy in 2017. 2019. Available online: https://www.idhsustainabletrade.com/uploaded/2019/04/European-Soy-Monitor.pdf (accessed on 15 March 2024).
- Huang, S.; Wang, L.M.; Sivendiran, T.; Bohrer, B.M. Review: Amino acid concentration of high protein food products and an overview of the current methods used to determine protein quality. Crit. Rev. Food Sci. Nutr. 2017, 58, 2673–2678. [Google Scholar] [CrossRef]
- Hill, J.H.; Whitham, S.A. Chapter Seven—Control of Virus Diseases in Soybeans. Adv. Virus Res. 2014, 90, 355–390. [Google Scholar] [CrossRef] [PubMed]
- Kudełka, W.; Kowalska, M.; Popis, M. Quality of Soybean Products in Terms of Essential Amino Acids Composition. Molecules 2021, 26, 5071. [Google Scholar] [CrossRef]
- Berry, T.H.; Becker, D.E.; Rasmussen, O.G.; Jensen, A.H.; Norton, H.W. The Limiting Amino Acids in Soybean Protein. J. Anim. Sci. 1962, 21, 558–561. [Google Scholar] [CrossRef]
- Young, V.R. Soy protein in relation to human protein and amino acid nutrition. J. Am. Diet. Assoc. 1991, 91, 828–835. [Google Scholar] [CrossRef]
- Singer, W.M.; Zhang, B.; Mian, M.R.; Huang, H. Soybean Amino Acids in Health, Genetics, and Evaluation. In Soybean for Human Consumption and Animal Feed; IntechOpen: London, UK, 2020. [Google Scholar] [CrossRef]
- Krishnan, H.B. Engineering Soybean for Enhanced Sulfur Amino Acid Content. Crop Sci. 2005, 45, 454–461. [Google Scholar] [CrossRef]
- Rajcan, I.; Hou, G.; Weir, A. Advances in breeding of seed-quality traits in soybean. J. Crop Improv. 2005, 14, 145–174. [Google Scholar] [CrossRef]
- Krishnan, H.B.; Jez, J.M. The promise and limits for enhancing sulfur- containing amino acid content of soybean seed. Plant Sci. 2018, 272, 14–21. [Google Scholar] [CrossRef]
- Yao, D.; Liu, Z.Z.; Zhang, J.; Liu, S.Y.; Qu, J.; Guan, S.Y.; Pan, L.D.; Wang, D.; Liu, J.W.; Wang, P.W. Analysis of quantitative trait loci for main plant traits in soybean. Genet. Mol. Res. 2015, 14, 6101–6109. [Google Scholar] [CrossRef]
- Panthee, D.R.; Pantalone, V.R.; Saxton, A.M.; West, D.R.; Sams, C.E. Genomic Regions Associated with Amino Acid Composition in Soybean. Mol. Breed. 2006, 17, 79–89. [Google Scholar] [CrossRef]
- Fallen, B.D.; Hatcher, C.N.; Allen, F.L.; Kopsell, D.A.; Saxton, A.M.; Chen, P.; Kantartzi, S.K.; Cregan, P.B.; Hyten, D.L.; Pantalone, V.R. Soybean Seed Amino Acid Content QTL Detected Using the Universal Soy Linkage Panel 1.0 with 1,536 SNPs. Agric. Food Sci. 2013, 1, 68–79. [Google Scholar] [CrossRef]
- Wang, X.; Jiang, G.; Song, Q.; Cregan, P.B.; Scott, R.A.; Zhang, J.; Yen, Y.; Brown, M.L. Quantitative trait locus analysis of seed sulfur-containing amino acids in two recombinant inbred line populations of soybean. Euphytica 2014, 201, 293–305. [Google Scholar] [CrossRef]
- Ma, Y.; Ma, W.; Hu, D.; Zhang, X.; Yuan, W.; He, X.; Kan, G.; Yu, D. QTL Mapping for Protein Sulfur-Containing Amino Acid Contents Using a High-Density Bin-Map in Soybean (Glycine max, L. Merr.). J. Agric. Food Chem. 2019, 67, 12313–12321. [Google Scholar] [CrossRef]
- Jiang, A.; Liu, J.; Gao, W.; Ma, R.; Tan, P.; Liu, F.; Zhang, J. Construction of a genetic map and QTL mapping of seed size traits in soybean. Front. Genet. 2023, 14, 1248315. [Google Scholar] [CrossRef] [PubMed]
- Warrington, C.V.; Abdel-Haleem, H.; Hyten, D.L.; Cregan, P.B.; Orf, J.H.; Killam, A.S.; Bajjalieh, N.; Li, Z.; Boerma, H.R. QTL for seed protein and amino acids in the Benning × Danbaekkong soybean population. Theor. Appl. Genet. 2015, 128, 839–850. [Google Scholar] [CrossRef] [PubMed]
- Xu, X.; Zeng, L.; Tao, Y.; Vuong, T.; Wan, J.; Boerma, R.; Noe, J.; Li, Z.; Finnerty, S.; Pathan, S.M.; et al. Pinpointing genes underlying the quantitative trait loci for root-knot nematode resistance in palaeopolyploid soybean by whole genome resequencing. Proc. Natl. Acad. Sci. USA 2013, 110, 13469–13474. [Google Scholar] [CrossRef] [PubMed]
- Ma, Y.; Kan, G.; Zhang, X.; Wang, Y.; Zhang, W.; Du, H.; Yu, D. Quantitative Trait Loci (QTL) Mapping for Glycinin and β-Conglycinin Contents in Soybean (Glycine max L. Merr.). J. Agric. Food Chem. 2016, 64, 3473–3483. [Google Scholar] [CrossRef]
- Gao, W.; Ma, R.; Li, X.; Liu, J.; Jiang, A.; Tan, P.; Xiong, G.; Du, C.; Zhang, J.; Zhang, X.; et al. Construction of Genetic Map and QTL Mapping for Seed Size and Quality Traits in Soybean (Glycine max L.). Int. J. Mol. Sci. 2024, 25, 2857. [Google Scholar] [CrossRef]
- Wu, L.; Wang, K.; Chen, M.; Su, W.; Liu, Z.; Guo, X.; Ma, M.; Qian, S.; Deng, Y.; Wang, H.; et al. ALLENE OXIDE SYNTHASE(AOS) induces petal senescence through a novel JA-associated regulatory pathway in Arabidopsis. Physiol. Mol. Biol. Plants 2024, 30, 199–212. [Google Scholar] [CrossRef] [PubMed]
- Lopez-Nieves, S.; El-Azaz, J.; Men, Y.; Holland, C.K.; Feng, T.; Brockington, S.F.; Jez, J.M.; Maeda, H.A. Two independently evolved natural mutations additively deregulate TyrA enzymes and boost tyrosine production in planta. Plant J. 2022, 109, 844–855. [Google Scholar] [CrossRef] [PubMed]
- Wang, T.; Liang, L.; Xue, Y.; Jia, P.-F.; Chen, W.; Zhang, M.-X.; Wang, Y.-C.; Li, H.-J.; Yang, W.-C. A receptor heteromer mediates the male perception of female attractants in plants. Nature 2016, 531, 241–244. [Google Scholar] [CrossRef] [PubMed]
- Park, S.; Rancour, D.M.; Bednarek, S.Y. Protein domain-domain interactions and requirements for the negative regulation of Arabidopsis CDC48/ p97 by the plant ubiquitin regulatory X (UBX) domain-containing protein, PUX1. J. Biol. Chem. 2007, 282, 5217–5224. [Google Scholar] [CrossRef] [PubMed]
- Fernández-Calvo, P.; López, G.; Martín-Dacal, M.; Aitouguinane, M.; Carrasco-López, C.; González-Bodí, S.; Bacete, L.; Mélida, H.; Sánchez-Vallet, A.; Molina, A. Leucine Rich Repeat-Malectin receptor kinases IGP1/CORK1, IGP3 and IGP4 are required for Arabidopsis immune responses triggered by b-1,4 D-Xylo-oligosaccharides from plant cell walls. Cell Surf. 2024, 11, 100124. [Google Scholar] [CrossRef] [PubMed]
- Wang, Y.; Liu, J.; Xia, R.; Wang, J.; Shen, J.; Cao, R.; Hong, X.; Zhu, J.K.; Gong, Z. The protein kinase TOUSLED is required for maintenance of transcriptional gene silencing in Arabidopsis. EMBO Rep. 2007, 8, 77–83. [Google Scholar] [CrossRef] [PubMed]
- Shang, Y.; Yang, D.; Ha, Y.; Nam, K.H. BAK1-induced RPK1 phosphorylation is essential for RPK1-mediated cell death in Arabidopsis. Biochem. Biophys. Res. Commun. 2021, 573, 125–131. [Google Scholar] [CrossRef] [PubMed]
- Song, Q.; Jia, G.; Zhu, Y.; Grant, D.; Nelson, R.T.; Hwang, E.-Y.; Hyten, D.L.; Cregan, P.B. Abundance of SSR motifs and development of candidate polymorphic SSR markers (BARCSOYSSR_1.0) in soybean. Crop Sci. Sci. 2010, 50, 1950–1960. [Google Scholar] [CrossRef]
- Zhang, J.; Guo, W.; Zhang, T. Molecular linkage map of allotetraploid cotton (Gossypium hirsutum L. × Gossypium barbadense L.) with a haploid population. Theor. Appl. Genet. 2002, 105, 1166–1174. [Google Scholar] [CrossRef]
- Ge, T.L.; Tian, Y.; Zhang, H.; Liu, Z.X.; Li, Y.H.; Qiu, L.J. QTL mapping and candidate gene prediction of soybean 100-seed weight based on high-density bin map. Acta Agron. Sin. 2022, 48, 2978–2986. [Google Scholar] [CrossRef]
- Kosambi, D.D. The estimation of map distance from recombination values. Ann. Eugen. 1944, 12, 172–175. [Google Scholar] [CrossRef]
- Liu, J.; Jiang, A.; Ma, R.; Gao, W.; Tan, P.; Li, X.; Du, C.; Zhang, J.; Zhang, X.; Zhang, L.; et al. QTL Mapping for Seed Quality Traits under Multiple Environments in Soybean (Glycine max L.). Agronomy 2023, 13, 2382. [Google Scholar] [CrossRef]
- Voorrips, R.E. MapChart: Software for the Graphical Presentation of Linkage Maps and QTLs. J. Hered. 2002, 93, 77–78. [Google Scholar] [CrossRef] [PubMed]
- Said, J.I.; Song, M.; Wang, H.; Lin, Z.; Zhang, X.; Fang, D.D.; Zhang, J. A comparative meta-analysis of QTL between intraspecific Gossypium hirsutum and interspecific G. hirsutum × G. barbadense populations. Mol. Genet. Genom. 2015, 290, 1003–1025. [Google Scholar] [CrossRef]


| Traits | Env. | Parent | Popuation | ||||||||
|---|---|---|---|---|---|---|---|---|---|---|---|
| CJC2 | YSX2 | Max. | Min. | Mean | S.D | Variance | CV/% | Kurt | Skew | ||
| Valine (Val) | 23CQ | 19.40 | 18.40 | 20.90 | 18.50 | 19.65 | 0.50 | 0.25 | 2.55 | −0.23 | 0.01 |
| 23YN | 18.20 | 19.97 | 21.80 | 18.80 | 19.99 | 0.61 | 0.37 | 3.05 | 0.18 | 0.34 | |
| BLUP | 19.36 | 19.54 | 20.30 | 19.41 | 19.81 | 0.18 | 0.03 | 0.93 | −0.36 | 0.18 | |
| Threonine (Thr) | 23CQ | 16.90 | 16.00 | 17.90 | 16.20 | 16.85 | 0.32 | 0.10 | 1.91 | 0.61 | 0.14 |
| 23YN | 15.50 | 16.94 | 18.40 | 15.70 | 16.97 | 0.54 | 0.30 | 3.21 | 0.23 | 0.01 | |
| BLUP | 16.62 | 16.72 | 17.19 | 16.62 | 16.90 | 0.13 | 0.02 | 0.77 | −0.31 | 0.08 | |
| Phenylalanine (Phe) | 23CQ | 22.10 | 21.00 | 22.70 | 20.40 | 21.53 | 0.47 | 0.22 | 2.19 | 0.08 | −0.02 |
| 23YN | 19.60 | 20.56 | 21.80 | 18.90 | 20.56 | 0.62 | 0.38 | 3.02 | −0.18 | −0.14 | |
| BLUP | 20.95 | 20.93 | 21.60 | 20.40 | 21.04 | 0.20 | 0.04 | 0.94 | 0.94 | −0.17 | |
| Methionine (Met) | 23CQ | 4.50 | 4.20 | 6.00 | 4.00 | 4.93 | 0.39 | 0.15 | 7.95 | 0.06 | 0.24 |
| 23YN | 5.00 | 5.65 | 8.00 | 4.00 | 5.68 | 0.78 | 0.61 | 13.72 | 0.56 | 0.53 | |
| BLUP | 5.16 | 5.20 | 5.63 | 5.02 | 5.29 | 0.10 | 0.01 | 1.89 | 1.14 | 0.35 | |
| Lysine (Lys) | 23CQ | 27.30 | 25.80 | 28.20 | 25.80 | 26.80 | 0.43 | 0.19 | 1.62 | 0.50 | 0.15 |
| 23YN | 25.70 | 27.34 | 28.90 | 25.90 | 27.37 | 0.64 | 0.41 | 2.33 | 0.04 | −0.15 | |
| BLUP | 26.87 | 26.88 | 27.39 | 26.67 | 27.07 | 0.15 | 0.02 | 0.54 | −0.12 | −0.13 | |
| Leucine (Leu) | 23CQ | 34.20 | 32.40 | 35.70 | 31.50 | 33.52 | 0.81 | 0.65 | 2.41 | −0.06 | −0.16 |
| 23YN | 30.10 | 32.21 | 34.30 | 29.60 | 32.23 | 0.95 | 0.91 | 2.96 | −0.26 | −0.14 | |
| BLUP | 32.55 | 32.62 | 33.69 | 31.91 | 32.87 | 0.30 | 0.09 | 0.91 | 0.75 | −0.16 | |
| Isoleucine (Ile) | 23CQ | 18.20 | 17.20 | 19.10 | 16.90 | 17.90 | 0.39 | 0.15 | 2.17 | 0.53 | −0.02 |
| 23YN | 16.40 | 17.89 | 19.10 | 16.80 | 17.91 | 0.47 | 0.22 | 2.63 | 0.22 | 0.01 | |
| BLUP | 18.04 | 17.65 | 18.41 | 17.32 | 17.96 | 0.19 | 0.04 | 1.08 | 0.51 | −0.27 | |
| Tryptophan (Trp) | 23CQ | 4.20 | 4.10 | 4.20 | 2.90 | 3.53 | 0.31 | 0.09 | 8.70 | −0.63 | 0.08 |
| 23YN | 2.90 | 2.40 | 3.50 | 1.00 | 2.39 | 0.53 | 0.28 | 22.22 | 0.41 | −0.20 | |
| BLUP | 3.00 | 2.98 | 3.00 | 2.94 | 2.97 | 0.01 | 0.00 | 0.44 | 0.09 | 0.13 | |
| QTL | Env. a | Chr. | Nearest Marker | Interval (cm) | LOD | PVE (%) b | Additive | Dominance |
|---|---|---|---|---|---|---|---|---|
| qVal02.1 | 23CQ | 2 | SWU02139 | 120.80–127.32 | 3.26 | 8.40 | 0.16 | −0.10 |
| BLUP | 2 | SWU02139 | 123.78–133.32 | 4.81 | 11.30 | 0.06 | −0.07 | |
| qVal02.2 | 23YN | 2 | SWU02111 | 83.91–87.96 | 3.44 | 9.90 | 0.23 | 0.10 |
| BLUP | 2 | SWU02111 | 83.91–89.96 | 3.51 | 8.40 | 0.06 | 0.02 | |
| qVal05.1 | 23YN | 5 | SWU05070 | 60.09–81.33 | 4.79 | 13.50 | 0.19 | 0.34 |
| BLUP | 5 | SWU05070 | 57.02–82.33 | 5.68 | 13.30 | 0.07 | 0.09 | |
| qVal07.1 | 23CQ | 7 | SWU07003 | 0.00–4.32 | 3.93 | 10.10 | −0.01 | 0.33 |
| BLUP | 7 | SWU07003 | 0.00–6.32 | 3.21 | 12.70 | −0.01 | 0.13 | |
| qVal12.1 | 23YN | 12 | SWU12060 | 0.00–12.31 | 4.76 | 13.40 | 0.19 | 0.32 |
| BLUP | 12 | SWU12060 | 0.00–12.31 | 5.67 | 13.20 | 0.05 | 0.11 | |
| qVal12.2 | 23CQ | 12 | satt302 | 20.31–44.01 | 5.18 | 13.10 | 0.19 | −0.32 |
| BLUP | 12 | satt302 | 20.31–44.01 | 4.38 | 8.40 | 0.04 | 0.10 | |
| qVal14.1 | 23YN | 14 | SWU14003 | 1.00–7.38 | 4.74 | 13.40 | 0.25 | 0.12 |
| BLUP | 14 | SWU14003 | 1.00–6.38 | 3.92 | 20.30 | 0.11 | −0.01 | |
| qVal17.1 | 23CQ | 17 | satt672 | 0.00–10.02 | 4.85 | 11.60 | 0.22 | −0.03 |
| BLUP | 17 | satt672 | 0.00–16.06 | 9.09 | 9.80 | 0.03 | 0.11 | |
| qVal17.2 | 23YN | 17 | satt543 | 39.79–48.35 | 4.68 | 13.20 | 0.07 | 0.45 |
| BLUP | 17 | satt543 | 38.17–46.35 | 3.52 | 8.60 | −0.05 | 0.06 | |
| qVal19.1 | 23YN | 19 | satt229 | 44.29–77.98 | 4.64 | 13.10 | 0.25 | 0.27 |
| BLUP | 19 | satt229 | 46.29–79.98 | 5.25 | 12.30 | 0.09 | 0.04 | |
| qThr01.1 | 23CQ | 1 | SWU01114 | 108.81–123.18 | 4.30 | 11.00 | 0.10 | −0.14 |
| 23YN | 1 | SWU01114 | 113.86–116.14 | 3.49 | 10.00 | 0.05 | 0.41 | |
| qThr02.1 | 23YN | 2 | SWU02139 | 123.78–132.32 | 4.70 | 13.30 | 0.08 | −0.36 |
| BLUP | 2 | SWU02139 | 123.08–135.32 | 5.53 | 12.90 | 0.03 | −0.08 | |
| qThr12.1 | 23YN | 12 | SWU12060 | 0.00–9.48 | 3.83 | 10.90 | 0.19 | 0.19 |
| BLUP | 12 | satt279 | 2.21–10.48 | 4.09 | 9.70 | 0.04 | 0.04 | |
| qThr17.1 | 23YN | 17 | CSSR036 | 2.00–12.27 | 4.10 | 11.70 | 0.25 | 0.06 |
| BLUP | 17 | satt672 | 1.00–12.27 | 4.83 | 11.40 | 0.06 | 0.00 | |
| qThr18.1 | 23YN | 18 | GMES144 | 212.53–217.37 | 4.69 | 13.20 | −0.13 | 0.30 |
| BLUP | 18 | GMES107 | 206.95–215.83 | 4.41 | 10.50 | −0.01 | 0.09 | |
| qPhe02.1 | 23YN | 2 | SWU02120 | 82.91–97.74 | 5.06 | 14.20 | 0.29 | 0.18 |
| BLUP | 2 | SWU02120 | 91.38–97.74 | 4.50 | 10.60 | 0.08 | 0.05 | |
| qPhe02.2 | 23YN | 2 | SWU02139 | 123.78–140.25 | 6.25 | 17.90 | 0.37 | −0.01 |
| BLUP | 2 | SWU02139 | 123.78–140.25 | 7.47 | 17.10 | 0.10 | −0.04 | |
| qPhe06.1 | 23YN | 6 | CJ06013 | 12.84–24.14 | 4.12 | 11.70 | 0.31 | 0.09 |
| BLUP | 6 | CJ06012 | 5.27–26.14 | 4.40 | 10.40 | 0.09 | 0.01 | |
| qPhe10.1 | 23CQ | 10 | GMES055 | 98.16–114.13 | 3.15 | 8.20 | 0.17 | 0.13 |
| 23YN | 10 | satt473 | 110.16–115.92 | 3.56 | 10.20 | 0.23 | 0.22 | |
| BLUP | 10 | GMES055 | 101.16–117.49 | 5.02 | 11.80 | 0.08 | 0.06 | |
| qPhe11.1 | 23CQ | 11 | GMES069 | 11.00–24.47 | 3.61 | 9.30 | 0.19 | −0.07 |
| 23YN | 11 | GMES069 | 12.00–29.60 | 4.39 | 12.40 | 0.29 | −0.06 | |
| BLUP | 11 | GMES069 | 7.00–37.60 | 6.37 | 14.70 | 0.10 | −0.02 | |
| qPhe12.1 | 23CQ | 12 | satt279 | 0.00–6.48 | 5.55 | 14.00 | 0.07 | 0.36 |
| BLUP | 12 | SWU12060 | 0.00–3.21 | 4.78 | 11.30 | 0.03 | 0.13 | |
| qPhe12.2 | 23CQ | 12 | SWU12031 | 24.93–31.91 | 4.29 | 11.00 | 0.18 | 0.12 |
| 23YN | 12 | SWU12031 | 16.81–31.91 | 5.86 | 16.30 | 0.28 | 0.24 | |
| BLUP | 12 | SWU12031 | 14.81–31.91 | 7.64 | 17.40 | 0.09 | 0.08 | |
| qPhe13.1 | 23YN | 13 | sat039 | 0.00–13.03 | 3.58 | 10.30 | 0.21 | −0.35 |
| BLUP | 13 | satt149 | 0.00–15.39 | 3.85 | 9.20 | 0.07 | −0.10 | |
| qPhe15.1 | 23YN | 15 | satt573 | 85.70–99.41 | 4.00 | 11.40 | −0.35 | −0.12 |
| BLUP | 15 | CSSR014 | 90.29–99.41 | 4.38 | 10.40 | −0.11 | −0.09 | |
| qPhe17.1 | 23YN | 17 | sat220 | 12.27–19.39 | 7.29 | 19.80 | 0.40 | 0.03 |
| BLUP | 17 | sat220 | 11.27–19.39 | 6.90 | 15.90 | 0.11 | 0.00 | |
| qPhe18.1 | 23YN | 18 | SWU18055 | 89.50–103.74 | 4.02 | 11.50 | −0.20 | −0.30 |
| BLUP | 18 | SWU18055 | 90.09–100.92 | 3.39 | 8.10 | −0.03 | −0.12 | |
| qPhe18.2 | 23YN | 18 | sat358 | 112.44–135.51 | 6.29 | 9.60 | −0.14 | 0.32 |
| BLUP | 18 | SWU18062 | 121.51–139.54 | 4.24 | 10.10 | −0.06 | −0.08 | |
| qPhe19.1 | 23YN | 19 | satt373 | 86.71–95.95 | 8.97 | 23.80 | 0.46 | 0.05 |
| BLUP | 19 | satt373 | 80.64–95.95 | 6.53 | 15.10 | 0.12 | 0.00 | |
| qMet02.1 | 23CQ | 2 | SWU02139 | 115.36–141.25 | 5.40 | 13.60 | 0.19 | −0.03 |
| BLUP | 2 | SWU02136 | 116.36–125.78 | 3.42 | 8.20 | 0.02 | −0.04 | |
| qMet03.1 | 23CQ | 3 | satt641 | 30.76–45.90 | 5.22 | 13.20 | 0.11 | 0.20 |
| BLUP | 3 | satt641 | 35.51–53.90 | 4.30 | 10.20 | 0.03 | 0.04 | |
| qMet09.1 | 23CQ | 9 | SWU09056 | 11.57–19.03 | 4.71 | 12.00 | 0.09 | −0.23 |
| 23YN | 9 | SWU09060 | 17.03–21.43 | 4.02 | 11.50 | 0.15 | 0.54 | |
| qMet17.1 | BLUP | 17 | GMES100 | 0.00–15.27 | 4.08 | 9.70 | 0.04 | 0.02 |
| 23CQ | 17 | sat326 | 0.00–5.85 | 3.93 | 10.10 | 0.16 | −0.03 | |
| qLys02.1 | 23CQ | 2 | SWU02145 | 134.32–137.32 | 3.14 | 8.10 | 0.11 | −0.22 |
| 23YN | 2 | SWU02139 | 123.78–134.32 | 5.93 | 16.40 | 0.20 | −0.36 | |
| BLUP | 2 | SWU02139 | 123.78–138.32 | 6.21 | 14.40 | 0.05 | −0.09 | |
| qLys06.1 | 23CQ | 6 | SWU06041 | 46.31–55.40 | 5.19 | 13.10 | 0.19 | 0.07 |
| BLUP | 6 | SWU06041 | 48.31–53.01 | 3.49 | 8.40 | 0.05 | 0.03 | |
| qLys10.1 | BLUP | 10 | SWU10052 | 121.49–129.91 | 4.13 | 9.80 | 0.05 | 0.03 |
| 23YN | 10 | SWU10052 | 123.49–130.91 | 3.92 | 11.20 | 0.19 | 0.25 | |
| qLys17.1 | 23YN | 17 | satt672 | 0.00–16.06 | 5.51 | 15.40 | 0.34 | 0.06 |
| BLUP | 17 | satt672 | 1.00–12.27 | 4.73 | 11.20 | 0.06 | −0.01 | |
| qLys18.1 | 23YN | 18 | GMES107 | 197.52–212.53 | 6.25 | 17.20 | −0.09 | 0.54 |
| BLUP | 18 | GMES107 | 207.95–217.37 | 4.19 | 10.00 | 0.00 | 0.10 | |
| qLys19.1 | 23YN | 19 | satt229 | 55.29–80.64 | 3.91 | 11.20 | 0.28 | 0.11 |
| BLUP | 19 | satt229 | 57.29–64.98 | 3.06 | 7.40 | 0.05 | 0.01 | |
| qLeu02.1 | 23YN | 2 | SWU02139 | 123.78–141.25 | 7.23 | 19.70 | 0.52 | −0.14 |
| BLUP | 2 | SWU02139 | 123.78–138.32 | 5.90 | 13.70 | 0.12 | −0.08 | |
| qLeu06.1 | 23YN | 6 | CJ06012 | 10.30–19.84 | 3.83 | 11.00 | 0.45 | 0.14 |
| BLUP | 6 | CJ06013 | 10.30–16.84 | 3.17 | 7.60 | 0.12 | 0.02 | |
| qLeu07.1 | 23CQ | 7 | SWU07003 | 0.00–5.32 | 3.79 | 9.70 | 0.14 | 0.48 |
| BLUP | 7 | SWU07001 | 0.00–5.32 | 4.73 | 11.20 | 0.03 | 0.20 | |
| qLeu11.1 | BLUP | 11 | GMES069 | 10.00–24.47 | 4.52 | 10.70 | 0.13 | −0.02 |
| 23YN | 11 | GMES069 | 13.00–21.47 | 3.90 | 11.10 | 0.42 | −0.03 | |
| qLeu12.1 | 23CQ | 12 | satt279 | 0.00–7.48 | 4.97 | 12.60 | 0.22 | 0.51 |
| BLUP | 12 | SWU12060 | 0.00–8.48 | 6.25 | 14.50 | 0.08 | 0.19 | |
| qLeu12.2 | 23YN | 12 | SWU12031 | 16.81–31.91 | 6.43 | 17.70 | 0.44 | 0.43 |
| BLUP | 12 | SWU12031 | 20.93–31.91 | 6.16 | 14.30 | 0.12 | 0.13 | |
| qLeu19.1 | 23YN | 19 | satt373 | 86.71–95.95 | 7.95 | 21.40 | 0.67 | 0.13 |
| BLUP | 19 | satt373 | 87.71–94.73 | 4.49 | 10.60 | 0.15 | −0.01 | |
| qIle01.1 | 23CQ | 1 | SWU01114 | 106.81–129.4 | 5.83 | 14.60 | 0.14 | −0.17 |
| 23YN | 1 | SWU01117 | 108.81–113.86 | 3.84 | 11.00 | 0.04 | 0.43 | |
| qIle02.1 | 23YN | 2 | SWU02139 | 116.36–132.32 | 5.09 | 14.30 | 0.15 | −0.23 |
| 23CQ | 2 | SWU02139 | 128.32–135.32 | 3.45 | 8.90 | 0.13 | −0.16 | |
| qIle12.1 | 23YN | 12 | SWU12060 | 0.00–3.21 | 4.00 | 11.40 | 0.15 | 0.21 |
| BLUP | 12 | SWU12060 | 0.00–13.31 | 5.02 | 11.90 | 0.05 | 0.11 | |
| qIle12.2 | 23CQ | 12 | satt302 | 14.31–35.07 | 4.22 | 10.80 | 0.18 | −0.17 |
| BLUP | 12 | SWU12031 | 23.93–31.91 | 6.04 | 14.20 | 0.08 | 0.09 | |
| qIle19.1 | BLUP | 19 | satt229 | 49.29–72.98 | 4.01 | 9.60 | 0.08 | 0.04 |
| 23YN | 19 | satt229 | 60.29–72.98 | 4.08 | 11.60 | 0.20 | 0.18 | |
| qTrp03.1 | 23CQ | 3 | satt641 | 31.51–43.90 | 3.57 | 9.20 | −0.09 | −0.11 |
| BLUP | 3 | satt641 | 36.90–60.90 | 4.28 | 10.20 | 0.00 | −0.01 | |
| qTrp19.1 | 23YN | 19 | satt156 | 2.00–8.63 | 4.68 | 13.20 | −0.21 | −0.32 |
| BLUP | 19 | sat340 | 4.00–10.63 | 4.08 | 9.70 | −0.01 | −0.01 |
| Cluster | Chr. | Contained QTL | Env. a | Interval (cm) | LOD |
|---|---|---|---|---|---|
| Loci01.1 | 1 | qThr01.1 | 23CQ | 108.81–123.18 | 4.3 |
| 23YN | 113.86–116.14 | 3.49 | |||
| qIle01.1 | 23CQ | 106.81–129.4 | 5.83 | ||
| 23YN | 108.81–113.86 | 3.84 | |||
| Loci02.1 | 2 | qVal02.1 | 23CQ | 120.80–127.32 | 3.26 |
| BLUP | 123.78–133.32 | 4.81 | |||
| qThr02.1 | 23YN | 123.78–132.32 | 4.7 | ||
| BLUP | 123.08–135.32 | 5.53 | |||
| qPhe02.2 | 23YN | 123.78–140.25 | 6.25 | ||
| BLUP | 123.78–140.25 | 7.47 | |||
| qMet02.1 | 23CQ | 115.36–141.25 | 5.4 | ||
| BLUP | 116.36–125.78 | 3.42 | |||
| qLys02.1 | 23CQ | 134.32–137.32 | 3.14 | ||
| 23YN | 123.78–134.32 | 5.93 | |||
| BLUP | 123.78–138.32 | 6.21 | |||
| qLeu02.1 | 23YN | 123.78–141.25 | 7.23 | ||
| BLUP | 123.78–138.32 | 5.9 | |||
| qIle02.1 | 23YN | 116.36–132.32 | 5.09 | ||
| 23CQ | 128.32–135.32 | 3.45 | |||
| Loci02.2 | 2 | qVal02.2 | 23YN | 83.91–87.96 | 3.44 |
| BLUP | 83.91–89.96 | 3.51 | |||
| qPhe02.1 | 23YN | 82.91–97.74 | 5.06 | ||
| BLUP | 91.38–97.74 | 4.5 | |||
| Loci03.1 | 3 | qMet03.1 | 23CQ | 30.76–45.90 | 5.22 |
| BLUP | 35.51–53.90 | 4.3 | |||
| qTrP03.1 | 23CQ | 31.51–43.90 | 3.57 | ||
| BLUP | 36.90–60.90 | 4.28 | |||
| Loci06.1 | 6 | qPhe06.1 | 23YN | 12.84–24.14 | 4.12 |
| BLUP | 5.27–26.14 | 4.4 | |||
| qLeu06.1 | 23YN | 10.30–19.84 | 3.83 | ||
| BLUP | 10.30–16.84 | 3.17 | |||
| Loci07.1 | 7 | qVal07.1 | 23CQ | 0.00–4.32 | 3.93 |
| BLUP | 0.00–6.32 | 3.21 | |||
| qLeu07.1 | 23CQ | 0.00–5.32 | 3.79 | ||
| BLUP | 0.00–5.32 | 4.73 | |||
| Loci011.1 | 11 | qPhe11.1 | 23CQ | 11.00–24.47 | 3.61 |
| 23YN | 12.00–29.60 | 4.39 | |||
| BLUP | 7.00–37.60 | 6.37 | |||
| qLeu11.1 | BLUP | 10.00–24.47 | 4.52 | ||
| 23YN | 13.00–21.47 | 3.9 | |||
| Loci012.1 | 12 | qVal12.1 | 23YN | 0.00–12.31 | 4.76 |
| BLUP | 0.00–12.31 | 5.67 | |||
| qThr12.1 | 23YN | 0.00–9.48 | 3.83 | ||
| BLUP | 2.21–10.48 | 4.09 | |||
| qPhe12.1 | 23CQ | 0.00–6.48 | 5.55 | ||
| BLUP | 0.00–3.21 | 4.78 | |||
| qLeu12.1 | 23CQ | 0.00–7.48 | 4.97 | ||
| BLUP | 0.00–8.48 | 6.25 | |||
| qIle12.1 | 23YN | 0.00–3.21 | 4 | ||
| BLUP | 0.00–13.31 | 5.02 | |||
| Loci012.2 | 12 | qVal12.2 | 23CQ | 20.31–44.01 | 5.18 |
| BLUP | 20.31–44.01 | 4.38 | |||
| qPhe12.2 | 23CQ | 24.93–31.91 | 4.29 | ||
| 23YN | 16.81–31.91 | 5.86 | |||
| BLUP | 14.81–31.91 | 7.64 | |||
| qLeu12.2 | 23YN | 16.81–31.91 | 6.43 | ||
| BLUP | 20.93–31.91 | 6.16 | |||
| qIle12.2 | 23CQ | 14.31–35.07 | 4.22 | ||
| BLUP | 23.93–31.91 | 6.04 | |||
| Loci017.1 | 17 | qVal17.1 | 23CQ | 0.00–10.02 | 4.85 |
| BLUP | 0.00–16.06 | 9.09 | |||
| qThr17.1 | 23YN | 2.00–12.27 | 4.1 | ||
| BLUP | 1.00–12.27 | 4.83 | |||
| qMet17.1 | BLUP | 0.00–15.27 | 4.08 | ||
| 23CQ | 0.00–5.85 | 3.93 | |||
| qLys17.1 | 23YN | 0.00–16.06 | 5.51 | ||
| BLUP | 1.00–12.27 | 4.73 | |||
| Loci018.1 | 18 | qThr18.1 | 23YN | 212.53–217.37 | 4.69 |
| BLUP | 206.95–215.83 | 4.41 | |||
| qLys18.1 | 23YN | 197.52–212.53 | 6.25 | ||
| BLUP | 207.95–217.37 | 4.19 | |||
| Loci019.1 | 19 | qVal19.1 | 23YN | 44.29–77.98 | 4.64 |
| BLUP | 46.29–79.98 | 5.25 | |||
| qLys19.1 | 23YN | 55.29–80.64 | 3.91 | ||
| BLUP | 57.29–64.98 | 3.06 | |||
| qIle19.1 | BLUP | 49.29–72.98 | 4.01 | ||
| 23YN | 60.29–72.98 | 4.08 | |||
| Loci019.2 | 19 | qPhe19.1 | 23YN | 86.71–95.95 | 8.97 |
| BLUP | 80.64–95.95 | 6.53 | |||
| qLeu19.1 | 23YN | 86.71–95.95 | 7.95 | ||
| BLUP | 87.71–94.73 | 4.49 |
| Gene | Arabidopsis Homologs | GO ID | Gene Functional Annotation |
|---|---|---|---|
| Glyma.02g250400 | AT2G39750 | GO:0005634 | nucleus |
| Glyma.02g254000 | AT1G36280 | GO:0003824 | catalytic activity |
| Glyma.02g254300 | AT2G39940 | GO:0005515 | protein binding |
| Glyma.02g256100 | AT3G47570 | GO:0016301 | kinase activity |
| Glyma.02g256200 | AT3G47570 | GO:0005515 | protein binding |
| Glyma.02g260900 | AT5G34930 | GO:0000166 | nucleotide binding |
| Glyma.02g263500 | AT2G40280 | GO:0005576 | extracellular region |
| Glyma.02g263600 | AT2G03430 | GO:0005886 | plasma membrane |
| Glyma.02g263900 | AT5G45840 | GO:0005515 | protein binding |
| Glyma.02g265400 | Null | PF07172 | glycine-rich protein family |
| Glyma.02g265800 | Null | PF07172 | glycine-rich protein family |
| Glyma.02g270000 | AT4G15410 | GO:0005515 | protein binding |
| Glyma.02g270700 | AT3G21630 | GO:0005515 | protein binding |
| Glyma.02g271700 | AT5G20930 | GO:0005515 | protein binding |
| Glyma.11g144900 | AT5G45890 | GO:0005576 | extracellular region |
| Glyma.11g145800 | AT5G60690 | GO:0003700 | sequence-specific DNA binding transcription factor activity |
Disclaimer/Publisher’s Note: The statements, opinions and data contained in all publications are solely those of the individual author(s) and contributor(s) and not of MDPI and/or the editor(s). MDPI and/or the editor(s) disclaim responsibility for any injury to people or property resulting from any ideas, methods, instructions or products referred to in the content. |
© 2024 by the authors. Licensee MDPI, Basel, Switzerland. This article is an open access article distributed under the terms and conditions of the Creative Commons Attribution (CC BY) license (https://creativecommons.org/licenses/by/4.0/).
Share and Cite
Li, X.; Tan, P.; Xiong, G.; Ma, R.; Gao, W.; Jiang, A.; Liu, J.; Du, C.; Zhang, J.; Zhang, X.; et al. Densification of Genetic Map and Stable Quantitative Trait Locus Analysis for Amino Acid Content of Seed in Soybean (Glycine max L.). Plants 2024, 13, 2020. https://doi.org/10.3390/plants13152020
Li X, Tan P, Xiong G, Ma R, Gao W, Jiang A, Liu J, Du C, Zhang J, Zhang X, et al. Densification of Genetic Map and Stable Quantitative Trait Locus Analysis for Amino Acid Content of Seed in Soybean (Glycine max L.). Plants. 2024; 13(15):2020. https://doi.org/10.3390/plants13152020
Chicago/Turabian StyleLi, Xi, Pingting Tan, Guoxi Xiong, Ronghan Ma, Weiran Gao, Aohua Jiang, Jiaqi Liu, Chengzhang Du, Jijun Zhang, Xiaochun Zhang, and et al. 2024. "Densification of Genetic Map and Stable Quantitative Trait Locus Analysis for Amino Acid Content of Seed in Soybean (Glycine max L.)" Plants 13, no. 15: 2020. https://doi.org/10.3390/plants13152020