Article

Genome-Wide Characterization of Glyceraldehyde-3-Phosphate Dehydrogenase Genes and Their Expression Profile under Drought Stress in Quercus rubra

1
Department of Forest Bioresources, National Institute of Forest Science, Suwon 16631, Republic of Korea
2
3BIGS Company Limited, Hwaseong 18469, Republic of Korea
*
Author to whom correspondence should be addressed.
Plants 2024, 13(16), 2312; https://doi.org/10.3390/plants13162312
Submission received: 16 July 2024 / Revised: 14 August 2024 / Accepted: 16 August 2024 / Published: 20 August 2024
(This article belongs to the Special Issue Bioinformatics and Functional Genomics in Modern Plant Science)

Abstract

:
Glyceraldehyde-3-phosphate dehydrogenase (GAPDH) is crucial in plant metabolism and responses to various abiotic stresses. In the glycolysis pathway, glyceraldehyde-3-phosphate (G3P) is oxidized to 1,3-bisphosphate glycerate (1,3-BPG) through the catalytic action of GAPDH. However, the GAPDH gene family in Quercus rubra has been minimally researched. In this study, we identified 13 GAPDH-encoding genes in Q. rubra through a bioinformatics analysis of genomic data. Evolutionary studies suggest that these QrGAPDH genes are closely related to those in Glycine max and Triticum aestivum. We conducted a comprehensive whole-genome study, which included predictions of subcellular localization, gene structure analysis, protein motif identification, chromosomal placement, and analysis of cis-acting regions. We also examined the expression of GAPDH proteins and genes in various tissues of Q. rubra and under drought stress. The results indicated diverse expression patterns across different tissues and differential expression under drought conditions. Notably, the expression of Qurub.02G290300.1, Qurub.10G209800.1, and Qrub.M241600.1 significantly increased in the leaf, stem, and root tissues under drought stress. This study provides a systematic analysis of QrGAPDH genes, suggesting their pivotal roles in the drought stress response of trees.

1. Introduction

Glycolysis is a metabolic pathway that converts glucose into two molecules of pyruvic acid. This process takes place in the cytoplasm, does not require oxygen, and generates ATP energy through substrate-level phosphorylation. Consequently, glycolysis is a crucial pathway that supports metabolic activity under anaerobic conditions. In addition, it supplies ATP, reducing agents, and vital precursors necessary for the growth and development of plants while also facilitating cellular adaptation to cold, drought, and anoxic conditions. [1,2]. Glyceraldehyde-3-phosphate dehydrogenase (EC 1.2.1.12) (GAPDH) is an enzyme that catalyzes the sixth step of glycolysis. In this step, the aldehyde group of glyceraldehyde 3-phosphate is oxidized, and inorganic phosphoric acid is incorporated to form 1,3-bisphosphoglycerate. This reaction enables the reversible transformation of glyceraldehyde 3-phosphate into 1,3-bisphosphoglycerate. Initially, GAPDH was employed as an internal reference for gene expression and protein studies [3]. However, subsequent research has demonstrated that GAPDH is not suitable as an internal reference gene [4,5]. Recent studies have shown that GAPDH is not only involved in glycolysis but also plays a significant role in various abiotic stress responses. For instance, the overexpression of TaGApC in Arabidopsis has been shown to improve drought tolerance [6]. Similarly, potato and rice plants overexpressing PsGAPDH have exhibited increased salt tolerance [7,8]. Furthermore, GAPDH has been found to form immune complexes with protein kinases activated during osmotic stress in salt-treated tobacco cells [9,10]. These findings underscore the pivotal role of GAPDH in enhancing plant tolerance to abiotic stresses [11].
Plants are constantly exposed to abiotic (drought, salt, and carbon dioxide) and biotic stresses from the external environment [12,13,14]. Drought, in particular, is a significant abiotic stressor worldwide that impedes plant growth and production, with profound ecological and economic consequences. Consequently, there is considerable interest in understanding the molecular mechanisms of both drought stress and drought resistance across different plant species. While numerous genes involved in stress signal transduction have been identified, the physiological roles these genes play in stress tolerance and susceptibility remain largely underexplored. The GAPDH gene family has been the subject of extensive research across multiple plant species, including Arabidopsis [15], rice [8], maize [16], wheat [11], soybean [17], and sweet orange [18]. However, a comprehensive whole-genome analysis has yet to be conducted in northern red oak. The northern red oak, scientifically referred to as Quercus rubra L. and commonly recognized by several names, including common red oak, eastern red oak, and mountain red oak, is widely distributed across North America and southeastern Canada [19]. It is a moderate- to fast-growing tree, significant as a lumber source and popular as a shade tree due to its ease of transplant, attractive shape, and dense foliage [19]. The role of GAPDH in regulating the molecular mechanisms of drought stress in Q. rubra remains unclear. Therefore, studying the drought resistance mechanisms of red oak and identifying stress-resistant genes is crucial for enhancing the yield and quality of this species. In light of the increasing accessibility of genomic and transcriptomic resources for northern red oak, as provided by the Hardwood Genomics Project [20], this study conducted a thorough analysis of the GAPDH family in red oak.
This study identified 13 members of the GAPDH gene family in Quercus rubra and examined their phylogenetic relationships, gene structures, chromosomal positions, and responses to drought stress in leaf, stem, and root tissues. Additionally, we examined the gene expression patterns in leaf, stem, and root tissues of northern red oak and the expression profiles of the GAPDH genes under conditions of drought stress and subsequent re-watering. These results provide foundational data for further research on the QrGAPDH genes.

2. Results

2.1. Identification of the Proteins Coded by the GAPDH Gene Family and Physicochemical Characterization of QrGAPDH

A total of 13 GAPDH proteins, each featuring conserved Gp_dh_C and Gp_dh_N domains, have been identified as part of the Q. rubra GAPDH family. These proteins have been labeled as GAPDH1-13 according to their chromosomal positions, as outlined in Table 1. The physical and chemical properties of these GAPDH proteins were examined and are summarized in Table 1. The QrGAPDH proteins exhibited variability in length, molecular weight, theoretical isoelectric point, and other characteristics. It is anticipated that the QrGAPDH genes will encode polypeptides ranging from 279 to 452 amino acids, with molecular weights spanning from 30.22 to 48.24 kDa. The theoretical pI values varied from 7.02 to 9.46, the aliphatic index ranged from 81.85 to 96.77, and the grand average of hydropathicity for all QrGAPDH proteins was negative, falling between −0.15 and −0.001, which suggests hydrophilic properties. The predicted count of negatively charged residues (Asp + Glu) in the QrGAPDH proteins was between 29 and 46, while the number of positively charged residues (Arg + Lys) ranged from 33 to 53.
Thirteen QrGAPDH genes were discovered within the genome of the red oak. These genes are clearly categorized into four clades (Figure 1), which correspond to four varieties of plant GAPDHs: GAPB, GAPA-2, GAPC2, and GAPCP-2. GAPB comprises a single gene, QrGAPDH01, and is classified within clade IV. GAPA-2 includes three genes—QrGAPDH02, QrGAPDH04, and QrGAPDH05—and falls under clade III. GAPC2, which contains the most genes, includes QrGAPDH03, QrGAPDH06, QrGAPDH07, QrGAPDH10, QrGAPDH11, QrGAPDH12, and QrGAPDH13, and is categorized in clade II. Additionally, GAPCP-2 consists of QrGAPDH08 and QrGAPDH09 and is assigned to clade I (Table 1).

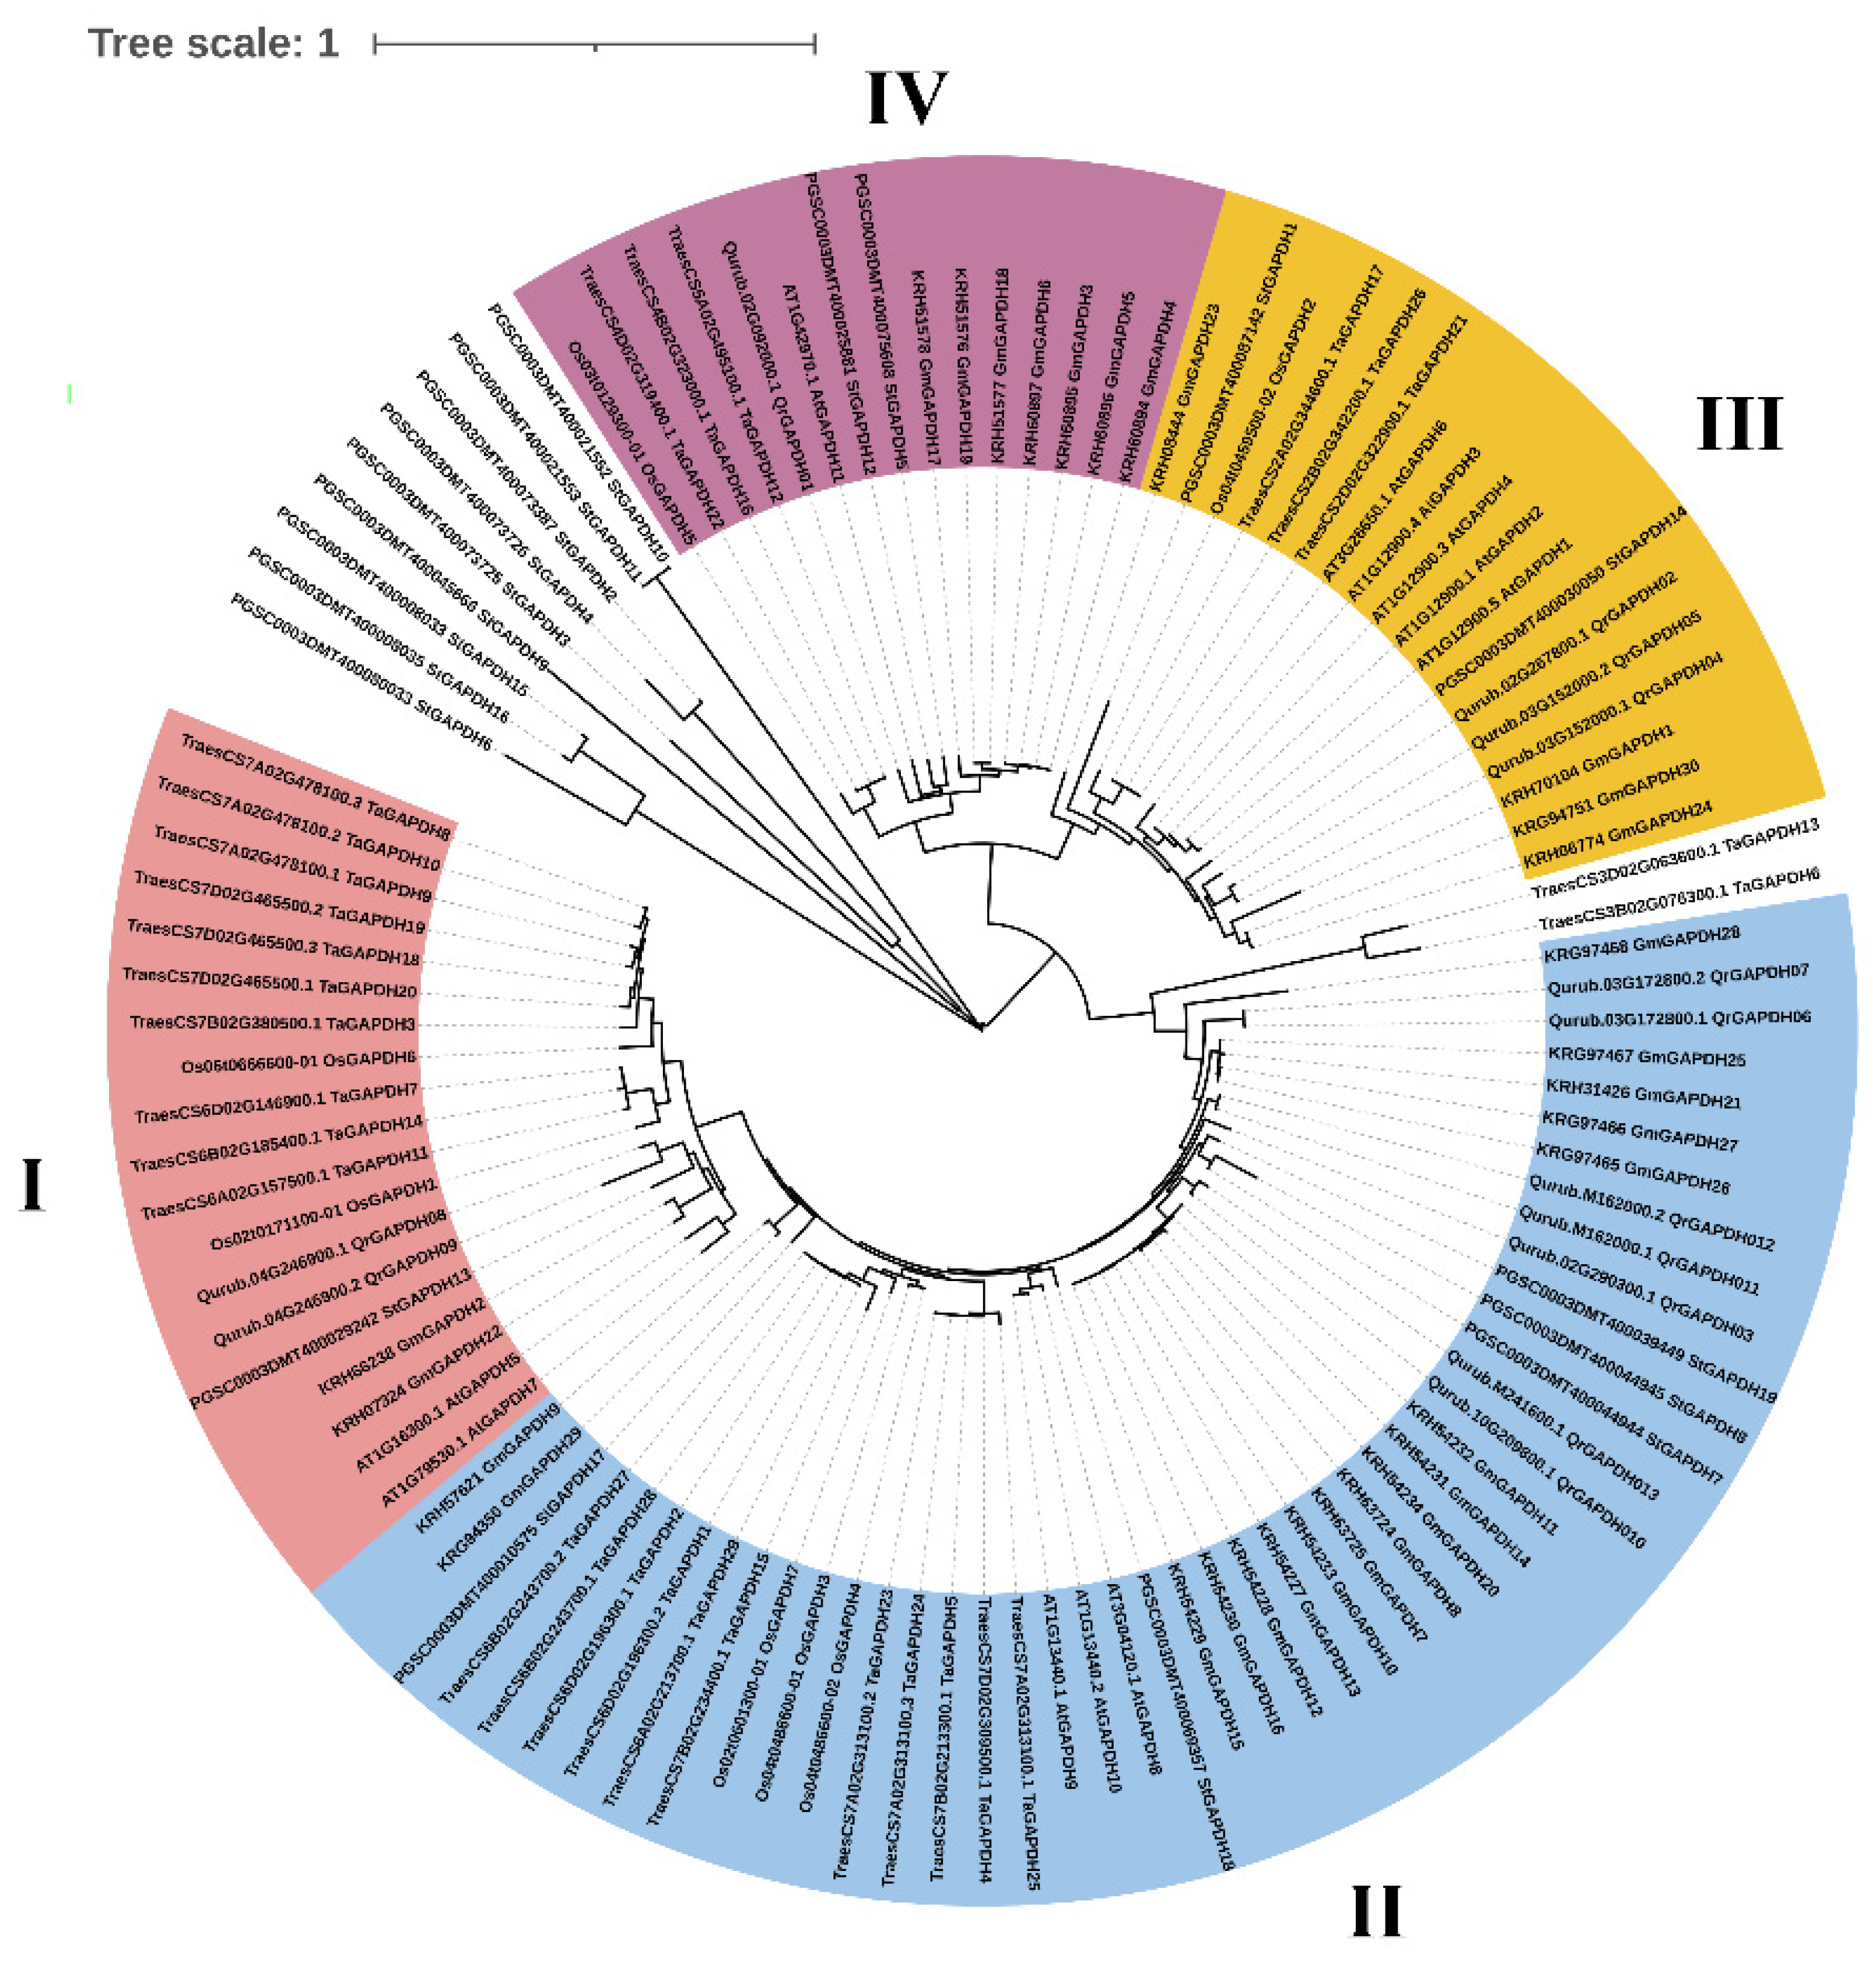
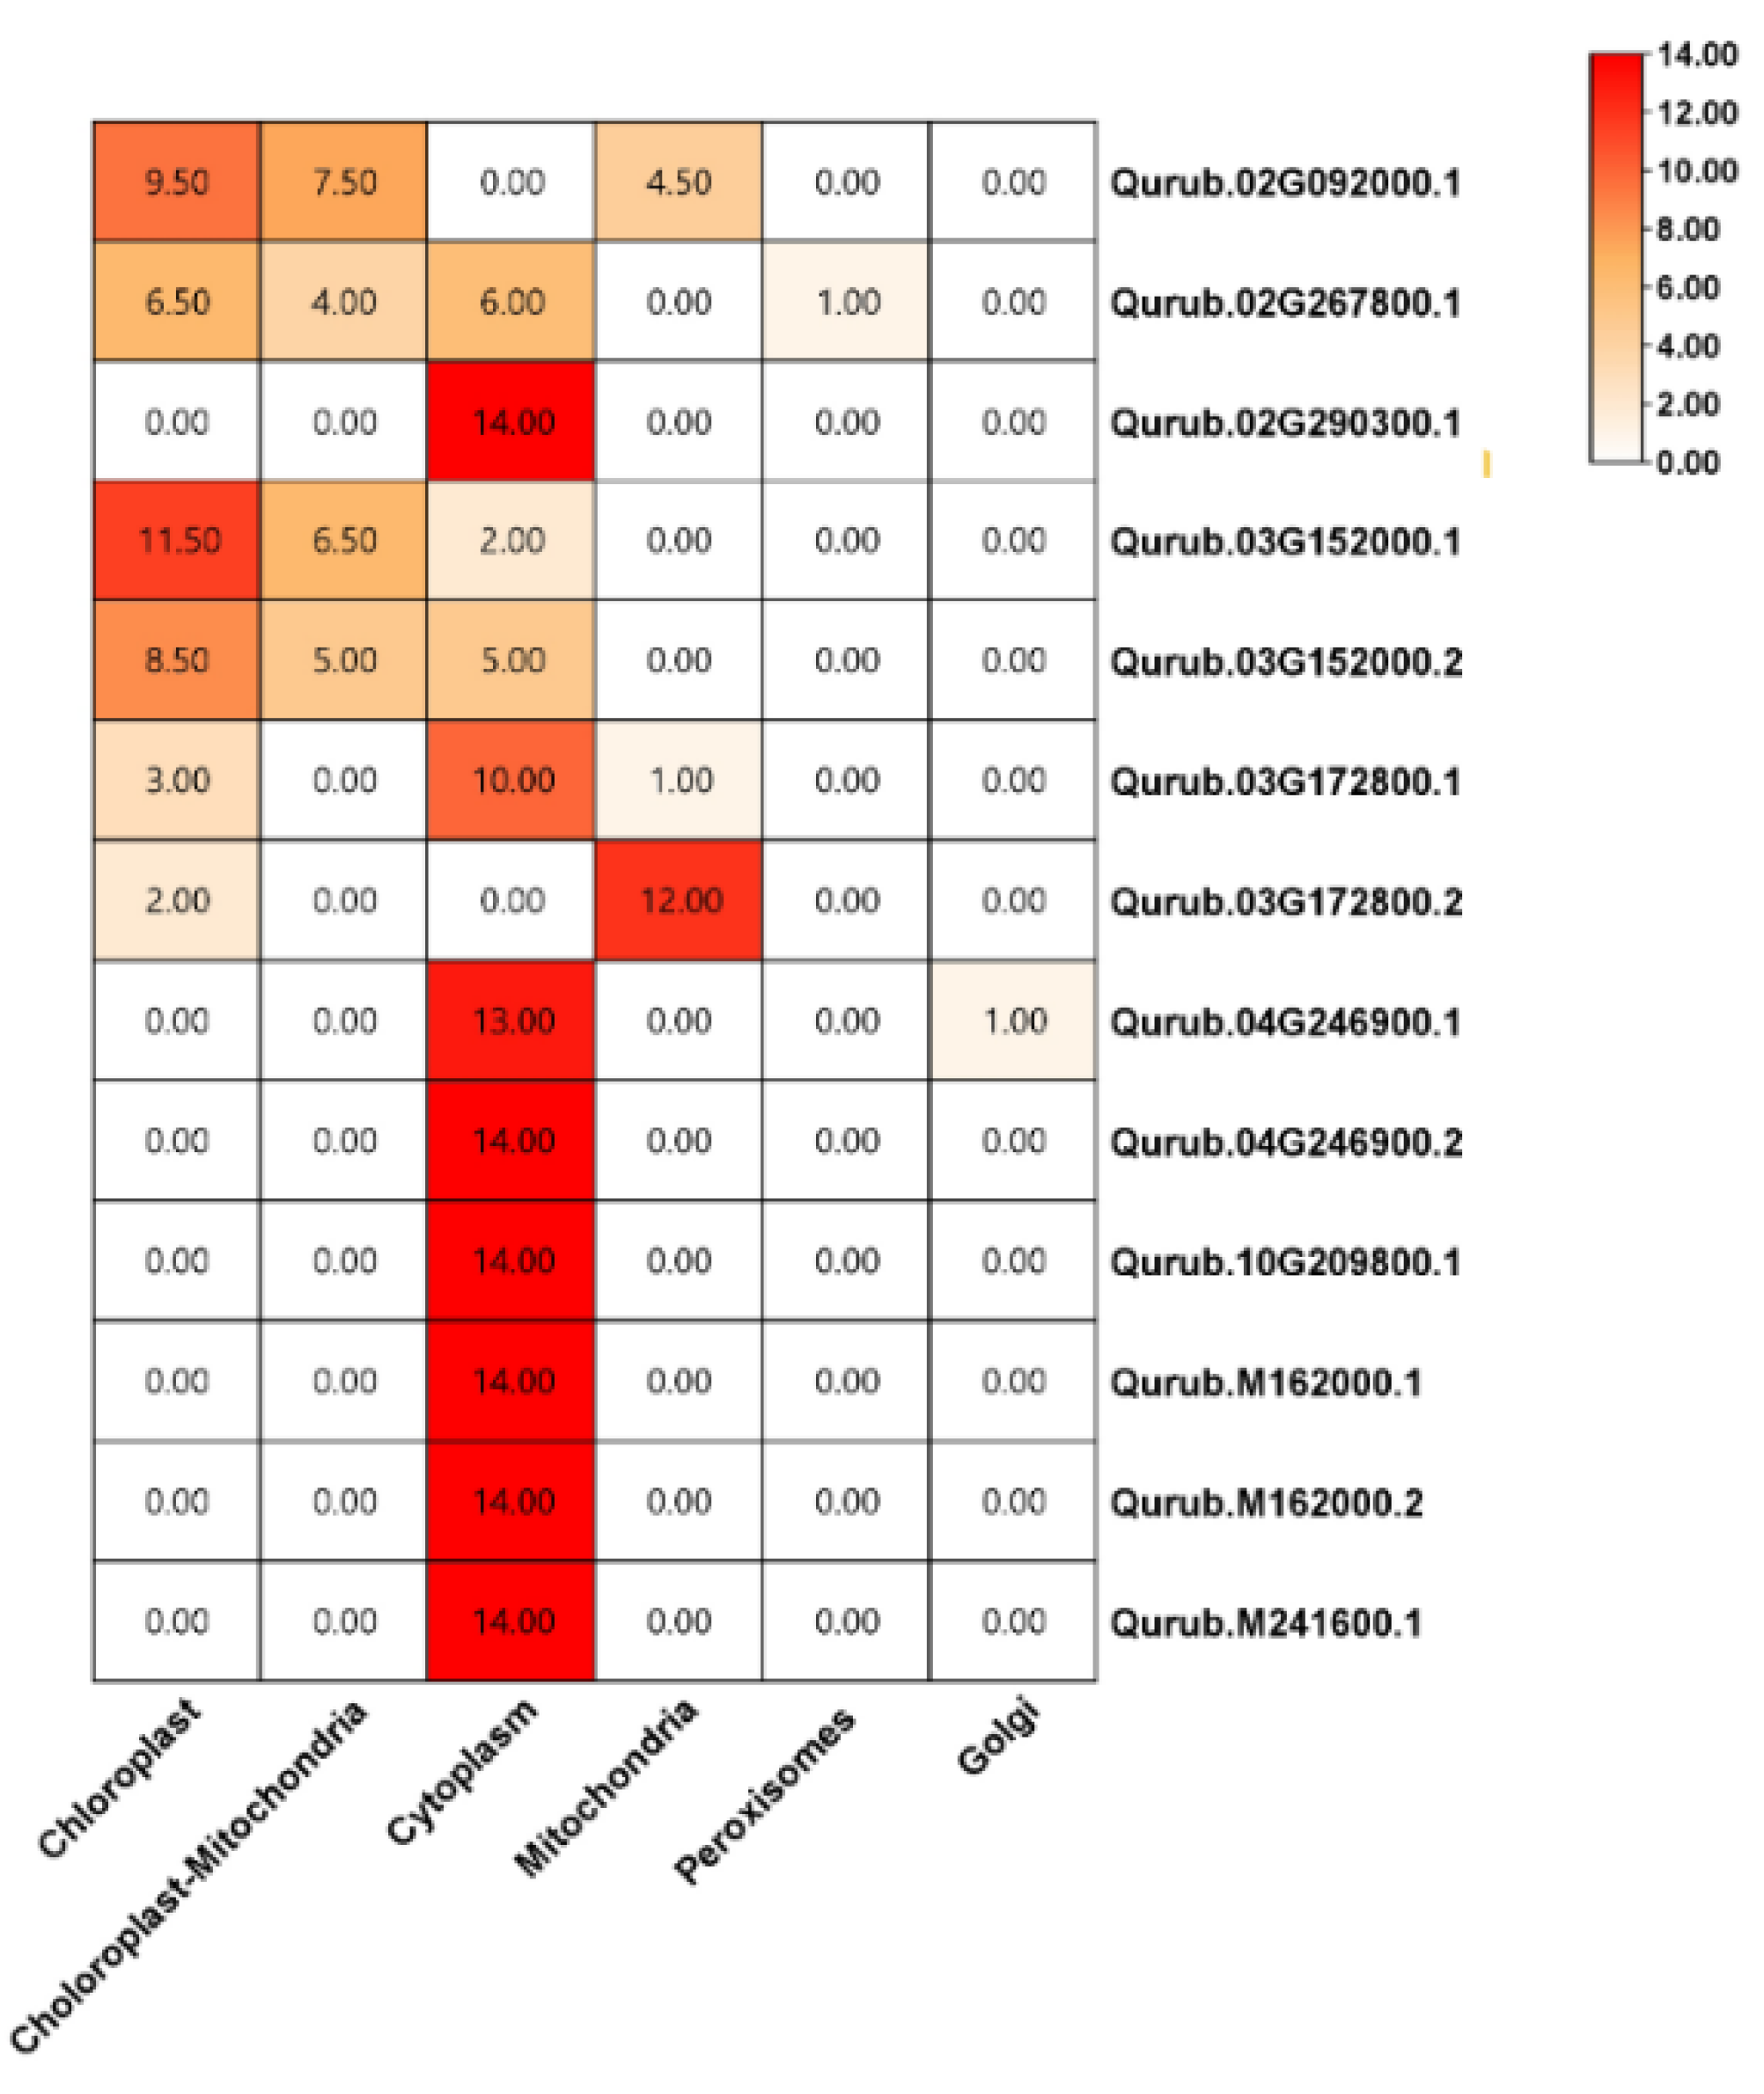
2.2. Phylogenetic Tree and Subcellular Localization of GAPDH Genes

In order to clarify the evolutionary connections among GAPDH proteins, a neighbor-joining phylogenetic tree was constructed. This analysis included 13 QrGAPDH proteins in conjunction with those from various species, including Arabidopsis thaliana, Oryza sativa, Triticum aestivum, Glycine max, and Solanum tuberosum. The resulting phylogenetic tree is illustrated in Figure 1. In this tree, GAPDHs from A. thaliana are labeled AtGAPDH1 to AtGAPDH11 (11 genes), those from O. sativa as OsGAPDH1 to OsGAPDH7 (7 genes), those from T. aestivum as TaGAPDH1 to TaGAPDH29 (29 genes), and those from S. tuberosum as StGAPDH1 to StGAPDH19 (19 genes). The GAPDH family proteins from various plants were identified and extracted using an HMM-based approach with the Pfam domains Pfam00044 and Pfam02800, focusing only on complete genes for the comparative analysis. Proteins QrGAPDH08 and QrGAPDH09 were found in clade I, which contained a high number of GAPDHs from T. aestivum. Most of the QrGAPDH proteins, specifically QrGAPDH03, QrGAPDH06, QrGAPDH07, QrGAPDH10, QrGAPDH11, QrGAPDH12, and QrGAPDH13, were clustered in clade II along with GAPDHs from other species. QrGAPDH02, QrGAPDH04, and QrGAPDH05 were grouped in clade III with most of the AtGAPDHs, while only QrGAPDH01 was clustered in clade IV (Figure 1).
The protein families Qurub.02G092000.1, Qurub.02G267800.1, Qurub.03G152000.1, Qurub.03G152000.2, and Qurub.03G172800.1 were localized in the chloroplast and chloroplast + mitochondria, whereas other proteins such as Qurub.02G290300.1, Qurub.04G246900.1, Qurub.04G246900.2, Qurub.10G209800.1, Qurub.M162000.1, Qurub.M162000.2, and Qurub.M241600.1 were found in the cytoplasm. Additionally, the GAPDH family protein Qurub.03G172800.2 is localized in the mitochondria (Figure 2 and Supplementary Table S1).

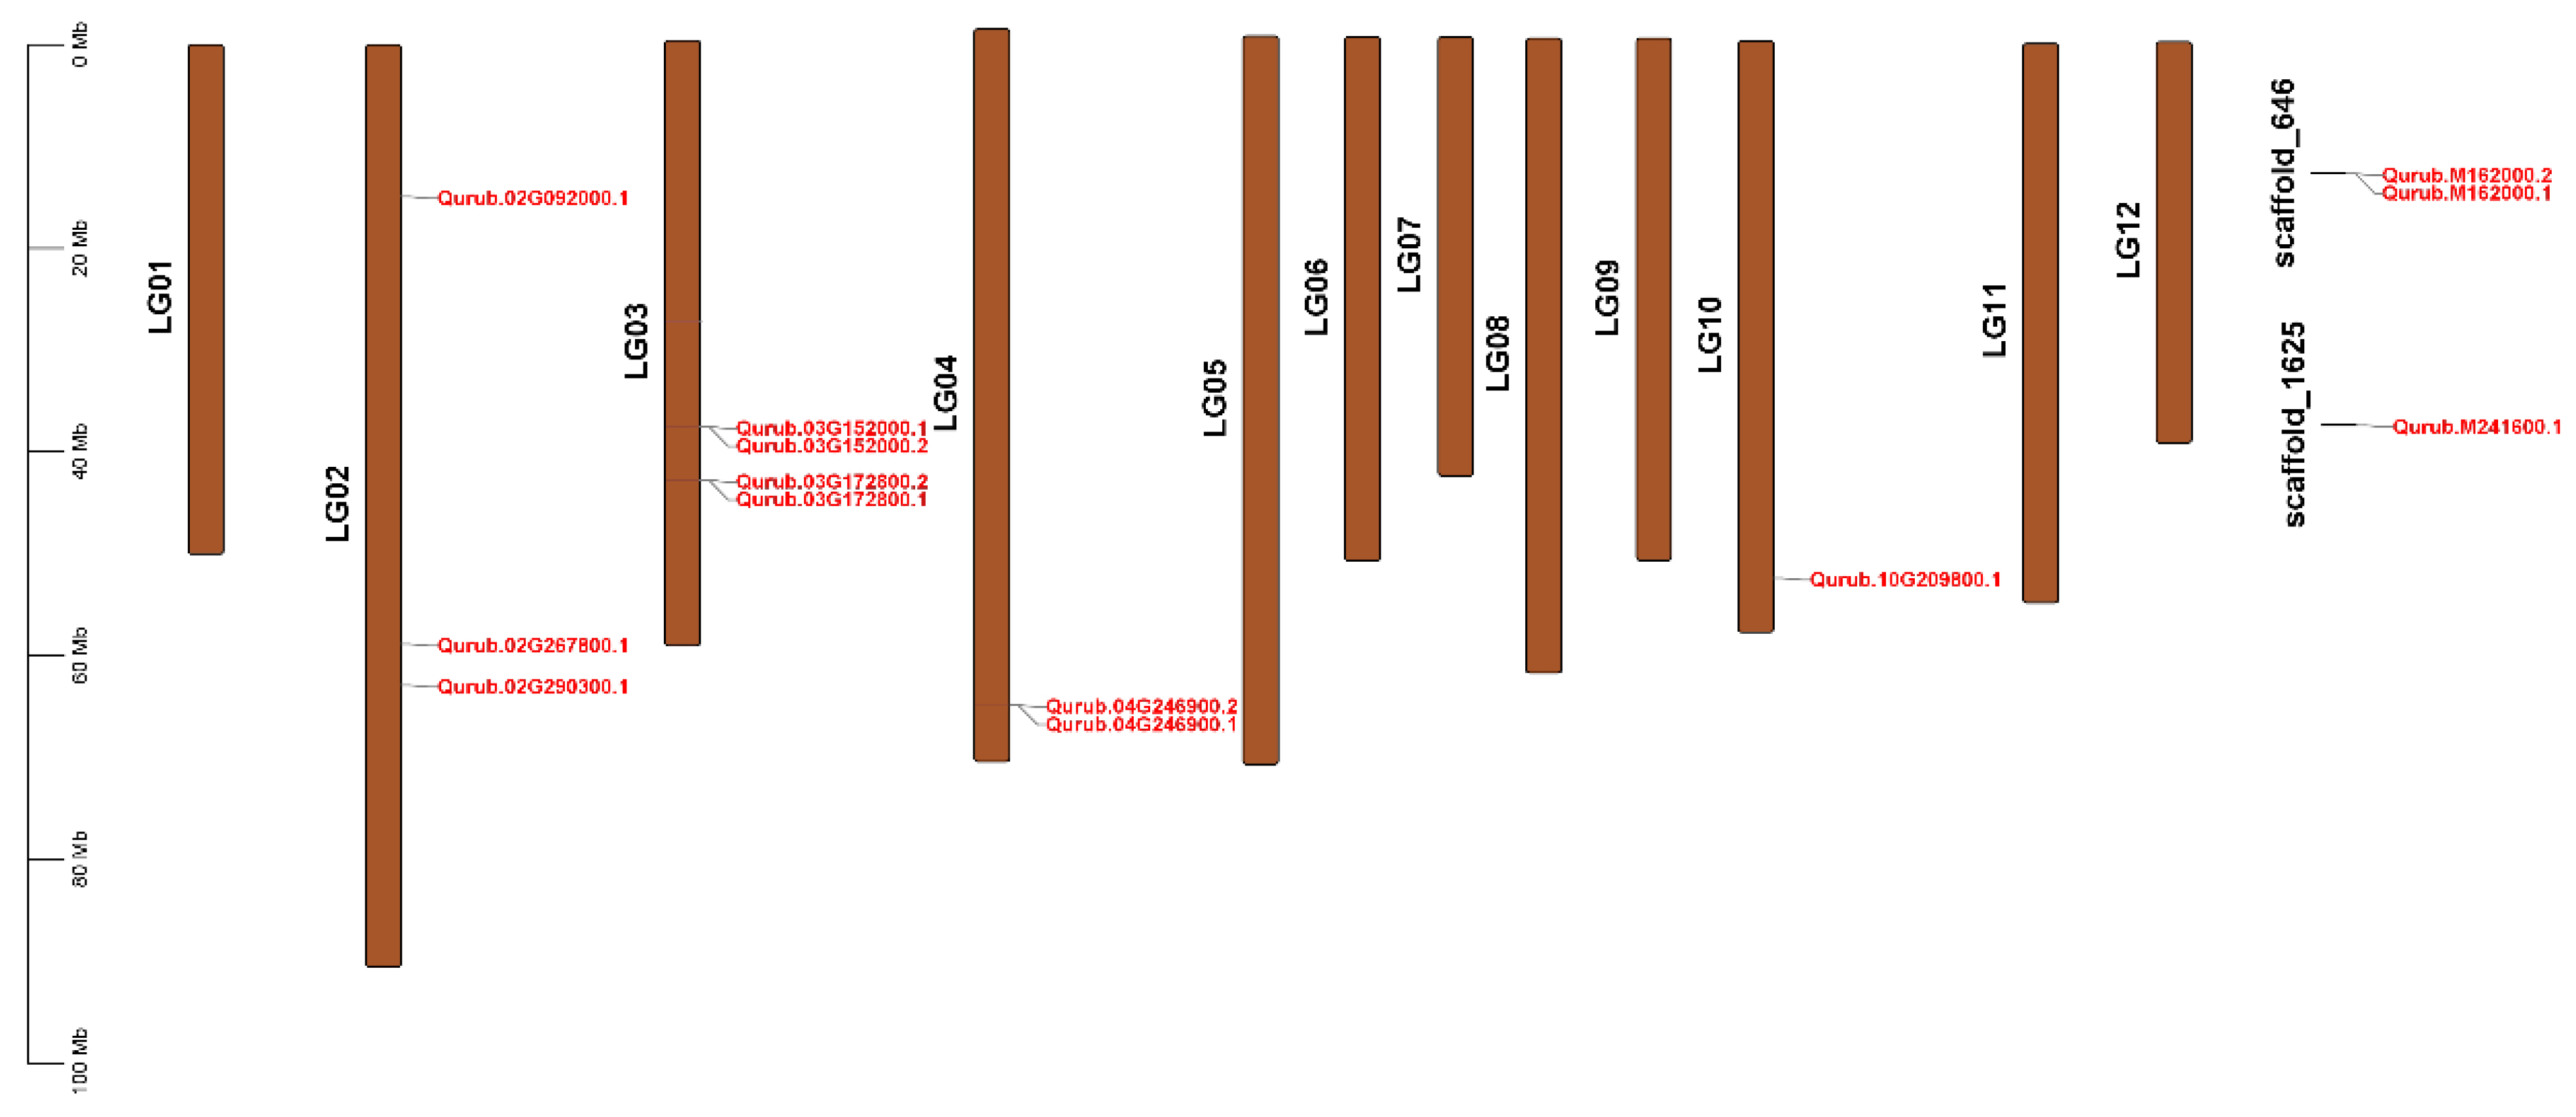
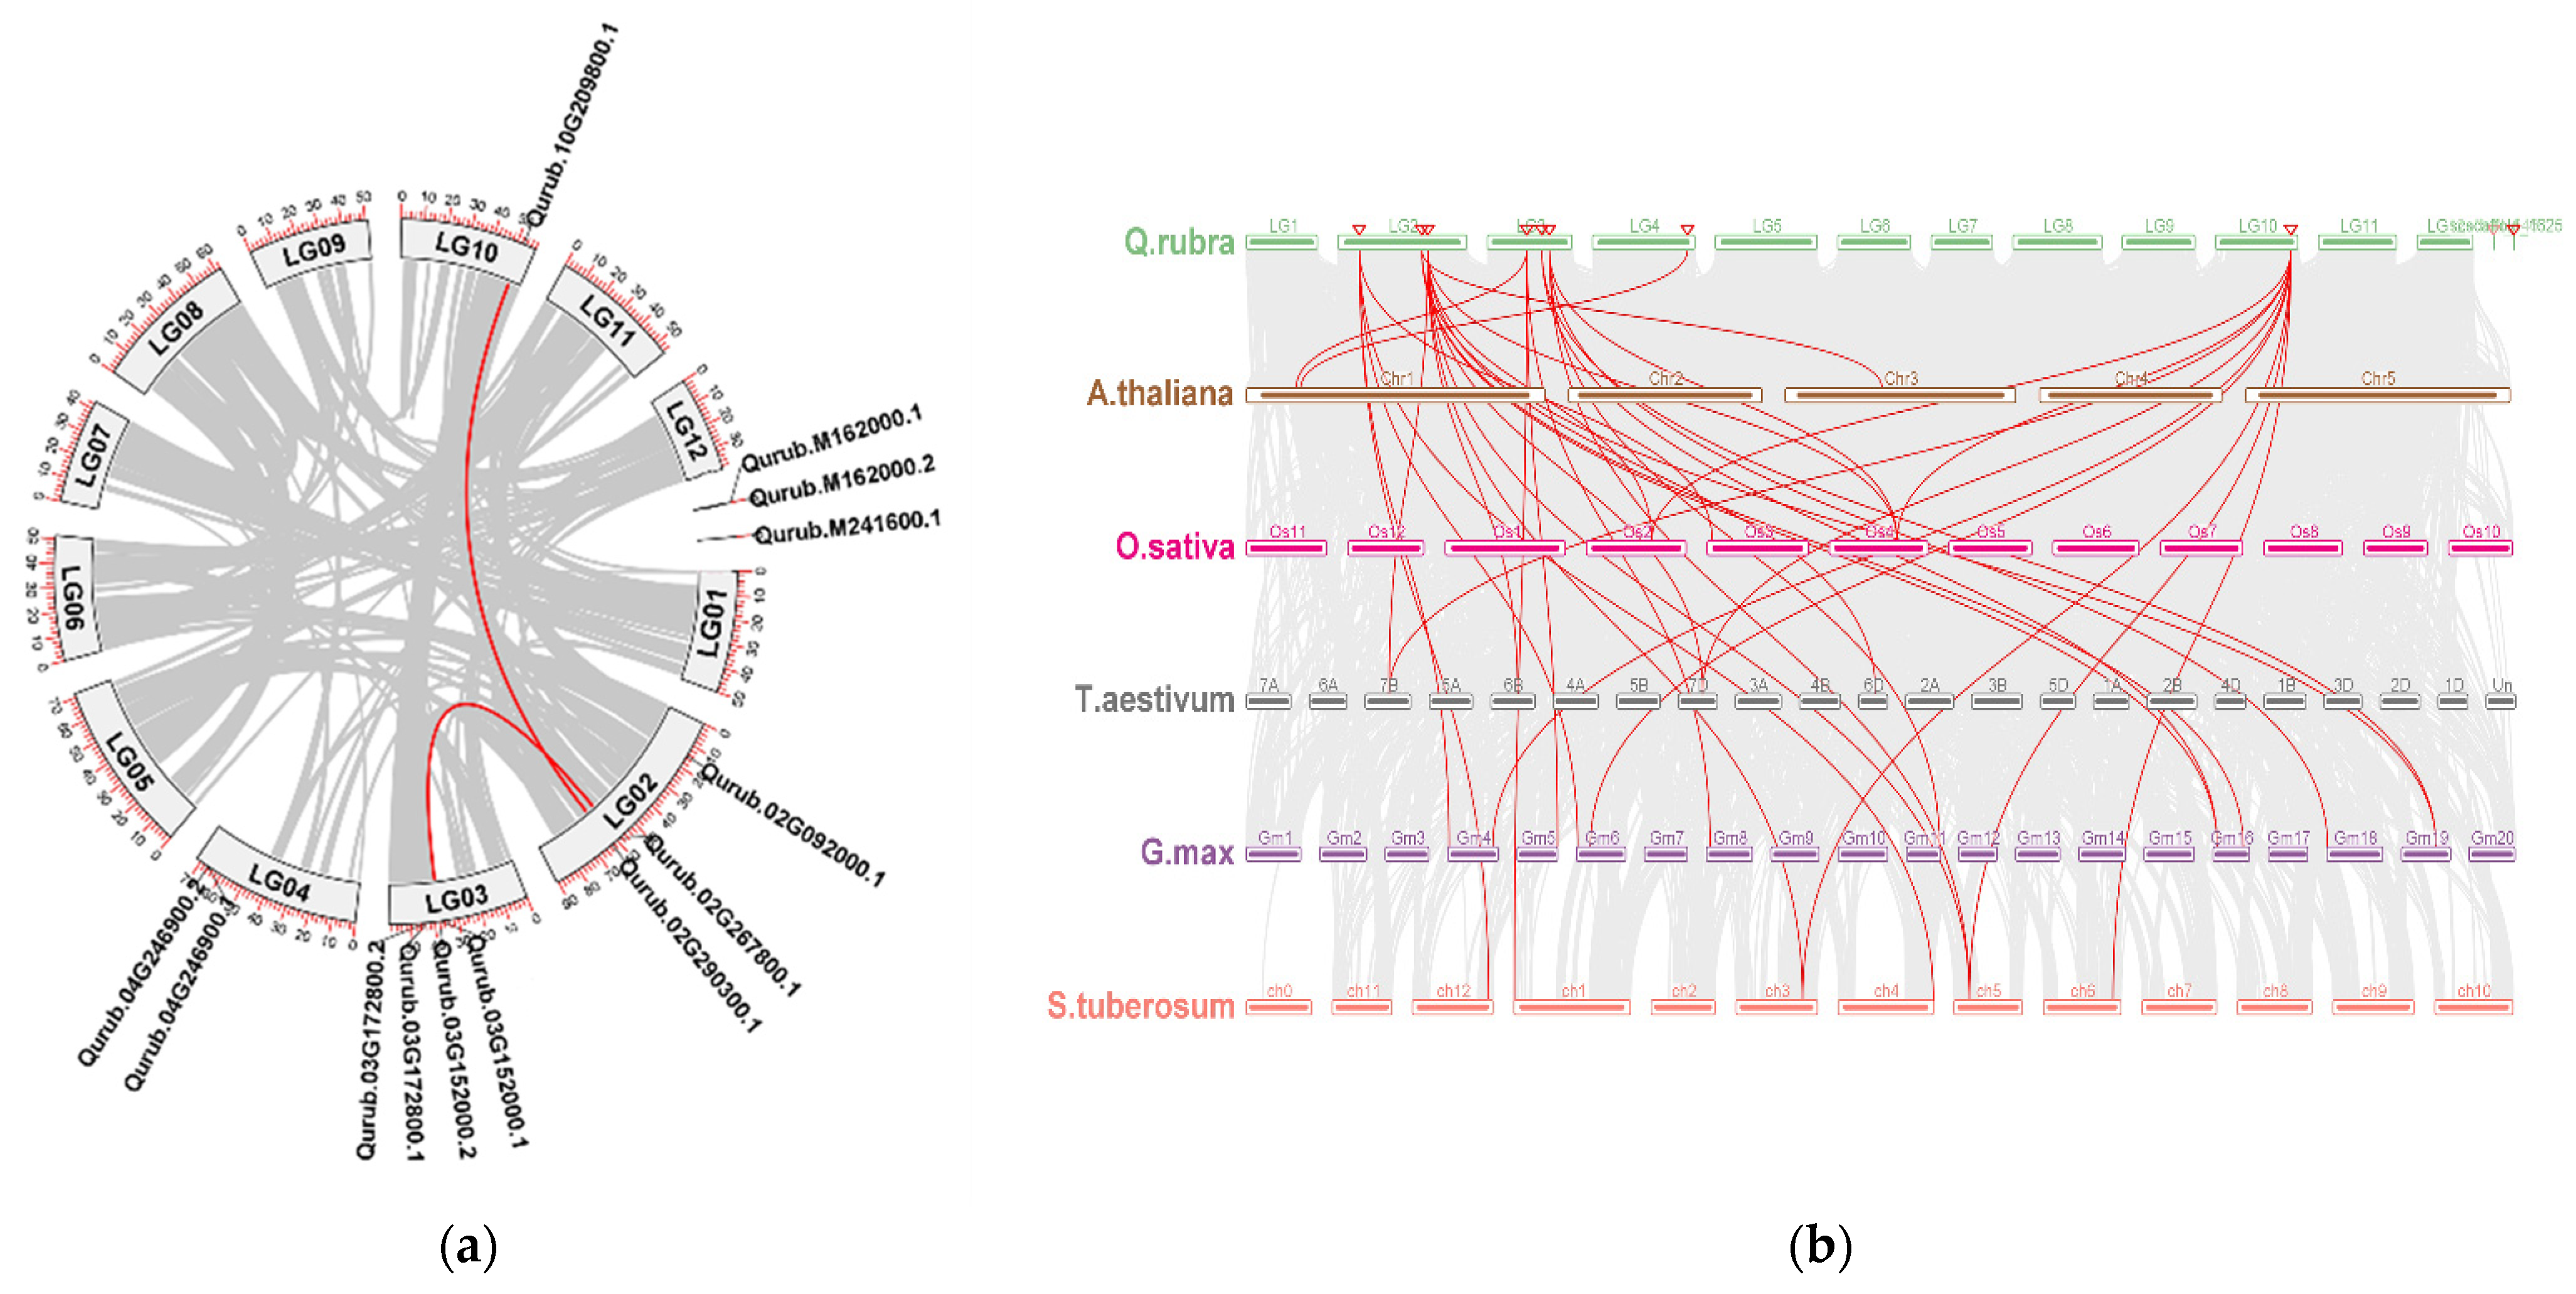
2.3. Chromosomal Location, Gene Duplication, Collinearity, and Synteny Analysis

The distribution of QrGAPDH genes was not uniform across the 12 chromosomes of Q. rubra, as depicted in Figure 3, based on the annotation information from the Q. rubra genome. Additionally, two scaffolds, 646 and 1625, also contained a few QrGAPDH genes. Ten of the thirteen genes were found on chromosomes 3 (LG03), LG02, LG04, and LG10, while the remaining three genes were located on scaffolds 646 and 1625. Figure 3 illustrates the chromosomal distribution of the 13 QrGAPDHs in Q. rubra. Details on the chromosome mapping, including gene locations and orientations, are provided in Supplementary Table S2.
In order to investigate the genomic expansion mechanism of the GAPDH gene family in Q. rubra, we conducted an analysis of the syntenic relationships among the QrGAPDH genes. Among the 13 identified QrGAPDHs, four genes, which form two distinct gene pairs, displayed syntenic relationships and were found to have undergone tandem duplications (Table 2). The ratio of the substitution rates, denoted as Ka/Ks, serves as a valuable metric for assessing selective pressure during the process of gene duplication. The Ka/Ks ratios for the two identified pairs of tandem duplications, both of which are below 1, indicate that these genes may have experienced purifying selection. It is generally understood that the Ks value is not influenced by natural selection, while the Ka value is subject to its effects. The divergence time for the gene pairs Qurub.02G267800.1 and Qurub.03G152000.2 is estimated to be 95.09 million years ago (Mya), whereas the divergence time for Qurub.02G290300.1 and Qurub.10G209800.1 is approximately 70.80 Mya. The earliest gene duplication event is believed to have occurred 95.09 Mya (Table 2).
In order to gain a deeper insight into the genetic divergence, gene duplication, and evolutionary patterns of the GAPDH gene families across Q. rubra, Arabidopsis, rice, wheat, potato, and soybean, we examined their syntenic relationships. This examination aimed to identify orthologous GAPDH genes among these species utilizing MCScanX. Our analysis revealed the presence of 3, 4, 6, 11, and 8 pairs of orthologous GAPDH genes across five comparative assessments: Q. rubra vs. A. thaliana, Q. rubra vs. O. sativa, Q. rubra vs. T. aestivum, Q. rubra vs. G. max, and Q. rubra vs. S. tuberosum, respectively (Figure 4).

2.4. Gene Structure and Conserved Motifs Analysis of QrGAPDH Genes

In order to understand the sequence characteristics of QrGAPDH proteins in Q. rubra, we performed a motif analysis utilizing MEME, which revealed a total of 10 conserved motifs (Figure 5). Proteins belonging to the same phylogenetic group displayed comparable motif compositions and arrangements. For example, the proteins Qurub.03G172800.1, Qurub.03G172800.2, Qurub.M162000.1, Qurub.M162000.2, Qurub.10G209800.1, Qurub.M241600.1, and Qurub.02G290300.1 all contained motif 5. Other proteins, such as Qurub.04G246900.1, Qurub.04G246900.2, Qurub.02G092000.1, Qurub.02G267800.1, Qurub.03G152000.1, and Qurub.03G152000.2, contained motif 9. Motifs 1, 2, 3, 4, and 8 were conserved across all QrGAPDH proteins. Motif 6, which was present only in Qurub.M162000.1, Qurub.M162000.2, Qurub.10G209800.1, Qurub.02G290300.1, Qurub.04G246900.1, Qurub.02G092000.1, Qurub.02G267800.1, and Qurub.03G152000.1, was able to distinguish between variants such as Qurub.04G246900.1/Qurub.04G246900.2 and Qurub.03G152000.1/Qurub.03G152000.2. Motif 7 was also able to discriminate between the Qurub.04G246900.1/Qurub.04G246900.2 variants. Motif 10 was absent in Qurub.M241600.1.

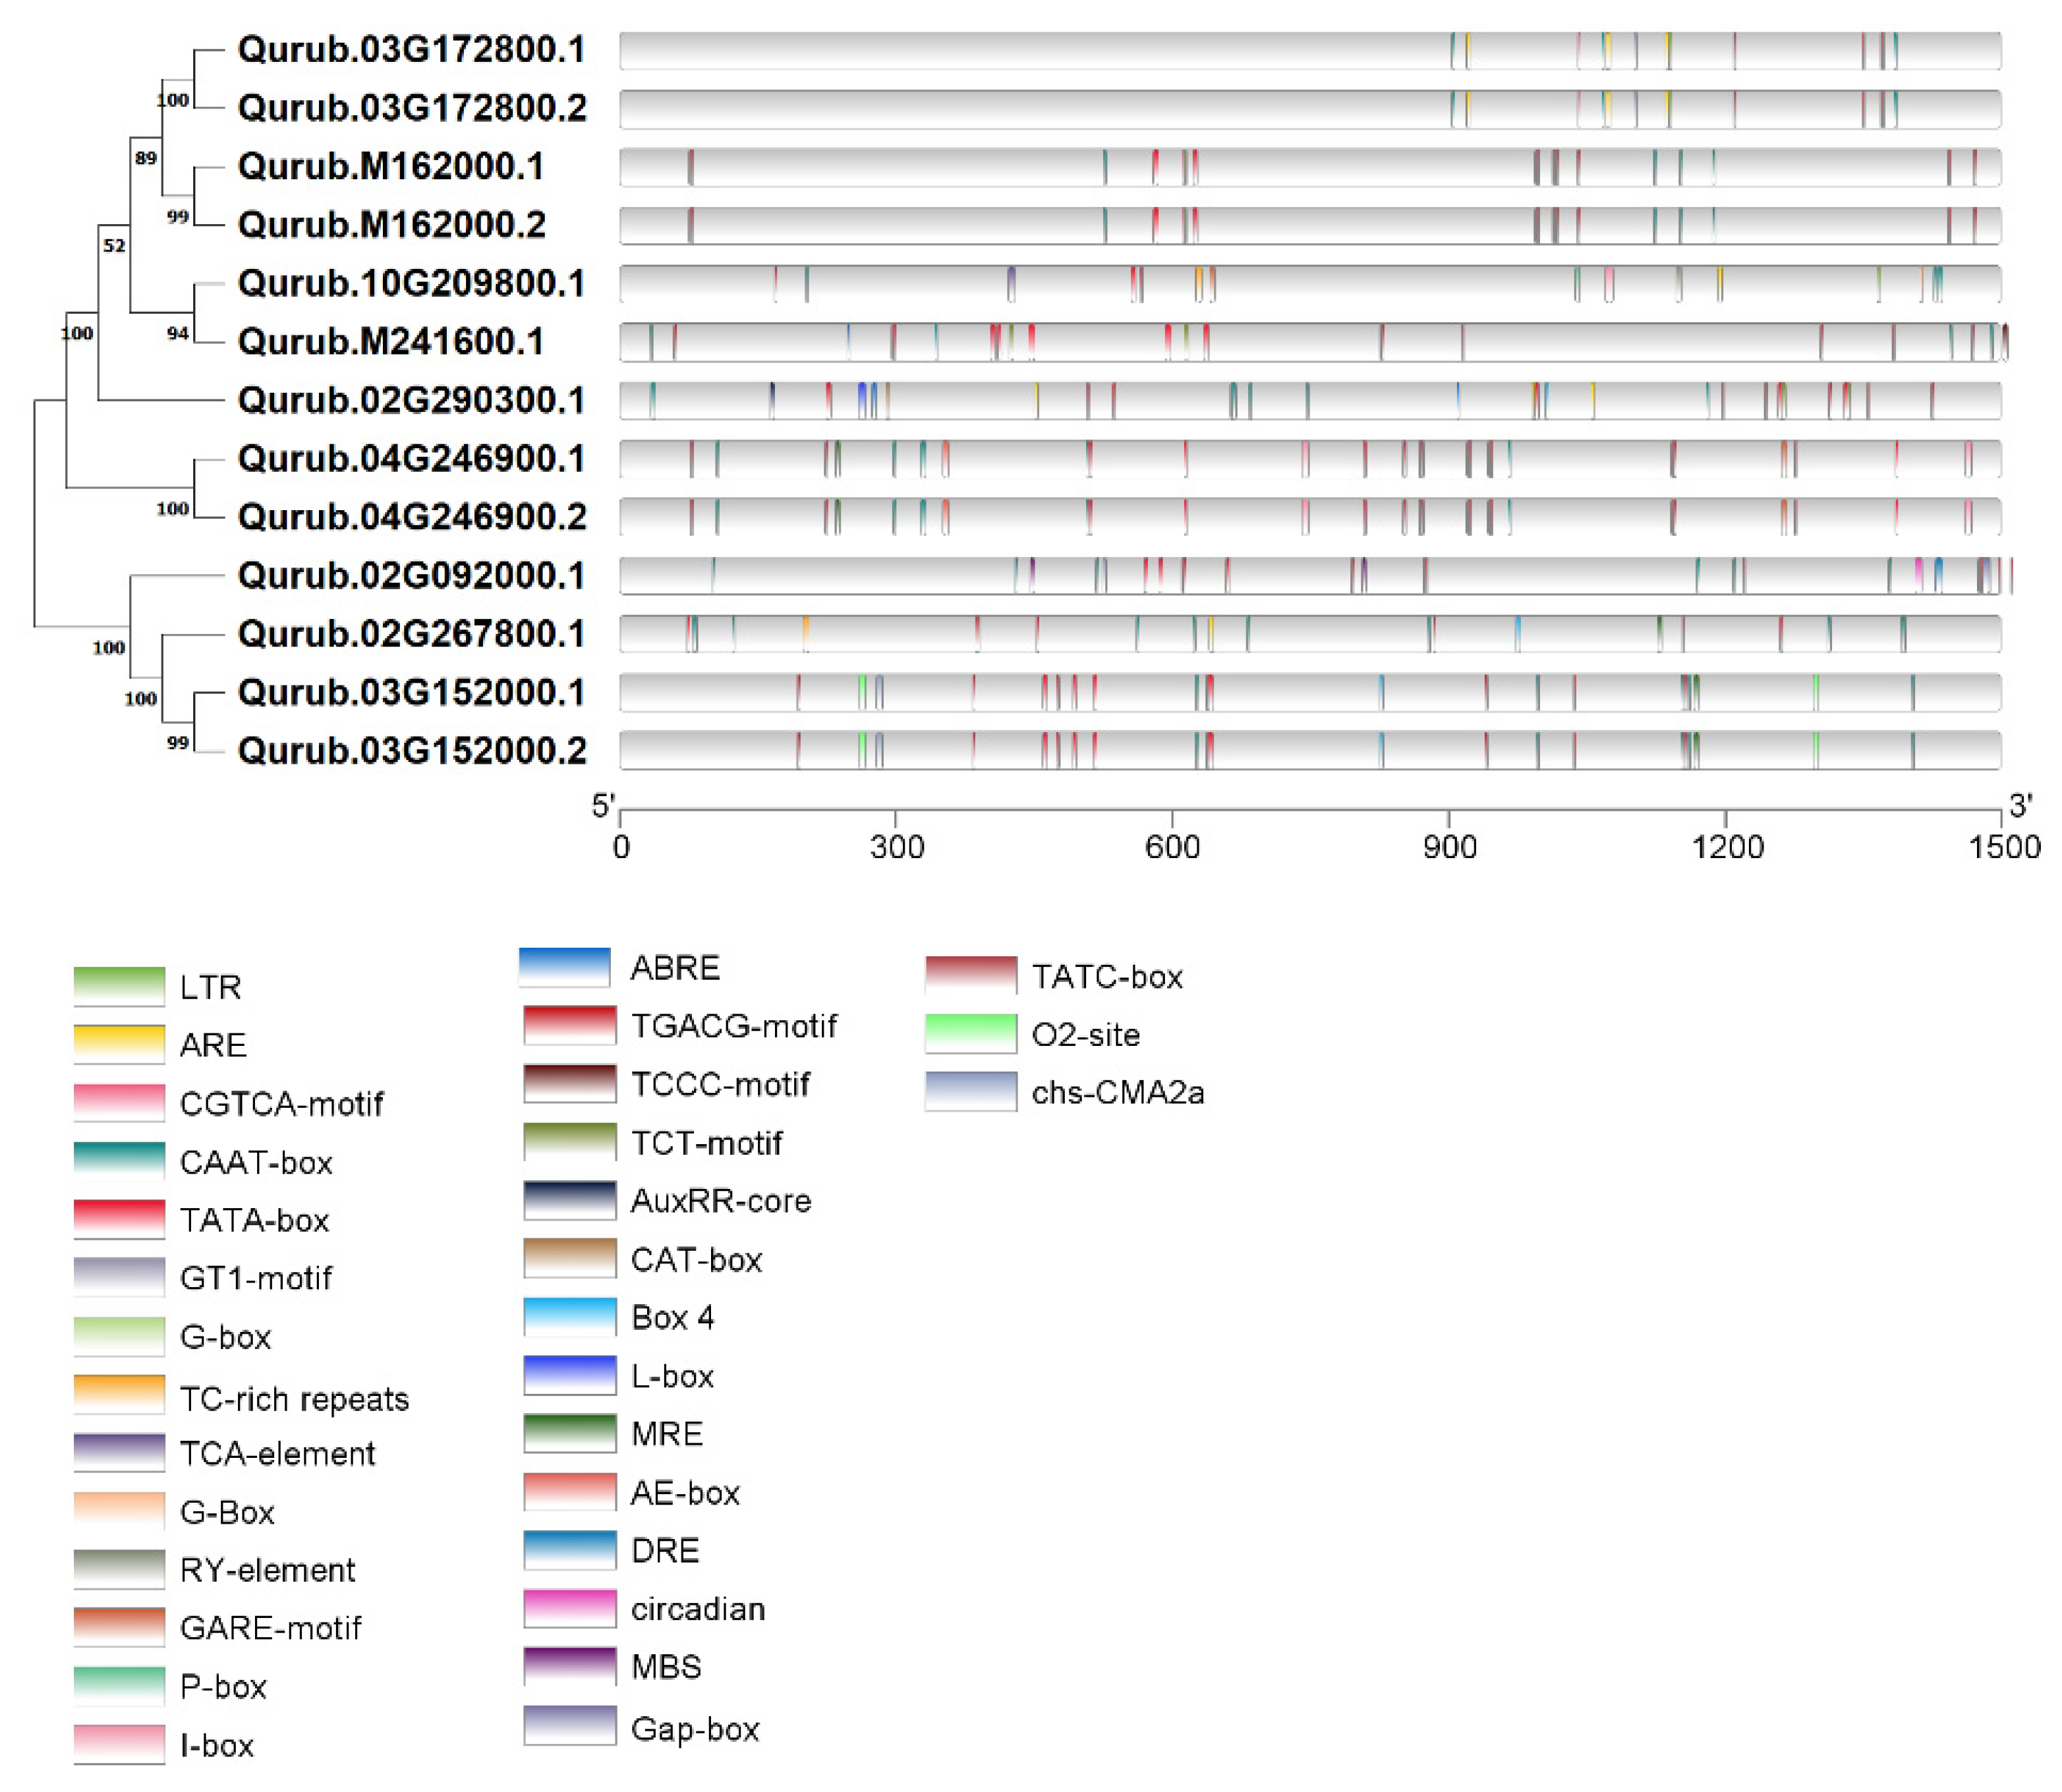
2.5. GO Annotation and Cis-Element Analyses of GAPDH Genes in Q. rubra

In order to elucidate the specific roles of GAPDH proteins, a Gene Ontology (GO) annotation was conducted for QrGAPDH proteins. The analysis revealed that the 13 proteins were categorized into three distinct GO categories: molecular function, biological process, and cellular component. Additionally, two distinct groups of GAPC2 proteins were identified. Group I, consisting of Qurub.03G172800.1 and Qurub.03G172800.2, was annotated for the biological process of glucose metabolic process. Regarding their molecular function, these proteins participated in oxidoreductase activity, specifically targeting the aldehyde or oxo groups of donors while utilizing NAD or NADP as acceptors, and were also engaged in the binding of NADP and NAD. Group II, which included Qurub.M162000.1, Qurub.M162000.2, Qurub.10G209800.1, Qurub.M241600.1, and Qurub.02G290300.1, was involved in the glycolytic process as a biological process, localized in the cytoplasm, and exhibited glyceraldehyde-3-phosphate dehydrogenase (NAD+) (phosphorylating) activity, with NADP and NAD binding in terms of molecular function. GAPCP-2 protein variants, Qurub.04G246900.1 and Qurub.04G246900.2, were involved in the glucose metabolic process and NAD biosynthetic process as biological processes. They also exhibited nicotinate-nucleotide diphosphorylase (carboxylating) activity and oxidoreductase activity, acting on the aldehyde or oxo group of donors with NAD or NADP as acceptors and in NADP and NAD binding in terms of molecular function. Both GAPA-2 proteins (Qurub.02G267800.1, Qurub.03G152000.1, Qurub.03G152000.2) and the GAPB protein (Qurub.02G092000.1) were involved in the glucose metabolic process as a biological process. They also demonstrated glyceraldehyde-3-phosphate dehydrogenase (NAD+) (phosphorylating) activity, indicating the binding of NADP and NAD in relation to their molecular function (Supplementary Table S3).
In order to enhance our understanding of gene regulation mechanisms, we identified cis-acting elements within each gene examined (Figure 6). These elements are instrumental in investigating various responses to environmental stress and tissue-specific functions. Utilizing the online resource PlantCARE, we predicted the promoter region located 1500 bp upstream of the QrGAPDH genes. Our analysis revealed 23 distinct categories of cis-acting elements across 13 QrGAPDH genes, which included elements associated with plant hormones such as abscisic acid, salicylic acid, gibberellin, MeJA, and auxin response elements. Specifically, abscisic acid response elements (ABRE) were identified in the genes Qurub.02G290300.1, Qurub.10G209800.1, and Qurub.M241600.1. The salicylic acid response includes the TCA-element found in Qurub.10G209800.1. The gibberellin response element, TATC-box, was located in Qurub.02G267800.1, while the auxin responsive element, AuxRRcore, was present in Qurub.02G290300.1. MeJA response elements, including the CGTCA-motif, were detected in Qurub.03G172800.1, Qurub.03G172800.2, Qurub.M162000.1, and Qurub.M162000.2, and the TGACG-motif was identified in Qurub.03G152000.1, Qurub.03G152000.2, and Qurub.M241600.1. In relation to factors associated with abiotic stress responses, we have identified components linked to defense mechanisms and stress reactions, including those pertaining to dehydration, low temperatures, salt stress, temperature variations, and the MYB binding site that plays a role in drought inducibility. TC-rich repeats, associated with defense and stress responses, were found in Qurub.02G267800.1 and Qurub.10G209800.1. Drought-related elements such as dehydration, low temperature, salt stresses (DRE), and the MYB-binding site (MBS) involved in drought inducibility were identified in Qurub.02G092000.1 (Supplementary Table S4).

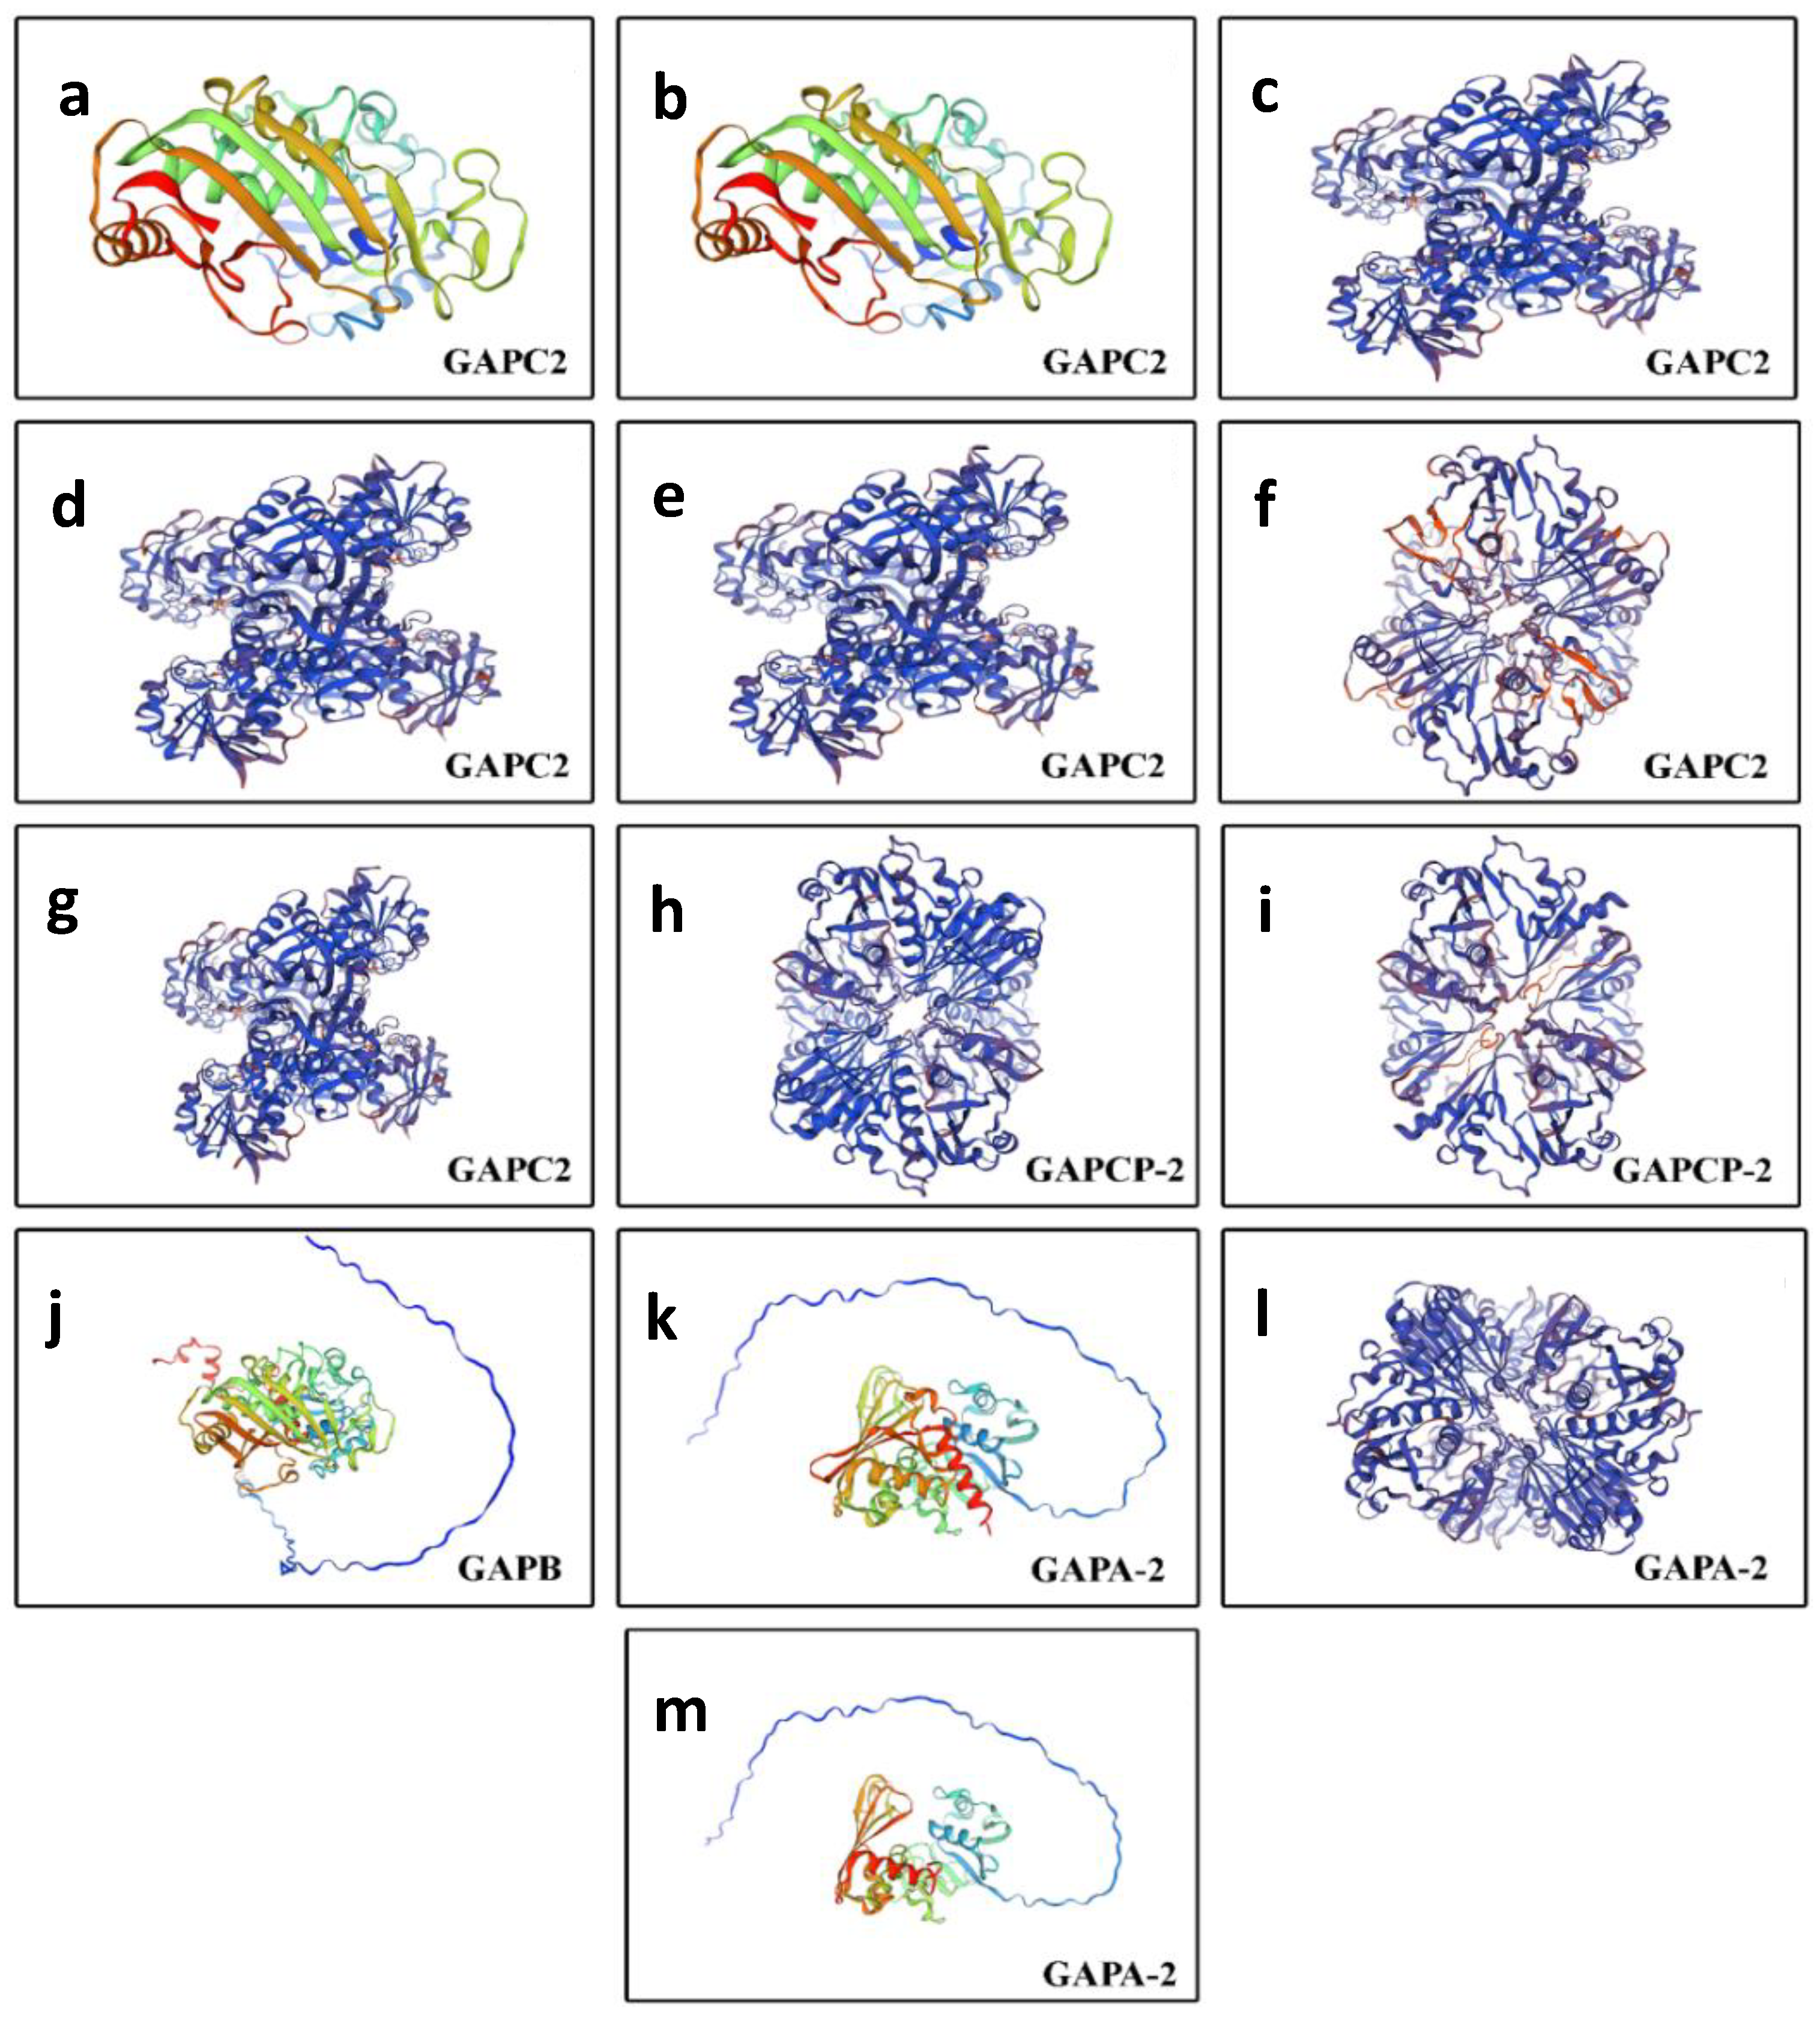
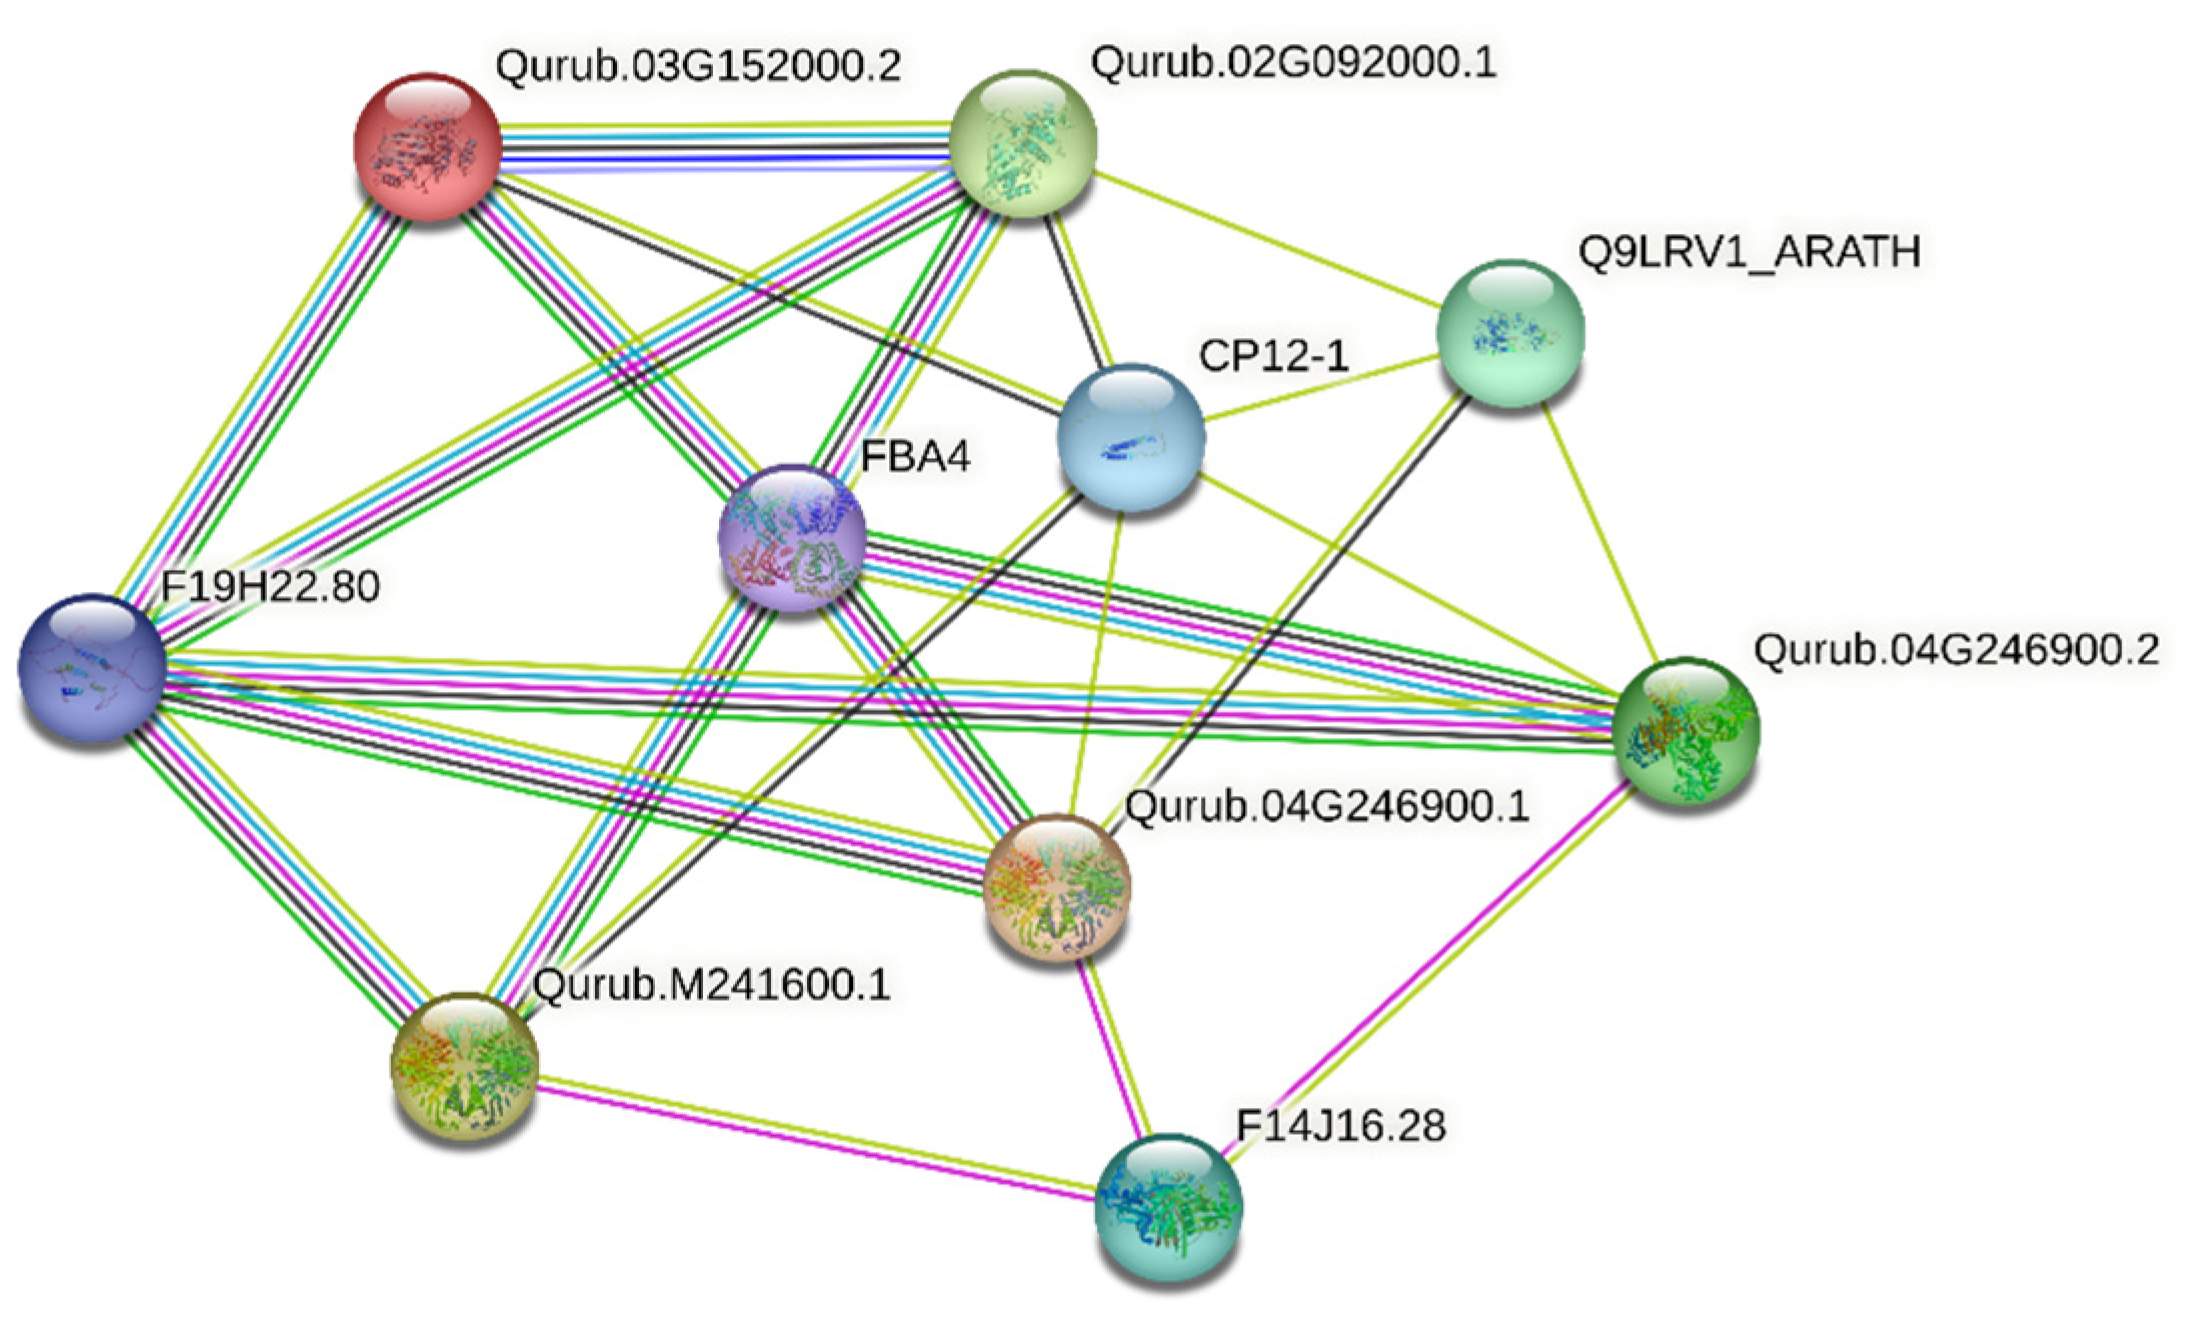
2.6. Three-Dimensional Structure Modeling and Protein–Protein Interaction Network Analysis

To further investigate the newly identified features in QrGAPDH proteins, the three-dimensional (3D) structures of some of these proteins were modeled using the SWISS-MODEL in silico tool. Seven GAPC2 proteins (Qurub.03G172800.1; Qurub.03G172800.2; Qurub.M162000.1; Qurub.M162000.2; Qurub.10G209800.1; Qurub.M241600.1; Qurub.02G290300.1) were identified, and their predicted 3D structures suggest variations in structural topology. For example, the protein variants Qurub.03G172800.1 and Qurub.03G172800.2 exhibit similar topology. Similarly, Qurub.M162000.1, Qurub.M162000.2, Qurub.10G209800.1, and Qurub.02G290300.1 share comparable topological structures, while Qurub.M241600.1 displays a distinct topological structure (Figure 7).
The two GAPCP-2 protein variants, Qurub.04G246900.1 and Qurub.04G246900.2, shared similar topological structures. Among the three GAPA-2 proteins—Qurub.02G267800.1, Qurub.03G152000.1, and Qurub.03G152000.2—Qurub.03G152000.1 exhibited a distinct topology. Among the 13 QrGAPDH proteins, only five were involved in protein–protein interactions: Qurub.02G092000.1, Qurub.02G092000.1 (repeated, possibly an error), Qurub.03G152000.2, Qurub.04G246900.1, Qurub.04G246900.2, and Qurub.M241600.1 (Figure 8). To achieve a deeper the understanding of the protein–protein interaction network results, five distinct clusters were identified. In Cluster I, the protein Qurub.02G092000.1 was found to interact with Qurub.03G152000.2, FBA4, Q9LRV1_ARATH, CP12-1, and F19H22.80. Qurub.02G092000.1 and Qurub.03G152000.2 were closely connected, with a confidence score of 0.983.
In cluster II, Qurub.03G152000.2 interacted with proteins including FBA4, F19H22.80, and CP12-1. In clusters III, IV, and V, the protein variants Qurub.04G246900.1 and Qurub.04G246900.2 interact with the same members, such as FBA4, CP12-1, F14J16.28, F19H22.80, and Q9LRV1_ARATH (Table 3).

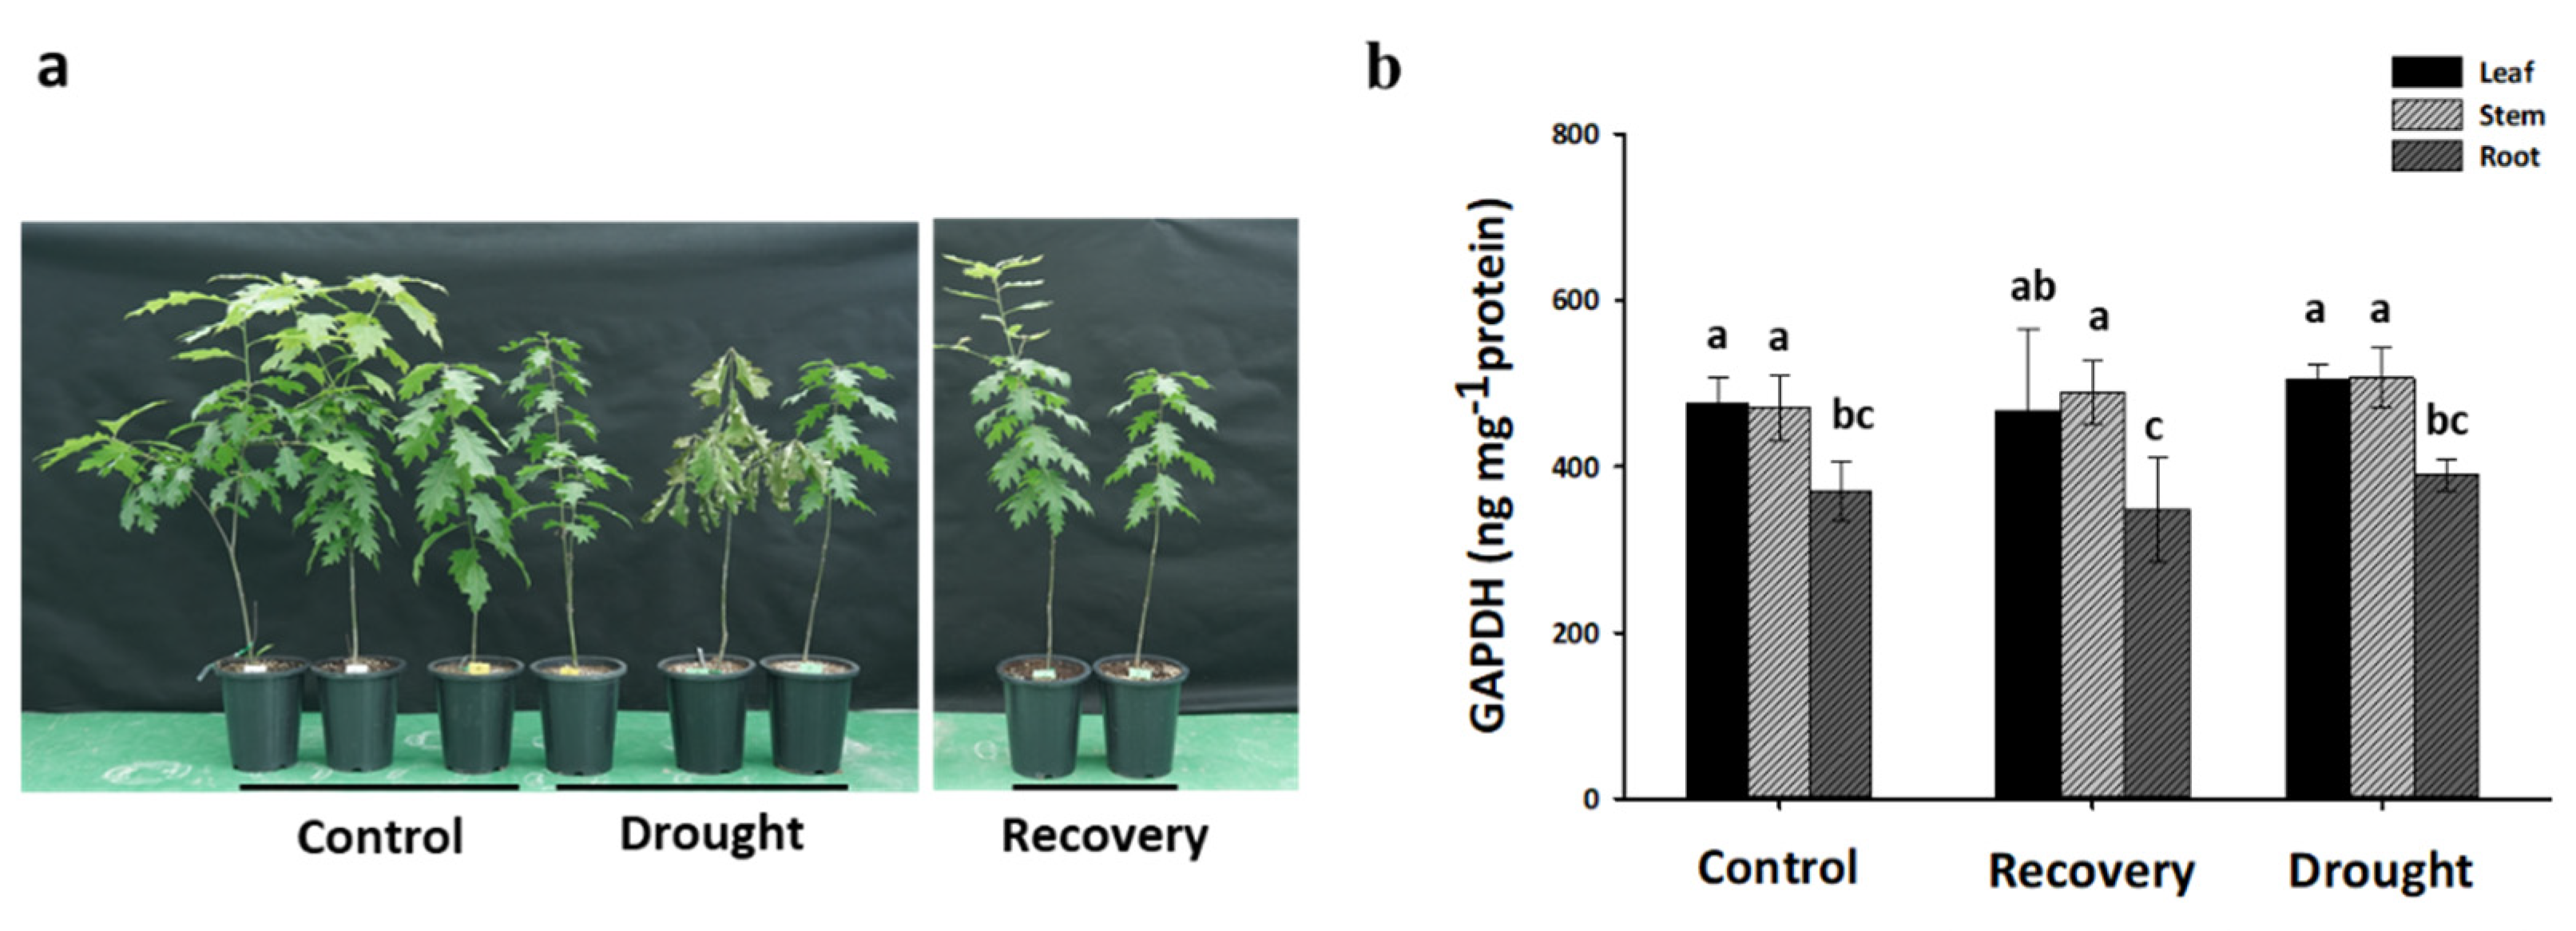
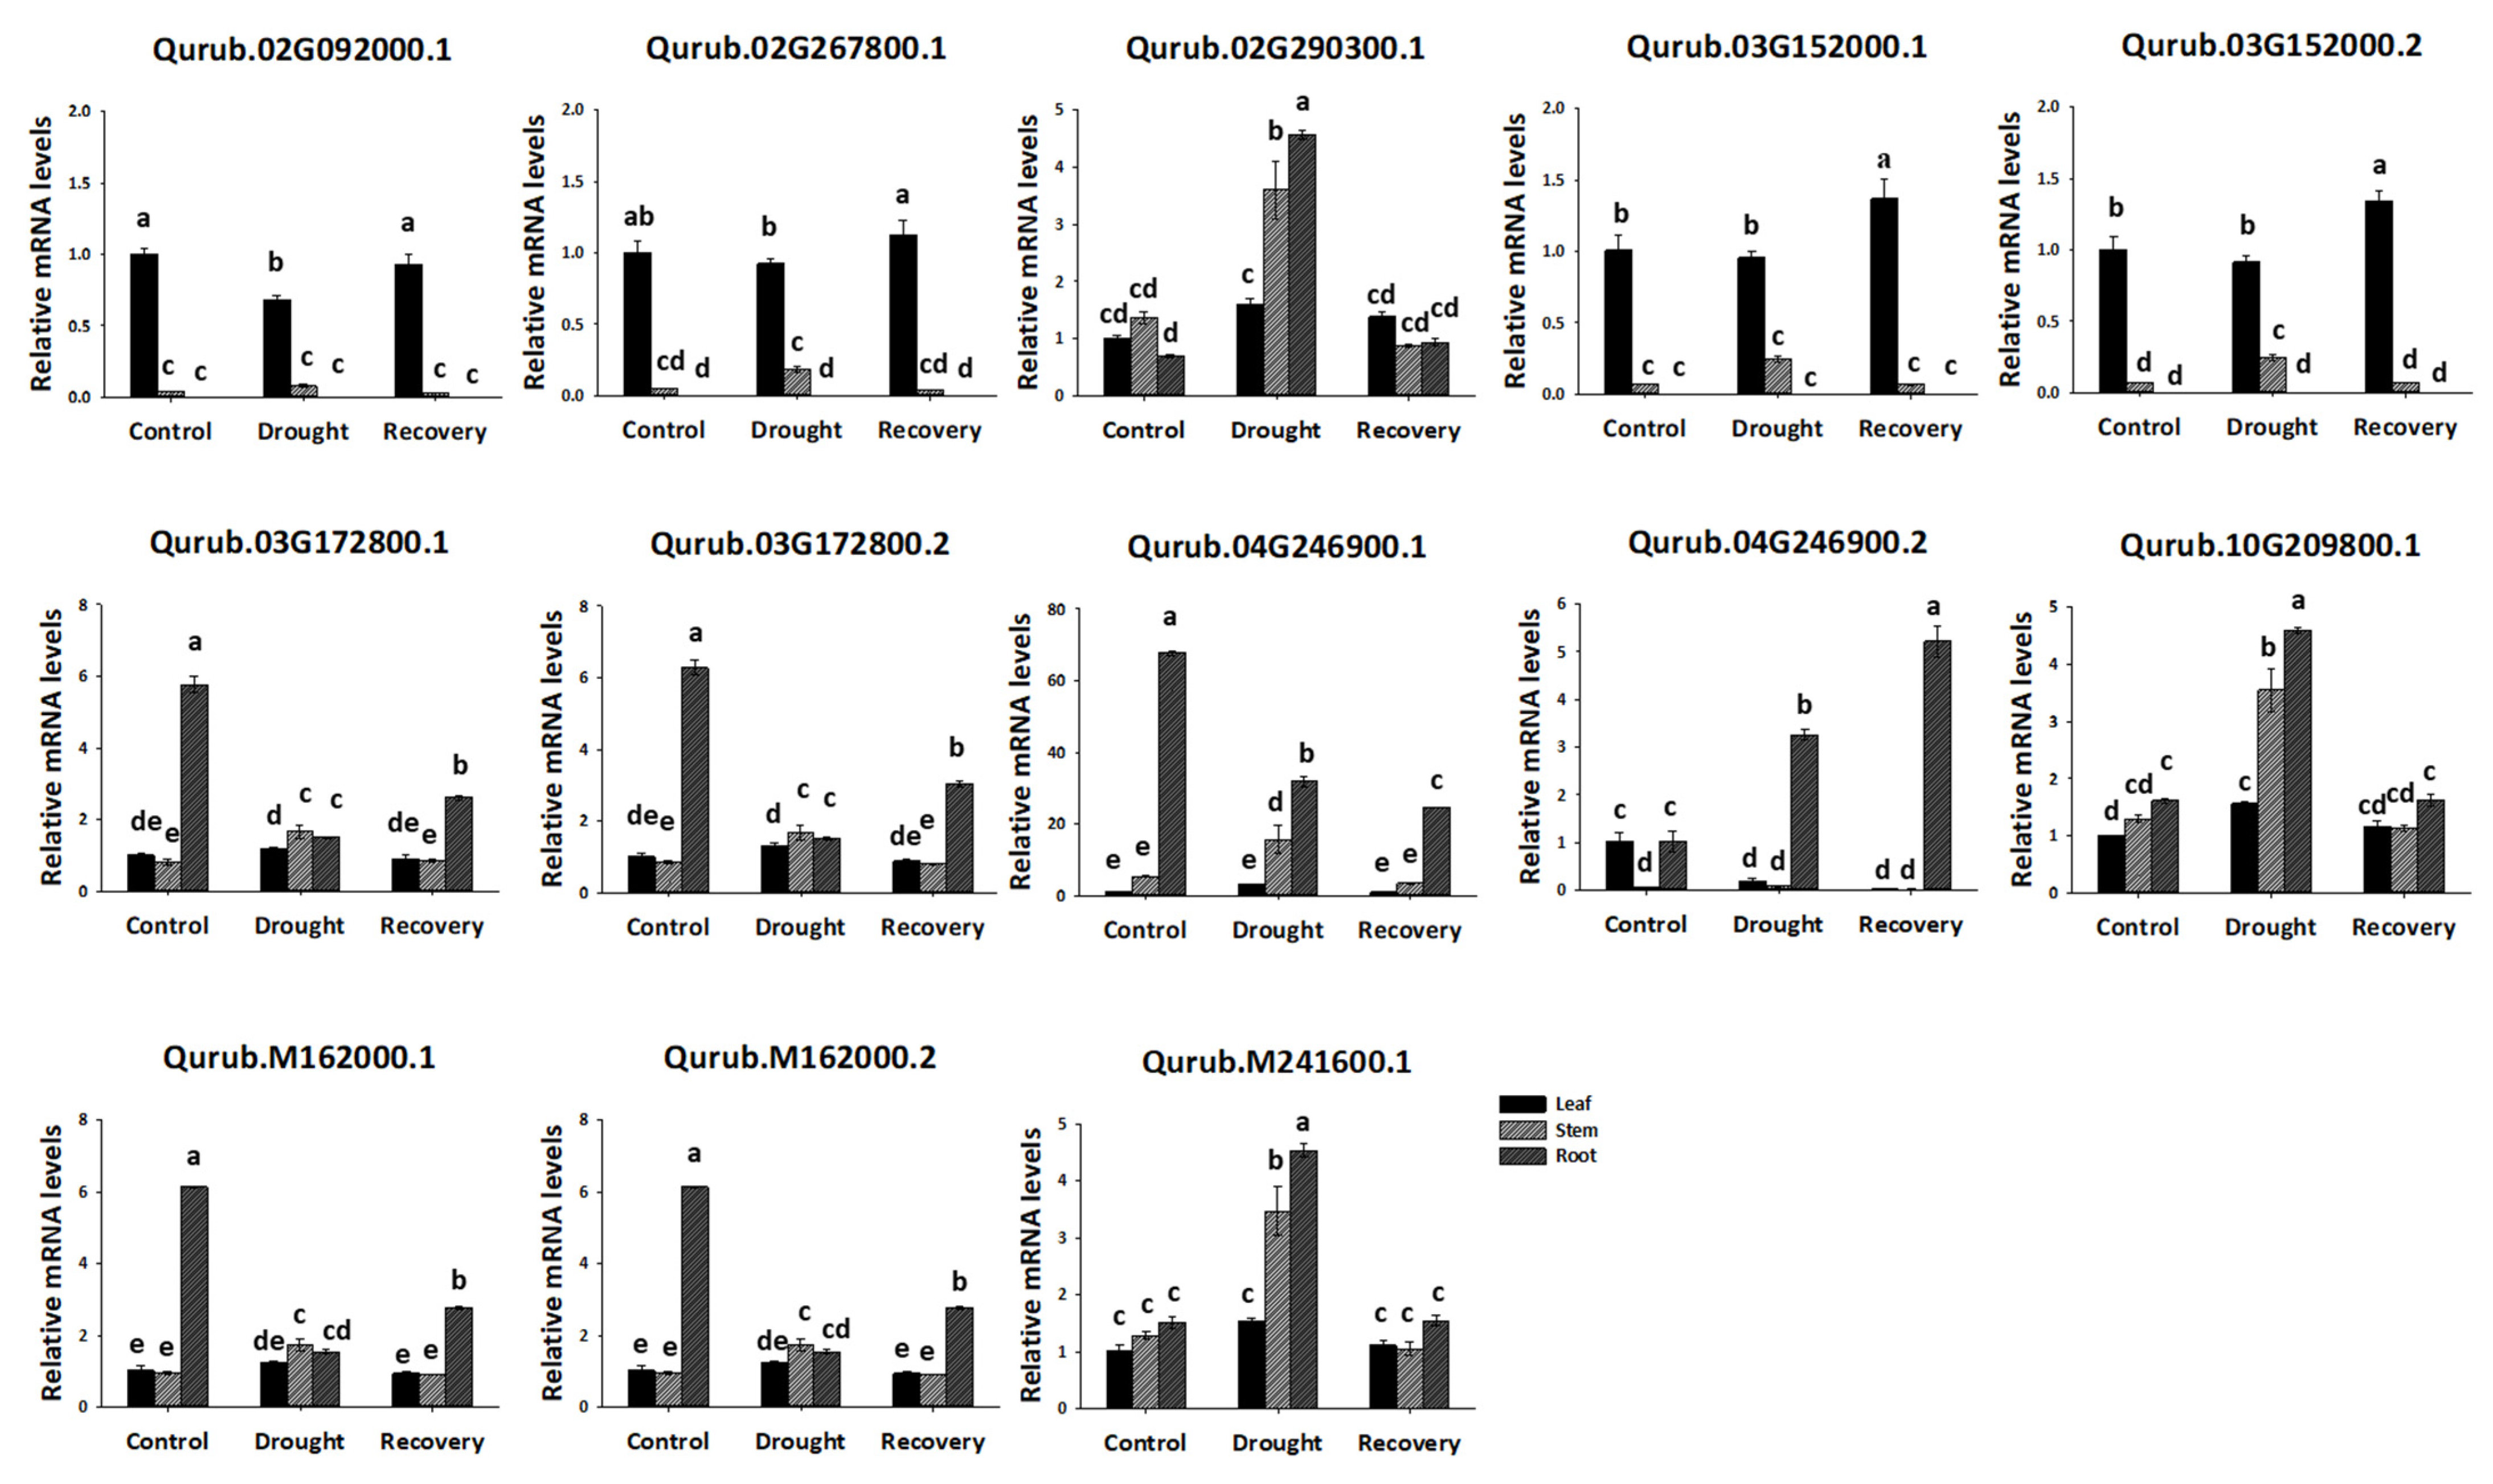
2.7. Expression Profiles of QrGAPDH Genes under Drought Stress and Re-Watering in Various Tissues

In order to investigate the function of GAPDH in the response of Q. rubra to drought conditions, we analyzed the GAPDH protein levels in the leaf, stem, and root tissues while also assessing the growth phenotypes. It was confirmed that the oak seedlings exhibited phenotypic differences under drought stress conditions; however, they recovered upon re-watering. The GAPDH protein was consistently expressed in all tissues, with significantly lower levels observed in the roots compared to other tissues. Additionally, there was no variation in protein content in response to either drought stress or re-watering (Figure 9).
qPCR analysis was conducted to further investigate the expression of QrGAPDH across various tissues. All 13 QrGAPDH genes showed expression in different tissues, aligning with the results from the protein assay (Figure 10). The expression of QrGAPDH genes varied among the leaf, stem, and root tissues. Specifically, Qurub.02G092000.1, Qurub.02G267800.1, Qurub.03G152000.1, and Qurub.03G152000.2 were prominently expressed in the leaves and localized in the chloroplasts (Figure 2). Notably, Qurub.03G172800.1, Qurub.03G172800.2, Qurub.04G246900.1, Qurub.M162000.1, and Qurub.M162000.2 showed high expression levels in the roots (Figure 10). Tissue-specific genes can be utilized to specifically express a desired tissue by utilizing the promoter of the gene. These genes could be utilized to explore tissue-specific expression patterns, including leaf-specific and root-specific expressions. The genes associated with root-specific expression may play an essential role in the glycolytic pathway of Q. rubra. Additionally, Qurub.02G290300.1, Qurub.10G209800.1, and Qurub.M241600.1 demonstrated high expression in all examined tissues (Figure 10), suggesting their potential use as internal controls.
After 30 days of drought treatment, the relative expression levels of Qurub.02G290300.1, Qurub.10G209800.1, and Qurub.M241600.1 were significantly increased compared to the control. In contrast, the expression levels of Qurub.03G172800.1, Qurub.03G172800.2, Qurub.04G246900.1, Qurub.M162000.1, and Qurub.M162000.2 were markedly reduced compared to the control, especially in the root tissue. Interestingly, the relative expression levels of Qurub.02G092000.1, Qurub.02G267800.1, Qurub.03G152000.1, and Qurub.03G152000.2 showed no difference under drought stress (Figure 10). These results establish a theoretical foundation for additional research into the molecular properties and biological roles of QrGAPDH.

3. Discussion

GAPDH is a crucial enzyme involved in the glycolysis pathway. Studies indicate that GAPDH significantly contributes to plant development and their reactions to environmental stressors, especially salinity and drought [8]. Genome-wide analyses of the GAPDH gene family have been performed across several plant species, such as Arabidopsis [21], soybean [17], wheat [11], sweet orange [18], watermelon [22], and basil [23]. Nevertheless, the molecular function of GAPDH in red oak (Q. rubra L.) remains unreported. The selection of proteins from the GAPDH family was based on the identification of two essential domains: the Gp_dh_N domain (PF00044) and the Gp_dh_C domain (PF02800). Only 13 members possessing both complete domains were selected, while those with incomplete or truncated domains were excluded. We conducted a comprehensive analysis of these 13 GAPDH gene members in Q. rubra using the latest genome assembly. This analysis included their phylogenetic relationships, gene structure, conserved motifs, chromosomal positions, molecular 3D structure predictions, and expression profiles under drought stress. The physicochemical properties of the primary protein sequences are instrumental in determining their structural and biological functions. All but one of the QrGAPDH proteins were found to be basic; the exception (Qurub.02G290300.1) was neutral. These proteins had an average amino acid composition of 351 and a molecular weight of 37,880 kDa. The average hydropathy value, determined using GRAVY, was negative, indicating that the proteins were hydrophilic. The aliphatic index confirmed the thermostability of the proteins identified in this study. The average instability index of the GAPDH proteins, at 25.48, indicates their stability (values greater than 40 indicate stability; values less than 40 indicate instability). Overall, the structural and functional characteristics of QrGAPDH corresponded with those found in other species.
The phylogenetic examination of GAPDH family members in Q. rubra, along with other documented species including A. thaliana, O. sativa, T. aestivum, G. max, and S. tuberosum, indicates that the genes encoding GAPDH in these species have a shared ancestral lineage. The constructed phylogenetic tree reveals that QrGAPDH shares a close evolutionary relationship with G. max and T. aestivum. Four clusters were observed, with clade II (blue) being the largest, clades I (red) and III (yellow) being equal in size, and clade IV (pink) being the smallest. Genes located within the same clade exhibit similar expression levels. For instance, the genes clustered within the blue shades, Qurub.02G290300.1, Qurub.10G209800.1, and Qurub.M241600.1, display similar expression patterns, whereas, the pairs Qurub.03G172800.1/Qurub.03G172800.2 and Qurub.M162000.1/Qurub.M241600.1 in the blue cluster, show similar expression patterns. In the yellow cluster (clade III), genes such as Qurub.02G267800.1, Qurub.03G152000.1, and Qurub.03G152000.2 exhibit similar gene expression. The pink cluster (clade IV) contains only one Q. rubra gene. However, in the red cluster (clade I), genes such as Qurub.04G246900.1 and Qurub.04G246900.1 did not show similar expression patterns among multiple genes from the same clade, suggesting that the GAPDH genes have undergone duplication, resulting in functional redundancy. According to a previous report, GAPDH proteins are localized in both the cytoplasm and plastid [24]. The members of the GAPDH gene family in Arabidopsis thaliana, including AtGAPA-1, AtGAPA-2, and AtGAPB, are recognized for their localization in chloroplasts and their role in the photosynthetic reductive carbon cycle. Similarly, the QrGAPDH members within the same blue clade, comprising QrGAPDH08 and QrGAPDH09, are also predicted to perform analogous functions [25]. Furthermore, additional family members, including AtGAPC-1 and AtGAPC-2, have been recognized as cytosolic glycolytic enzymes within the same clade as QrGAPDH03, QrGAPDH06, QrGAPDH10, QrGAPDH11, QrGAPDH12, and QrGAPDH13. However, the localization of proteins at the subcellular level can provide insights into their functional roles within the cell. We report that a total of eight GAPDH proteins were localized in the cytoplasm, three in the chloroplast, one in both the chloroplast and cytoplasm, and another in the mitochondria. Reports indicate that proteins associated with glycolysis and gluconeogenesis metabolism exhibited a notable accumulation in response to drought stress. The swift and substantial activation of GAPDH is likely to facilitate ongoing energy production and provide signals for the associated metabolic processes [26]. GAPDH maintains its essential function as a glycolytic “housekeeping” protein within the cytoplasm; however, growing evidence suggests that posttranslational modifications of cytosolic GAPDH direct this protein towards functional pathways that diverge from glycolysis [27]. The expression of the GAPDH gene in aspen was found to be elevated following drought stress. Similarly, in wheat, the expression of TaGAPDH12 in shoots showed a significant increase after the plants were subjected to four different abiotic stresses, namely cold, heat, salt, and drought [11]. Whole-Genome Duplication (WGD) significantly contributed to the evolution of the QrGAPDH gene family, in conjunction with segmental duplication. Additionally, analyses of the nonsynonymous and synonymous substitution ratios (Ka and Ks) of orthologous GAPDH gene pairs were conducted to identify the underlying mechanisms driving the evolution of the GAPDH gene family. The findings indicated that the majority of orthologous GAPDH gene pairs exhibited a Ka/Ks ratio of less than 1, which implies the presence of purifying selection throughout the evolution of the GAPDH gene family and the preservation of these genes’ functions. Collinearity analysis identified two segmental duplications, revealing that QrGAPDH failed to maintain a conserved duplication. However, segmental duplication was advantageous in extending the GAPDH genes in Q. rubra.
We assessed the cis-acting elements in relation to their involvement in gene function and regulatory mechanisms [28]. Plant promoters serve as crucial regulatory elements necessary for the transcription of plant genes and hold significant regulatory functions at the transcriptional level. In our analysis of the 1500 bp putative promoter regions of all GAPDHs, we identified a variety of cis-regulatory elements. The majority of GAPDHs exhibited different types of cis-elements associated with plant hormones, such as abscisic acid response elements, salicylic acid response elements, gibberellin response elements, MeJA response elements, and auxin response elements. Furthermore, various cis-regulatory elements that play a role in defense mechanisms, stress responses, circadian rhythms, and MYB binding sites are associated with the regulation of genes responsible for flavonoid biosynthesis. Flavonoids have the potential to enhance drought tolerance in maize seedlings by mitigating oxidative damage caused by drought conditions and by modulating stomatal movements [29]. The DRE and ABRE elements are recognized for their involvement in the regulation of protein and hormone activities in reaction to cold and drought stress [30]. It has been proposed that MYB proteins interact with critical MREs to elevate the expression of genes related to phenylpropanoid biosynthesis and stress response [31]. The genes Qurub.02G092000.1 and Qurub.03G152000.2 are associated with the cis-regulatory element, MYB binding site, which is involved in drought inducibility (MBS). Three genes showed differential expression in drought-induced trees, including Qurub.M241600.1, Qurub.02G290300.1, and Qurub.10G209800.1. Notably, Qurub.02G290300.1 and Qurub.10G209800.1 contain drought-responsive cis-acting elements such as MYB, a transcription factor whose expression is regulated by drought conditions [32,33].
QrGAPDH genes exhibited varying expression levels across different tissues under drought stress. The expression pattern of the GAPDH gene was analyzed through protein content and qPCR analyses to determine how red oak GAPDH responds to water deficiency stress. The promoter sequence of QrGAPDH includes cis-elements such as ABRE and TC-rich repeats (Figure 6). These findings demonstrate that drought stress significantly induces the expression of QrGAPDH (Figure 10). The findings offer valuable information regarding the possible functions of QrGAPDH genes and their expression patterns across different tissues in response to drought conditions. Comprehensive genome-wide analyses, along with gene expression studies under drought stress, may assist plant biologists and breeders in identifying and functionally characterizing the QrGAPDH genes that enhance stress tolerance in red oak cultivars.

4. Materials and Methods

4.1. Identification of the GAPDH Genes in Q. rubra

The genomic sequence and annotation information for Quercus rubra were sourced from Phytozome version 13 (https://phytozome-next.jgi.doe.gov/info/Qrubra_v2_1; accessed on 26 June 2023) [34]. These data were used to identify the GAPDH genes in Q. rubra. To locate these genes, an HMMER search was conducted in the Q. rubra protein database using an HMM profile. This profile comprises an N-terminal NAD(P)-binding domain, identified as the Gp_dh_N domain (PF00044), along with a C-terminal catalytic domain, designated as the Gp_dh_C domain (PF02800). Both domains are derived from the Pfam database (https://www.ebi.ac.uk/interpro; accessed on 26 June 2023). The E-value cut-off was set at 10−5. The presence of conserved GAPDH domains was verified through a batch CD search against the Pfam database (https://www.ncbi.nlm.nih.gov/; accessed on 26 June 2023), focusing exclusively on complete proteins. Subsequently, the physical and chemical characteristics of the GAPDH family members were examined utilizing the ExPASy-ProtParam tool (https://web.expasy.org/protparam/; accessed on 26 June 2023) [35].

4.2. Phylogenetic Relationships, Gene Structure, and Conserved Motif Analyses of the GAPDH Genes

Domain alignments were executed using MEGA (version X) and subsequently visualized through iToL (https://itol.embl.de/; accessed on 26 June 2023) [36,37]. The multiple sequence alignments of GAPDH proteins were carried out with ClustalW. To construct the phylogenetic tree, the neighbor-joining method was applied, incorporating pairwise deletion and 1000 bootstrap replications. The exon/intron structures of the GAPDH genes were analyzed using the Gene Structure Display Server 2.0 (http://gsds.cbi.pku.edu.cn/; accessed on 26 June 2023) alongside genomic sequence and structural annotation data [38]. Additionally, MEME (http://meme-suite.org/; accessed on 26 June 2023) was employed to investigate the conserved motifs of the GAPDH proteins, with the maximum limit for motif recognition set at 10 [39,40].

4.3. Chromosomal Distribution, Syntenic Analysis, Homology Modeling, and Predicting the Protein–Protein Interaction Network of the GAPDH Genes

The Generic Feature Format Version 3 (GFF3) file, which provides positional and structural data regarding genes located on the chromosomes of Q. rubra, was acquired from Phytozome v13 (https://phytozome-next.jgi.doe.gov/info/Qrubra_v2_1; accessed 26 June 2023) [34]. Following this, TBTools (http://mg2c.iask.in/mg2c_v2.0/; accessed on 26 June 2023) was employed to map the GAPDH genes to their respective chromosomes. The syntenic relationships among the GAPDH genes in A. thaliana, O. sativa, T. aestivum, G. max, and S. tuberosum were examined and illustrated using the Multiple Collinearity Scan Toolkit (MCScanX) and TBtools [41]. Genomic data for A. thaliana, O. sativa, T. aestivum, G. max, and S. tuberosum were sourced from Ensembl Plants (https://plants.ensembl.org/index.html; accessed on 26 June 2023). The downstream analysis feature in MCScanX was utilized to compute the Ka and Ks values for segmental and tandem duplicate gene pairs. The Ks values were subsequently applied to estimate the timing of duplication events (T) using the formula T = Ks/2λ, where λ = 1.5 × 10⁻⁸ s for dicots [42]. Additionally, the Ka/Ks ratio was analyzed to ascertain the selection mode of the GAPDH genes [43]. The three-dimensional structure of QrGAPDH proteins was modeled through a homology modeling technique in SWISS-MODEL. The functions of AtGAPDHs, which are predicted to be orthologous to QrGAPDHs, were explored using NCBI (https://www.ncbi.nlm.nih.gov/; accessed on 26 June 2023). To further investigate the relationships among the QrGAPDH proteins, the orthologous proteins of QrGAPDHs in Arabidopsis were utilized to predict the protein–protein interaction network. STRING (https://string-db.org/; accessed on 25 September 2023) was used to develop the functional interaction network of these proteins [44].

4.4. GO, Nr Annotation, and Analyses of Cis-Regulatory Elements of the QrGAPDHs

The NCBI database was chosen as the primary reference for this research, and the Blast2GO software was employed to perform Gene Ontology (GO) analysis on the QrGAPDH genes [45]. Annotations from the Nr database were obtained through the NCBI BLASTP tool, which can be accessed at (https://blast.ncbi.nlm.nih.gov/Blast.cgi?PROGRAM=blastp&PAGE_TYPE=BlastSearch&LINK_LOC=blasthome; accessed on 26 June 2023). To identify the cis-acting elements, the 1500 bp sequence located upstream of the coding regions of the QrGAPDH genes was extracted and analyzed using PlantCARE, which is available at (http://bioinformatics.psb.ugent.be/webtools/plantcare/html/; accessed on 28 June 2023) [46].

4.5. Plant Materials and Drought Stress Treatment

The two-year-old Q. rubra seedlings were grown in a greenhouse at the National Institute of Forest Science (NIFOS) in Korea, situated at 37°15′04″ N, 136°57′59″ E. These seedlings were placed in topsoil that was irrigated until the soil moisture content reached 40% before the commencement of the drought stress treatment. Following this, the plants experienced a 30-day period without irrigation, which was succeeded by a re-watering phase lasting six days. Control plants were maintained under the same conditions, except that their soil moisture levels were consistently kept at 40%. Soil moisture was monitored bi-daily using a moisture probe from ICT International Pty. Ltd., located in Armidale, NSW, Australia. Upon collection, samples were immediately frozen in liquid nitrogen and stored at −80 °C until further analysis. Each treatment group included three biological replicates.

4.6. Measurement of GAPDH Contents

To assess the levels of GAPDH, approximately 0.1 g samples were obtained from different tissues. The GAPDH concentration in two-year-old seedling plants was determined utilizing the Plant GAPDH ELISA Kit (MyBioSource, San Diego, CA, USA) in accordance with the manufacturer’s instructions. Absorbance readings were taken at 450 nm with an automatic plate reader (SpectraMax M2, Molecular Devices, San Jose, CA, USA).

4.7. RNA Extraction and Quantitative Real-Time PCR (qPCR)

For transcriptional analysis of GAPDH genes in response to drought stress, total RNAs were isolated from Q. rubra using the Beniprep® Super Plant RNA extraction kit (InVirusTech Co., Gwangju, Republic of Korea). RNA samples were then converted into single-stranded cDNA using the cDNA EcoDry Premix (TaKaRa, Shiga, Japan). qPCR was conducted on a CFX96 Touch Real-Time PCR Detection System (Bio-Rad, Hercules, CA, USA) using IQtm SYBR Green Supermix (Bio-Rad, Hercules, CA, USA). The reaction conditions were as follows: an initial denaturation at 95 °C for 30 s, followed by 38 cycles of 95 °C for 5 s and 60 °C for 34 s. The relative abundance of transcripts was analyzed using the 2−ΔΔCt method [47]. To normalize the qPCR results, the expression levels of α-tub and 18S rRNA were used [48,49]. The gene-specific primers employed are detailed in Supplementary Table S5.

4.8. Statistical Analysis

A one-way ANOVA was employed for the analyses of qPCR and GAPDH protein levels. To assess multiple comparisons, the Tukey test for honestly significant differences (HSD) was applied. The criterion for statistical significance was set at p < 0.05. Results are presented as means ± standard deviations (SD).

5. Conclusions

This paper presents a genome-wide analysis of 13 QrGAPDH genes in the Q. rubra genome. These genes exhibit varied expression patterns across different tissues, with the expression levels of some QrGAPDH genes being influenced by drought and subsequent re-watering. Analyzing the genome of QrGAPDH genes aids in understanding the crucial factors that regulate gene expression in Quercus. The expression of GAPDHs is modulated by various hormones (ABA, ET, SA, and MeJA) and abiotic stressors (oxidative stress, salt, drought, and cold), as evidenced by promoter cis-element analysis and qPCR detection. Additionally, Qurub.M241600.1, Qurub.02G290300.1, and Qurub.10G209800.1 demonstrated significant differential expression under drought conditions, suggesting a potential role for QrGAPDHs in drought tolerance. In conclusion, our study provides a comprehensive understanding of the properties of QrGAPDHs and establishes a foundation for further research into the biological functions of the Q. rubra gene family.

Supplementary Materials

The following supporting information can be downloaded from https://www.mdpi.com/article/10.3390/plants13162312/s1: Table S1: Subcellular localization of QrGAPDHs and the number of proteins present in each organelle. Table S2: Chromosome mapping of QrGAPDH genes, their location, and orientation. Table S3: List of QrGAPDHs detected in Quercus rubra through the HMMER approach and NR-based GO annotation using BLAST2GO. Table S4: List of cis-regulatory elements identified across 13 QrGAPDH genes. Table S5: Sequence of primers used for qPCR in Quercus rubra.

Author Contributions

Conceptualization, H.L.; methodology, H.L., T.-L.K. and M.I.J.D.; software, M.I.J.D. and S.N.; validation, H.L., M.I.J.D. and S.N.; resources, H.L., K.L. and C.O.; data curation, H.L., T.-L.K. and M.I.J.D.; writing—original draft preparation, H.L. and M.I.J.D.; writing—review and editing, H.L. and K.L.; funding acquisition, H.L. and C.O. All authors have read and agreed to the published version of the manuscript.

Funding

This research was supported by the National Institute of Forest Science of the Republic of Korea, grant number FG0402-2022-01-2024.

Data Availability Statement

The data presented in this study are available on request from the corresponding author.

Conflicts of Interest

The authors declare no conflicts of interest.

References

  1. Plaxton, W.C. The organization and regulation of plant glycolysis. Annu. Rev. Plant Physiol. Plant Mol. Biol. 1996, 47, 185–214. [Google Scholar] [CrossRef] [PubMed]
  2. Kim, T.-L.; Denison, M.I.J.; Lim, H.; Chung, H.; Oh, C. Genome-wide analysis, identification, and characterization of the PFK gene family members of Populus deltoides. Forests 2023, 14, 1104. [Google Scholar] [CrossRef]
  3. Nicholls, C.; Li, H.; Liu, J.P. GAPDH: A common enzyme with uncommon functions. Clin. Exp. Pharmacol. Physiol. 2012, 39, 674–679. [Google Scholar] [CrossRef] [PubMed]
  4. Jeong, M.J.; Park, S.C.; Kwon, H.B.; Byun, M.O. Isolation and characterization of the gene encoding glyceraldehyde-3-phosphate dehydrogenase. Biochem. Biophys. Res. Commun. 2000, 278, 192–196. [Google Scholar] [CrossRef] [PubMed]
  5. Kappachery, S.; Baniekal-Hiremath, G.; Yu, J.W.; Park, S.W. Effect of over- and under-expression of glyceraldehyde 3-phosphate dehydrogenase on tolerance of plants to water-deficit stress. Plant Cell Tissue Organ Cult. 2015, 121, 97–107. [Google Scholar] [CrossRef]
  6. Zhang, L.; Zhang, H.; Yang, S. Cytosolic TaGAPC2 enhances tolerance to drought stress in transgenic Arabidopsis plants. Int. J. Mol. Sci. 2020, 21, 7499. [Google Scholar] [CrossRef] [PubMed]
  7. Jeong, M.J.; Park, S.C.; Byun, M.O. Improvement of salt tolerance in transgenic potato plants by glyceraldehyde-3 phosphate dehydrogenase gene transfer. Mol. Cells 2001, 12, 185–189. [Google Scholar] [CrossRef]
  8. Lim, H.; Hwang, H.; Kim, T.; Kim, S.; Chung, H.; Lee, D.; Kim, S.; Park, S.; Cho, W.; Ji, H.; et al. Transcriptomic Analysis of Rice Plants Overexpressing PsGAPDH in Response to Salinity Stress. Genes 2021, 12, 641. [Google Scholar] [CrossRef] [PubMed]
  9. Kosová, K.; Prášil, I.T.; Vítámvás, P. Protein contribution to plant salinity response and tolerance acquisition. Int. J. Mol. Sci. 2013, 14, 6757–6789. [Google Scholar] [CrossRef]
  10. Cui, G.; Bai, Y.; Li, W.; Gao, Z.; Chen, S.; Qiu, N.; Satoh, T.; Kakuchi, T.; Duan, Q. Synthesis and characterization of Eu(III) complexes of modified D-glucosamine and poly(N-isopropylacrylamide). Mater. Sci. Eng. C. Mater. Biol. Appl. 2017, 78, 603–608. [Google Scholar] [CrossRef]
  11. Zeng, L.; Deng, R.; Guo, Z.; Yang, S.; Deng, X. Genome-wide identification and characterization of glyceraldehyde-3-phosphate dehydrogenase genes family in wheat (Triticum aestivum). BMC Genom. 2016, 17, 240. [Google Scholar] [CrossRef] [PubMed]
  12. Ilyas, M.; Nisar, M.; Khan, N.; Hazrat, A.; Khan, A.H.; Hayat, K.; Fahad, S.; Khan, A.; Ullah, A. Drought tolerance strategies in plants: A mechanistic approach. J. Plant Growth Regul. 2021, 40, 926–944. [Google Scholar] [CrossRef]
  13. Golldack, D.; Li, C.; Mohan, H.; Probst, N. Tolerance to drought and salt stress in plants: Unraveling the signaling networks. Front. Plant Sci. 2014, 5, 151. [Google Scholar] [CrossRef] [PubMed]
  14. Kim, T.-L.; Lim, H.; Chung, H.; Veerappan, K.; Oh, C. Elevated CO2 alters the physiological and transcriptome responses of Pinus densiflora to long-term CO2 exposure. Plants 2022, 11, 3530. [Google Scholar] [CrossRef] [PubMed]
  15. Guo, L.; Ma, F.; Wei, F.; Fanella, B.; Allen, D.K.; Wang, X. Cytosolic phosphorylating glyceraldehyde-3-phosphate dehydrogenases affect Arabidopsis cellular metabolism and promote seed oil accumulation. Plant Cell 2014, 26, 3023–3035. [Google Scholar] [CrossRef] [PubMed]
  16. Bustos, D.M.; Bustamante, C.A.; Iglesias, A.A. Involvement of nonphosphorylating glyceraldehyde-3-phosphate dehydrogenase in response to oxidative stress. J. Plant Physiol. 2007, 165, 456–461. [Google Scholar] [CrossRef] [PubMed]
  17. Zhao, X.; Wang, J.; Xia, N.; Qu, Y.; Zhan, Y.; Teng, W.; Li, H.; Li, W.; Li, Y.; Zhao, X.; et al. Genome-wide identification and analysis of glyceraldehyde-3-phosphate dehydrogenase family reveals the role of GmGAPDH14 to improve salt tolerance in soybean (Glycine max L.). Front. Plant Sci. 2023, 14, 1193044. [Google Scholar] [CrossRef] [PubMed]
  18. Miao, L.; Chen, C.; Yao, L.; Tran, J.; Zhang, H. Genome-wide identification, characterization, interaction network and expression profile of GAPDH gene family in sweet orange (Citrus sinensis). Peer J. 2019, 7, e7934. [Google Scholar] [CrossRef]
  19. Kim, T.-L.; Lim, H.; Denison, M.I.J.; Natarajan, S.; Oh, C. Genome-wide identification of the PFK gene family and their expression analysis in Quercus rubra. Front. Genet. 2023, 14, 1289557. [Google Scholar] [CrossRef]
  20. Konar, A.; Choudhury, O.; Bullis, R.; Fiedler, L.; Kruser, J.M.; Stephens, M.T.; Gailing, O.; Schlarbaum, S.; Coggeshall, M.V.; Staton, M.E.; et al. High-quality genetic mapping with ddRADseq in the non-model tree Quercus rubra. BMC Genom. 2017, 18, 417. [Google Scholar] [CrossRef]
  21. Kim, S.C.; Guo, L.; Wang, X. Nuclear moonlighting of cytosolic glyceraldehyde-3-phosphate dehydrogenase regulates Arabidopsis response to heat stress. Nat. Commun. 2020, 11, 3439. [Google Scholar] [CrossRef]
  22. Li, Y.M.; Sun, S.R.; Wang, Y.; Cai, X.X.; Yao, J.X.; Zhu, L. Identification of the GAPDH gene family in Citrullus lanatus and functional characteristics of ClGAPC2 in Arabidopsis thaliana. Plant Biol. 2023, 25, 334–342. [Google Scholar] [CrossRef]
  23. Ranjbar, M.; Khakdan, F.; Ghorbani, A.; Zargar, M.; Chen, M. The variations in gene expression of GAPDH in Ocimum basilicum cultivars under drought-induced stress conditions. Environ. Sci. Pollut. Res. Int. 2023, 30, 119187–119203. [Google Scholar] [CrossRef] [PubMed]
  24. Wei, H.; Movahedi, A.; Yang, J.; Zhang, Y.; Liu, G.; Zhu, S.; Yu, C.; Chen, Y.; Zhong, F.; Zhang, J. Characteristics and molecular identification of glyceraldehyde-3-phosphate dehydrogenases in poplar. Int. J. Biol. Macromol. 2022, 219, 185–198. [Google Scholar] [CrossRef] [PubMed]
  25. Tian, M.; Sasvari, Z.; Gonzalez, P.A.; Friso, G.; Rowland, E.; Liu, X.M.; van Wijk, K.J.; Nagy, P.D.; Klessig, D.F. Salicylic acid inhibits the replication of tomato bushy stunt virus by directly targeting a host component in the replication complex. Mol. Plant Microbe Interact. 2015, 28, 379–386. [Google Scholar] [CrossRef] [PubMed]
  26. Li, P.; Liu, H.; Yang, H.; Pu, X.; Li, C.; Huo, H.; Chu, Z.; Chang, Y.; Lin, Y.; Liu, L. Translocation of drought-responsive proteins from the chloroplasts. Cells 2020, 9, 259. [Google Scholar] [CrossRef]
  27. Tristan, C.; Shahani, N.; Sedlak, T.W.; Sawa, A. The diverse functions of GAPDH: Views from different subcellular compartments. Cell Signal. 2011, 23, 317–323. [Google Scholar] [CrossRef] [PubMed]
  28. Walther, D.; Brunnemann, R.; Selbig, J. The regulatory code for transcriptional response diversity and its relation to genome structural properties in A. thaliana. PLoS Genet. 2007, 3, e11. [Google Scholar] [CrossRef]
  29. Li, B.; Fan, R.; Sun, G.; Sun, T.; Fan, Y.; Bai, S.; Guo, S.; Huang, S.; Liu, J.; Zhang, H.; et al. Flavonoids improve drought tolerance of maize seedlings by regulating the homeostasis of reactive oxygen species. Plant Soil 2021, 461, 389–405. [Google Scholar] [CrossRef]
  30. Yamaguchi-Shinozaki, K.; Kasuga, M.; Liu Qiang, L.Q.; Nakashima, K.; Sakuma, Y.; Abe, H.; Shinwari, Z.K.; Seki, M.; Shinozaki, K. Development of drought-resistant and water stress-tolerant crops through biotechnology. In Proceedings of the 8th JIRCAS International Symposium, Tsukuba, Japan, 27–28 November 2001; JIRCAS: Tsukuba, Japan, 2002; pp. 23–34. [Google Scholar]
  31. Xu, Z.; Wang, M.; Guo, Z.; Zhu, X.; Xia, Z. Identification of a 119-bp promoter of the maize sulfite oxidase gene (ZmSO) that confers high-level gene expression and ABA or drought inducibility in transgenic plants. Int. J. Mol. Sci. 2019, 20, 3326. [Google Scholar] [CrossRef]
  32. Baldoni, E.; Genga, A.; Cominelli, E. Plant MYB Transcription Factors: Their Role in Drought Response Mechanisms. Int. J. Mol. Sci. 2015, 16, 15811–15851. [Google Scholar] [CrossRef] [PubMed]
  33. Kumari, A.; Dogra, V.; Joshi, R.; Kumar, S. Stress-responsive cis-regulatory elements underline podophyllotoxin biosynthesis and better performance of Sinopodophyllum hexandrum under water deficit conditions. Front. Plant Sci. 2022, 12, 751846. [Google Scholar] [CrossRef]
  34. Goodstein, D.M.; Shu, S.; Howson, R.; Neupane, R.; Hayes, R.D.; Fazo, J.; Mitros, T.; Dirks, W.; Hellsten, U.; Putnam, N. Phytozome: A comparative platform for green plant genomics. Nucleic Acids Res. 2012, 40, D1178–D1186. [Google Scholar] [CrossRef]
  35. Wilkins, M.R.; Gasteiger, E.; Bairoch, A.; Sanchez, J.C.; Williams, K.L.; Appel, R.D.; Hochstrasser, D.F. Protein identification and analysis tools in the ExPASy server. Methods Mol. Biol. 1999, 112, 531–552. [Google Scholar] [PubMed]
  36. Kumar, S.; Stecher, G.; Li, M.; Knyaz, C.; Tamura, K. MEGA X: Molecular Evolutionary Genetics Analysis across Computing Platforms. Mol. Biol. Evol. 2018, 35, 1547–1549. [Google Scholar] [CrossRef]
  37. Letunic, I.; Bork, P. Interactive Tree Of Life (iTOL) v5: An online tool for phylogenetic tree display and annotation. Nucleic Acids Res. 2021, 49, W293–W296. [Google Scholar] [CrossRef] [PubMed]
  38. Hu, B.; Jin, J.; Guo, A.Y.; Zhang, H.; Luo, J.; Gao, G. GSDS 2.0: An upgraded gene feature visualization server. Bioinformatics 2015, 31, 1296–1297. [Google Scholar] [CrossRef]
  39. Bailey, T.L.; Boden, M.; Buske, F.A.; Frith, M.; Grant, C.E.; Clementi, L.; Ren, J.; Li, W.W.; Noble, W.S. MEME SUITE: Tools for motif discovery and searching. Nucleic Acids Res. 2009, 37, W202–W208. [Google Scholar] [CrossRef]
  40. Zhang, Q.; Zhang, H.; Sun, L.; Fan, G.; Ye, M.; Jiang, L.; Liu, X.; Ma, K.; Shi, C.; Bao, F.; et al. The genetic architecture of floral traits in the woody plant Prunus mume. Nat. Commun. 2018, 9, 1702. [Google Scholar] [CrossRef] [PubMed]
  41. Wang, Y.; Tang, H.; Debarry, J.D.; Tan, X.; Li, J.; Wang, X.; Lee, T.H.; Jin, H.; Marler, B.; Guo, H.; et al. MCScanX: A toolkit for detection and evolutionary analysis of gene synteny and collinearity. Nucleic Acids Res. 2012, 40, e49. [Google Scholar] [CrossRef] [PubMed]
  42. Zhou, C.; Zhu, C.; Fu, H.; Li, X.; Chen, L.; Lin, Y.; Lai, Z.; Guo, Y. Genome-wide investigation of superoxide dismutase (SOD) gene family and their regulatory miRNAs reveal the involvement in abiotic stress and hormone response in tea plant (Camellia sinensis). PLoS ONE 2019, 14, e0223609. [Google Scholar] [CrossRef] [PubMed]
  43. Hurst, L.D. The Ka/Ks ratio: Diagnosing the form of sequence evolution. Trends Genet. 2002, 18, 486–487. [Google Scholar] [CrossRef] [PubMed]
  44. Szklarczyk, D.; Gable, A.L.; Lyon, D.; Junge, A.; Wyder, S.; Huerta-Cepas, J.; Simonovic, M.; Doncheva, N.T.; Morris, J.H.; Bork, P.; et al. STRING v11: Protein–protein association networks with increased coverage, supporting functional discovery in genome-wide experimental datasets. Nucleic Acids Res. 2019, 47, D607–D613. [Google Scholar] [CrossRef]
  45. Conesa, A.; Götz, S.; García-Gómez, J.M.; Terol, J.; Talón, M.; Robles, M. Blast2GO: A universal tool for annotation, visualization and analysis in functional genomics research. Bioinformatics 2005, 15, 3674–3676. [Google Scholar] [CrossRef]
  46. Lescot, M.; Déhais, P.; Thijs, G.; Marchal, K.; Moreau, Y.; Van de Peer, Y.; Rouzé, P.; Rombauts, S. PlantCARE, a database of plant cis-acting regulatory elements and a portal to tools for in silico analysis of promoter sequences. Nucleic Acids Res. 2002, 30, 325–327. [Google Scholar] [CrossRef] [PubMed]
  47. Livak, K.J.; Schmittgen, T.D. Analysis of relative gene expression data using real-time quantitative PCR and the 2−ΔΔCt method. Methods 2001, 25, 402–408. [Google Scholar] [CrossRef] [PubMed]
  48. Makela, M.; Michael, P.; Theriault, G.; Nkongolo, K. High genetic variation among closely related red oak (Quercus rubra) populations in an ecosystem under metal stress: Analysis of gene regulation. Genes Genom. 2016, 38, 967–976. [Google Scholar] [CrossRef]
  49. Migueal, P.; Nkongolo, K.; Michael, P.; Djeukam, C. Differential gene transcription in red oak (Quercus rubra) genotypes resistant to copper toxicity. Am. J. Biochem. Biotechnol. 2017, 13, 215–225. [Google Scholar] [CrossRef]
Figure 1. The phylogenetic tree of GAPDH proteins from A. thaliana, O. sativa, T. aestivum, G. max, S. tuberosum and Q. rubra. Red, blue, yellow, and pink color represent the clusters I, II, III, and IV members respectively.
Plants 13 02312 g001
Figure 2. The subcellular distribution of QrGAPDH proteins.
Plants 13 02312 g002
Figure 3. Distribution of GAPDH-encoding genes on chromosomes in Q. rubra. The left scale represents the dimensions of each chromosome.
Plants 13 02312 g003
Figure 4. Collinearity and synteny analysis of QrGAPDH genes. (a) Synteny analysis of QrGAPDH genes in Q. rubra. Chromosomes are represented as LG along with numbering. Red curves indicated syntenic gene pairs. Gray lines indicate syntenic blocks (b) Collinearity analysis of GAPDH genes among A. thaliana, O. sativa, T. aestivum, G. max and S. tuberosum genomes. Gray lines indicate collinear blocks within the six genomes, while red lines represent collinear GAPDH gene pairs. Red triangles indicate the location of the GAPDH genes in Q. rubra.
Plants 13 02312 g004
Figure 5. Phylogenetic tree based on the distribution of conserved motifs and exon-intron structure of 13 QrGAPDHs. (a) Gene evolutionary tree and motif location distribution of QrGAPDH genes. (b) The gene structure of QrGAPDH genes. (c) Alignment of repeated sequences in each motif.
Plants 13 02312 g005
Figure 6. Cis-elements in QrGAPDH gene promoters.
Plants 13 02312 g006
Figure 7. The three-dimensional structure of QrGAPDH proteins was determined through homology modeling via SWISS-MODEL, with the resulting topologies illustrated as cartoons using PyMOL. Each model is accompanied by a quality assessment based on the QMEANDisCo global score. Colors denote the model confidence factor of the SWISS-MODEL server; dark blue regions denote high confidence, green to red gradually lower reliability. The models include (a) Qurub.03G172800.1; (b) Qurub.03G172800.2; (c) Qurub.M162000.1; (d) Qurub.M162000.2; (e) Qurub.10G209800.1; (f) Qurub.M241600.1; (g) Qurub.02G290300.1; (h) Qurub.04G246900.1; (i) Qurub.04G246900.2; (j) Qurub.02G092000.1; (k) Qurub.02G267800.1; (l) Qurub.03G152000.1; (m) Qurub.03G152000.2.
Plants 13 02312 g007
Figure 8. Protein interaction network of QrGAPDH. The color scales represent the relative signal intensity scores.
Plants 13 02312 g008
Figure 9. The growth phenotype and expression of the GAPDH protein of Q. rubra. (a) Phenotype of a red oak seedling for 1 month of drought stress and recovery (6 days after re-watering). (b) GAPDH protein content under drought stress in different tissues. The outcomes of the tests conducted in triplicate are presented as means ± standard deviation (SD). Distinct lowercase letters denote significant differences (p < 0.05).
Plants 13 02312 g009
Figure 10. Relative expression profiles of 13 QrGAPDH genes under drought stress and in different tissues. The standard deviation determined from three biological replicates is shown in error bars. Significant differences (p < 0.05) are indicated by different lowercase letters.
Plants 13 02312 g010
Table 1. Gene IDs and physicochemical properties of the 13 GAPDH-encoding genes in Q. rubra.
Gene IDGene SymbolDatabase IDNumber of AAs zMW y
(KDa)
Theoretical pI xTotal Number of Negatively Charged Residues (Asp + Glu)Total Number of Positively Charged Residues (Arg + Lys)Instability IndexAliphatic IndexGRAVY w
QrGAPDH01GAPBQurub.02G092000.145248,239.248.82293327.6591.44−0.031
QrGAPDH02GAPA-2Qurub.02G267800.140242,859.988.60323724.9196.77−0.001
QrGAPDH03GAPC2Qurub.02G290300.133736,689.027.02344124.7890.24−0.103
QrGAPDH04GAPA-2Qurub.03G152000.140443,237.288.46344226.5995.54−0.018
QrGAPDH05GAPA-2Qurub.03G152000.234636,881.199.46354328.1895.55−0.060
QrGAPDH06GAPC2Qurub.03G172800.130833,677.089.25394320.5590.49−0.106
QrGAPDH07GAPC2Qurub.03G172800.230733,606.009.25424520.5890.46−0.112
QrGAPDH08GAPCP-2Qurub.04G246900.141844,648.668.48424535.1983.95−0.101
QrGAPDH09GAPCP-2Qurub.04G246900.229831,696.128.86434531.2281.85−0.107
QrGAPDH10GAPC2Qurub.10G209800.133836,616.968.25434521.7591.66−0.072
QrGAPDH11GAPC2Qurub.M162000.134037,073.588.22434722.5190.82−0.113
QrGAPDH12GAPC2Qurub.M162000.233937,002.508.22444722.5590.8−0.119
QrGAPDH13GAPC2Qurub.M241600.127930,216.829.03465324.8592.22−0.147
z AA, amino acid; y MW, molecular weight; x pI, isoelectric point; w GRAVY, grand average of hydropathy.
Table 2. The Ka/Ks ratios of duplication for QrGAPDHs.
Gene 1Gene 2KaKsKa_KsDivergence Time (Mya z)Duplication Type
Qurub.02G267800.1Qurub.03G152000.20.0769643731.3046517220.05899227595.09123335Tandem
Qurub.02G290300.1Qurub.10G209800.10.0651338690.9714114260.06705075570.80258209Tandem
z Mya, million years ago.
Table 3. Interacting proteins and their confidence score.
ClusterNode 1Node 1 IDNode 2Node 2 IDScore
Cluster IQurub.02G092000.13702.P25857Qurub.03G152000.23702.Q9LPW00.983
FBA43702.F4KGQ00.839
Q9LRV1_ARATH3702.Q9LRV10.758
CP12-13702.O229140.714
F19H22.803702.Q9SVJ50.568
Cluster IIQurub.03G152000.23702.Q9LPW0Qurub.02G092000.13702.P258570.983
FBA43702.F4KGQ00.839
F19H22.803702.Q9SVJ50.568
CP12-13702.O229140.432
Cluster IIIQurub.04G246900.13702.Q9SAJ6FBA43702.F4KGQ00.879
CP12-13702.O229140.857
F14J16.283702.F4I3I10.559
F19H22.803702.Q9SVJ50.512
Q9LRV1_ARATH3702.Q9LRV10.439
Cluster IVQurub.04G246900.23702.Q5E924FBA43702.F4KGQ00.880
CP12-13702.O229140.857
F14J16.283702.F4I3I10.559
F19H22.803702.Q9SVJ50.512
Q9LRV1_ARATH3702.Q9LRV10.400
Cluster VQurub.M241600.13702.Q9FX54FBA43702.F4KGQ00.873
CP12-13702.O229140.870
F19H22.803702.Q9SVJ50.512
F14J16.283702.F4I3I10.425
Disclaimer/Publisher’s Note: The statements, opinions and data contained in all publications are solely those of the individual author(s) and contributor(s) and not of MDPI and/or the editor(s). MDPI and/or the editor(s) disclaim responsibility for any injury to people or property resulting from any ideas, methods, instructions or products referred to in the content.

