Article

Genome-Wide Identification and Expression Analyses of the Thaumatin-Like Protein Gene Family in Tetragonia tetragonoides (Pall.) Kuntze Reveal Their Functions in Abiotic Stress Responses

1
Guangdong Provincial Key Laboratory of Applied Botany, South China National Botanical Garden, Chinese Academy of Sciences, Guangzhou 510650, China
2
Guangdong Provincial Key Laboratory of South China Agricultural Plant Molecular Analysis and Genetic Improvement, South China National Botanical Garden, Chinese Academy of Sciences, Guangzhou 510650, China
3
University of Chinese Academy of Sciences, Beijing 100039, China
4
Key Laboratory of Vegetation Restoration and Management of Degraded Ecosystems, South China National Botanical Garden, Chinese Academy of Sciences, Guangzhou 510650, China
5
Key Laboratory of National Forestry and Grassland Administration on Plant Conservation and Utilization in Southern China, South China National Botanical Garden, Chinese Academy of Sciences, Guangzhou 510650, China
6
CAS Engineering Laboratory for Vegetation Ecosystem Restoration on Islands and Coastal Zones, South China National Botanical Garden, Chinese Academy of Sciences, Guangzhou 510650, China
*
Author to whom correspondence should be addressed.
Plants 2024, 13(17), 2355; https://doi.org/10.3390/plants13172355
Submission received: 23 July 2024 / Revised: 16 August 2024 / Accepted: 19 August 2024 / Published: 23 August 2024
(This article belongs to the Section Plant Molecular Biology)

Abstract

:
Thaumatin-like proteins (TLPs), including osmotins, are multifunctional proteins related to plant biotic and abiotic stress responses. TLPs are often present as large multigene families. Tetragonia tetragonoides (Pall.) Kuntze (Aizoaceae, 2n = 2x = 32), a vegetable used in both food and medicine, is a halophyte that is widely distributed in the coastal areas of the tropics and subtropics. Saline–alkaline soils and drought are two major abiotic stress factors significantly affecting the distribution of tropical coastal plants. The expression of stress resistance genes would help to alleviate the cellular damage caused by abiotic stress factors such as high temperature, salinity–alkalinity, and drought. This study aimed to better understand the functions of TLPs in the natural ecological adaptability of T. tetragonoides to harsh habitats. In the present study, we used bioinformatics approaches to identify 37 TtTLP genes as gene family members in the T. tetragonoides genome, with the purpose of understanding their roles in different developmental processes and the adaptation to harsh growth conditions in tropical coral regions. All of the TtTLPs were irregularly distributed across 32 chromosomes, and these gene family members were examined for conserved motifs of their coding proteins and gene structure. Expression analysis based on RNA sequencing and subsequent qRT-PCR showed that the transcripts of some TtTLPs were decreased or accumulated with tissue specificity, and under environmental stress challenges, multiple TtTLPs exhibited changeable expression patterns at short (2 h), long (48 h), or both stages. The expression pattern changes in TtTLPs provided a more comprehensive overview of this gene family being involved in multiple abiotic stress responses. Furthermore, several TtTLP genes were cloned and functionally identified using the yeast expression system. These findings not only increase our understanding of the role that TLPs play in mediating halophyte adaptation to extreme environments but also improve our knowledge of plant TLP evolution. This study also provides a basis and reference for future research on the roles of plant TLPs in stress tolerance and ecological environment suitability.

1. Introduction

Tetragonia tetragonoides (Pall.) Kuntze, also called New Zealand spinach or French spinach, is a calcium-rich vegetable with high commercial values and widely distributed in the coastal regions of the tropics and subtropics. Tetragonia tetragonoides is a halophyte and can be planted near the beach, on islands, and on big reefs for ecological restoration or vegetable garden construction. This species is highly adapted to seawater and drought conditions [1] and therefore becomes the pioneer species for marine agriculture [2]. Additionally, T. tetragonoides is also a medicinal plant, as its extracts are used to treat gastrointestinal diseases owing to its antioxidant, antidiabetic, and anti-inflammatory effects [3]. Soil salinization/alkalization has become a serious threat that limits plant growth, development, and distribution and is an increasingly severe global environmental issue due to the combination of natural environmental changes and human activities [4,5]. For tropical and subtropical coastal plants, their morphology has changed with the environment, including leaf succulents and salt bladders in epidermal cells, especially under extreme salinity and drought stress challenges [3,5]. To deal with these external constraints, plants have also evolved highly complex and sophisticated response mechanisms to avoid damage from drought, salinity toxicity, extreme temperatures, chemical toxicity, oxidative stress, and subsequent physiological water imbalances in the osmotic potential of cells. The related molecular mechanisms are usually accompanied by the accumulation of stress-related proteins, which often include protein kinases, transcription factors (TFs), reactive oxygen species (ROS)-scavenging or ROS-detoxification proteins, channel proteins, and some molecular chaperones [6].
The thaumatin-like protein (TLP) family, also known as pathogenesis-related protein family 5 (PR-5) or osmotin protein, is a group of low-molecular-weight (20–26 kDa) proteins with 16 conserved cysteine (Cys) residues [7,8]. The expression of plant TLPs is induced by multiple abiotic stressors, such as high temperature, cold, salt, and drought stress. In addition, as a group of pathogenesis-related genes, TLPs are also induced by biotic stressors, including pest- and disease-dependent stressors [7,8,9]. Many studies have been performed to determine the role of TLPs in plants due to their osmo-protective and antifungal properties [10,11].
Recently, an increasing number of studies have reported that plant TLPs could provide significant elevated tolerance against abiotic stressors when overexpressed in microorganisms or plants. Solanum nigrum is a solanaceous weed, and SnOLP overexpression in soybeans (under the control of the Arabidopsis UBQ3 promoter) confers enhanced drought tolerance [12]. An Ocimum basilicum PR-5 family member (ObTLP1) shows a methyl jasmonate (MeJA)-responsive expression pattern and presents biotic/abiotic stress responses or multiple phytohormone elicitations. The ectopic expression of ObTLP1 in Arabidopsis leads to enhanced tolerance to infection by two phytopathogenic fungi, as well as to dehydration and salt stress [7]. Overexpression of the sesame (Solanum nigrum) osmotin gene SindOLP improves drought, salt, oxidative stress, and disease tolerance through altered biochemical parameters and reduced reactive oxygen species (ROS) accumulation in sesame plants [13]. Tripogon loliiformis is an Australian native resurrection grass with a rapid response to water deficits and quick recovery upon rehydration. The T. loliiformis osmotin gene TlOsm was isolated from a drought-induced cDNA library, and its expression in vivo was significantly induced by cold, drought, and salinity stress, indicating that TlOsm is involved in multiple abiotic stress responses. Further transgenic assays showed that TlOsm overexpression in rice could cause enhanced tolerance of rice plants to cold, drought, and salinity stress [14]. The rice genome contains 40 osmotin members, and OsOLP1 encodes a secreted protein. Its expression results in multiple changes under various stressors and has been associated with the desiccation/dehydration stress response. Overexpressing OsOLP1 in rice results in high drought tolerance, while OsOLP1 knockout lines have a severely reduced abscisic acid (ABA) content, decreased lignin deposition, and weakened drought tolerance [15]. Overexpression of the cotton TLP gene GhTLP19 in Arabidopsis results in higher tolerance to drought than that of control plants, while virus-induced gene silencing (VIGS) of this gene in cotton results in an insensitive phenotype to drought and phytopathogenic fungi Verticillium dahliae [16]. Triticum aestivum contains 93 TLP family members, and the expression patterns of TaTLPs indicated this family was possibly involved in wheat development processes and abiotic or biotic stress responses. In addition, heterogeneous expression of TaTLP2-B in yeast provides improved tolerance to cold, heat, osmotic, and salt stresses [17]. Ammopiptanthus nanus is tolerant of cold and is a rare evergreen broad-leaved shrub distributed in the temperate zone of Central Asia. The expression of AnTLP family genes is highly related to the environmental cold stress response, and over-expression of AnTLP13 in Escherichia coli, yeast cells, and tobacco leaves enhances its cold stress tolerance [18]. However, very few studies have indicated that the accumulation of osmotin-like proteins might lead to reduced osmotic stress tolerance in plants, such as HbOsmotin in Hevea brasiliensis [19].
Genes encoding osmotins and TLPs have been identified in diverse plant species and play multiple functions in mediating stress tolerance responses [8,9,10,11]. The poplar TLP gene family is likely involved in leaf rust resistance and organ development [20]. The grape (Vitis vinifera L.) TLP gene family contains 33 putative members. The transcripts of several VvTLPs accumulate specifically after pathogen inoculation, and VvTLP29 overexpression in Arabidopsis thaliana enhances its resistance to powdery mildew and the bacterium Pseudomonas syringae pv. tomato DC3000 but decreases resistance to Botrytis cinerea [21]. The barley TLP gene family is suspected to be involved in seed germination and the malting process [22]. Melon (Cucumis melo), cotton (Gossypium barbadense), strawberry (Fragaria × ananassa, 2n = 8x = 56), and garlic (Allium sativum) genomes contain 29, 90, 76, and 32 TLPs, respectively [23,24,25,26], and they all play important roles in developmental processes and diverse stress condition responses, especially in disease resistance.
Since many plant TLPs have been proven to provide osmotic adjustment during salinity and moisture stress [8,9,10,11], and because T. tetragonoides is a halophyte and mostly challenged by saline–alkaline, arid, and semi-arid conditions due to its native habitats, we proposed that these proteins have significant protective roles for the growth of T. tetragonoides. The aim of this study was to characterize the TLPs in T. tetragonoides, one of the most promising tropical seawater vegetables, and to further determine whether TtTLP genes were involved in the response and adaptation of this species to high salinity/alkalinity and seasonal drought stress in its special native habitats, mainly including tropical coastal regions and reefs/islands. The detailed characterization of plant TLPs focuses more on the defense responses, and our research here provides important data for understanding the biological function and abiotic stress responses of TtTLPs in T. tetragonoides.

2. Results

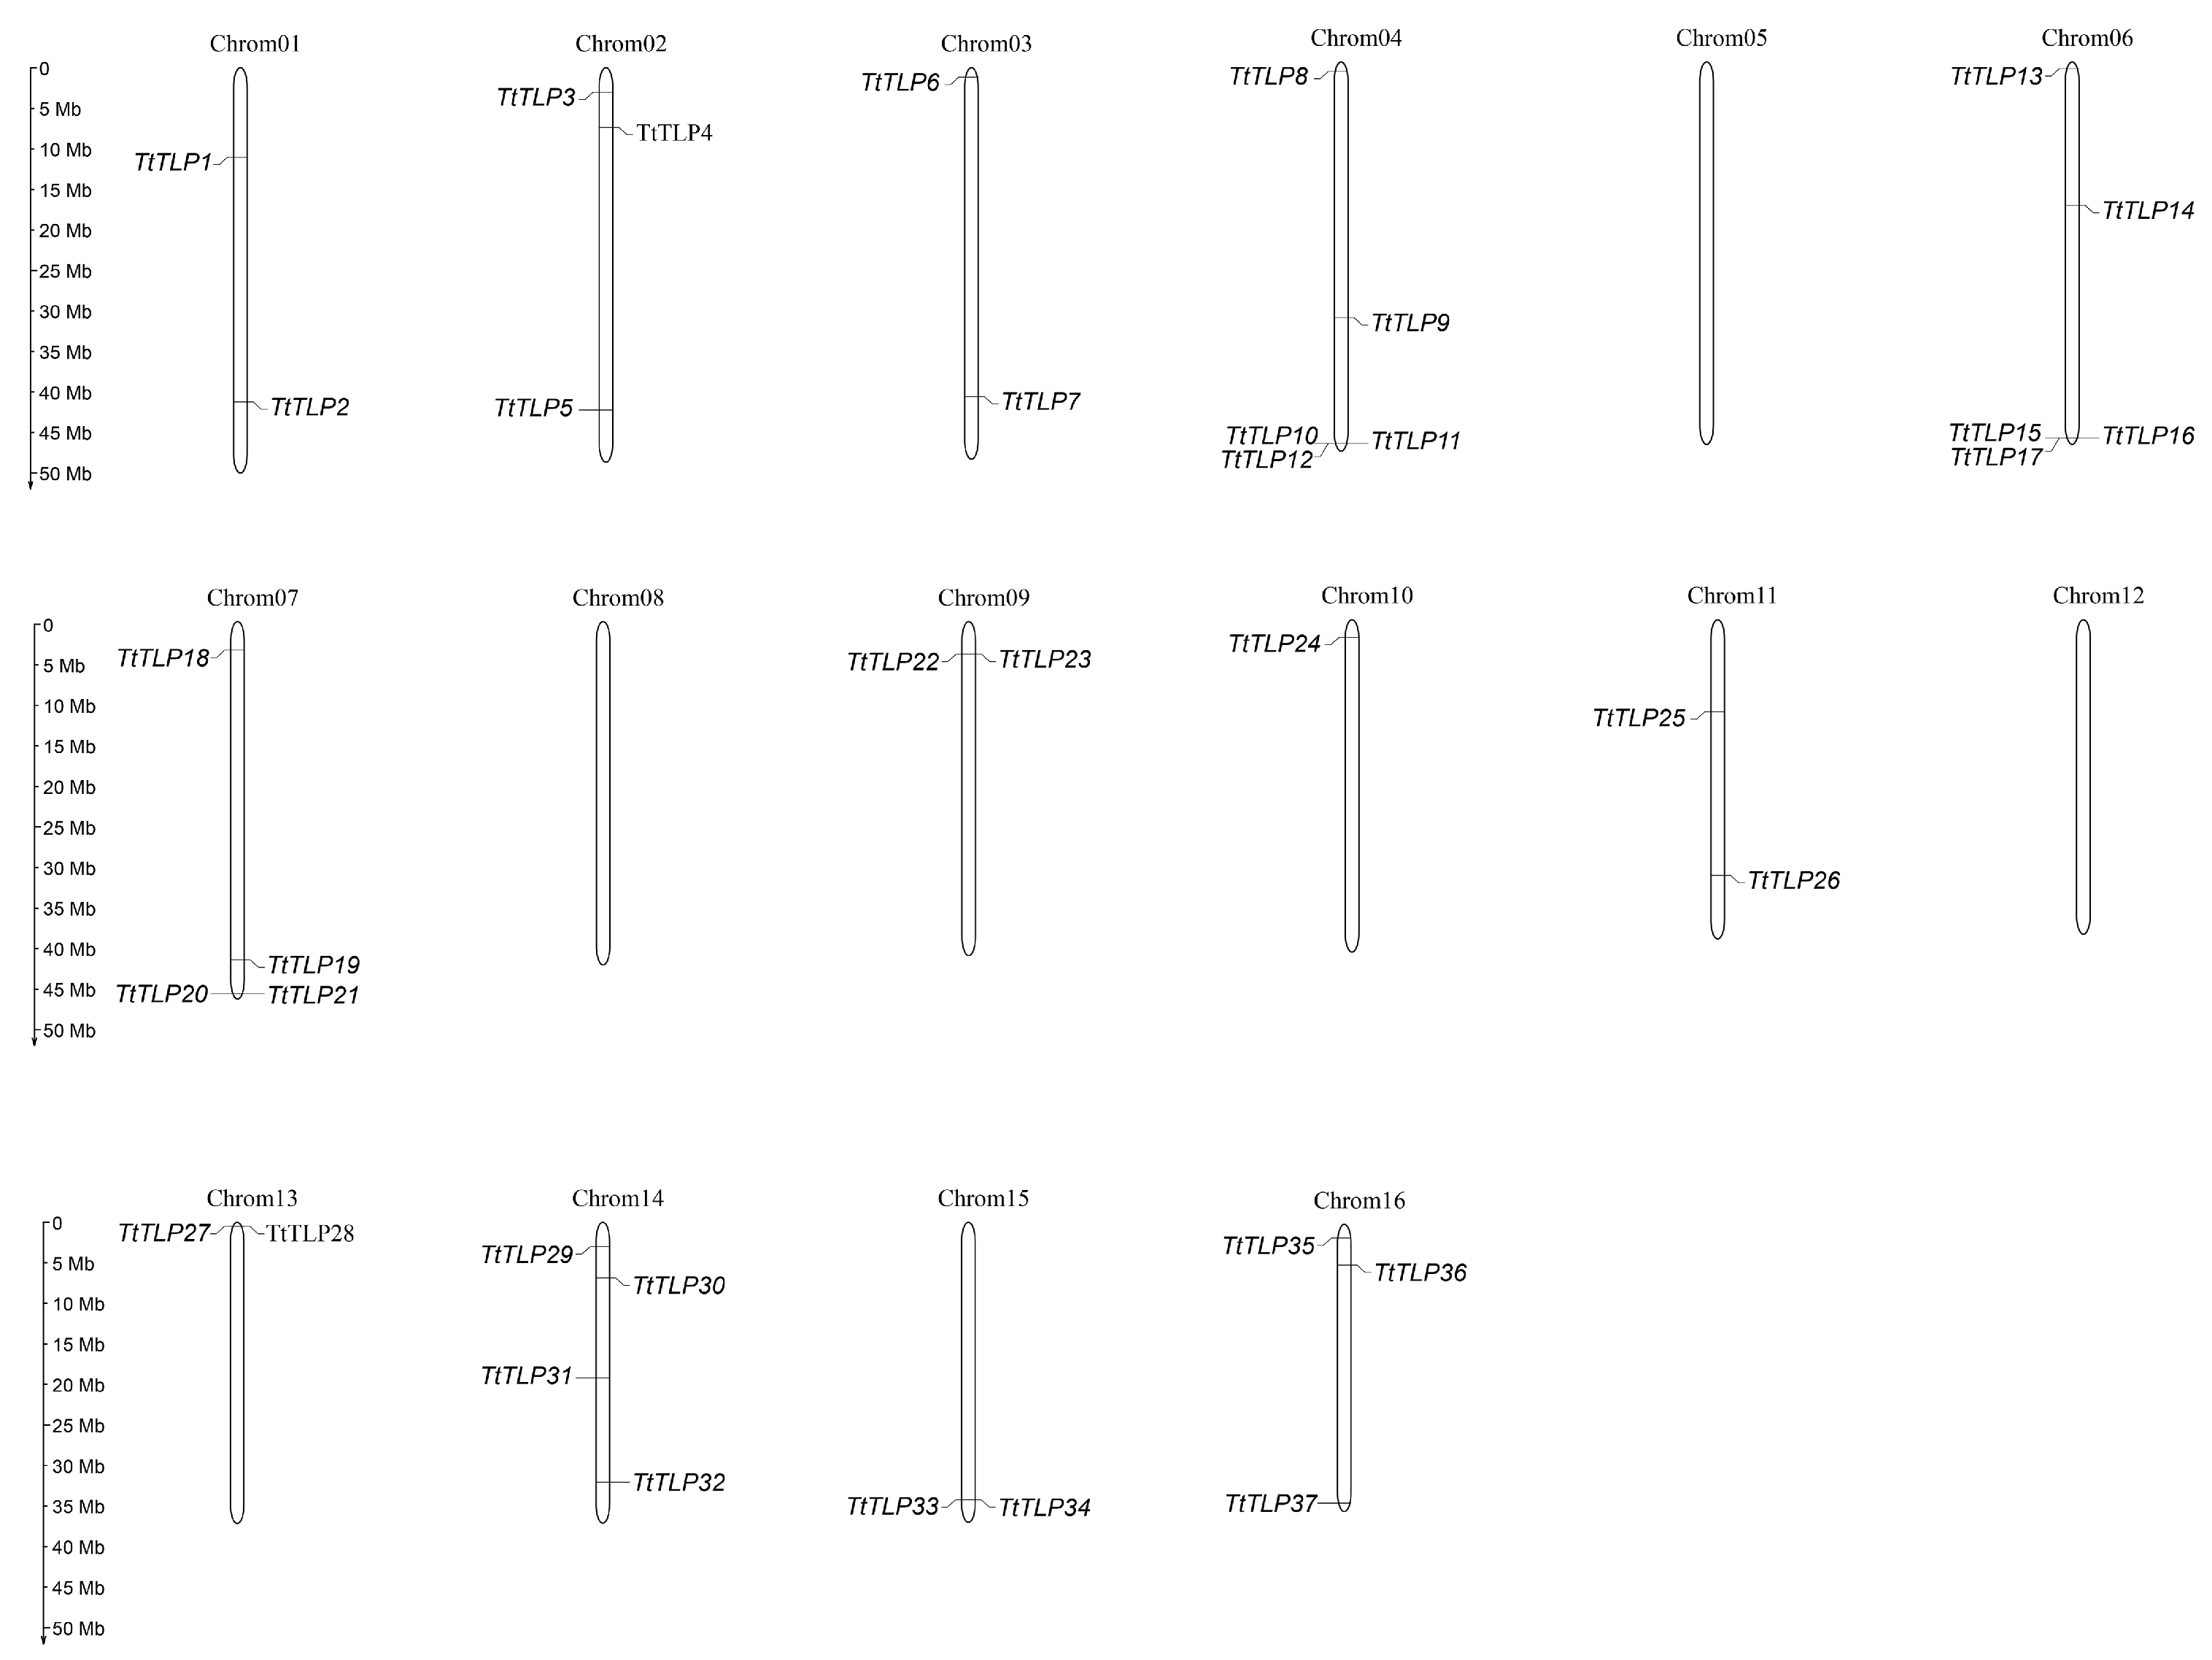
2.1. Identification of the T. tetragonoides TLP Family

Thirty-seven TLP genes have been identified from the T. tetragonoides genome using InterProscan search combined with BLAST confirmation for their coding proteins (Table 1; Supplementary File Table S1). The TtTLPs had a conserved TLP domain on their C-terminus, and according to their gene loci on the chromosomes, these genes were designated as TtTLP137. Among the 16 pairs of chromosomes in T. tetragonoides, chromosomes 05, 08, and 12 held no TtTLPs. Chromosomes 04 and 06 had the most TtTLPs (five genes), while chromosomes 07 and 14 both had four TtTLPs. Chromosomes 02 and 16 both had three TtTLPs, and chromosomes 01, 03, 09, 11, 13, and 15 each contained two TtTLPs. There was only one TtTLP (TtTLP24) on chromosome 10 (Figure 1). In general, three pairs of modules for TtTLPs with adjacent gene localization, namely TtTLP10/TtTLP11/TtTLP12 and TtTLP15/TtTLP16/TtTLP17, TtTLP20/TtTLP21 and TtTLP27/TtTLP28, and TtTLP22/TtTLP23 and TtTLP33/TtTLP34 (Figure 1), could be evolutionarily close, and this evolutionary relationship could also be deduced from the gene loci (Table 1) and phylogenetic relationship (Figure 2).

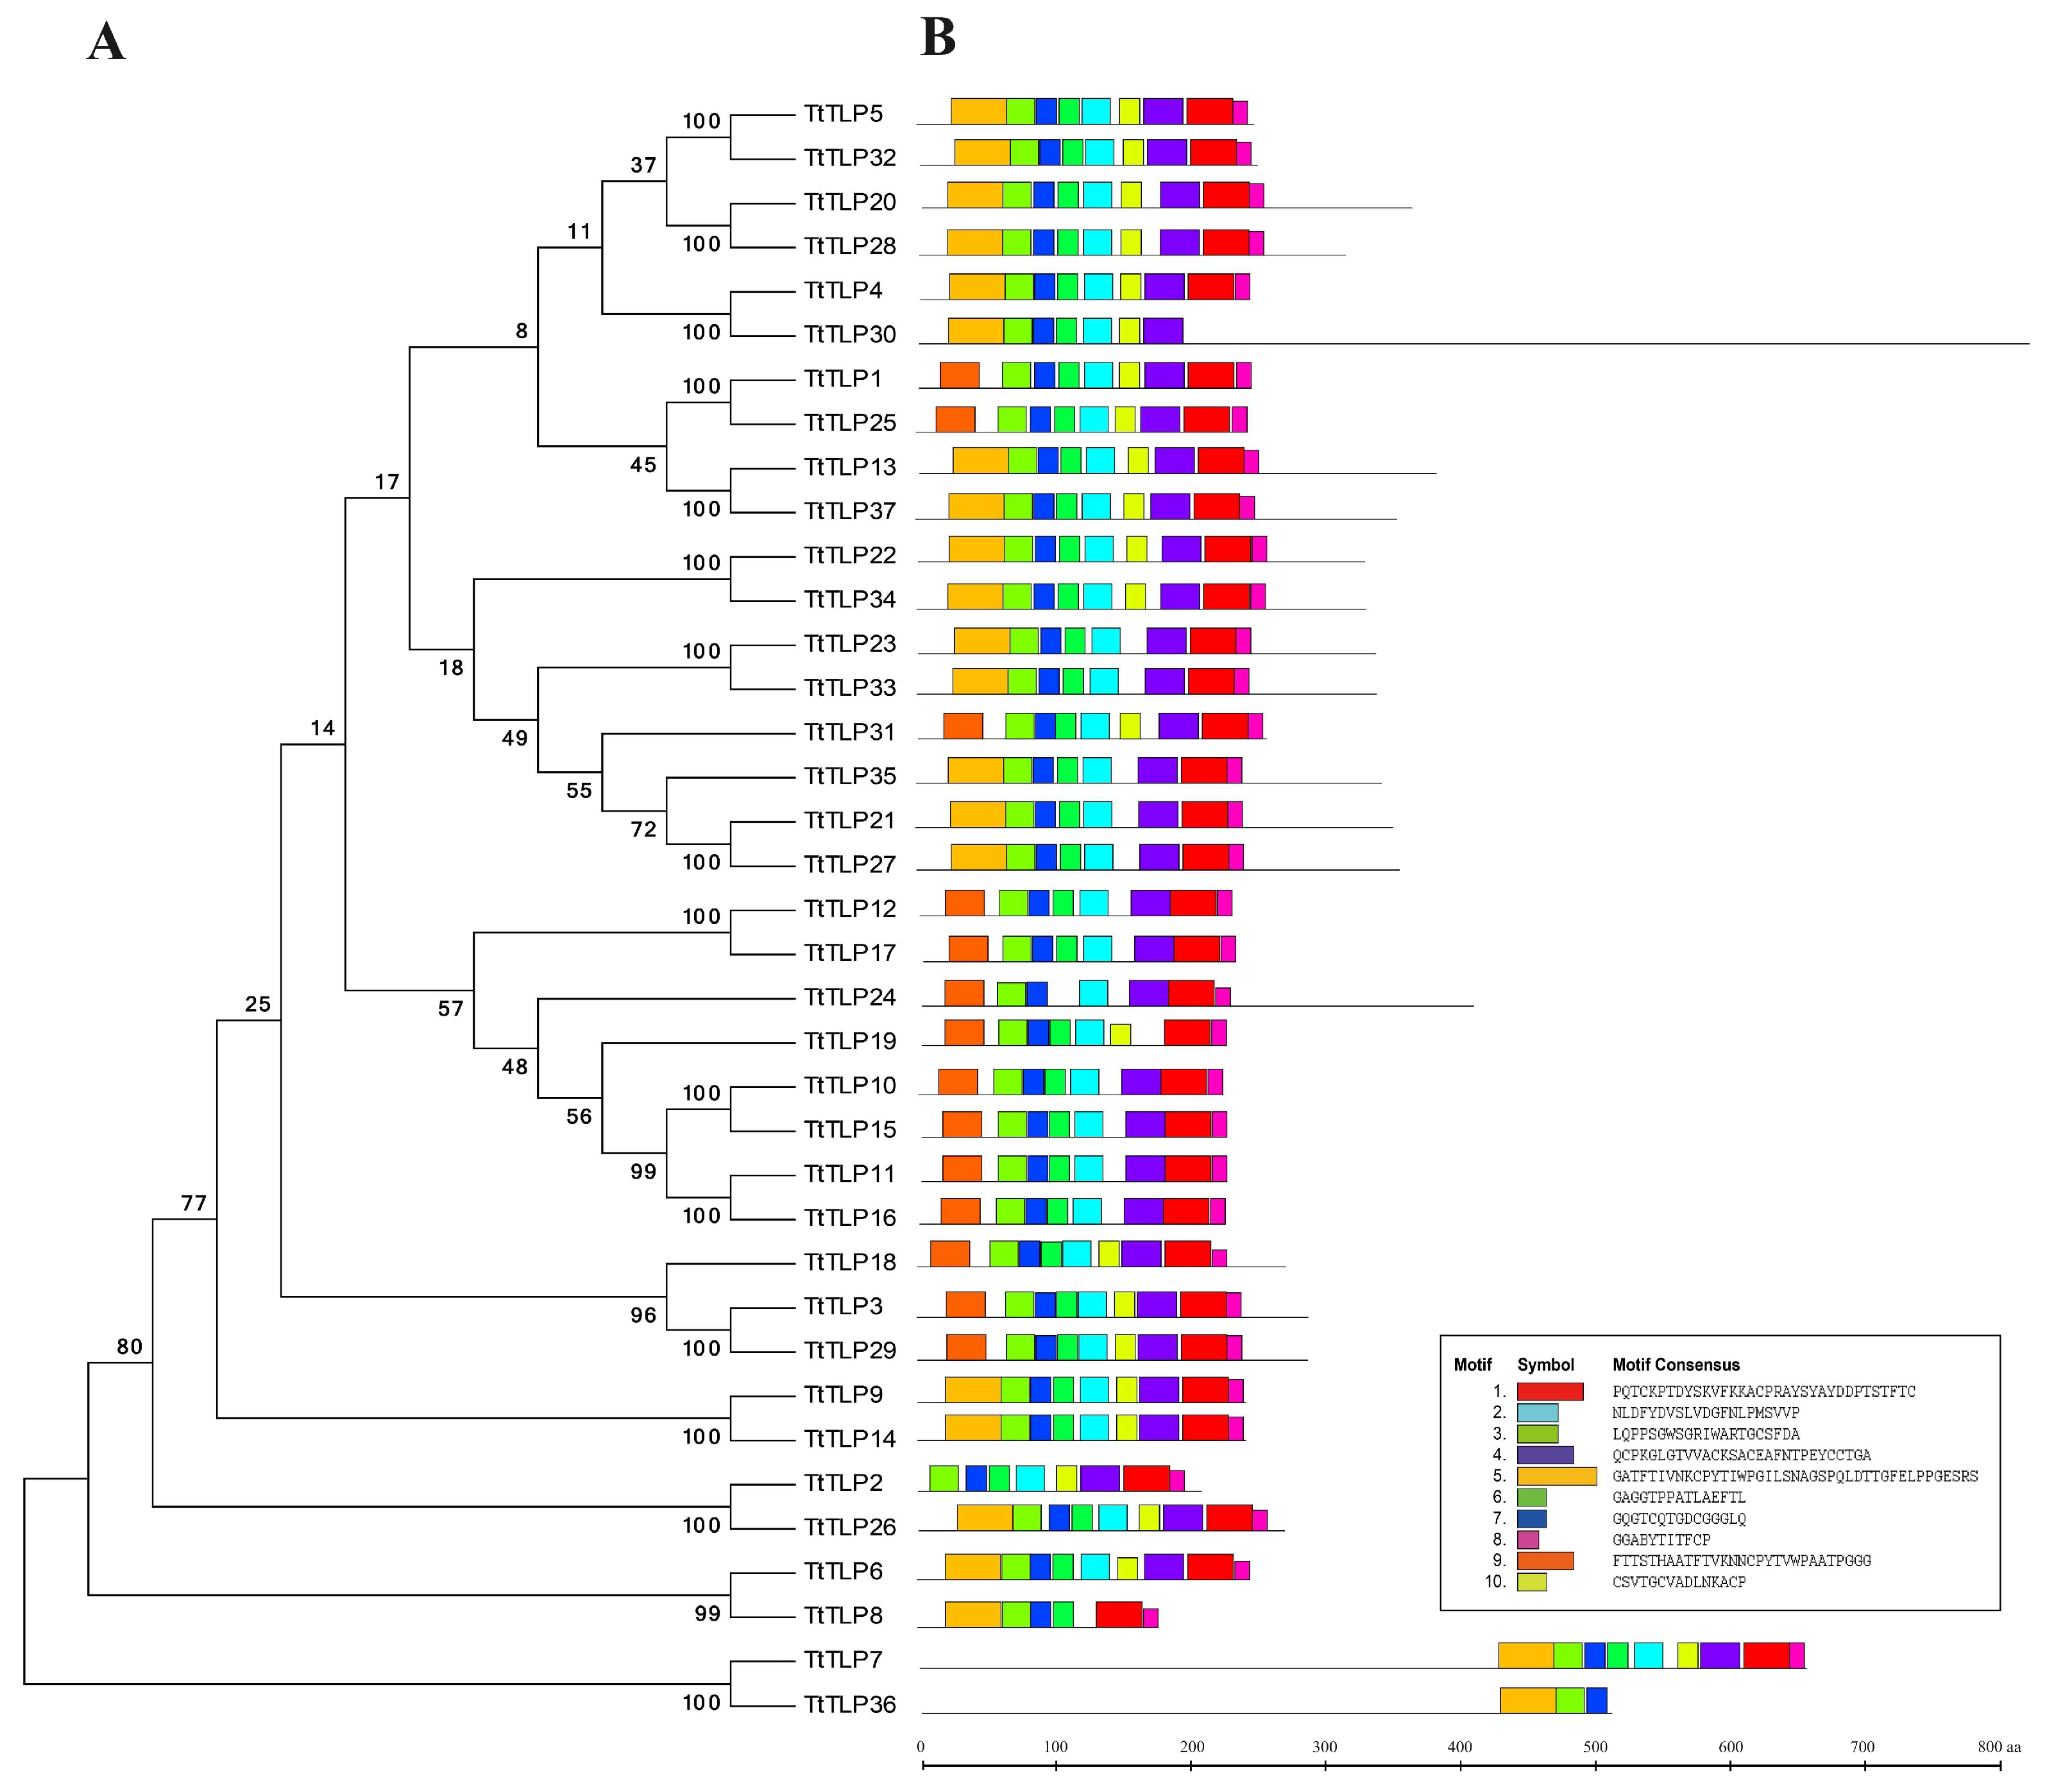
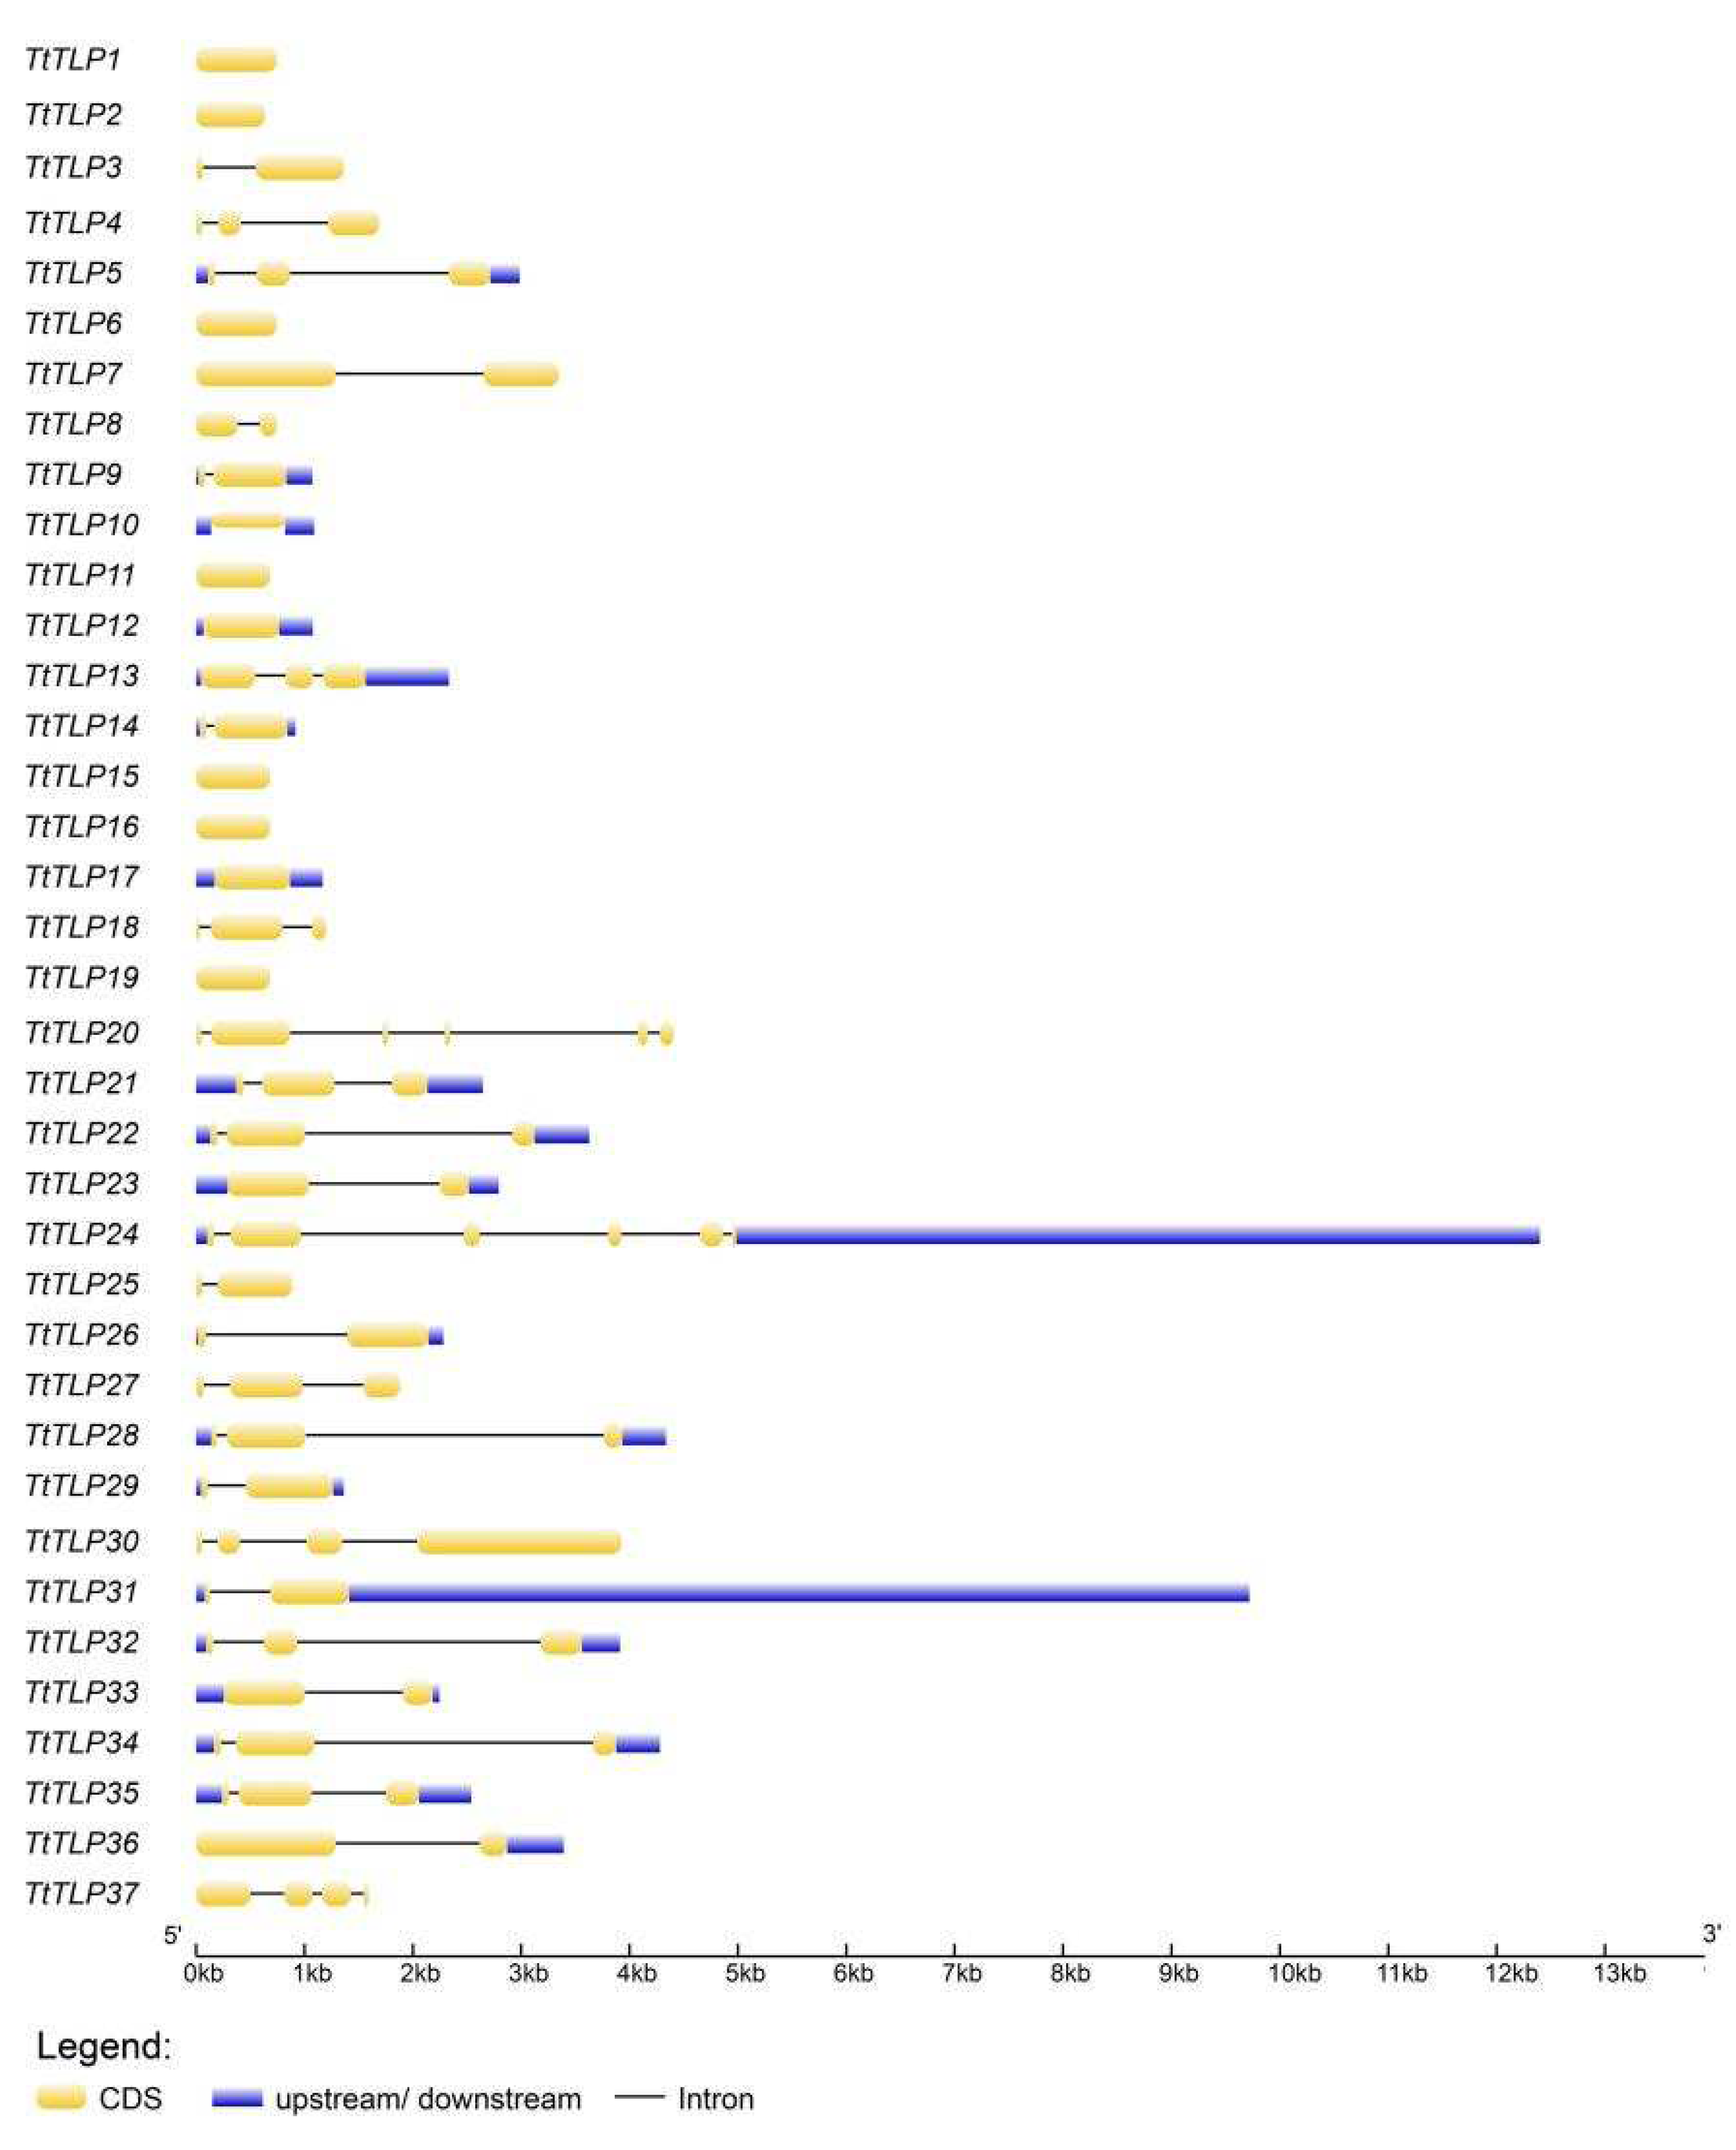
2.2. Evolutionary Characterization of TLP Proteins and TtTLP Gene Structures

To explore the molecular phylogeny between TtTLPs, we performed phylogenetic analysis and established unrooted phylogenetic trees (Figure 2). Due to proteins’ conserved motifs being critical for their biochemical functions, motif analyses were also carried out using the MEME tool with ten motifs (Figure 2). The majority of the TtTLPs contained a conserved Thaumatin_2 domain (PS51367, InterPro analysis), with the exception of TtTLP7 and TtTLP36 with an atypical TLP domain (Figure S1). This agreed with the MEME discovery prediction for TtTLPs (Figure 2).
To better understand the structural features of the TtTLP genes, exon–intron framework analyses were performed using the GSDS 2.0 tool. The number of introns in the 37 TtTLPs ranged from 0 to 5, of which 10 TtTLP genes (TtTLP1, TtTLP2, TtTLP6, TtTLP10, TtTLP11, TtTLP12, TtTLP15, TtTLP16, TtTLP17, and TtTLP19) contained no introns. Twelve TtTLP genes (TtTLP3, TtTLP7, TtTLP8, TtTLP9, TtTLP14, TtTLP23, TtTLP25, TtTLP26, TtTLP29, TtTLP31, TtTLP33, and TtTLP36) contained one intron, and eleven TtTLP genes (TtTLP4, TtTLP5, TtTLP13, TtTLP18, TtTLP21, TtTLP22, TtTLP27, TtTLP28, TtTLP32, TtTLP34, and TtTLP35) contained two introns. Only two TtTLP genes (TtTLP30 and TtTLP37) contained three introns, and only TtTLP20 and TtTLP24 contained five introns. No TtTLPs contained four introns (Figure 3). When compared with the phylogenetic clustering analysis of TtTLPs and protein motif prediction (Figure 2), the exon–intron structure of TtTLP genes in the same subgroup was unrelated to the protein motif analysis.
To gain insight into the relationship between TtTLPs and those of other plant species, we used data from 58 TLPs in the model plants Arabidopsis (27 AtTLPs) and rice (31 OsTLPs) [23]. These sequences were then aligned, and the phylogenetic tree was constructed via the NJ method (Figure 4). The resulting tree classified these TLPs into 10 subgroups, named groups 1 to 10, based on their phylogenetic relationship. These results are similar to those observed in melon (Cucumis melo L.) CmTLPs [23]. In each subgroup, there were 2–6 TtTLPs, indicating that based on the conserved domains combined with functional analysis, the existence of different TtTLPs with specialized functions was also relatively average.

2.3. Duplication Event Investigation

The emergence and existence of the gene members in a large gene family usually include a single gene and several gene duplication patterns: whole-genome duplication (WGD), tandem duplication (TD), proximal duplication (PD), transposed duplication (TRD), and dispersed duplication (DD). Duplication event analyses were carried out to understand the role of these events in the evolution and expansion of the TtTLP gene family in this special habitat species. Most TtTLPs were generated by WGD, and only five TtTLPs, namely TtTLP5, TtTLP18, TtTLP19, TtTLP24, and TtTLP31, were generated by DD. Two TtTLPs, TtTLP12 and TtTLP17, were generated by PD, and only TtTLP11 had a TD pattern (Table S2). All duplicated gene modules had a similar aggregated distribution on the chromosomes (Figure 1).
Throughout evolution, evolutionary forces and natural pressures inevitably affected the duplicated genes with different patterns. To understand the evolutionary divergence between the paralogous gene pairs, Ka/Ks analysis was carried out in the TtTLP gene family. A Ka/Ks ratio of more than 1 (Ka/Ks > 1) suggests positive (non-purifying), and a ratio less than 1 (Ka/Ks < 1) indicates negative (purifying) selection pressure. A ratio equal to 1 (Ka/Ks = 1) indicates neutral selection. All paralogous genes showed a Ka/Ks ratio less than 1 (Ka/Ks < 1), suggesting negative or purifying selection on duplicated TLP genes (Table S2).

2.4. Features of TtTLP Proteins

After verification of the complete ORF of the full-length cDNA of each TtTLP, the predicted amino acid (aa) sequences of the TtTLPs were calculated using biological programs. Among the 37 TtTLPs identified, TtTLP30 was the longest, with 825 aa, and TtTLP8 was the shortest (179 aa). Most of the TtTLPs had a length between 200 and 400 aa. The molecular weights (MW) of these TLPs ranged from 19.33 to 91.27 kD, with isoelectric point (pI) values between 4.23 and 9.28. Detailed information on the TtTLPs, including their names, gene loci, protein lengths (aa), MWs, major amino acid contents, pI, instability index (II), aliphatic index (AI), grand average of hydropathicity (GRAVY) values, disordered aa contents, and topology characteristics, is summarized in Table 1. The subcellular localization for all TtTLPs predicted by WoLF_PSORT and Plant-PLoc presented slightly different results, while most TtTLPs were localized extracellularly.
The conserved cysteine residues in plant TLPs are typical features of the THAUMATIN_2 domain, and the REDDD motif (arginine, glutamic acid, and three aspartic acid residues) is also known to confer antifungal activity to plant TLPs [27]. Here, we also searched for these amino acid residues in all TtTLPs, and the presence of these conserved amino acids described for the thaumatin domain in the aligned sequences of the TtTLPs further ensures the conservation of the biochemical functions of TtTLPs.

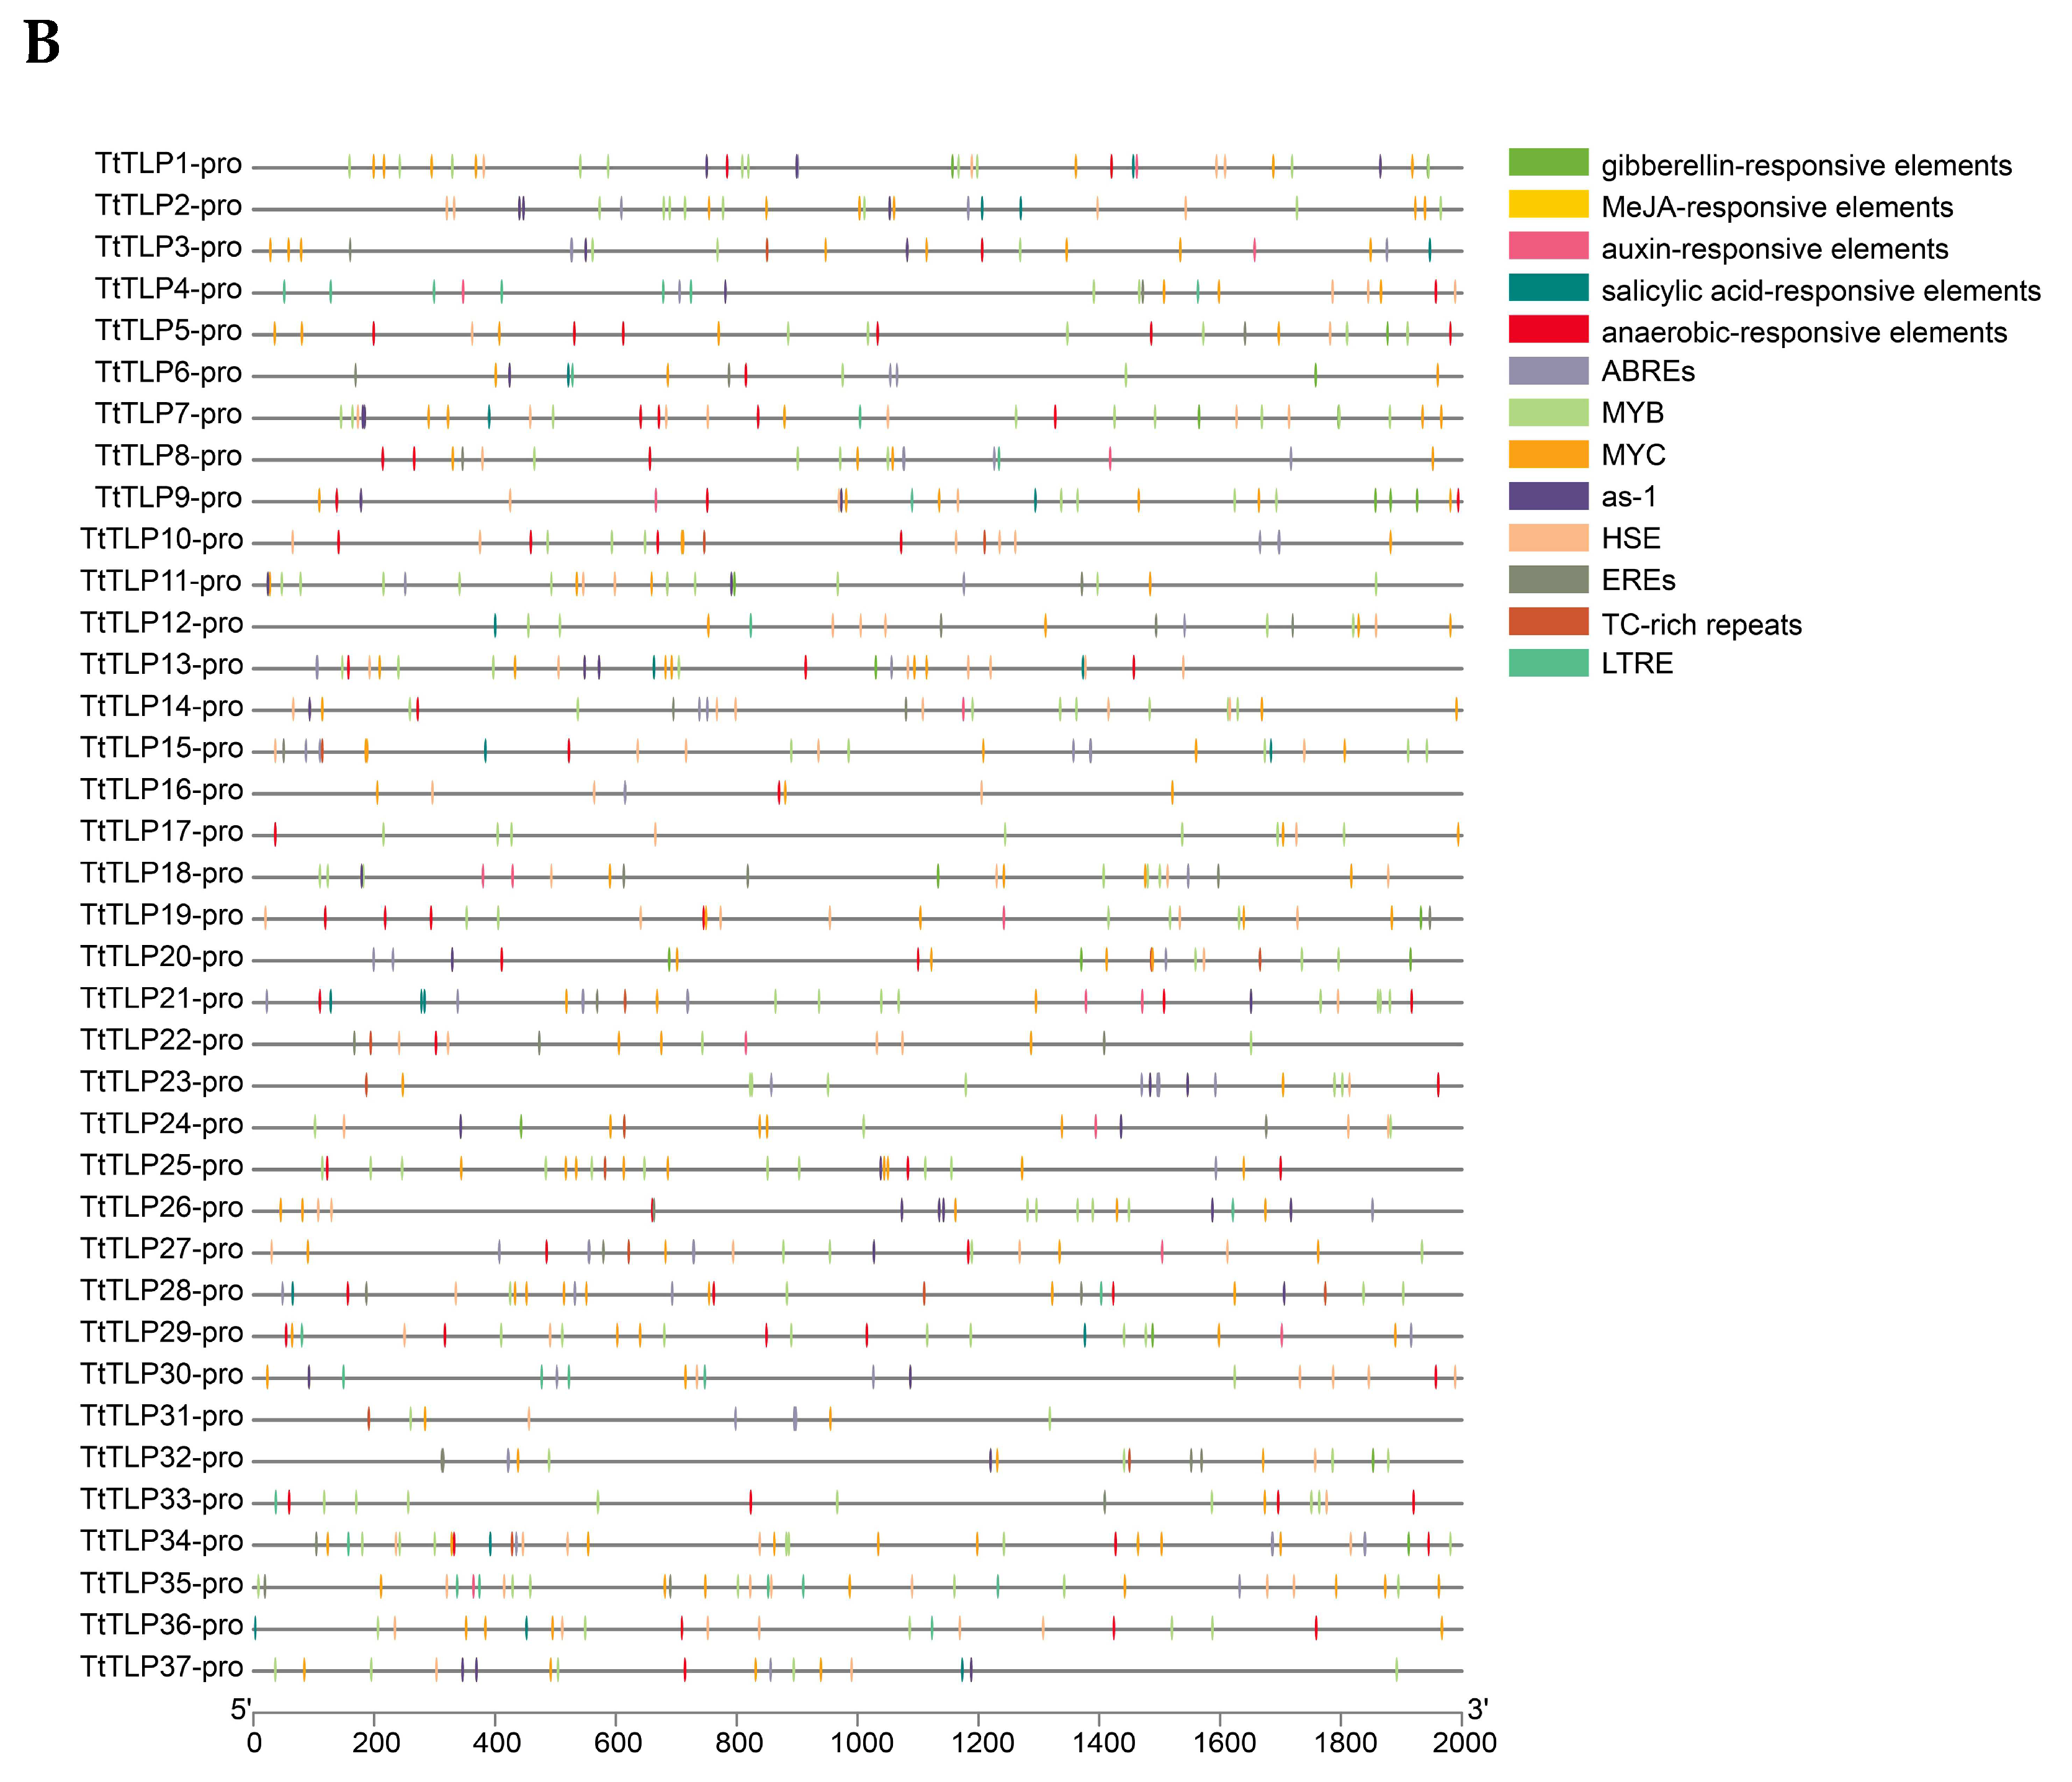
2.5. Cis-Acting Elements (CEs) of the TtTLP Promoter Sequences

The CEs in the gene promoter region are necessary for the regulation of gene expression during plant development and under different environmental conditions, mainly by binding to specific TFs. The promoter sequences in the 2 kb region upstream of all TtTLPs’ 5′-untranslated regions (5′-UTRs) were analyzed. Based on their putative functions, the 13 identified CEs were segregated into two groups: hormone-specific and abiotic stress-responsive elements. Here, we mainly summarized their numbers (Figure 5A) and localized the specific CE positions (Figure 5B) in the promoter regions. This information explained the biological functions of TtTLPs by predicting their possible expression regulatory mechanisms.
The results of the TtTLP CE analysis are shown in Figure 5 and Table S3. Most TtTLPs (28 of 37) had CEs responsive to ABA (ABRE), and all TtTLPs had elements responsive to hormones, most of which responded to at least one of the six hormones searched. Anaerobic-responsive elements were also relatively common in TtTLP promoters, indicating their possible roles for water logging or sand/soil burial. More than half of TtTLPs had abiotic stress-inducibility elements, such as as-1, HSE, LTRE, and TC-rich repeats. Therefore, the expression of TtTLP genes may be regulated by CEs associated with abiotic stress responses. MYB- and MYC-binding sites (MYB and MYC) were also observed. In particular, only the TtTLP16 promoter region did not contain a MYB-binding site, and the other 36 TtTLP promoters held at least 1 MYB-binding CE (up to 15 in TtTLP1 and TtTLP25 promoters). Similarly, MYC-binding CEs commonly exist in all TtTLP promoters (Table S3). In plants, MYB and MYC TFs are not only about abiotic stress responses but are also related to plant development processes [28,29]. The presence of MYB- and MYC-binding CEs in all TtTLP promoters suggests that further possible functions of the TtTLP family are involved in T. tetragonoides development and environmental adaptation.

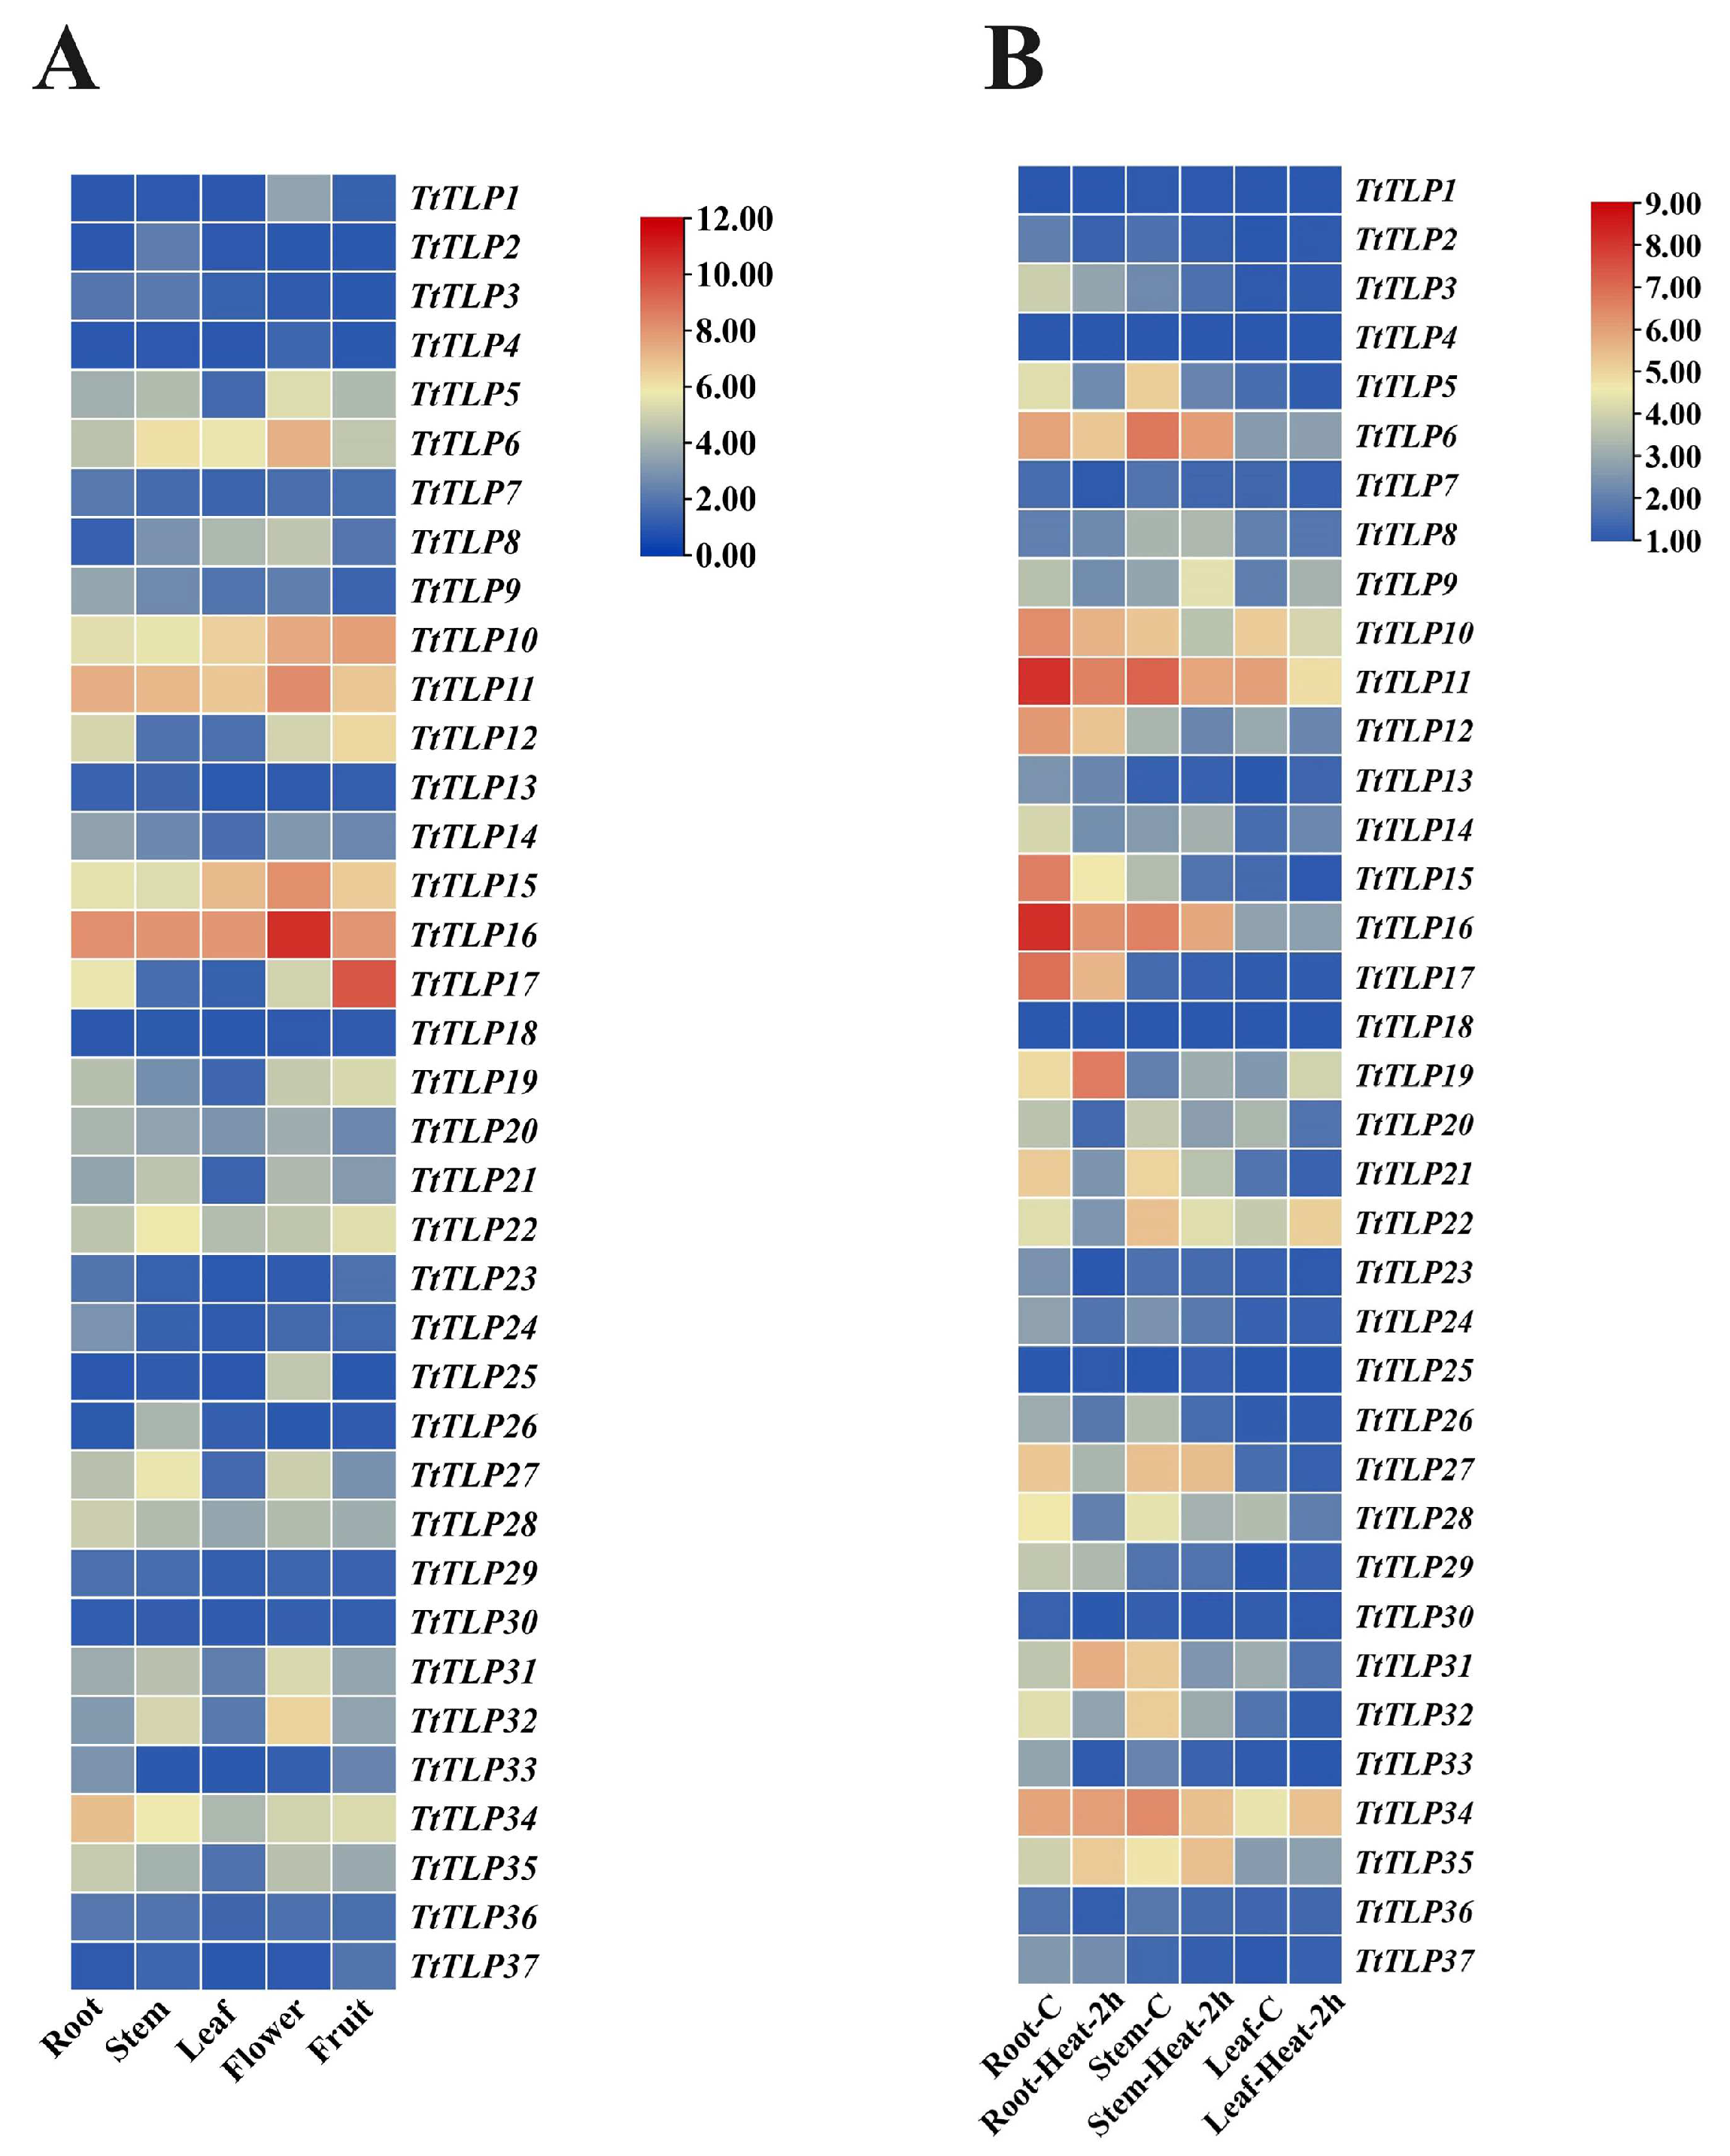
2.6. Expression Profiles of TtTLPs in Different Tissues and Plants in Response to Stress

Tissue-specific expression profiles of TtTLPs were analyzed using RNA-seq in the roots, stems, leaves, flower buds, and young fruit of T. tetragonoides plants (Figure 6A). Overall, several TtTLPs, including TtTLP6, TtTLP10, TtTLP11, TtTLP15, TtTLP16, TtTLP22, and TtTLP34, exhibited relatively high expression patterns in all five tested organs. TtTLP6, TtTLP11, TtTLP15, and TtTLP16 presented the highest expression levels in flowers, while TtTLP10 and TtTLP17 were highest in the young fruit of T. tetragonoides. Compared with vegetative organs (roots, stems, and leaves), TtTLPs often showed relatively higher expression levels in generative organs (flower buds and young fruit).
We also performed gene expression analysis in different tissues of T. tetragonoides seedlings under various stress challenges, including heat (45 °C) (Figure 6B), salt (600 mM NaCl), alkalinity (150 mM NaHCO3, pH 8.2), and high osmotic stress (simulated drought with 300 mM mannitol) (Figure 7), mainly based on the natural habitat of T. tetragonoides. Heat stress for T. tetragonoides plants only continued for 2 h because longer treatment (45 °C for 2 d) led to obvious wilting. Overall, short-term heat stress (45 °C for 2 h) down-regulated the expression of some TtTLPs in all three tissues, and only TtTLP19 and TtTLP35 were induced by heat stress (Figure 6B). In the T. tetragonoides root samples (Figure 7A), long-term alkalinity stress caused extreme suppression of the expression of all TtTLPs, which might be caused by the strong toxic effect of the 150 mM NaHCO3 liquid in which roots were submerged. Except for this, high salt stress for 2 h and 2 d, alkalinity stress for 2 h, and high osmotic stress for 2 h and 2 d also changed the expression of some TtTLPs in stem and leaf samples (Figure 7B,C). Of interest, the expression of TtTLP19, TtTLP31, and TtTLP35 was induced by these challenges, suggesting the possible protective roles of these osmotin proteins in T. tetragonoides roots.
In addition to in silico analysis, the expression profiles of stress-responsive TtTLPs were validated by quantitative reverse transcription PCR (qRT-PCR) (Figure 8 and Figure 9). First, the transcripts of six TtTLPs were tested under a heat challenge. Overall, TtTLP19 expression was strongly induced by heat stress. In leaf samples, the expression of TtTLP10 and TtTLP12 was also induced, while the expression of TtTLP6, TtTLP11, and TtTLP22 was decreased slightly by heat stress (Figure 8).
Quantitative RT-PCR analysis was performed for six TtTLPs (or TtTLP gene pairs) using gene-specific primers at similar salt, alkalinity, and high osmotic stress treatments to validate the expression profile (Figure 9). Overall, the results agreed with the expression observed using RNA-seq data, with a few exceptions. In the case of these challenges, high alkalinity appeared to be the strongest inducing factor for the expression of specific TtTLPs, especially in stem and leaf samples. High salinity and osmotic stress also caused the increased expression of some TtTLPs; their expression was mainly focused on the aboveground parts, including stem and leaf samples.

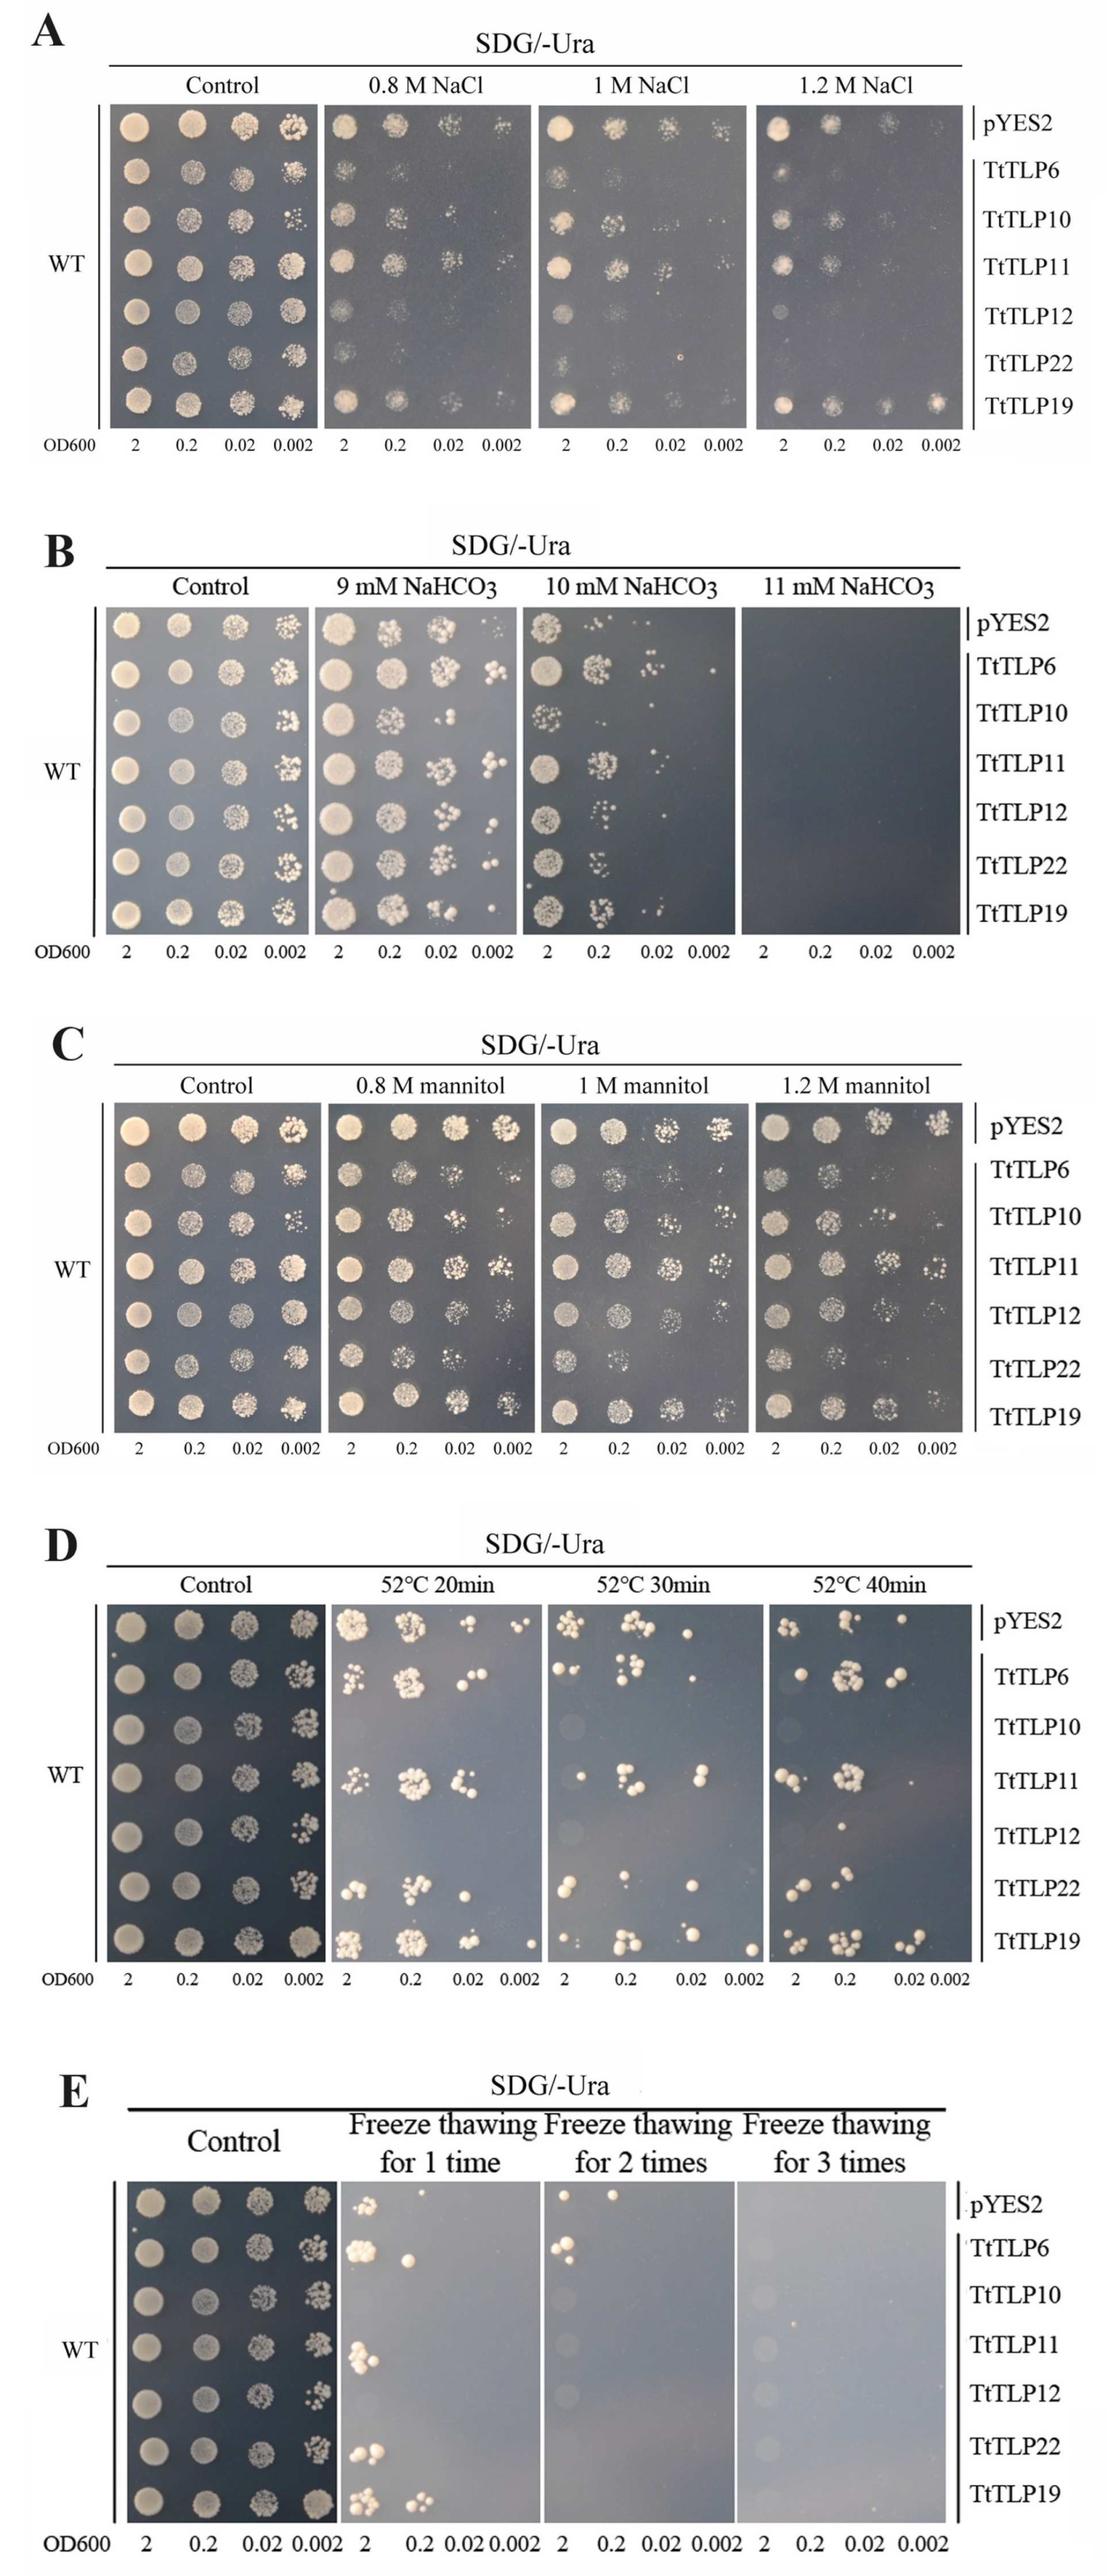
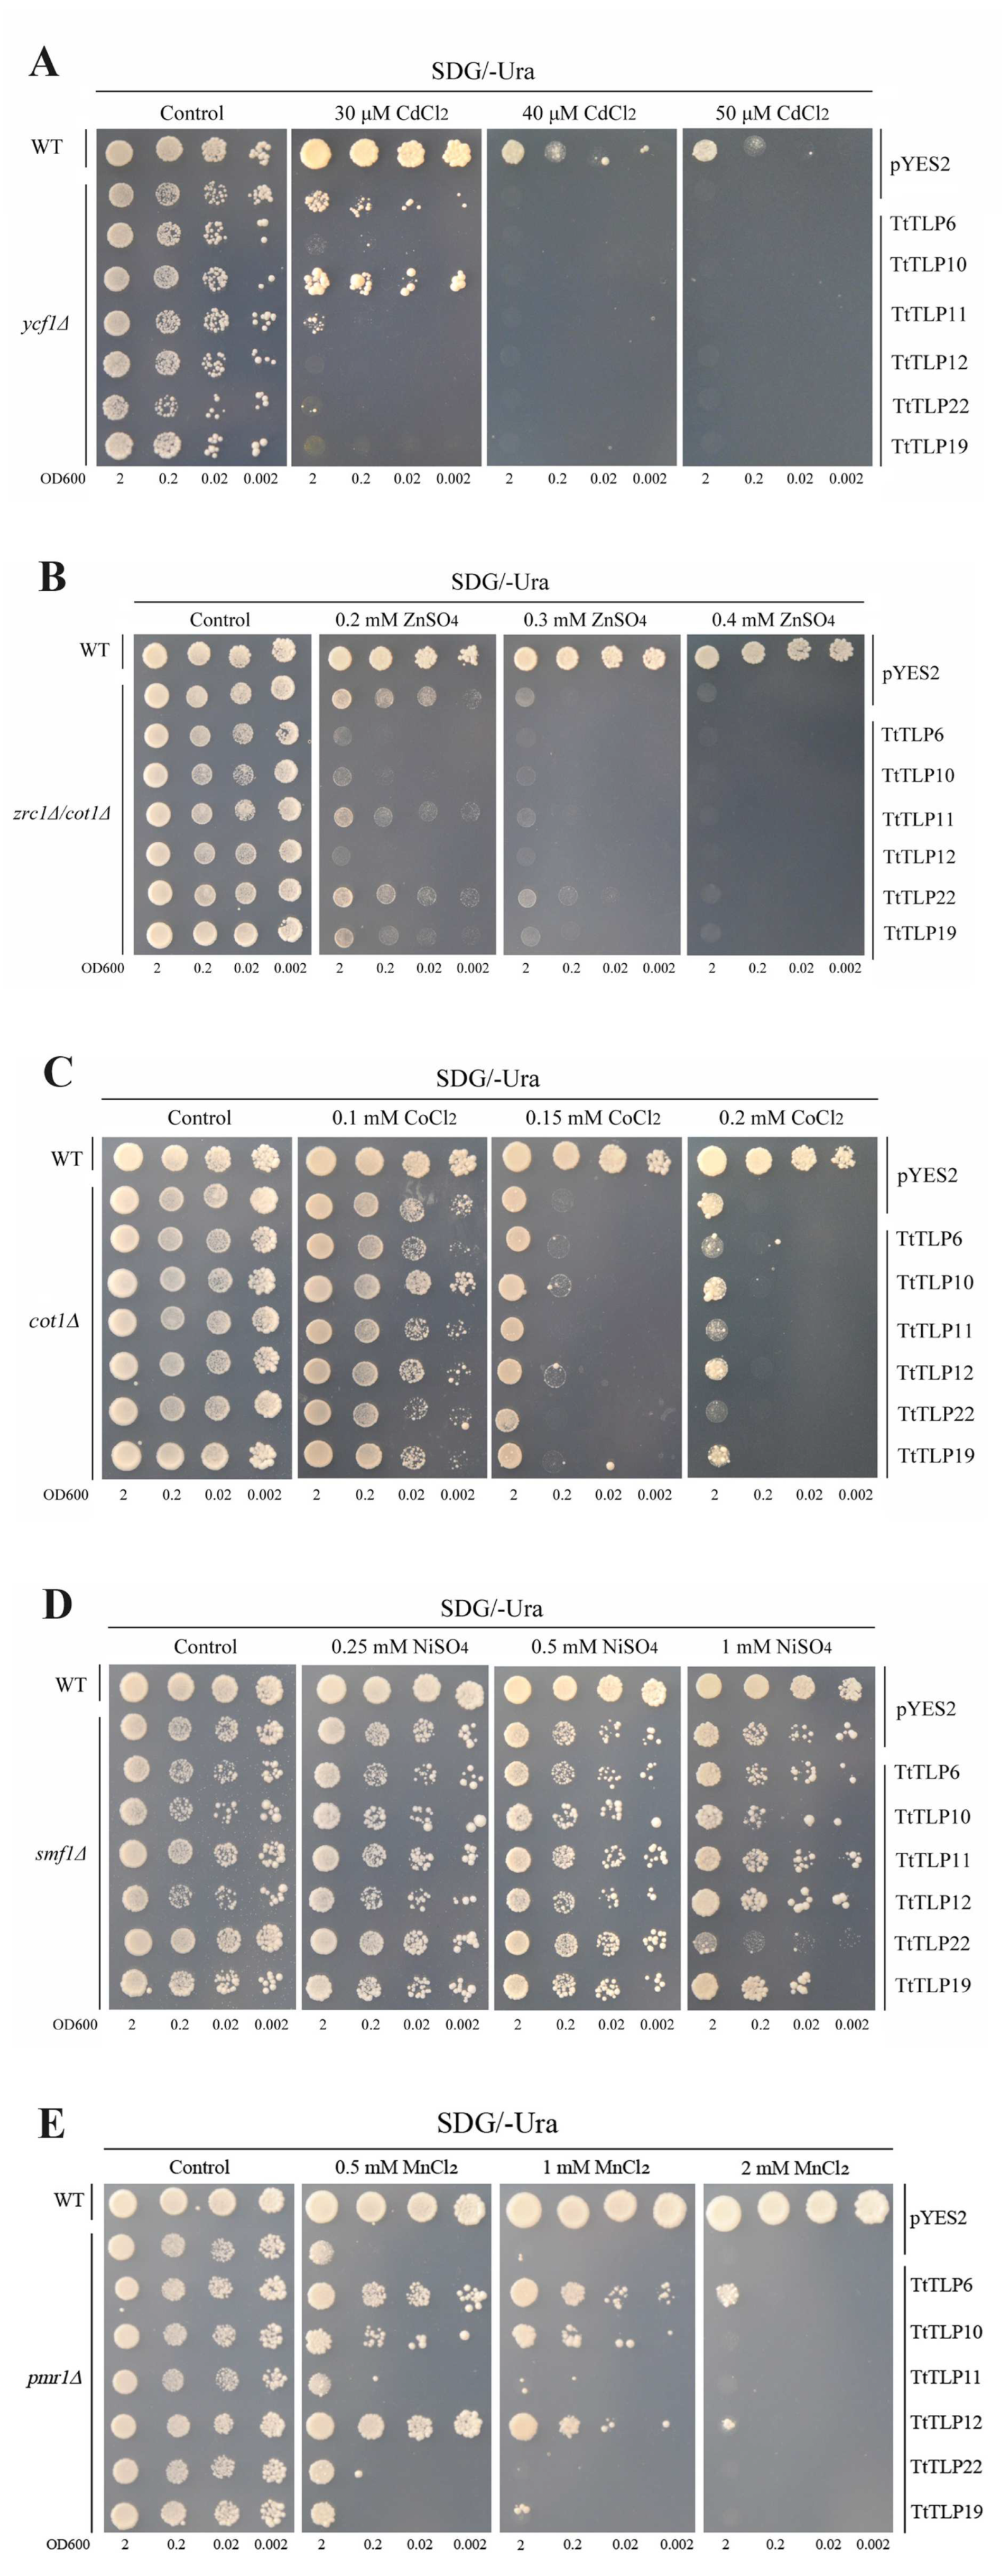
2.7. Abiotic Stress Tolerance of Yeast-Heterologous-Expressing TtTLPs

We performed functional identification of several candidate TtTLPs using the yeast heterologous expression system. In brief, we mainly chose the candidate TtTLPs according to their expression patterns, and those gene members with obviously regulated expression changes due to development or stress were expected to play crucial roles in vivo. According to this principle, along with the sequence alignment of TtTLPs, six TtTLPs, namely TtTLP6, TtTLP10, TtTLP11, TtTLP12, TtTLP19, and TtTLP22, were cloned and inserted into pYES2. The genes TtTLP8, TtTLP15, TtTLP16, TtTLP17, and TtTLP34 showed a high degree of homology with TtTLP6, TtTLP10, TtTLP11, TtTLP12, and TtTLP22, respectively, which generated degenerate primer pairs for gene cloning and the qRT-PCR assay. Here, we only showed the functional identification of the former (TtTLP6, TtTLP10, TtTLP11, TtTLP12, TtTLP19, and TtTLP22).
Plant TLPs are important proteins involved in multiple stress resistance in plants [8,10]. Therefore, we identified the salinity, alkalinity, high osmotic stress, heat, and freeze tolerance of transgenic yeast overexpressing different TtTLPs (Figure 10). The six expression vectors in TtTLPs-pYES2 and empty vector pYES2 (as control) were transformed into wild-type (WT) yeast, and the stress tolerance tests were performed with yeast spot assays under different challenges. Half of the tested TtTLPs (TtTLP6, TtTLP12, and TtTLP22) exhibited obvious sensitivity to salinity at low (0.8 M), moderate (1 M), and high (1.2 M) NaCl levels. TtTLP10 and TtTLP21 overexpression in yeast did not appear to impact salt tolerance, while only TtTLP19 presented slightly elevated NaCl tolerance (Figure 10A). As for alkalinity tolerance, only TtTLP6, TtTLP11, and TtTLP19 showed slightly elevated NaHCO3 tolerance, and TtTLP10 seemed to be sensitive to NaHCO3 (Figure 10B). Similarly, for high osmotic stress caused by mannitol, the expression of TtTLP6, TtTLP10, TtTLP12, and TtTLP22 in yeast showed more visible sensitivity than salt stress, while TtTLP11 and TtTLP19 did not seem to change the high osmotic tolerance of yeast, even under 1.2 M mannitol stress (Figure 10C). For the heat challenge, TtTLP10 and TtTLP12 caused sensitivities after 52 °C treatment (Figure 10D), and the freeze–thawing test also demonstrated that TtTLP10 and TtTLP12 might cause sensitivities to cold stress (Figure 10E).
Plant TLPs are secretory proteins in plant cells that are synthesized as precursors with an N-terminal signal peptide that mediates transport across the endoplasmic reticulum membrane and is then transported to other organelles or extracellularly [30,31]. Here, we hypothesized that the specific localization pattern of different TtTLPs controlling the osmotic pressure change in the different zones in yeast cells had a specific effect on stress tolerance. We also checked the H2O2 tolerance with H2O2-sensitive mutants skn7∆ and yap1∆ (Figure 11). Different TtTLPs also presented entirely different changes for H2O2 tolerance. TtTLP6 and TtTLP11 improved the H2O2 tolerance, while TtTLP10 caused H2O2 sensitivity in yeast (Figure 11A). In yap1∆ yeast, TtTLP10 and TtTLP12 hardly influenced the H2O2 tolerance, while TtTLP6, TtTLP11, TtTLP19, and TtTLP22 slightly improved it (Figure 11B).
Plant TLPs have also been speculated to play important roles in heavy metal (HM) detoxification since they encode cysteine-rich proteins [32], and some research has demonstrated that TLP expression is induced by HMs, including cadmium [32] and lead [33]. Here, we also checked the metal detoxification abilities of TtTLPs with yeast heterologous expression systems. Expression vectors TtTLPs-pYES2 and pYES2 were transformed into different yeast strains, including WT and several mutants (ycf1∆, zrc1∆cot1∆, cot1∆, smf1∆, and pmr1∆). As shown in Figure 12A, only TtTLP10 presented slight increases in the Cd tolerance of the Cd-sensitive mutant strain ycf1∆ on SDG plates with a low Cd concentration (30 μM), and under moderate (40 μM) or high (50 μM) Cd concentrations, none of the TtTLPs improved the Cd tolerance of this yeast mutant strain. The other five TtTLPs, namely TtTLP6, TtTLP11, TtTLP12, TtTLP19, and TtTLP22, significantly increased the Cd sensitivity of ycf1∆. Zn tolerance was also detected in double mutant zrc1∆cot1∆, and only TtTLP22 slightly increased the Zn tolerance under a moderate concentration (0.3 mM). Under low Zn challenge (0.2 mM), TtTLP6, TtTLP10, TtTLP19, and TtTLP22 all caused Zn sensitivity in zrc1∆cot1∆ (Figure 12B). Similarly, TtTLP6, TtTLP11, and TtTLP22 generated a slight Co sensitivity in cot1∆ (Figure 12C). Under the Ni challenge, our results showed that only TtTLP22 elevated Ni sensitivity at high concentrations (1 mM). Under low (0.25 mM) or moderate (0.5 mM) Ni challenges, none of the TtTLPs changed the Ni tolerance or sensitivity (Figure 12D). For Mn tolerance, the different TtTLPs presented diverse phenotypes. TtTLP6, TtTLP10, and TtTLP12 significantly increased the Mn tolerance of yeast, while TtTLP11, TtTLP19, and TtTLP22 did not affect Mn tolerance (Figure 12E). Metal tolerance mediated by TtTLPs had member-specific characteristics. Given the limitations of the yeast expression system, the relative conclusions in plant cells need further confirmation through transgenic assays in plants.

3. Discussion

As an excellent and popular medicinal and edible vegetable resource, T. tetragonoides can also be used for the restoration of the ecological environment in some tropical coastal regions and coral islands in the landscape [34,35]. Due to the harsh natural habitats of T. tetragonoides plants, this species can be planted in tropical coastal areas, replacing traditional crops and vegetables, and helping meet the basic needs of people, thereby becoming a important plant resource with irreplaceable economic values. To cope with these unfavorable environmental conditions, T. tetragonoides adopted various resistance strategies using morphological and physiological mechanisms. For example, T. tetragonoides is an inward secretohalophyte and can store excess salinity in the salt gland or salt bladder, which is widely distributed in the epidermal cells of T. tetragonoides leaves and stems. This salt isolation strategy is also an efficient mechanism for dealing with hypersaline and hypertonic environments [36,37]. Coupled with the specialization of vegetative morphology, the intrinsic molecular mechanism of T. tetragonoides plants for habitat adaptation impacts the genome, especially functional genes. Therefore, it is quite necessary to understand the mechanisms by which T. tetragonoides has adapted to extreme environmental abiotic stress, including drought, high salinity–alkalinity, and high temperature stress, to complete its life cycle.
Plant TLPs, also called osmotins, belong to the cysteine-rich proteins (CRPs). Similar to other plant CRPs, such as thionins and lipid transfer proteins (LTPs) [38], TLPs are classified as pathogenesis-related protein family 5 (PR-5) due to their induced expression and are involved in defense systems against various biotic stressors [39]. The main characteristic of TLPs is their thaumatin_2 domains with 16 conserved cysteine (Cys) residues, which form eight intra-molecular disulfide bonds and are involved in providing stability to the proteins under extreme pH and temperature ranges [20]. Previous studies have indicated that plant TLPs are also involved in the regulation of abiotic stress, such as drought [15,40], salt [10,17], and temperature challenges [17,18,41]. Here, considering the native habitats of T. tetragonoides causing constant osmotic pressure on this species, we selected the TtTLP family to research the ecological adaptability of T. tetragonoides, mainly concerning extreme drought and high salinity/alkalinity.
Although there have been some relevant studies on the TLP gene families in many plants [8,18,19,20,21,22,23,24,25,26], further research on the specific functions of these genes is still needed, especially in special habitat plants, such as halophytes or other special habitat plant species [42,43]. Related transgenic research on the TLPs of wild plant origins has provided valuable information to improve abiotic stress tolerance in rice [14], tobacco [18], Arabidopsis [7,19], and other plants [13]. In this study, 37 TtTLP genes were identified from the whole-genome sequence of T. tetragonoides. The genomic DNA and deduced protein sequences of TtTLPs were compared with each other and with their homologous genes in Arabidopsis and rice, establishing inter-genomic and intragenic phylogenetic trees (Figure 2 and Figure 4). Detailed analyses were also performed to identify gene chromosomal locations (Figure 1), gene structures (Figure 3), and cis-acting elements in promoter regions (Figure 5). Primary sequences, physiochemical properties, subcellular localization, transmembrane domains, and motifs of the proteins were also summarized (Table 1). Our results provide insight into the TtTLP genes involved in plant abiotic stress processes and provide genetic resources for further transgenic improvement in crops and other economic plants.
Gene duplication is considered a main driving force of genome evolution, and segmental and tandem duplication are regarded as two main driving forces for gene family expansion in plants. In this study, duplication event analyses were carried out to understand their roles in the evolution and expansion of the TtTLP gene family (Figure 2 and Figure 4, Table S2). According to the phylogenetic tree, most of the TtTLP members existed in pairs, except TtTLP18, TtTLP19, TtTLP24, TtTLP31, and TtTLP35, which were distinctly different from those in Arabidopsis and rice TLP families (Figure 4). This further suggests that duplications of TtTLPs are a major factor contributing to species distributional specificity.
The biological functions of genes are mainly shown as regulatory expression patterns under different promoters, which can be bound directly or indirectly by specific regulatory factors, mainly TFs, such as WRKY, MYB, MYC, HSF, and NAC. The CEs existing in gene promoter regions play crucial roles in controlling their expression patterns. The TtTLP promoter sequences were systematically analyzed, and specific CEs were summarized (Figure 5). The abiotic stress-related CEs extensively existed in the TtTLP promoters, including anaerobic-responsive elements, as-1 (oxidative stress-responsive), HSE (heat-responsive), LTRE (low temperature-responsive), MYB (MYB-binding site), and MYC (MYC-binding site). Biotic stress-related CEs (TC-rich repeat, MeJA-responsive element, salicylic acid-responsive element) are also relatively common. Other hormone-related CEs, such as gibberellin-responsive elements, auxin-responsive elements, ABRE (ABA-responsive elements), and ERE (ethylene-responsive elements), were also widespread. This could also be considered an adaptation mechanism to stress conditions in T. tetragonoides in vivo, mediated by the TtTLP family.
Low-molecular-weight TLPs have been identified in different plants [18,19,20,21,22,23,24,25,26], and many functional studies have shown their crucial roles in regulating plant growth, development, and defense against pathogens [8,9]. However, the roles and detailed regulation mechanisms of the plant TLP family under abiotic stress remain unclear. The heterogeneous overexpression of plant TLPs has been performed in many species [7,12,13,14,15,16,17,18], resulting in elevated tolerance to salt, drought, and other challenges and even sensitivities to abiotic stressors [19]. In the present study, we adopted a galactose-induced yeast system to verify the tolerance caused by the expression of specific TtTLPs, which is convenient for gene functional identification in vivo in the short term. In single-cell yeast, tolerance to stress, including salt, alkalinity, high osmotic pressure, heat, freezing, and oxidative stress, was significantly reduced or slightly improved by TtTLPs (Figure 10 and Figure 11). We suspect that this may be related to the subcellular localization of specific TtTLPs in yeast. If these TtTLPs all belonged to secretory proteins and most of them were located around the cell, the changes in osmotic pressures caused by the surrounding TtTLPs would affect the relative growth activities of yeast cells by changing the hydraulic potential, thereby inhibiting the growth of yeast cells. This is quite different from the phenotype of plant-overexpressing TLPs, most of which showed elevated tolerance to high salinity or drought [12,13,14,15,16,17]. This can be attributed to the fact that plants are multicellular organisms, and the overexpression of specific TLPs causes the wide distribution of TLPs in vivo, thereby changing the abilities of the whole plant to respond to stress challenges.
Plant TLPs are cysteine-rich proteins, and they might be involved in HM detoxification [32]. Here, we checked the HM tolerance of yeast caused by the expression of specific TtTLPs (Figure 12), and the tolerance to specific metals was member-specific. This may occur because of the specific subcellular localization of TtTLPs in yeast. Further combining the features of different yeast mutant strains, including the deletion of specific metal chelation or transportation proteins, such as yeast ycf1, which is an ATP binding cassette (ABC) transporter [44] and yeast pmr1, a Golgi-localized Mn2+ transporter [45], showed specificity in the tolerance to different metals in different mutant strains.
Tetragonia tetragonioides is native to tropical and subtropical coral regions and shows strong adaptability to high salinity/alkalinity, seasonal drought, heat, and other extreme circumstances. Our study presents possible genetic resources for stress tolerance in this species, the TtTLP family. The related plant transgenic assay will further demonstrate the detailed functions of TtTLPs to be used as candidate genes for crop genetic improvement. These findings suggest that TtTLPs undertake abiotic stress tolerance biological functions and play pivotal roles for the ecological adaptability of T. tetragonoides.

4. Materials and Methods

4.1. Plant Materials and Stress Treatments

Tetragonia tetragonoides seeds and plants were collected from the coastal areas of Guangdong and Fujian provinces in China and then cultivated in the South China National Botanical Garden (SCNBG) by Shuguang Jian (JS) and Mei Zhang (ZM). Tetragonia tetragonoides seeds were germinated in wet vermiculite, and seedlings were grown at 26 °C under a 16/8 h regular dark/light cycle with 50–60% humidity. The tissue-specific transcriptional patterns of TtTLPs were analyzed with roots, stems, leaves, flowers, and fruit organs gathered from adult T. tetragonoides plants. The expression patterns of TtTLPs under various stress challenges were further detected with roots, stems, and leaves collected from 60 d-old T. tetragonoides seedlings. For different stress challenges for seedlings, the young T. tetragonoides plants were exposed to different stress conditions, including heat (45 °C), high osmotic stress (300 mM mannitol), high salt stress (600 mM NaCl), and high alkalinity stress (150 mM NaHCO3, pH 8.2). In brief, for the heat treatment, T. tetragonoides seedlings were moved to a 45 °C illumination incubator for 2 h. For the other three stress challenges, the T. tetragonoides seedlings were removed from their vermiculite pots, carefully washed with water to remove matrix from the roots, and transferred to challenge solutions with the roots being submerged. The roots, stems, and young leaves from the T. tetragonoides seedling were collected 2 and 48 h after stress treatments, with the unchallenged T. tetragonoides seedlings’ tissues (0) used as a control. All samples were immediately frozen in liquid nitrogen after picking and stored at −80 °C for further experiments. Three independent biological replicates were used. The RNA sequencing (RNA-seq) data from T. tetragonoides used for in silico expression analyses were generated under the same conditions.

4.2. Identification and Characterization of TtTLPs in T. tetragonoides

The T. tetragonoides genome was sequenced and submitted to the NCBI database (NCBI accession number: JBBMRK000000000, unreleased). All T. tetragonoides proteins were identified with InterProscan (https://www.ebi.ac.uk/interpro/search/sequence/, accessed on 20 November 2023), and the conserved domains and motifs (e < 1 × 10⁻⁵) were assessed. To characterize the TtTLP family members, the conserved TLP domain (pfam No. PF00314, PROSITE profile No. PS51367, or InterPro No. IPR001938) was searched as a model, and the protein sequences containing this domain were screened using HMM3.0 software. The domains were also confirmed using the NCBI CDD program (https://www.ncbi.nlm.nih.gov/cdd/, accessed on 20 November 2023). The T. tetragonoides proteins with the TLP domain and corresponding genes were eventually identified as the TtTLP family.

4.3. Multiple Sequence Alignment and Phylogenetic Analysis of TLP Proteins

Multiple sequence alignments of candidate plant TLPs, including the 37 TtTLPs from T. tetragonoides, 27 AtTLPs from Arabidopsis thaliana, and 31 OsTLPs from rice (Oryza sativa) [23], were performed with 1000 bootstrap replicates using MEGA X software (Version 10.2, https://www.megasoftware.net/, accessed on 20 November 2023) with ClustalW. The A. thaliana TLP sequences were obtained from the Arabidopsis Information Resource (TAIR, http://www.arabidopsis.org, accessed on 20 November 2023), and the O. sativa TLPs were obtained from the Rice Genome Annotation Project (RGAP, http://rice.plantbiology.msu.edu/index.shtml, accessed on 20 November 2023) database. The phylogenetic tree was constructed using the neighbor-joining (NJ) method with TtTLPs, AtTLPs, and OsTLPs. The obtained TLP nucleotide and protein sequences from these three species are listed in Table S1.

4.4. Bioinformatic Analysis of T. tetragonoides TLP Genes

The TtTLP genes’ exon–intron structures were determined based on alignments of the coding regions and full-length sequences with the online program Gene Structure Display Server 2.0 (https://gsds.gao-lab.org/Gsds_about.php, accessed on 20 November 2023). The bioinformatics tools WoLF_PSORT (https://www.genscript.com/wolf-psort.html, accessed on 20 November 2023) and Plant-mPLoc (http://www.csbio.sjtu.edu.cn/bioinf/plant-multi, accessed on 20 November 2023) were used to predict the subcellular localization of each TtTLP. The TtTLP motifs were predicted using MEME (http://meme-suite.org/index.html, accessed on 20 November 2023), with a maximum number of motifs of 10 and an optimum motif width of 20–50 residues. The identified TtTLP sequences were used to calculate the molecular weight (MW) and isoelectric point (pI) of the proteins using Expasy (https://web.expasy.org/protparam/, accessed on 20 November 2023). The 3D structures of the TtTLPs were analyzed using the Phyre2 program (http://www.sbg.bio.ic.ac.uk/phyre2/html/page.cgi?id=index, accessed on 20 November 2023).

4.5. Promoter Sequence Profiling of TtTLPs

Putative TtTLP promoter regions (2000 bp upstream of ATG) were retrieved from the T. tetragonoides genome database (Table S1) and uploaded to the PlantCARE database (http://bioinformatics.psb.ugent.be/webtools/plantcare/html/, accessed on 1 March 2024) for cis-acting element (CE) analysis. The CEs were classified as either hormone-specific (gibberellin-responsive elements, MeJA-responsive elements, auxin-responsive elements, salicylic acid-responsive elements, EREs, and ABREs) or abiotic stress-responsive (light responsive elements, MYCs, MYBs, MBSs, TC-rich repeats, and LTREs). The CEs are summarized in Table S2. Several selected TtTLP promoters were visualized using TBtools [46].

4.6. Expression Profiling of TtTLPs in Different Organs or Under Specific Challenges

A transcriptome database was constructed for T. tetragonoides using Illumina HiSeq X sequencing technology. The quality of the RNA-seq datasets created from five tissues (roots, stems, young leaves, flowers, and young seeds collected from T. tetragonoides growing in the SCNBG) was examined using FastQC (http://www.bioinformatics.babraham.ac.uk/projects/fastqc/, accessed on 1 March 2024), which produced 40 Gb of clean reads. Clean reads were mapped to the T. tetragonoides reference genome using Tophat v.2.0.10 (http://tophat.cbcb.umd.edu/, accessed on 1 March 2024). The fragments per kilobase of transcript per million mapped reads (FPKM) values were used to calculate the gene expression levels according to the length of the gene and the read counts mapped to the gene: FPKM = total exon fragments/[mapped reads (millions) × exon length (kb)]. The expression levels [log2 (FPKM + 1)] of TtTLPs were visualized as heatmaps using TBtools. The FPKM values for all samples are listed in Table S3.
The qRT-PCR was also performed to detect the transcript abundance of several TtTLP transcripts. In brief, the total RNAs were isolated from different T. tetragonoides seedling tissues after specific stress treatments and reverse transcribed to cDNA; the untreated T. tetragonoides seedling tissues were used as controls. The total RNA samples were extracted using an EasyPure® Plant RNA Kit (TransGen Biotech, Beijing, China). The RNAs were quantified using a NanoDrop1000 (NanoDrop Technologies, Inc., Wilmington, DE, USA) spectrophotometer, and their integrity was checked on a 0.8% agarose gel. After that, the cDNAs were synthesized using the cDNA Synthesis SuperMix kit (TransGen Biotech, Beijing, China) following the manufacturer’s instructions. Quantitative RT-PCR was conducted with the LightCycler480 system (Roche, Basel, Switzerland) and the TransStart Tip Green qPCR SuperMix (TransGen Biotech, Beijing, China). All TtTLP genes’ expression data obtained via qRT-PCR were normalized to the reference gene TtACT’s expression (NCBI accession No.: MH33308). The primers used for qRT-PCR (TtACTRTF/TtACTRTR as the reference gene and other TtTLP-specific primer pairs) were listed in Table S1.

4.7. In Vivo Stress Tolerance Assay for TtTLP Overexpression in Yeast

Several TtTLPs were PCR cloned with a cDNA sample of T. tetragonoides as a template. In brief, the open reading frames (ORFs) of candidate TtTLPs were PCR amplified with gene-specific primer pairs (Table S2). The PCR fragments were purified and then inserted into the BamHI and EcoRI sites of the yeast expression vector pYES2 to yield recombinant plasmids of TtTLPs-pYES2 and sequenced. The different yeast strains were used in this study, including wild-type (WT) Saccharomyces cerevisiae (BY47471; MATa; his3Δ1; leu2Δ0; met15Δ0; ura3Δ0), heavy metal (HM)-sensitive mutant strains cot1Δ, smf1Δ, ycf1Δ, pmr1Δ, double-mutant strain zrc1Δ/cot1Δ (BY4741; MATa; his3∆1; leu2∆0; met15∆0; ura3∆0; zrc1::natMX; cot1::kanMX4), and H2O2-sensitive mutant strains skn7Δ and yap1Δ. The WT (Y00000) and cot1Δ (Y01613), smf1Δ (Y06272), ycf1Δ (Y04069), pmr1Δ (Y04534), skn7Δ (Y02900), and yap1Δ (Y00549) were all obtained from Euroscarf (http://www.euroscarf.de/index.php?name=News, accessed on 1 June 2022). The double-mutant strain zrc1Δ/cot1Δ was obtained from Yuan’s lab [47]. The standard polyethylene glycol (PEG)-lithium acetate-based transformation procedure was used for yeast plasmid transformation with amino acid defect screening. The yeast spot assays for NaCl, NaHCO3, mannitol, and HM tolerance were performed as previously described [48]. For the heat or freeze tolerance tests of yeast strains, the yeast cultures with different specific OD600 values were placed on a thermostat (52 °C) for 20, 30, and 40 min for heat challenges. The yeast cultures were quickly frozen in liquid nitrogen and slowly thawed at room temperature, and this operation was repeated one, two, or three times to test the freezing tolerance.

4.8. Statistical Analysis

All experiments in this study were repeated independently three times, and the results are shown as the mean ± standard deviation (SD) (n ≥ 3). Pairwise differences between means were analyzed using a Student’s t-test in Microsoft Excel 2010.

5. Conclusions

In the present study, 37 TtTLP genes were identified in the T. tetragonoides genome. The TtTLP family members were responsive to multiple stressors. Several TtTLPs were cloned and functionally identified using the yeast heterogeneous expression system, followed by testing for salt tolerance and osmotic adjustment in cells, as well as detoxification of several heavy metals. Overall, the results highlighted the roles of TtTLPs in the ecological adaptability of T. tetragonoides to tropical coastal regions. Our results also suggested TtTLPs as useful candidates for providing multiple stress tolerances in crops.

Supplementary Materials

The following are available online at https://www.mdpi.com/article/10.3390/plants13172355/s1, Figure S1: The pfam domain diagrams of 37 TtTLPs identified on the InterPro website (http://pfam.xfam.org/, accessed on 20 November 2023), Table S1: Primer lists and TtTLP sequence information used in this study, Table S2: TtTLP family duplication patterns and Ka and Ks values, Table S3: Cis-acting elements (CEs) identified in the promoter regions and sequence information of all TtTLPs, and Table S4: FPKM values of TtTLPs for the RNA-seq assay of Tetragonia tetragonoides tissues.

Author Contributions

Conceptualization, M.Z. and S.J.; methodology, M.Z.; software, Z.W.; validation, Z.H.; formal analysis, M.Z. and Z.W.; investigation, M.Z. and S.J.; resources, M.Z. and S.J.; data curation, Z.H. and Q.D.; writing—original draft preparation, Z.H. and M.Z.; writing—review and editing, M.Z.; visualization, Z.H. and Q.D.; supervision, M.Z.; project administration, S.J.; funding acquisition, M.Z. and S.J. All authors have read and agreed to the published version of the manuscript.

Funding

This research was funded by the National Key R&D Program of China (2022YFC3103700), the Guangdong Science and Technology Program (2024B1212050007), and the Project for Guangdong Provincial Key Laboratory of Applied Botany, South China Botanical Garden (2023B1212060046). The funders had no roles in the study design, data collection and analysis, decision to publish, or preparation of the manuscript.

Data Availability Statement

Data are contained within the article.

Conflicts of Interest

The authors declare no conflicts of interest.

Abbreviations

TLPThaumatin-like protein
TFTranscription factors
PR-5Pathogenesis-related protein family 5
kDaKiloDalton
CysCysteine
UBQUbiquitin
MeJAMethyl jasmonate
ROSReactive oxygen species
WGDWhole-genome duplication
ABAAbscisic acid
TDTandem duplication
PDProximal duplication
TRDTransposed duplication
DDDispersed duplication
aaAmino acid
MWMolecular weight
pIIsoelectric point
IIInstability index
AIAliphatic index
GRAVYGrand average of hydropathicity
REDDDArginine, glutamic acid, and three aspartic acid residues
CECis-acting element
5′-UTR5′-untranslated region
ABRECE responsive to ABA
WTWild-type
HMHeavy metal
CRPCysteine-rich protein
LTPLipid transfer protein
ABCATP-binding cassette

References

  1. Lee, K.Y.; Kim, S.H.; Yang, W.K.; Lee, G.J. Effect of Tetragonia tetragonoides (Pall.) Kuntze extract on andropause symptoms. Nutrients 2022, 14, 4572. [Google Scholar] [CrossRef]
  2. Lee, M.A.; Choi, H.J.; Kang, J.S.; Choi, Y.H.; Joo, W.H. Antioxidant activities of the solvent extracts from Tetragonia tetragonioides. J. Life Sci. 2008, 18, 220–227. [Google Scholar] [CrossRef]
  3. Atzori, G.; Nissim, W.; Macchiavelli, T.; Vita, F.; Azzarello, E.; Pandolfi, C.; Masi, E.; Mancuso, S. Tetragonia tetragonioides (Pallas) Kuntz. as promising salt-tolerant crop in a saline agricultural context. Agric. Water Manag. 2020, 240, 106261. [Google Scholar] [CrossRef]
  4. Rao, Y.; Peng, T.; Xue, S. Mechanisms of plant saline-alkaline tolerance. J. Plant Physiol. 2023, 281, 153916. [Google Scholar] [CrossRef]
  5. Deinlein, U.; Stephan, A.B.; Horie, T.; Luo, W.; Xu, G.; Schroeder, J.I. Plant salt-tolerance mechanisms. Trends Plant Sci. 2014, 19, 371–379. [Google Scholar] [CrossRef]
  6. Billah, M.; Li, F.; Yang, Z. Regulatory network of cotton genes in response to salt, drought and wilt diseases (Verticillium and Fusarium): Progress and perspective. Front. Plant Sci. 2021, 12, 759245. [Google Scholar] [CrossRef] [PubMed]
  7. Misra, R.C.; Sandeep; Kamthan, M.; Kumar, S.; Ghosh, S. A thaumatin-like protein of Ocimum basilicum confers tolerance to fungal pathogen and abiotic stress in transgenic Arabidopsis. Sci. Rep. 2016, 6, 25340. [Google Scholar] [CrossRef]
  8. de Jesús-Pires, C.; Ferreira-Neto, J.R.C.; Pacifico Bezerra-Neto, J.; Kido, E.A.; de Oliveira Silva, R.L.; Pandolfi, V.; Wanderley-Nogueira, A.C.; Binneck, E.; da Costa, A.F.; Pio-Ribeiro, G.; et al. Plant thaumatin-like proteins: Function, evolution and biotechnological applications. Curr. Protein Pept. Sci. 2020, 21, 36–51. [Google Scholar] [CrossRef]
  9. Bashir, M.A.; Silvestri, C.; Ahmad, T.; Hafiz, I.A.; Abbasi, N.A.; Manzoor, A.; Cristofori, V.; Rugini, E. Osmotin: A cationic protein leads to improve biotic and abiotic stress tolerance in plants. Plants 2020, 9, 992. [Google Scholar] [CrossRef] [PubMed]
  10. Wan, Q.; Hongbo, S.; Zhaolong, X.; Jia, L.; Dayong, Z.; Yihong, H. Salinity tolerance mechanism of osmotin and osmotin-like proteins: A promising candidate for enhancing plant salt tolerance. Curr. Genom. 2017, 18, 553–556. [Google Scholar] [CrossRef]
  11. Hakim; Ullah, A.; Hussain, A.; Shaban, M.; Khan, A.H.; Alariqi, M.; Gul, S.; Jun, Z.; Lin, S.; Li, J.; et al. Osmotin: A plant defense tool against biotic and abiotic stresses. Plant Physiol. Biochem. 2018, 123, 149–159. [Google Scholar] [CrossRef] [PubMed]
  12. Weber, R.L.; Wiebke-Strohm, B.; Bredemeier, C.; Margis-Pinheiro, M.; de Brito, G.G.; Rechenmacher, C.; Bertagnolli, P.F.; de Sá, M.E.; Campos Mde, A.; de Amorim, R.M.; et al. Expression of an osmotin-like protein from Solanum nigrum confers drought tolerance in transgenic soybean. BMC Plant Biol. 2014, 14, 343. [Google Scholar] [CrossRef] [PubMed]
  13. Chowdhury, S.; Basu, A.; Kundu, S. Overexpression of a new osmotin-like protein gene (SindOLP) confers tolerance against biotic and abiotic stresses in sesame. Front. Plant Sci. 2017, 8, 410. [Google Scholar] [CrossRef]
  14. Le, T.T.T.; Williams, B.; Mundree, S.G. An osmotin from the resurrection plant Tripogon loliiformis (TlOsm) confers tolerance to multiple abiotic stresses in transgenic rice. Physiol. Plant 2018, 162, 13–34. [Google Scholar] [CrossRef]
  15. Yan, J.; Ninkuu, V.; Fu, Z.; Yang, T.; Ren, J.; Li, G.; Yang, X.; Zeng, H. OsOLP1 contributes to drought tolerance in rice by regulating ABA biosynthesis and lignin accumulation. Front. Plant Sci. 2023, 14, 1163939. [Google Scholar] [CrossRef]
  16. Li, Z.; Wang, X.; Cui, Y.; Qiao, K.; Zhu, L.; Fan, S.; Ma, Q. Comprehensive genome-wide analysis of thaumatin-like gene family in four cotton species and functional identification of GhTLP19 involved in regulating tolerance to Verticillium dahlia and drought. Front. Plant Sci. 2020, 11, 575015. [Google Scholar] [CrossRef] [PubMed]
  17. Sharma, A.; Sharma, H.; Rajput, R.; Pandey, A.; Upadhyay, S.K. Molecular characterization revealed the role of thaumatin-like proteins of bread wheat in stress response. Front. Plant Sci. 2022, 12, 807448. [Google Scholar] [CrossRef] [PubMed]
  18. Liu, Q.; Sui, X.; Wang, Y.; Zhu, M.; Zhou, Y.; Gao, F. Genome-wide analyses of thaumatin-like protein family genes reveal the involvement in the response to low-temperature stress in Ammopiptanthus nanus. Int. J. Mol. Sci. 2023, 24, 2209. [Google Scholar] [CrossRef]
  19. Tong, Z.; Sun, Y.; Wang, D.; Wang, L.; Li, L.; Meng, X.; Feng, W.; Wurtele, E.S.; Wang, X. Identification and functional characterization of HbOsmotin from Hevea brasiliensis. Plant Physiol. Biochem. 2016, 109, 171–180. [Google Scholar] [CrossRef]
  20. Petre, B.; Major, I.; Rouhier, N.; Duplessis, S. Genome-wide analysis of eukaryote thaumatin-like proteins (TLPs) with an emphasis on poplar. BMC Plant Biol. 2011, 11, 33. [Google Scholar] [CrossRef] [PubMed]
  21. Yan, X.; Qiao, H.; Zhang, X.; Guo, C.; Wang, M.; Wang, Y.; Wang, X. Analysis of the grape (Vitis vinifera L.) thaumatin-like protein (TLP) gene family and demonstration that TLP29 contributes to disease resistance. Sci. Rep. 2017, 7, 4269. [Google Scholar] [CrossRef]
  22. Iqbal, I.; Tripathi, R.K.; Wilkins, O.; Singh, J. Thaumatin-like protein (TLP) gene family in barley: Genome-wide exploration and expression analysis during germination. Genes 2020, 11, 1080. [Google Scholar] [CrossRef]
  23. Liu, Y.; Cui, J.; Zhou, X.; Luan, Y.; Luan, F. Genome-wide identification, characterization and expression analysis of the TLP gene family in melon (Cucumis melo L.). Genomics 2020, 112, 2499–2509. [Google Scholar] [CrossRef] [PubMed]
  24. Zhang, Y.; Chen, W.; Sang, X.; Wang, T.; Gong, H.; Zhao, Y.; Zhao, P.; Wang, H. Genome-wide identification of the thaumatin-like protein family genes in Gossypium barbadense and analysis of their responses to Verticillium dahliae infection. Plants 2021, 10, 2647. [Google Scholar] [CrossRef] [PubMed]
  25. Zhang, Y.; Miao, L.; Yang, X.; Jiang, G. Genome-wide characterization and expression of the TLP gene family associated with Colletotrichum gloeosporioides inoculation in Fragaria × ananassa. PeerJ 2022, 10, e12979. [Google Scholar] [CrossRef]
  26. Anisimova, O.K.; Kochieva, E.Z.; Shchennikova, A.V.; Filyushin, M.A. Thaumatin-like protein (TLP) genes in garlic (Allium sativum L.): Genome-wide identification, characterization, and expression in response to Fusarium proliferatum infection. Plants 2022, 11, 748. [Google Scholar] [CrossRef] [PubMed]
  27. Faillace, G.R.; Turchetto-Zolet, A.C.; Guzman, F.L.; de Oliveira-Busatto, L.A.; Bodanese-Zanettini, M.H. Genome-wide analysis and evolution of plant thaumatin-like proteins: A focus on the origin and diversification of osmotins. Mol. Genet. Genom. 2019, 294, 1137–1157. [Google Scholar] [CrossRef]
  28. Hrmova, M.; Hussain, S.S. Plant transcription factors involved in drought and associated stresses. Int. J. Mol. Sci. 2021, 22, 5662. [Google Scholar] [CrossRef]
  29. Li, S.; Hu, Y.; Yang, H.; Tian, S.; Wei, D.; Tang, Q.; Yang, Y.; Wang, Z. The regulatory roles of MYC TFs in plant stamen development. Plant Sci. 2023, 333, 111734. [Google Scholar] [CrossRef]
  30. Abdin, M.Z.; Kiran, U.; Alam, A. Analysis of osmotin, a PR protein as metabolic modulator in plants. Bioinformation 2011, 5, 336–340. [Google Scholar] [CrossRef]
  31. Viktorova, J.; Krasny, L.; Kamlar, M.; Novakova, M.; Mackova, M.; Macek, T. Osmotin, a pathogenesis-related protein. Curr. Protein Pept. Sci. 2012, 13, 672–681. [Google Scholar] [CrossRef] [PubMed]
  32. Harada, E.; Kim, J.A.; Meyer, A.J.; Hell, R.; Clemens, S.; Choi, Y.E. Expression profiling of tobacco leaf trichomes identifies genes for biotic and abiotic stresses. Plant Cell Physiol. 2010, 51, 1627–1637. [Google Scholar] [CrossRef]
  33. Walliwalagedara, C.; Atkinson, I.; van Keulen, H.; Cutright, T.; Wei, R. Differential expression of proteins induced by lead in the Dwarf Sunflower Helianthus annuus. Phytochemistry 2010, 1, 1460–1465. [Google Scholar] [CrossRef] [PubMed]
  34. Wilson, C.; Lesch, S.M.; Grieve, C.M. Growth stage modulates salinity tolerance of New Zealand spinach (Tetragonia tetragonioides Pall.) and red orach (Atriplex hortensis L.). Ann. Bot. 2000, 85, 501–509. [Google Scholar] [CrossRef]
  35. Wang, L.; Wu, C.B.; Xu, W.F.; Guo, J.C.; Fu, S.P.; Liu, J.; Li, R.M.; Duan, R.J. Effect of seawater stress on growth, osmotic adjustment substances and cell membrane permeability of Tetragonia tetragonoides (In Chinese). Jiangsu Agric. Sci. 2016, 44, 248–251. [Google Scholar] [CrossRef]
  36. Zou, C.; Chen, A.; Xiao, L.; Muller, H.M.; Ache, P.; Haberer, G.; Zhang, M.; Jia, W.; Deng, P.; Huang, R.; et al. A high-quality genome assembly of quinoa provides insights into the molecular basis of salt bladder-based salinity tolerance and the exceptional nutritional value. Cell Res. 2017, 27, 1327–1340. [Google Scholar] [CrossRef] [PubMed]
  37. Shabala, S.; Bose, J.; Hedrich, R. Salt bladders: Do they matter? Trends Plant Sci. 2014, 19, 687–691. [Google Scholar] [CrossRef]
  38. Sels, J.; Mathys, J.; De Coninck, B.M.; Cammue, B.P.; De Bolle, M.F. Plant pathogenesis-related (PR) proteins: A focus on PR peptides. Plant Physiol. Biochem. 2008, 46, 941–950. [Google Scholar] [CrossRef]
  39. Liu, J.J.; Sturrock, R.; Ekramoddoullah, A.K. The superfamily of thaumatin-like proteins: Its origin, evolution, and expression towards biological function. Plant Cell Rep. 2010, 29, 419–436. [Google Scholar] [CrossRef]
  40. Zhao, Y.; Yang, X.; Zhang, J.; Huang, L.; Shi, Z.; Tian, Z.; Sha, A.; Lu, G. Thaumatin-like protein family genes VfTLP4-3 and VfTLP5 are critical for faba bean’s response to drought stress at the seedling stage. Plant Physiol. Biochem. 2024, 206, 108243. [Google Scholar] [CrossRef]
  41. Sharma, A.; Shumayla; Tyagi, S.; Alok, A.; Singh, K.; Upadhyay, S.K. Thaumatin-like protein kinases: Molecular characterization and transcriptional profiling in five cereal crops. Plant Sci. 2020, 290, 110317. [Google Scholar] [CrossRef]
  42. Wang, L.; Xu, Z.; Yin, W.; Xu, K.; Wang, S.; Shang, Q.; Sa, W.; Liang, J.; Wang, L. Genome-wide analysis of the thaumatin-like gene family in Qingke (Hordeum vulgare L. var. nudum) uncovers candidates involved in plant defense against biotic and abiotic stresses. Front. Plant Sci. 2022, 13, 912296. [Google Scholar] [CrossRef]
  43. Gu, Y.; Yu, H.; He, S.; Zhang, P.; Ma, X. Genome-wide identification and characterization of the TLP gene family in Phyllostachys edulis and association with Witches’ Broom disease resistance in bamboo. Int. J. Mol. Sci. 2023, 24, 10257. [Google Scholar] [CrossRef] [PubMed]
  44. Khandelwal, N.K.; Tomasiak, T.M. Structural basis for autoinhibition by the dephosphorylated regulatory domain of Ycf1. Nat. Commun. 2024, 15, 2389. [Google Scholar] [CrossRef] [PubMed]
  45. Qu, S.; Chi, S.D.; He, Z.M. The development of Aspergillus flavus and biosynthesis of aflatoxin B1 are regulated by the Golgi-localized Mn2+ transporter pmr1. J. Agric. Food Chem. 2024, 72, 1276–1291. [Google Scholar] [CrossRef]
  46. Chen, C.; Chen, H.; Zhang, Y.; Thomas, H.R.; Frank, M.H.; He, Y.; Xia, R. TBtools: An integrative toolkit developed for interactive analyses of big biological data. Mol. Plant 2020, 13, 1194–1202. [Google Scholar] [CrossRef]
  47. Zheng, S.; Dai, H.; Meng, Q.; Huang, R.; Tong, H.; Yuan, L. Identification and expression analysis of the ZRT, IRT-like protein (ZIP) gene family in Camellia sinensis (L.) O. Kuntze. Plant Physiol. Biochem. 2022, 172, 87–100. [Google Scholar] [CrossRef]
  48. Liu, H.; Ding, Q.; Cao, L.; Huang, Z.; Wang, Z.; Zhang, M.; Jian, S. Identification of the abscisic acid-, stress-, and ripening-induced (ASR) family involved in the adaptation of Tetragonia tetragonoides (Pall.) Kuntze to saline-alkaline and drought habitats. Int. J. Mol. Sci. 2023, 24, 15815. [Google Scholar] [CrossRef]
Figure 1. Locations of the 37 TtTLPs on 16 chromosomes in T. tetragonoides.
Plants 13 02355 g001
Figure 2. (A) Phylogenetic relationships of the 37 TtTLPs from T. tetragonoides. (B) The conserved motifs of each group of TtTLPs identified using the MEME web server. Different motifs are represented by different colored boxes, and the motif sequences are provided at the bottom.
Plants 13 02355 g002
Figure 3. Exon–intron organization of the TtTLP genes constructed using GSDS 2.0.
Plants 13 02355 g003
Figure 4. Phylogenetic relationships of the 37 TtTLPs from T. tetragonoides, 27 AtTLPs from Arabidopsis thaliana, and 30 OsTLPs from Oryza sativa. The amino acid sequences of these 94 TLPs from three plant species were compared with ClustalW alignment, and the phylogenetic tree was constructed in MEGA X using the neighbor-joining method, with 1000 bootstrap repetitions. The different branch colors represent different subgroups.
Plants 13 02355 g004
Figure 5. Statistics for predicted cis-acting elements in the TtTLP promoters (ATG_upstream 2000 bp). (A) Summaries of the 13 cis-acting elements in the promoter regions of 37 TtTLPs. The scale bar represents 200 bp. (B) Distribution of the 13 cis-acting elements in the 37 TtTLP promoter regions. The elements are represented by different symbols. Information on these elements is listed in Table S3.
Plants 13 02355 g005aPlants 13 02355 g005b
Figure 6. (A) Heatmaps showing the expression levels of the TtTLPs in the roots, stems, leaves, flower buds, and young fruit of T. tetragonoides plants. (B) Heatmaps showing the expression levels of the TtTLPs in T. tetragonoides seedlings under heat treatment (45 °C for 2 h). “-C” represents “control”. The RNA-seq data of the TtTLPs were listed in Table S4. The heat map was constructed from log2-transformed FPKM (+1) values, and normalized treatments were carried out based on rows. The RNA-seq data of the TtTLPs are listed in Table S4.
Plants 13 02355 g006
Figure 7. Heatmaps showing the expression levels of the TtTLPs under salt, alkalinity, and high osmotic treatment in T. tetragonoides seedling roots (A), stems (B), and leaves (C). “-C” “-2 h”, and “-2 d” each represent “control”, “stress treatment for two hours”, and “stress treatment for two days (48 h)”.The heat map was constructed from log2-transformed FPKM (+1) values, and normalized treatments were carried out based on rows. The RNA-seq data of the TtTLPs were listed in Table S4.
Plants 13 02355 g007
Figure 8. Quantitative RT-PCR detection of the expression levels of the six candidate TtTLPs in response to heat stress in T. tetragonoides seedlings. The relative expression levels in the root, stem, and leaf samples under heat stress treatment (45 °C; 0 and 2 h) were calculated using the 2−ΔCt method, with the housekeeping gene TtACT as a reference gene. Bars show the mean values ± SD of n = 3–4 technical replicates. Asterisks indicate significant differences from the CK (control check, without heat stress, Student’s t-test, *** p < 0.001, and **** p < 0.0001).
Plants 13 02355 g008
Figure 9. Relative expression levels of six candidate TtTLPs checked by qRT-PCR in root, stem, and leaf samples of T. tetragonoides seedlings under high salinity, high alkalinity, and high osmotic treatments (0, 2, 8, 24, and 48 h). Relative expression values were calculated using the 2−ΔCt method, with the housekeeping gene TtACT as a reference gene. Bars show the mean values ± SD of n = 3–4 technical replicates. Asterisks indicate significant differences from the CK (control check, without abiotic stresses, Student’s t-test, * p < 0.05, ** p < 0.01, *** p < 0.001, and **** p < 0.0001).
Plants 13 02355 g009
Figure 10. Functional identification related to abiotic stress of six candidate TtTLPs in yeast using a heterologous expression assay. The yeast wild-type (WT) strain BY4741 was transformed with the empty vector pYES2 or six recombinant vectors, namely TtTLP6-pYES2, TtTLP10-pYES2, TtTLP11-pYES2, TtTLP12-pYES2, TtTLP22-pYES2, and TtTLP19-pYES2. Yeast cultures were adjusted to OD600 = 2, and 2 μL serial dilutions (10-fold, from left to right in each panel) were spotted on SDG-Ura medium plates supplemented with different NaCl concentrations (0, 0.8, 1, and 1.2 M) (A); NaHCO3 concentrations (0, 9, 10, and 11 mM, pH 8.2) (B); mannitol concentrations (0, 0.8, 1, and 1.2 M) (C); heat challenges (52 °C for 20, 30, and 40 min, yeast strains without heat stress as control) (D); and freeze–thawing challenges (one, two, and three times, yeast strains without freeze-thawing as control) (E). The WT strain transformed with pYES2 was used as a positive control, and the yeast spots growing on the SDG-Ura medium plate without any challenge were the CK (check) control. The plates were incubated for 2–5 d at 30 °C.
Plants 13 02355 g010
Figure 11. Functional identification related to hydrogen peroxide (H2O2) tolerance of six TtTLPs in yeast using heterologous expression assays. The yeast wild-type (WT) and two H2O2-sensitive mutant strains, skn7∆ and yap1∆, were transformed with the empty vector pYES2 or six recombinant vectors, namely TtTLP6-pYES2, TtTLP10-pYES2, TtTLP11-pYES2, TtTLP12-pYES2, TtTLP22-pYES2, and TtTLP19-pYES2. (A) H2O2 (0, 0.4, 0.5, and 0.6 mM) tolerance in skn7∆; (B) H2O2 (0, 0.4, 0.5, and 0.6 mM) tolerance in yap1∆. The yeast strains were cultured and spotted, as described above.
Plants 13 02355 g011
Figure 12. Functional identification related to heavy metal (HM) tolerance of six TtTLPs in yeast using heterologous expression assays. The yeast wild-type (WT) and a series of metal-sensitive mutant strains were transformed with the empty vector pYES2 or six recombinant vectors, namely TtTLP6-pYES2, TtTLP10-pYES2, TtTLP11-pYES2, TtTLP12-pYES2, TtTLP22-pYES2, and TtTLP19-pYES2. (A) Cadmium (Cd, 0, 30, 40, and 50 μM) tolerance in ycf1∆; (B) zinc (Zn, 0, 0.2, 0.3, and 0.4 mM) tolerance in zrc1∆cot1∆; (C) cobalt (Co, 0, 0.1, 0.15, and 0.2 mM) tolerance in cot1∆; (D) nickel (Ni, 0, 0.25, 0.5, and 1 mM) tolerance in smf1∆; and (E) manganese (Mn, 0, 0.5, 1, and 2 mM) tolerance in smf1∆. The yeast strains were cultured and spotted, as described previously.
Plants 13 02355 g012
Table 1. Nomenclature, properties, and prediction of subcellular localization for TtTLPs identified from Tetragonia tetragonoides.
NameLocusLength (aa) and MW (kDa)Major Amino Acid (%)PIIIAIGRAVYDisordered
aa (%)
TMHs and TopologiesWoLF_PSORTPlant-PLoc
TtTLP101G0009210247–26.38T (11.7%), A (8.1%), P (8.1%)7.3940.6872.270.00570.45None/outsidechlo: 14Extracellular
TtTLP201G0018050211–22.82S (10.0%), L (9.0%), V (7.6%)5.2949.6672.99−0.22684.83None/outsidenucl: 7, chlo: 6Nucleus
TtTLP302G0003200291–31.30G (10.3%), S (9.3%), L (7.9%)8.2437.8171.370.09980.071/out to ingolg: 3.5, golg_plas: 3.5, vacu: 3, plas: 2.5, chlo: 2, extr: 2Extracellular
TtTLP402G0007540245–25.82S (13.9%), G (10.2%), T (10.2%)6.6548.3257.39−0.12987.76None/outsideextr: 9, chlo: 4Extracellular
TtTLP502G0018220251–26.39A (11.6%), G (11.2%), S (8.8%)8.8144.1067.370.13384.861/in to outchlo: 9, extr: 2, vacu: 2Extracellular
TtTLP603G0001120247–26.44G (10.9%), L (9.3%), P (8.9%)7.8850.4966.76−0.06587.85None/outsideextr: 6, chlo: 3, vacu: 2, nucl: 1, mito: 1Cell wall
TtTLP703G0019340659–73.67L (10.3%), G (8.3%), V (7.1%)8.4733.1584.43−0.19259.79None/outsidechlo: 5, nucl: 4, cyto: 4Chloroplast
TtTLP804G0001170179–19.33G (10.1%), L (8.9%), T (8.9%)8.1353.3066.03−0.04078.77None/outsideextr: 7, chlo: 2, vacu: 2, nucl: 1, mito: 1Cell wall
TtTLP904G0015010244–26.17G (10.7%), L (7.8%), V (7.8%)8.0941.7773.48−0.01583.201/in to outchlo: 12, extr: 2Extracellular
TtTLP1004G0025610226–23.58G (11.9%), T (11.1%), S (8.4%)4.6829.9850.53−0.13392.041/in to outchlo: 5, extr: 4, vacu: 4Extracellular
TtTLP1104G0025620227–24.02G (11.9%), T (10.1%), P (8.4%)8.4019.6654.58−0.20288.55None/outsidechlo: 8, extr: 4, vacu: 2Vacuole
TtTLP1204G0025640232–24.86G (9.9%), T (9.5%), P (8.2%)6.0842.1060.60−0.31488.36None/outsideextr: 8, chlo: 4, vacu: 1Extracellular
TtTLP1306G0000860384–39.82G (13.5%), S (13.0%), P (11.5%)4.8056.9657.92−0.12885.422/in to invacu: 4, golg_plas: 4, plas: 3.5, golg: 3.5, extr: 3Extracellular
TtTLP1406G0011700244–26.12G (10.7%), L (8.2%), C (7.4%), S (7.4%)7.8042.8571.52−0.02981.97None/outsideextr: 7, chlo: 3, nucl: 1, cyto: 1, vacu: 1Extracellular
TtTLP1506G0023190227–23.67G (12.3%), T (11.0%), S (8.4%)4.6828.0151.19−0.13891.631/in to outchlo: 6, vacu: 4, extr: 3Extracellular
TtTLP1606G0023200227–24.00G (11.9%), T (10.1%), P (8.8%)8.4019.0154.58−0.20388.55None/outsidechlo: 7, extr: 4, vacu: 2Extracellular
TtTLP1706G0023220232–24.87G (9.9%), T (9.9%), P (9.1%)5.0838.9161.03−0.28489.66None/outsideextr: 8, chlo: 4, vacu: 1Vacuole
TtTLP1807G0002190274–29.60S (11.7%), T (9.1%), G (8.0%)5.1446.6868.36−0.09484.67None/outsidenucl: 6, mito: 4, chlo: 3Extracellular
TtTLP1907G0015670226–24.49T (9.3%), G (8.8%), N (8.4%)7.8430.8360.04−0.18885.84None/outsidechlo: 14Vacuole
TtTLP2007G0019970364–39.62L (9.3%), A (8.8%), S (8.8%)8.6442.9279.090.00171.43None/outsidechlo: 4, mito: 3, vacu: 3, extr: 2, nucl: 1Cell wall
TtTLP2107G0019980355–36.81G (13.0%), T (13.0%), S (11.5%)4.3131.7757.21−0.03290.141/out to inchlo: 4, extr: 4, vacu: 3, nucl: 2Chloroplast
TtTLP2209G0001980332–34.63S (12.0%), G (10.8%), T (10.5%)4.7038.6464.70−0.12178.31None/outsidechlo: 11, extr: 2Extracellular
TtTLP2309G0001990340–35.38S (14.7%), G (12.1%), T (10.0%)4.7347.6255.180.01083.822/out to outextr: 5, golg: 3.5, golg_plas: 2.5, chlo: 2, vacu: 2Extracellular
TtTLP2410G0001950410–45.74L (10.5%), T (9.8%), S (8.8%)9.2839.0483.17−0.09266.591/in to outplas: 8.5, golg_plas: 5.5, golg: 1.5, chlo: 1, cyto: 1, vacu: 1Chloroplast
TtTLP2511G0010740246–26.20T (13.0%), P (8.5%), G (7.7%), L (7.7%)6.6637.2470.160.08081.71None/outsidechlo: 14Extracellular
TtTLP2611G0017940272–29.88L (8.5%), P (7.4%), S (7.4%)6.7749.2781.73−0.02475.371/in to outchlo: 8, extr: 2, vacu: 2, nucl: 1Chloroplast
TtTLP2713G0000550359–37.26T (12.8%), G (12.5%), S (11.7%)4.2731.7758.25−0.02586.911/out to inchlo: 4, extr: 3, nucl: 2, vacu: 2, E.R.: 1.5, E.R._plas: 1.5Extracellular
TtTLP2813G0000560317–33.62L (10.7%), A (10.4%), G (9.5%)8.2737.0983.470.26872.561/out to inchlo: 6, extr: 4, plas: 3Cell wall
TtTLP2914G0003240290–31.12G (10.3%), S (9.0%), L (7.6%), T (7.6%), V (7.6%)7.3535.0870.590.10877.592/in to ingolg: 3.5, golg_plas: 3.5, extr: 3, vacu: 3, plas: 2.5, chlo: 2Extracellular
TtTLP3014G0007370825–91.27L (9.5%), S (9.2%), G (7.5%)8.5851.4381.22−0.16846.55None/outsidenucl: 6, chlo: 4, mito: 2, plas: 1Cytoplasm
TtTLP3114G0013960259–26.33G (15.1%), S (11.6%), T (9.3%)4.2336.0758.03−0.02084.941/in to outchlo: 13Extracellular
TtTLP3214G0017910251–26.39A (12.4%), G (11.2%), S (8.4%)9.0142.2269.320.10086.45None/outsidechlo: 10, mito: 3Cell wall
TtTLP3315G0017250342–36.53S (14.9%), G (12.6%), T (8.5%)4.9046.6759.420.01185.962/out to outextr: 7, chlo: 3, vacu: 2, mito: 1Extracellular
TtTLP3415G0017260334–34.89S (12.3%), T (10.5%), G (10.2%)4.6438.0961.41−0.12282.93None/outsidenucl: 7.5, chlo: 5, cyto_nucl: 4.5Extracellular
TtTLP3516G0001800346–35.10G (14.2%), S (13.9%), T (12.7%)4.5143.8052.57−0.13691.91None/outsideextr: 5, chlo: 2, nucl: 2, plas: 2, vacu: 2Chloroplast
TtTLP3616G0005420513–58.38L (11.5%), G (7.2%), K (6.8%)8.4030.9289.84−0.24844.64None/outsidecyto: 12, nucl: 2Chloroplast
TtTLP3716G0019580358–37.04G (13.7%), S (11.2%), P (10.3%)4.8053.0454.53−0.21987.711/in to outextr: 9, vacu: 3, golg: 2Extracellular
MW: molecular weight; PI: isoelectric point; II: instability index; AI: aliphatic index; GRAVY: grand average of hydropathicity. The molecular weight and isoelectric points of predicted TtTLPs were detected using the ExPASy proteomics server (https://web.expasy.org/protparam/, accessed on 20 November 2023). The contents of disordered amino acids (aa, %) in TtTLPs were calculated according to the online program Disordered by loops/coils definition from DisEMBL 1.5 (Intrinsic Protein Disorder Prediction, http://dis.embl.de/, accessed on 20 November 2023). The TMHMM Server 2.0 program (https://services.healthtech.dtu.dk/services/TMHMM-2.0/, accessed on 20 November 2023) was used to predict the transmembrane helices, and the topologies of TtTLPs were also performed with the 3D prediction by PHYRE2 (http://www.sbg.bio.ic.ac.uk/phyre2/html/page.cgi?id=index, accessed on 20 November 2023). For the subcellular localization prediction, the online programs WoLF_PSORT (https://www.genscript.com/wolf-psort.html, accessed on 20 November 2023) and Plant-PLoc (http://www.csbio.sjtu.edu.cn/bioinf/plant/, accessed on 20 November 2023) were used.
Disclaimer/Publisher’s Note: The statements, opinions and data contained in all publications are solely those of the individual author(s) and contributor(s) and not of MDPI and/or the editor(s). MDPI and/or the editor(s) disclaim responsibility for any injury to people or property resulting from any ideas, methods, instructions or products referred to in the content.

