
Influence of Functional Traits of Dominant Species of Different Life Forms and Plant Communities on Ecological Stoichiometric Traits in Karst Landscapes


Abstract
1. Introduction
2. Research Methods
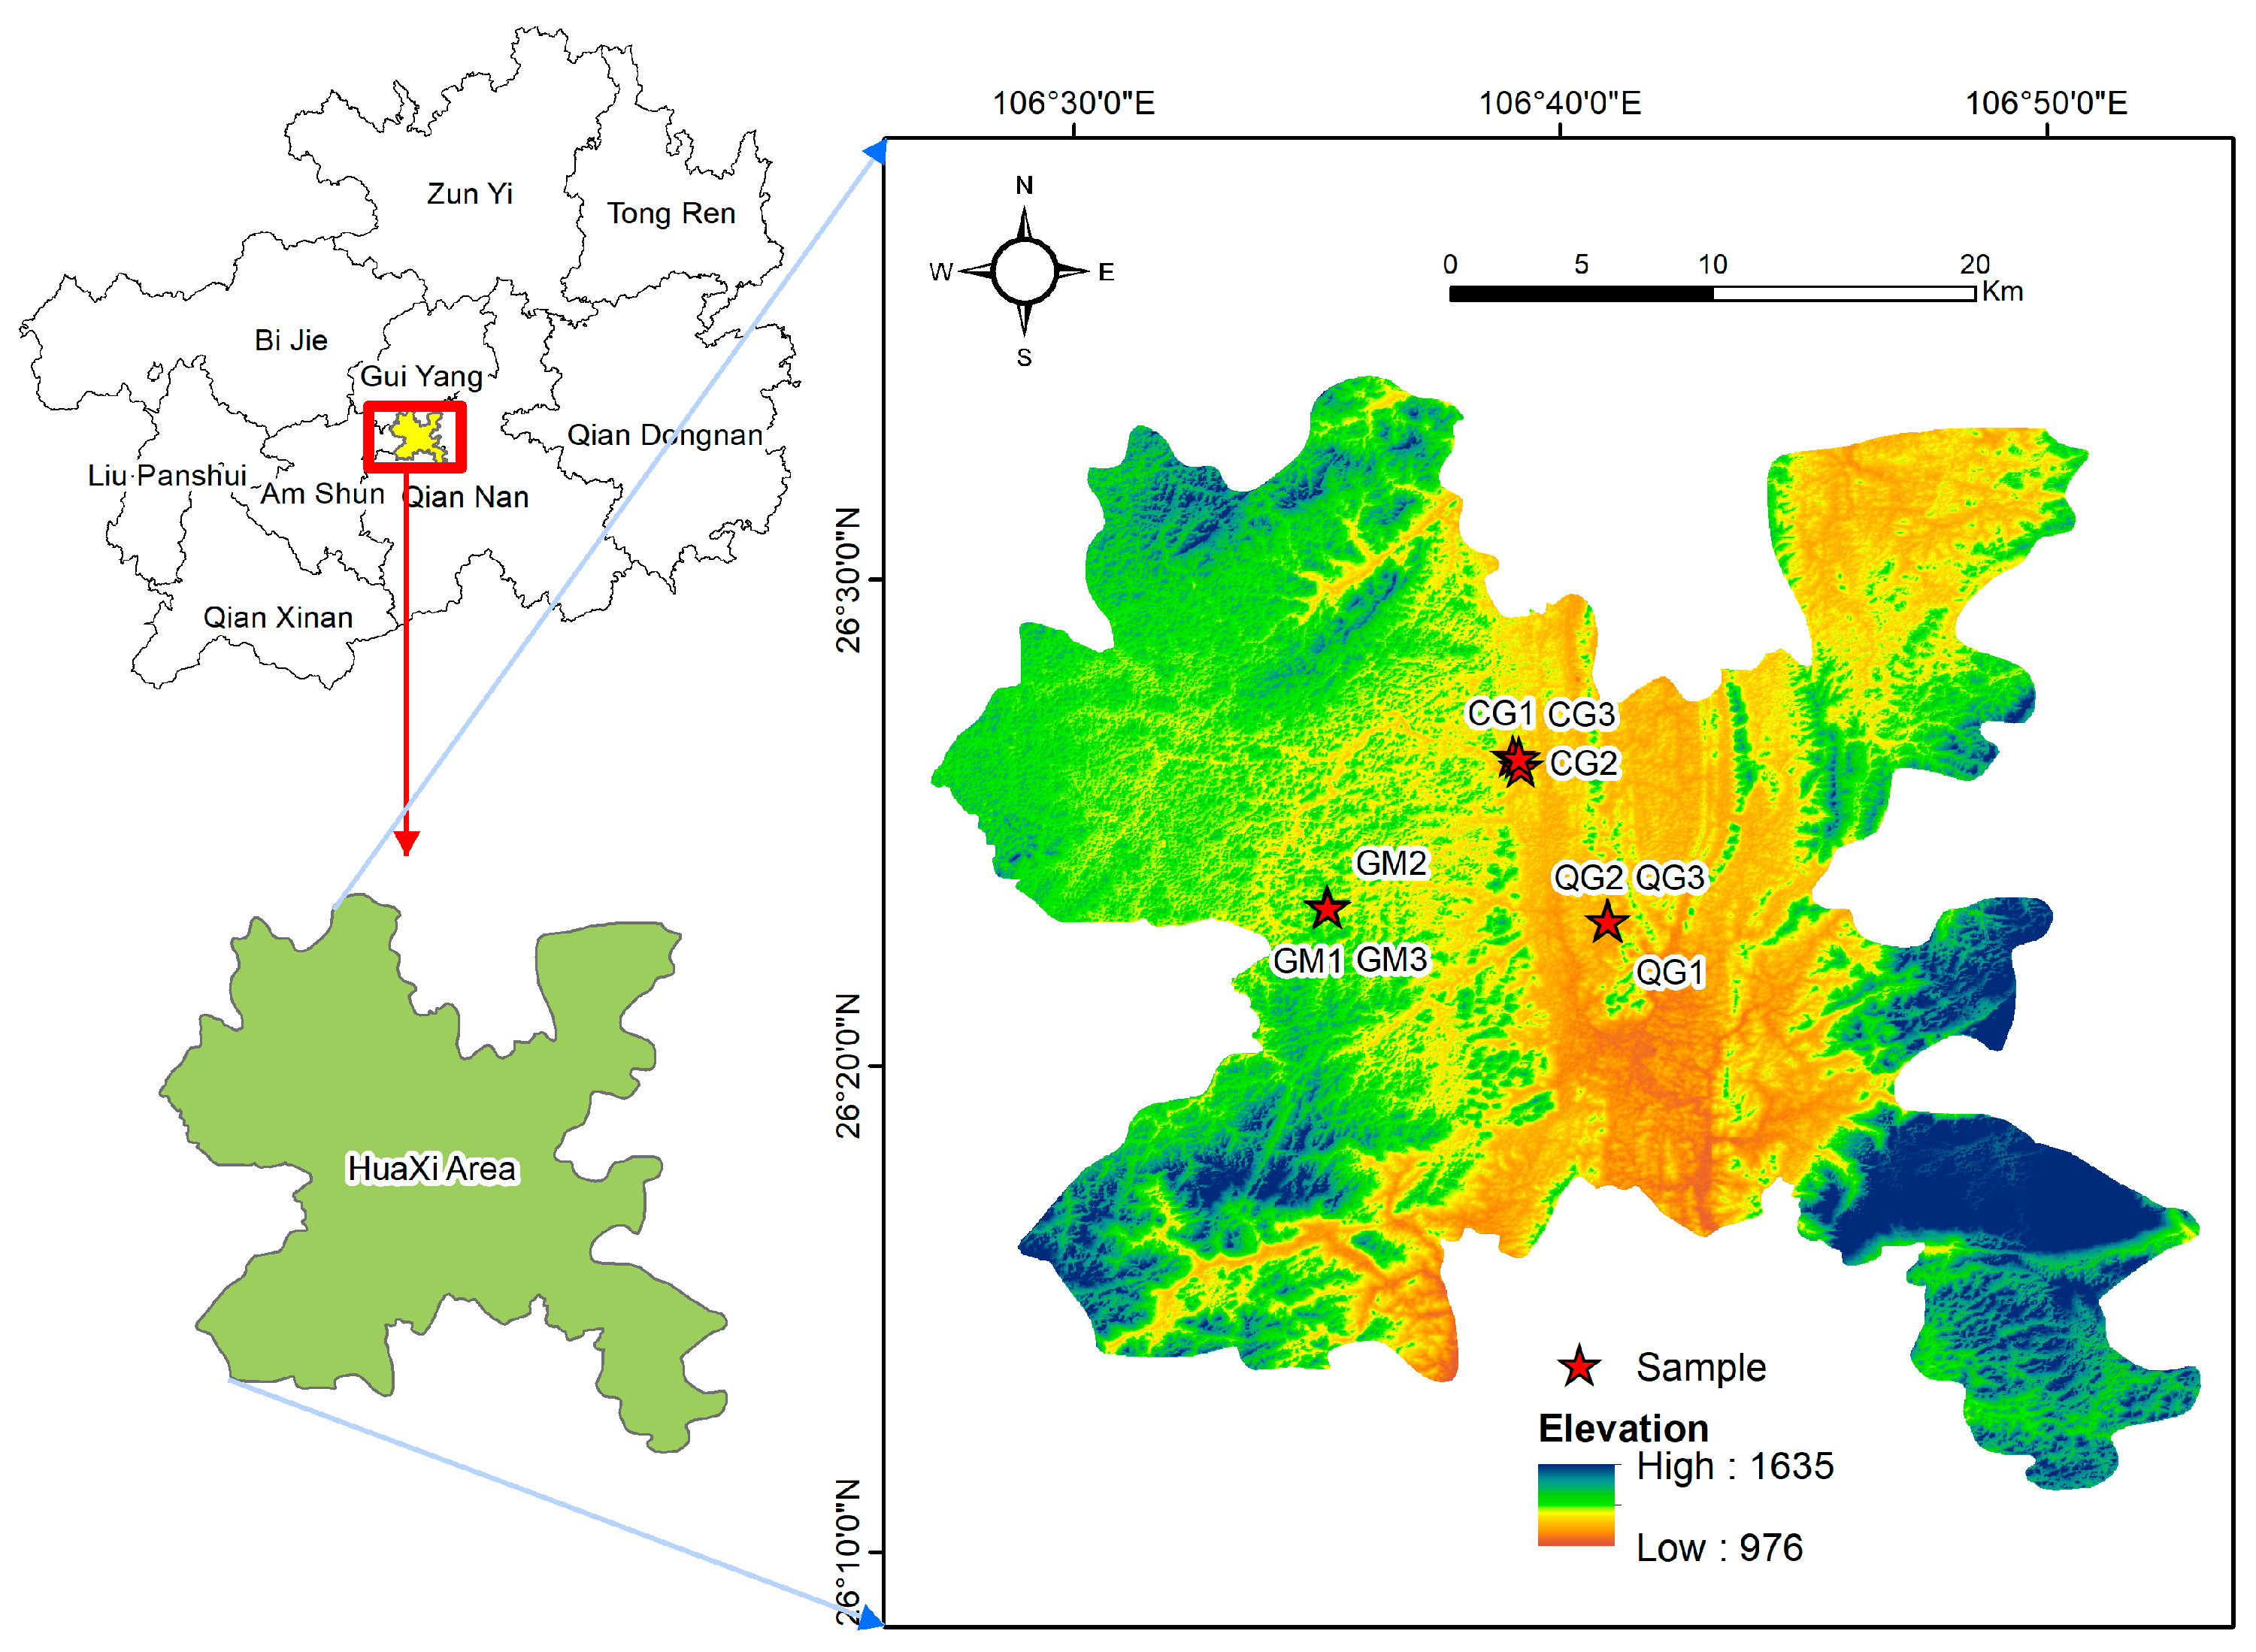
2.1. Study Area
2.1.1. Soil Environment
2.1.2. Description of Karst Vegetation
2.2. Sample Setup
2.3. Sample Collection and Processing
2.4. Determination of Functional Properties and Analysis of Samples
2.5. Data Processing
3. Results and Analysis
3.1. Characterizing Changes in Functional Traits of Dominant Species in Plant Communities with Different Life Forms
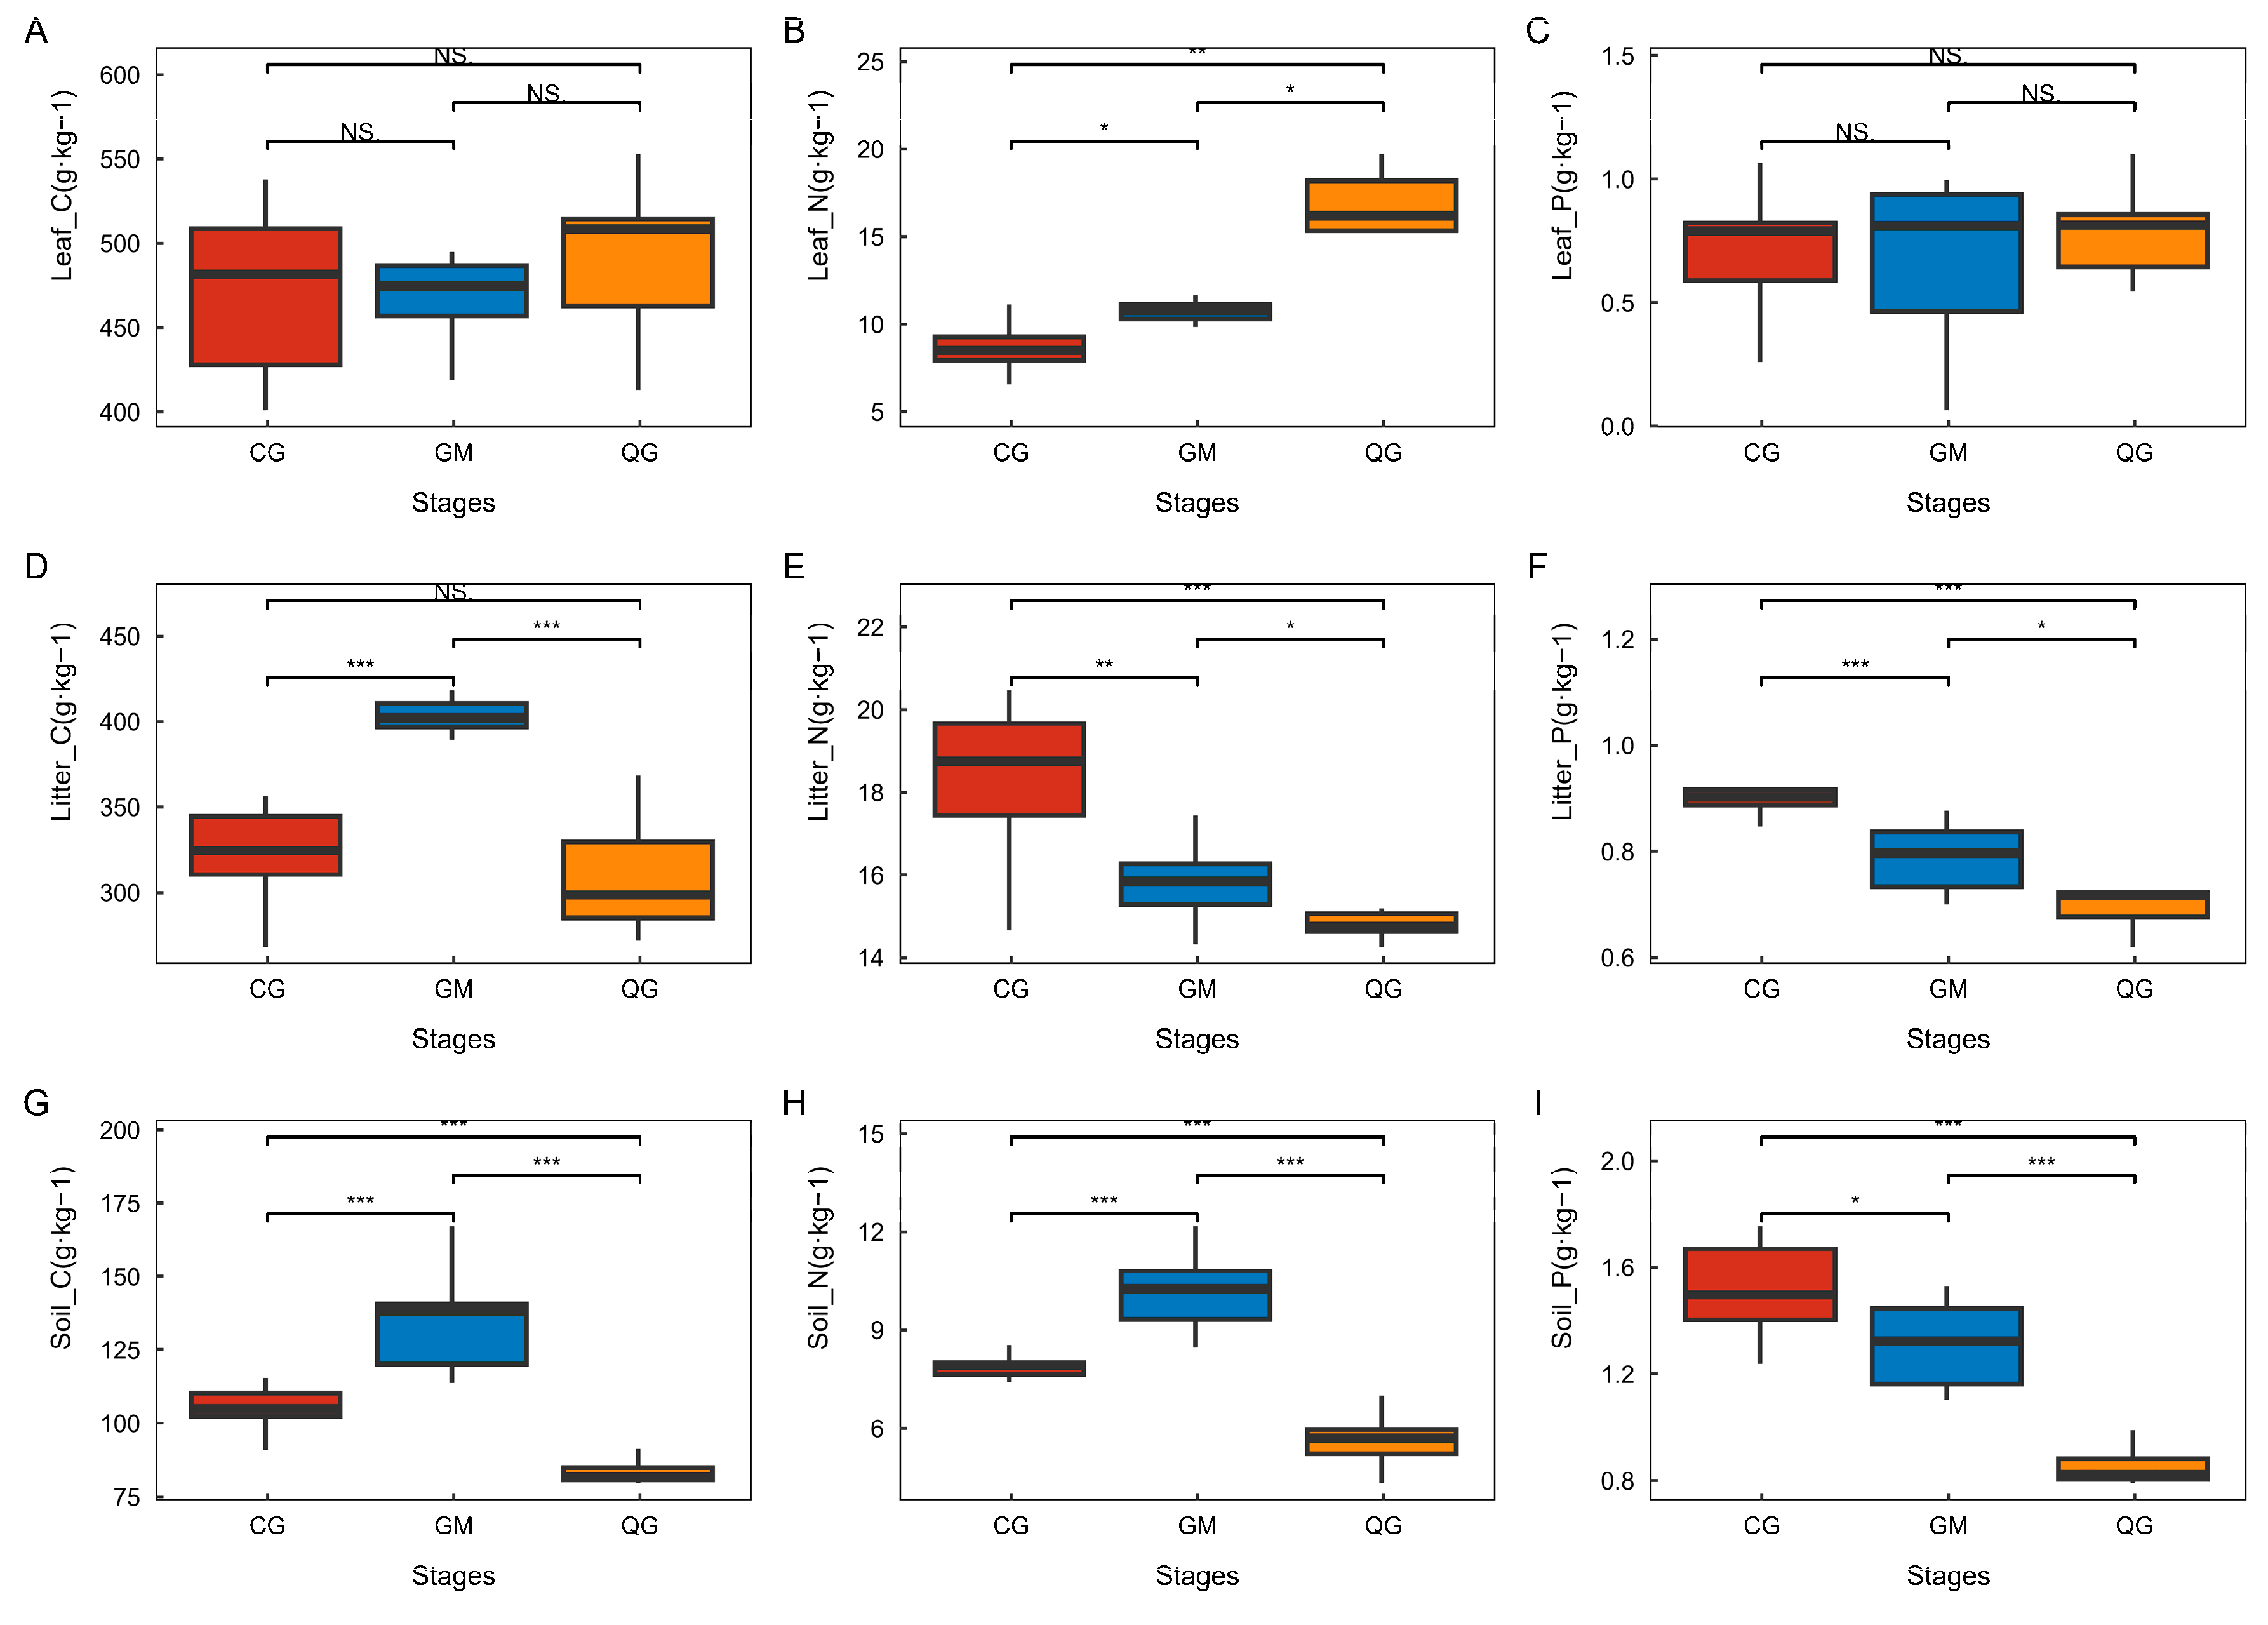
3.2. C, N, and P Contents of Leaf Litter and Soil of Dominant Species in Plant Communities with Different Life Forms
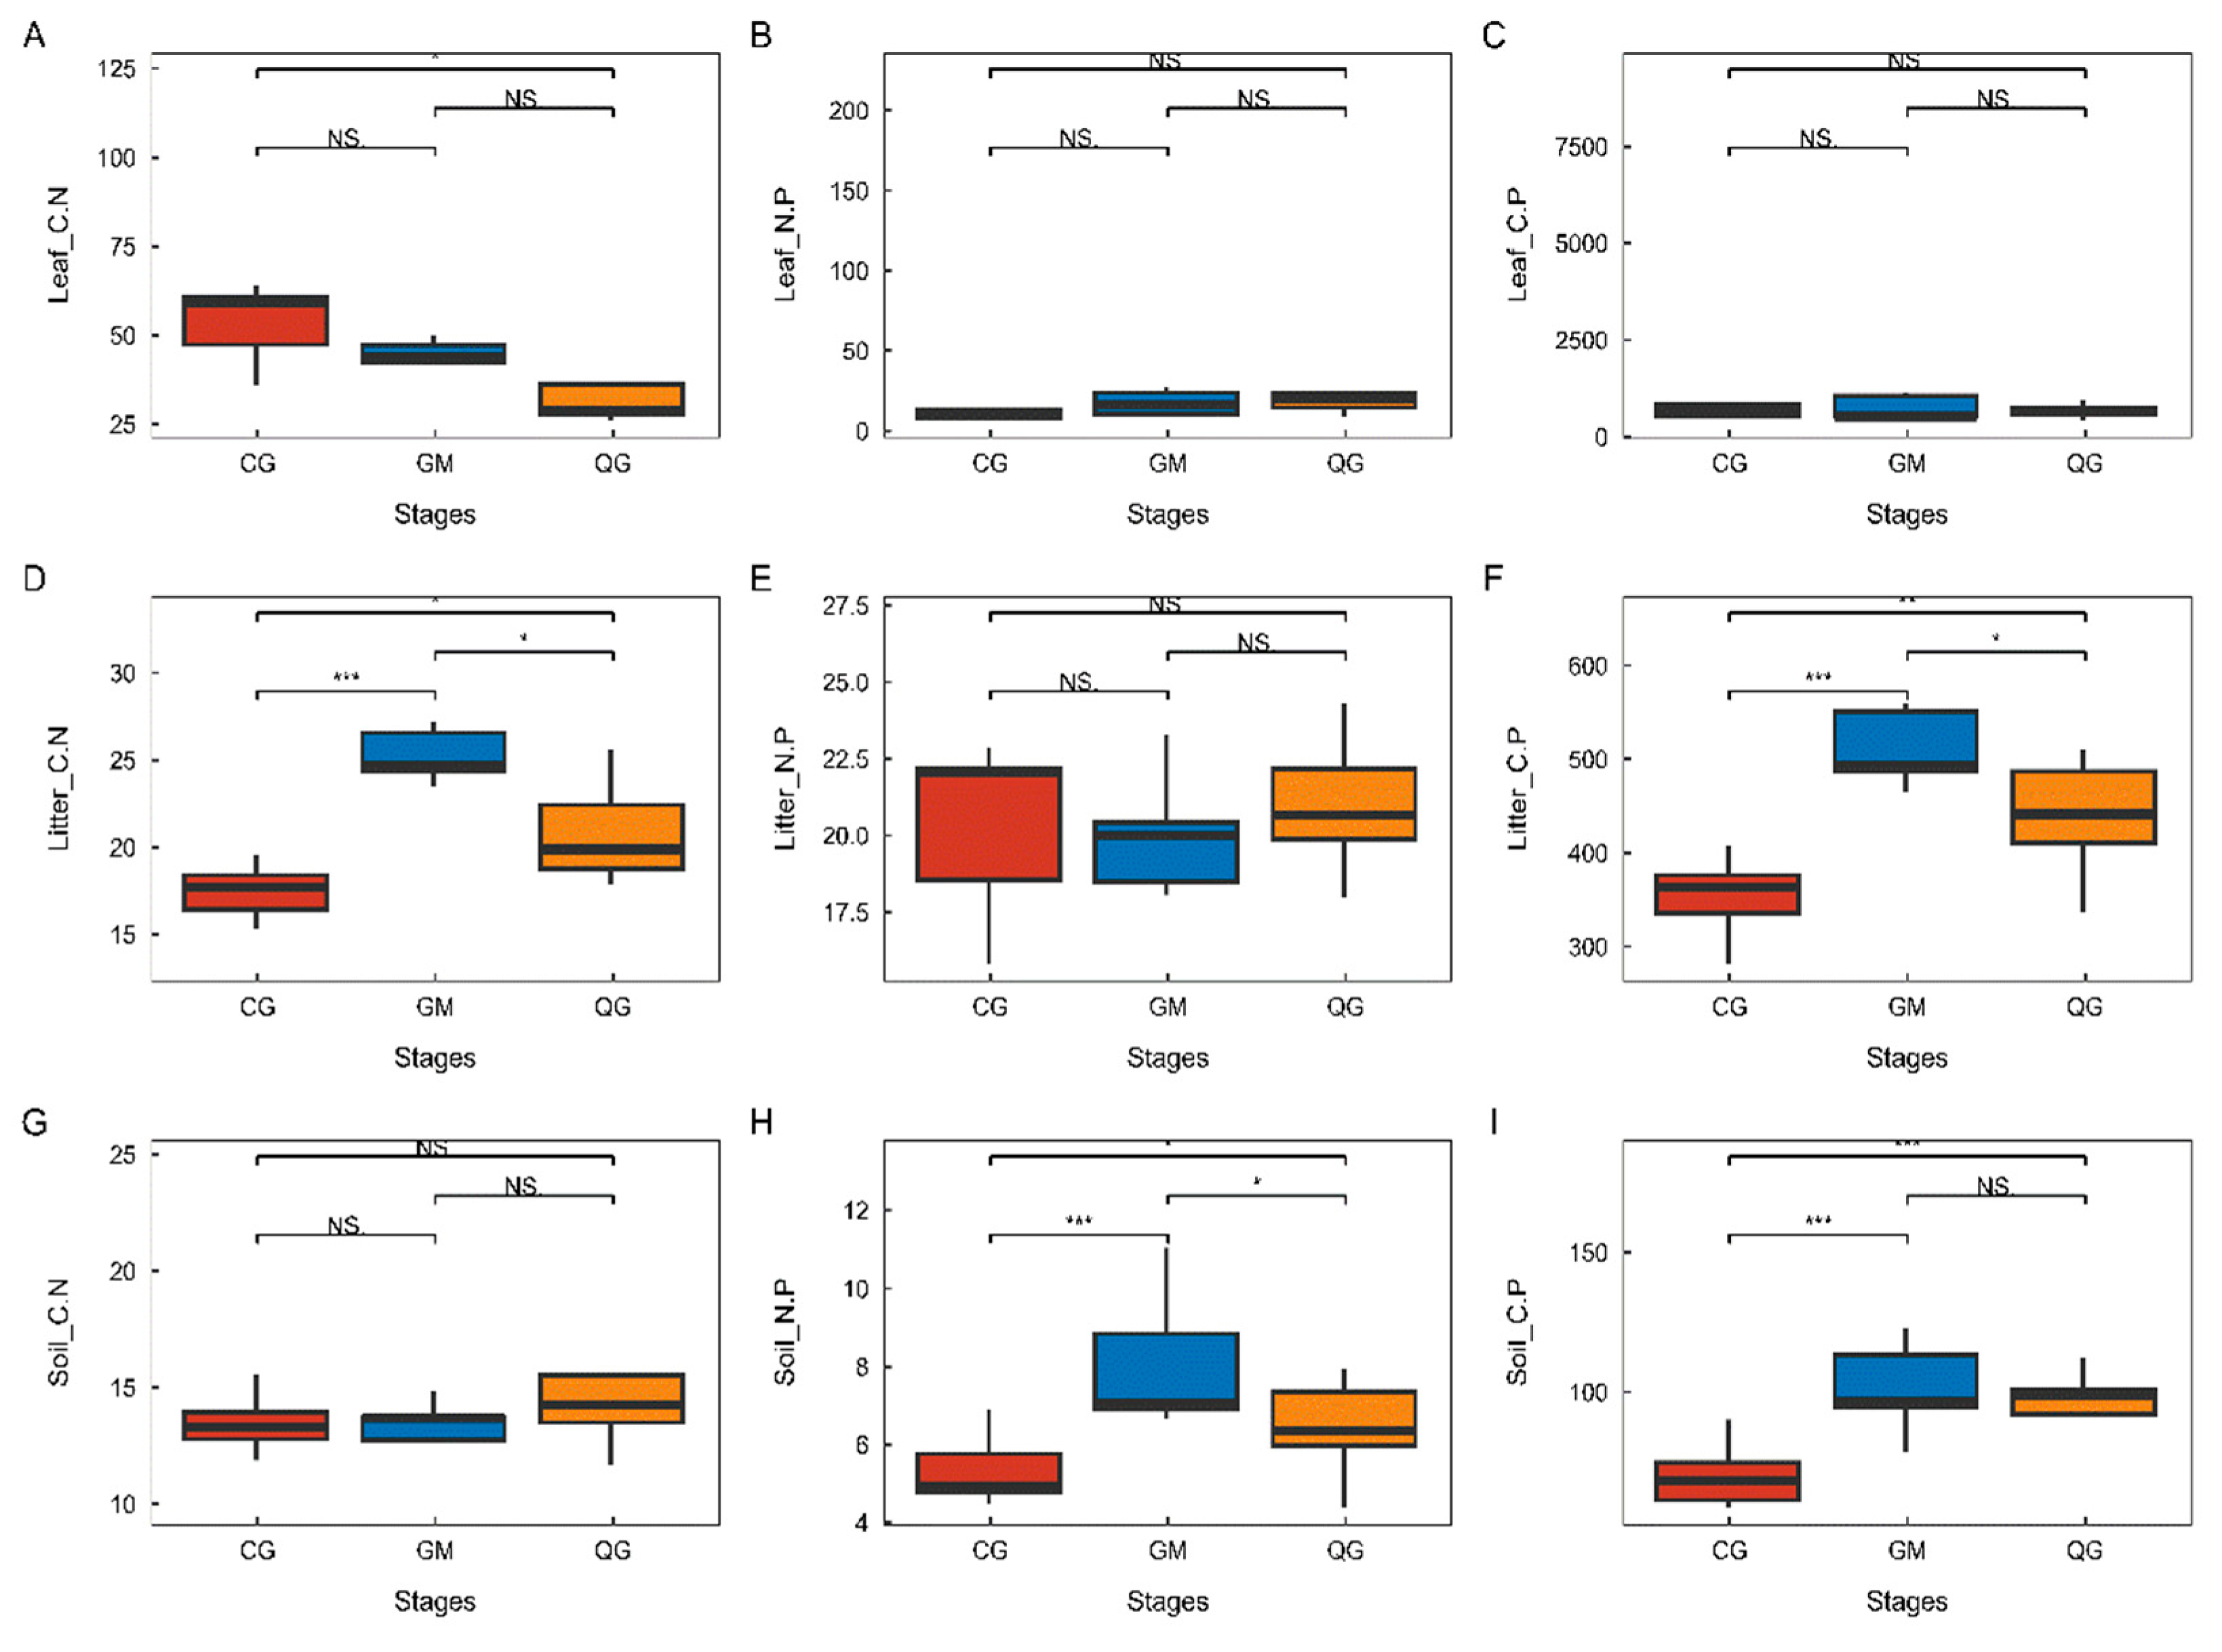
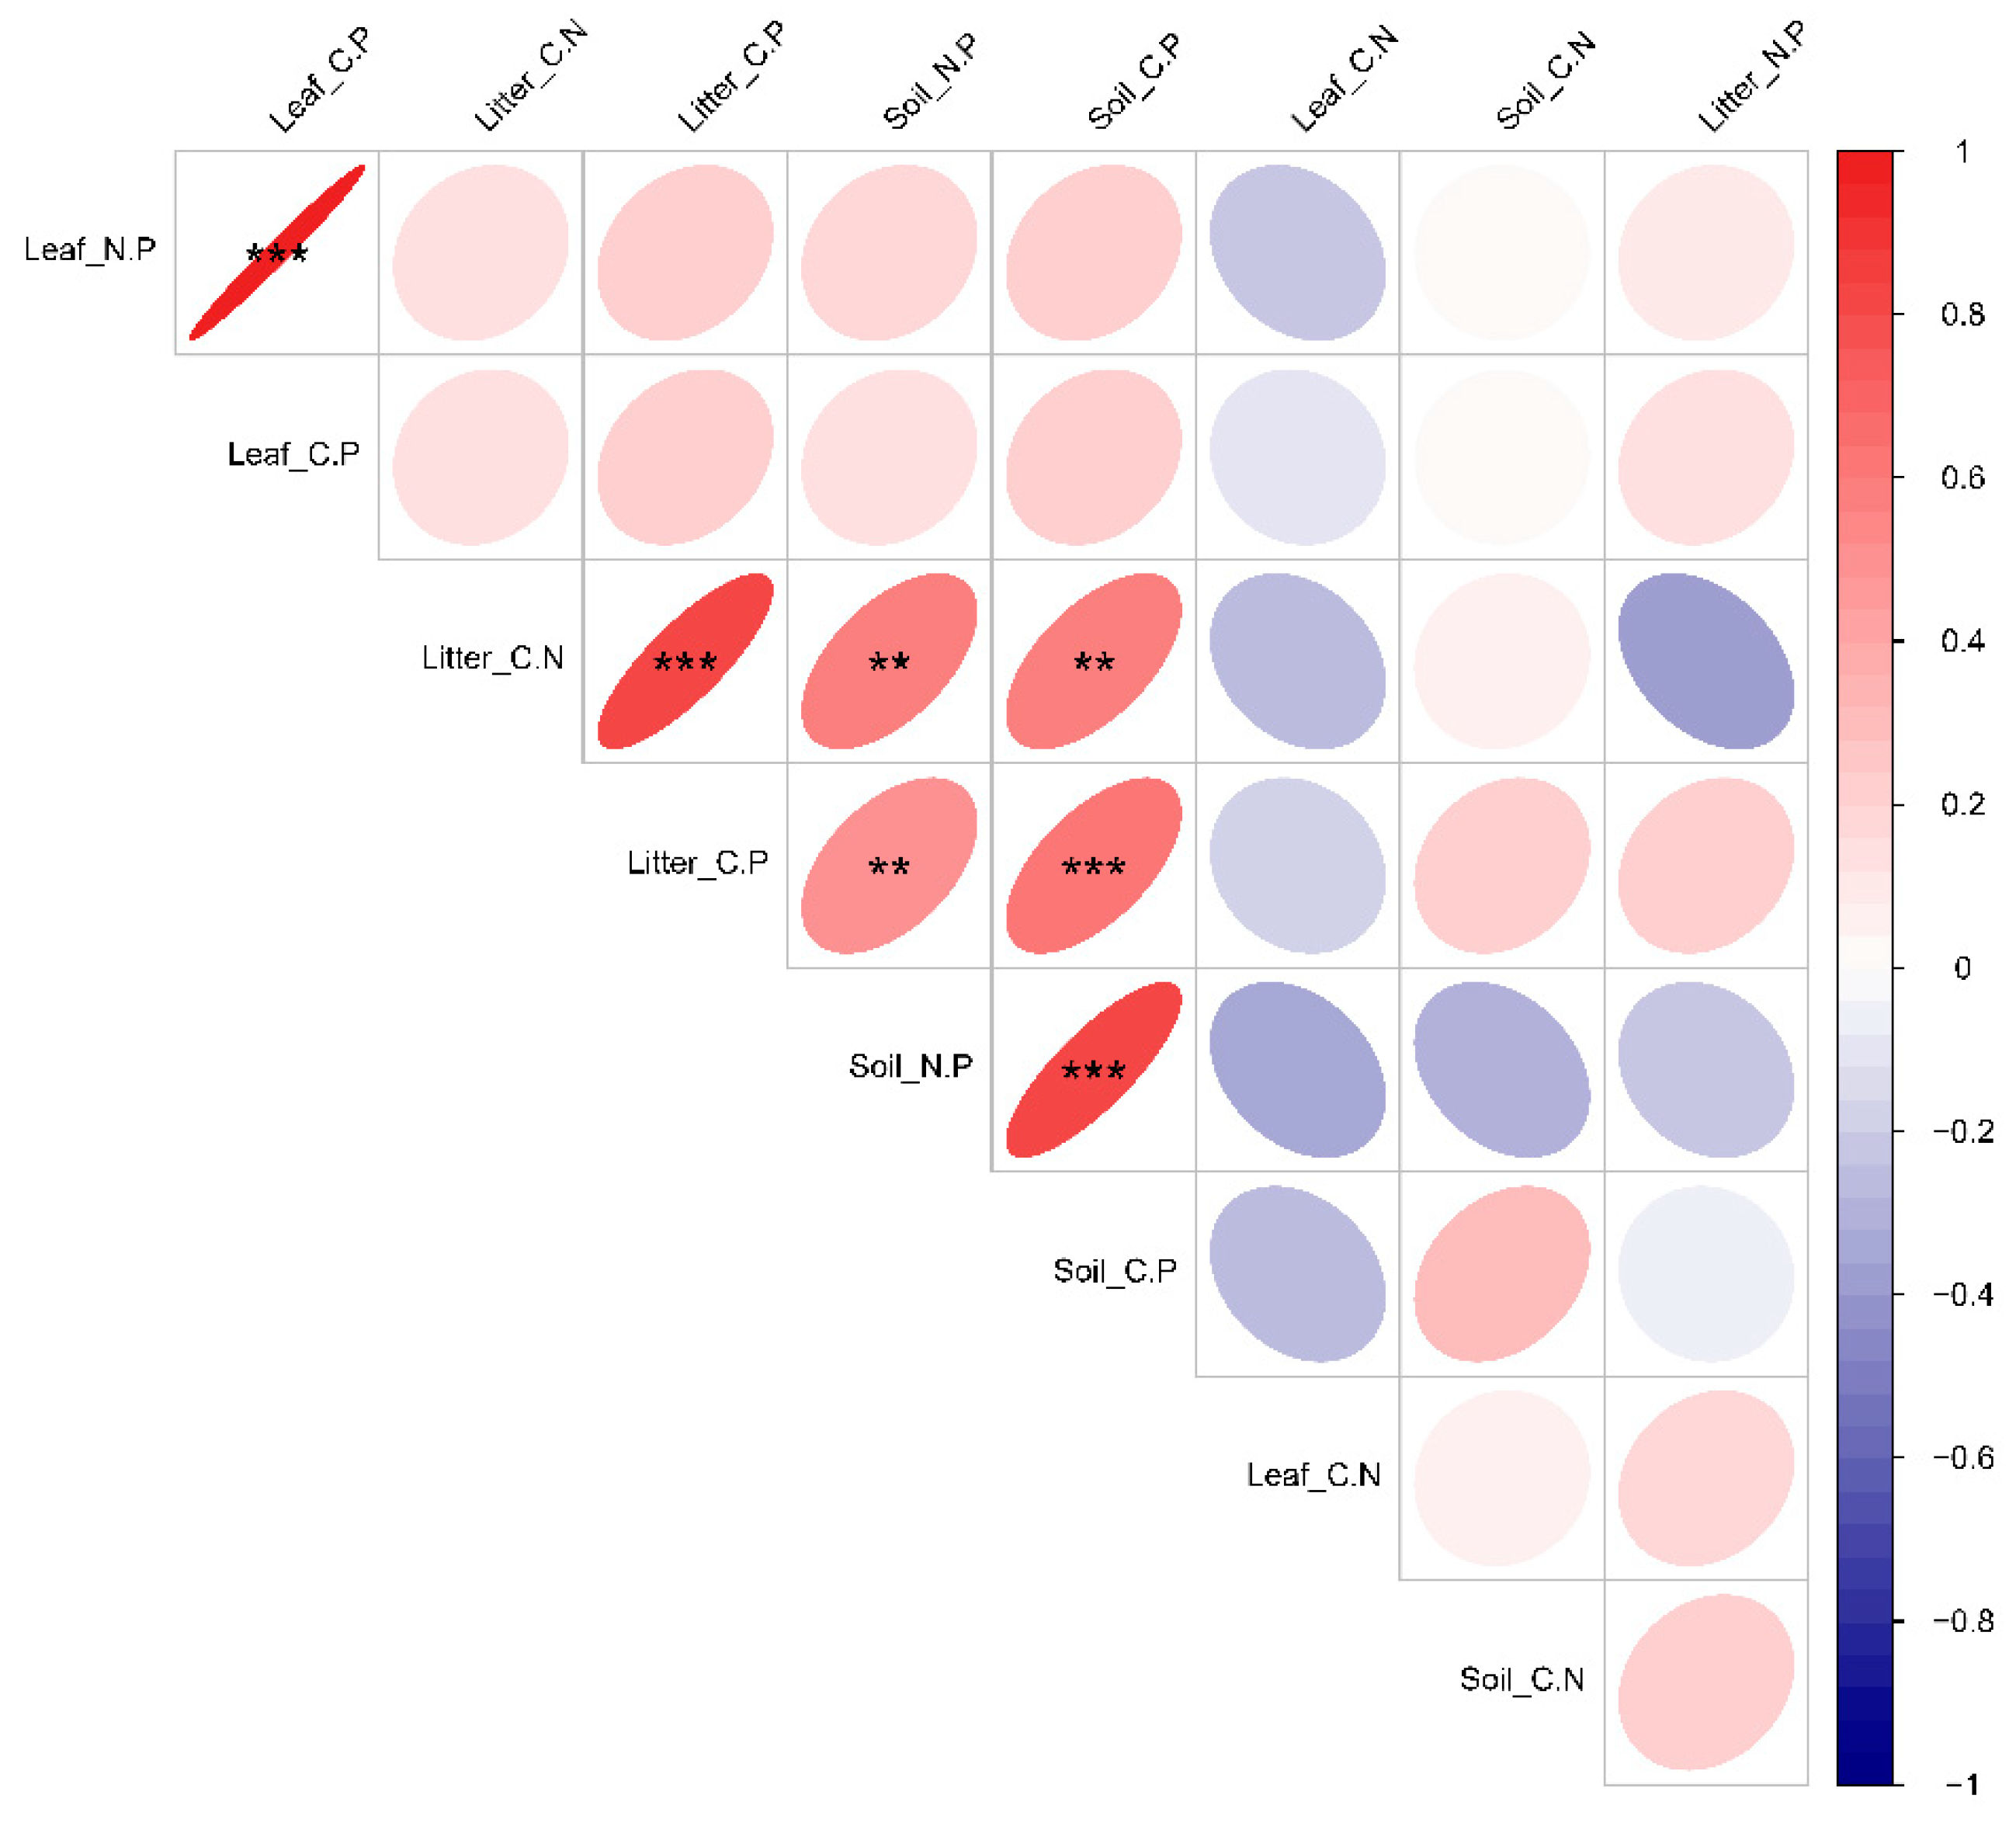
3.3. Characterization of Changes in Leaf-Litter–Soil Ecological Stoichiometry of Dominant Species in Plant Communities with Different Life Forms
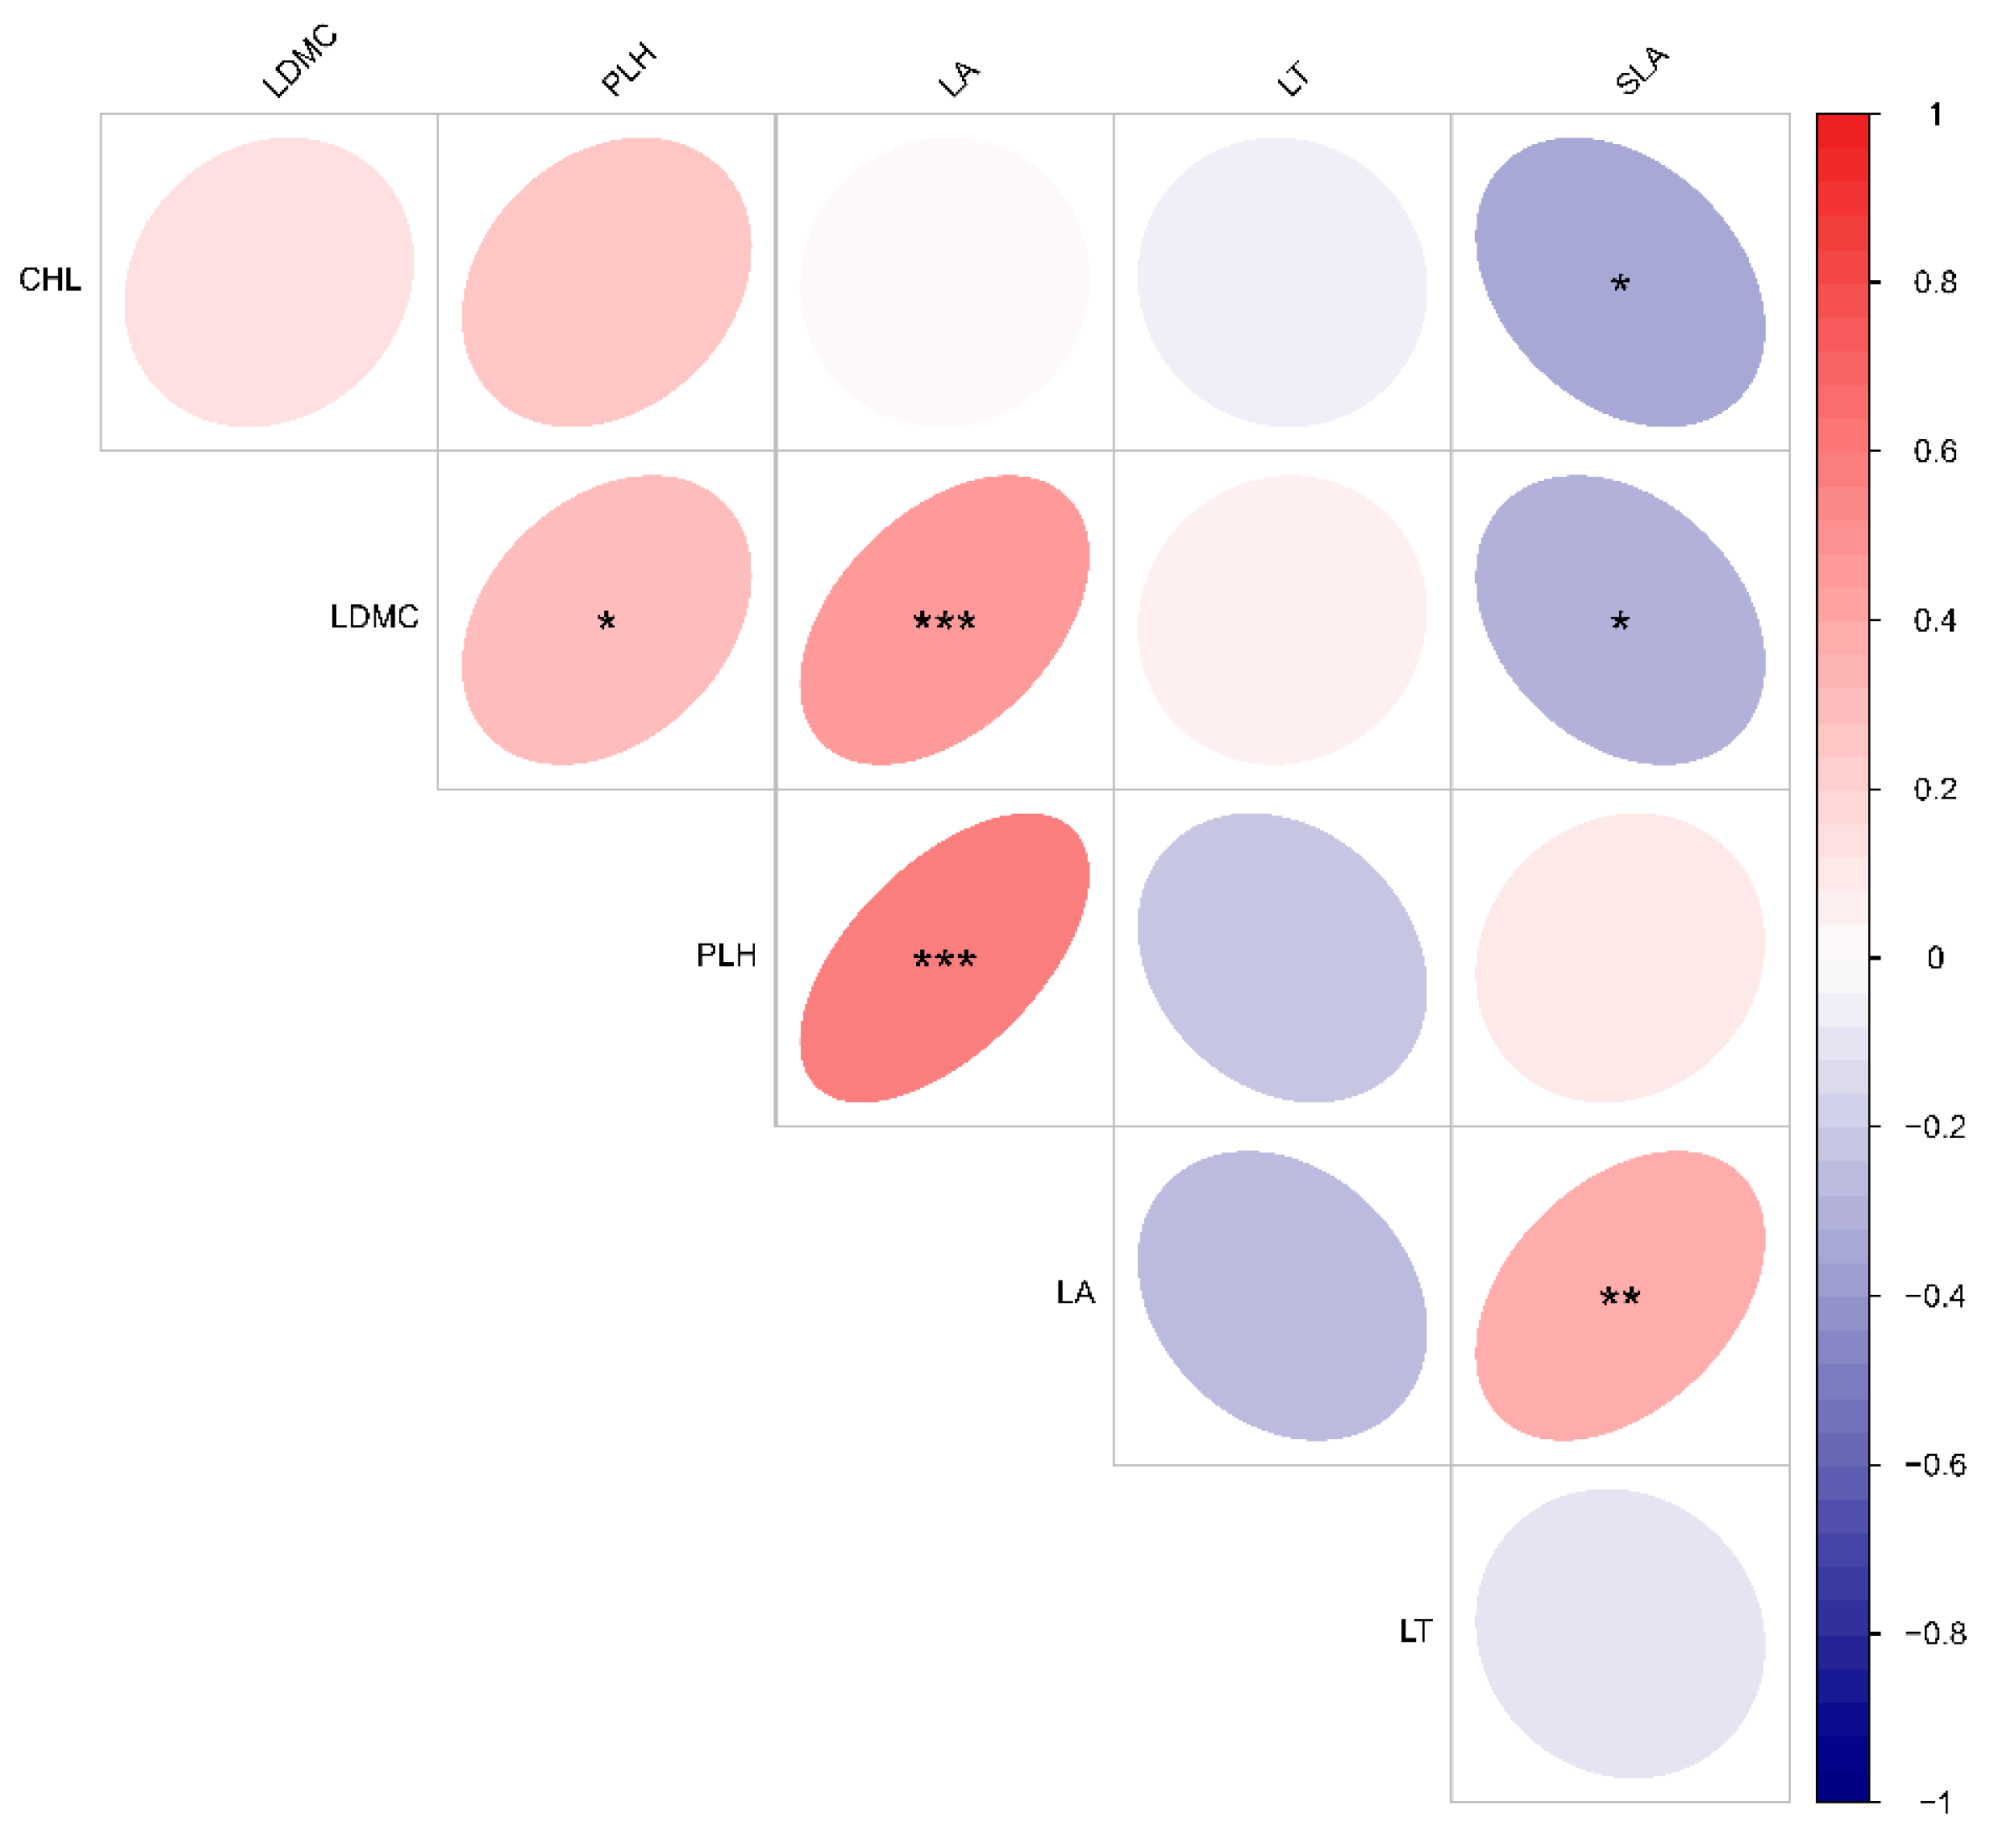
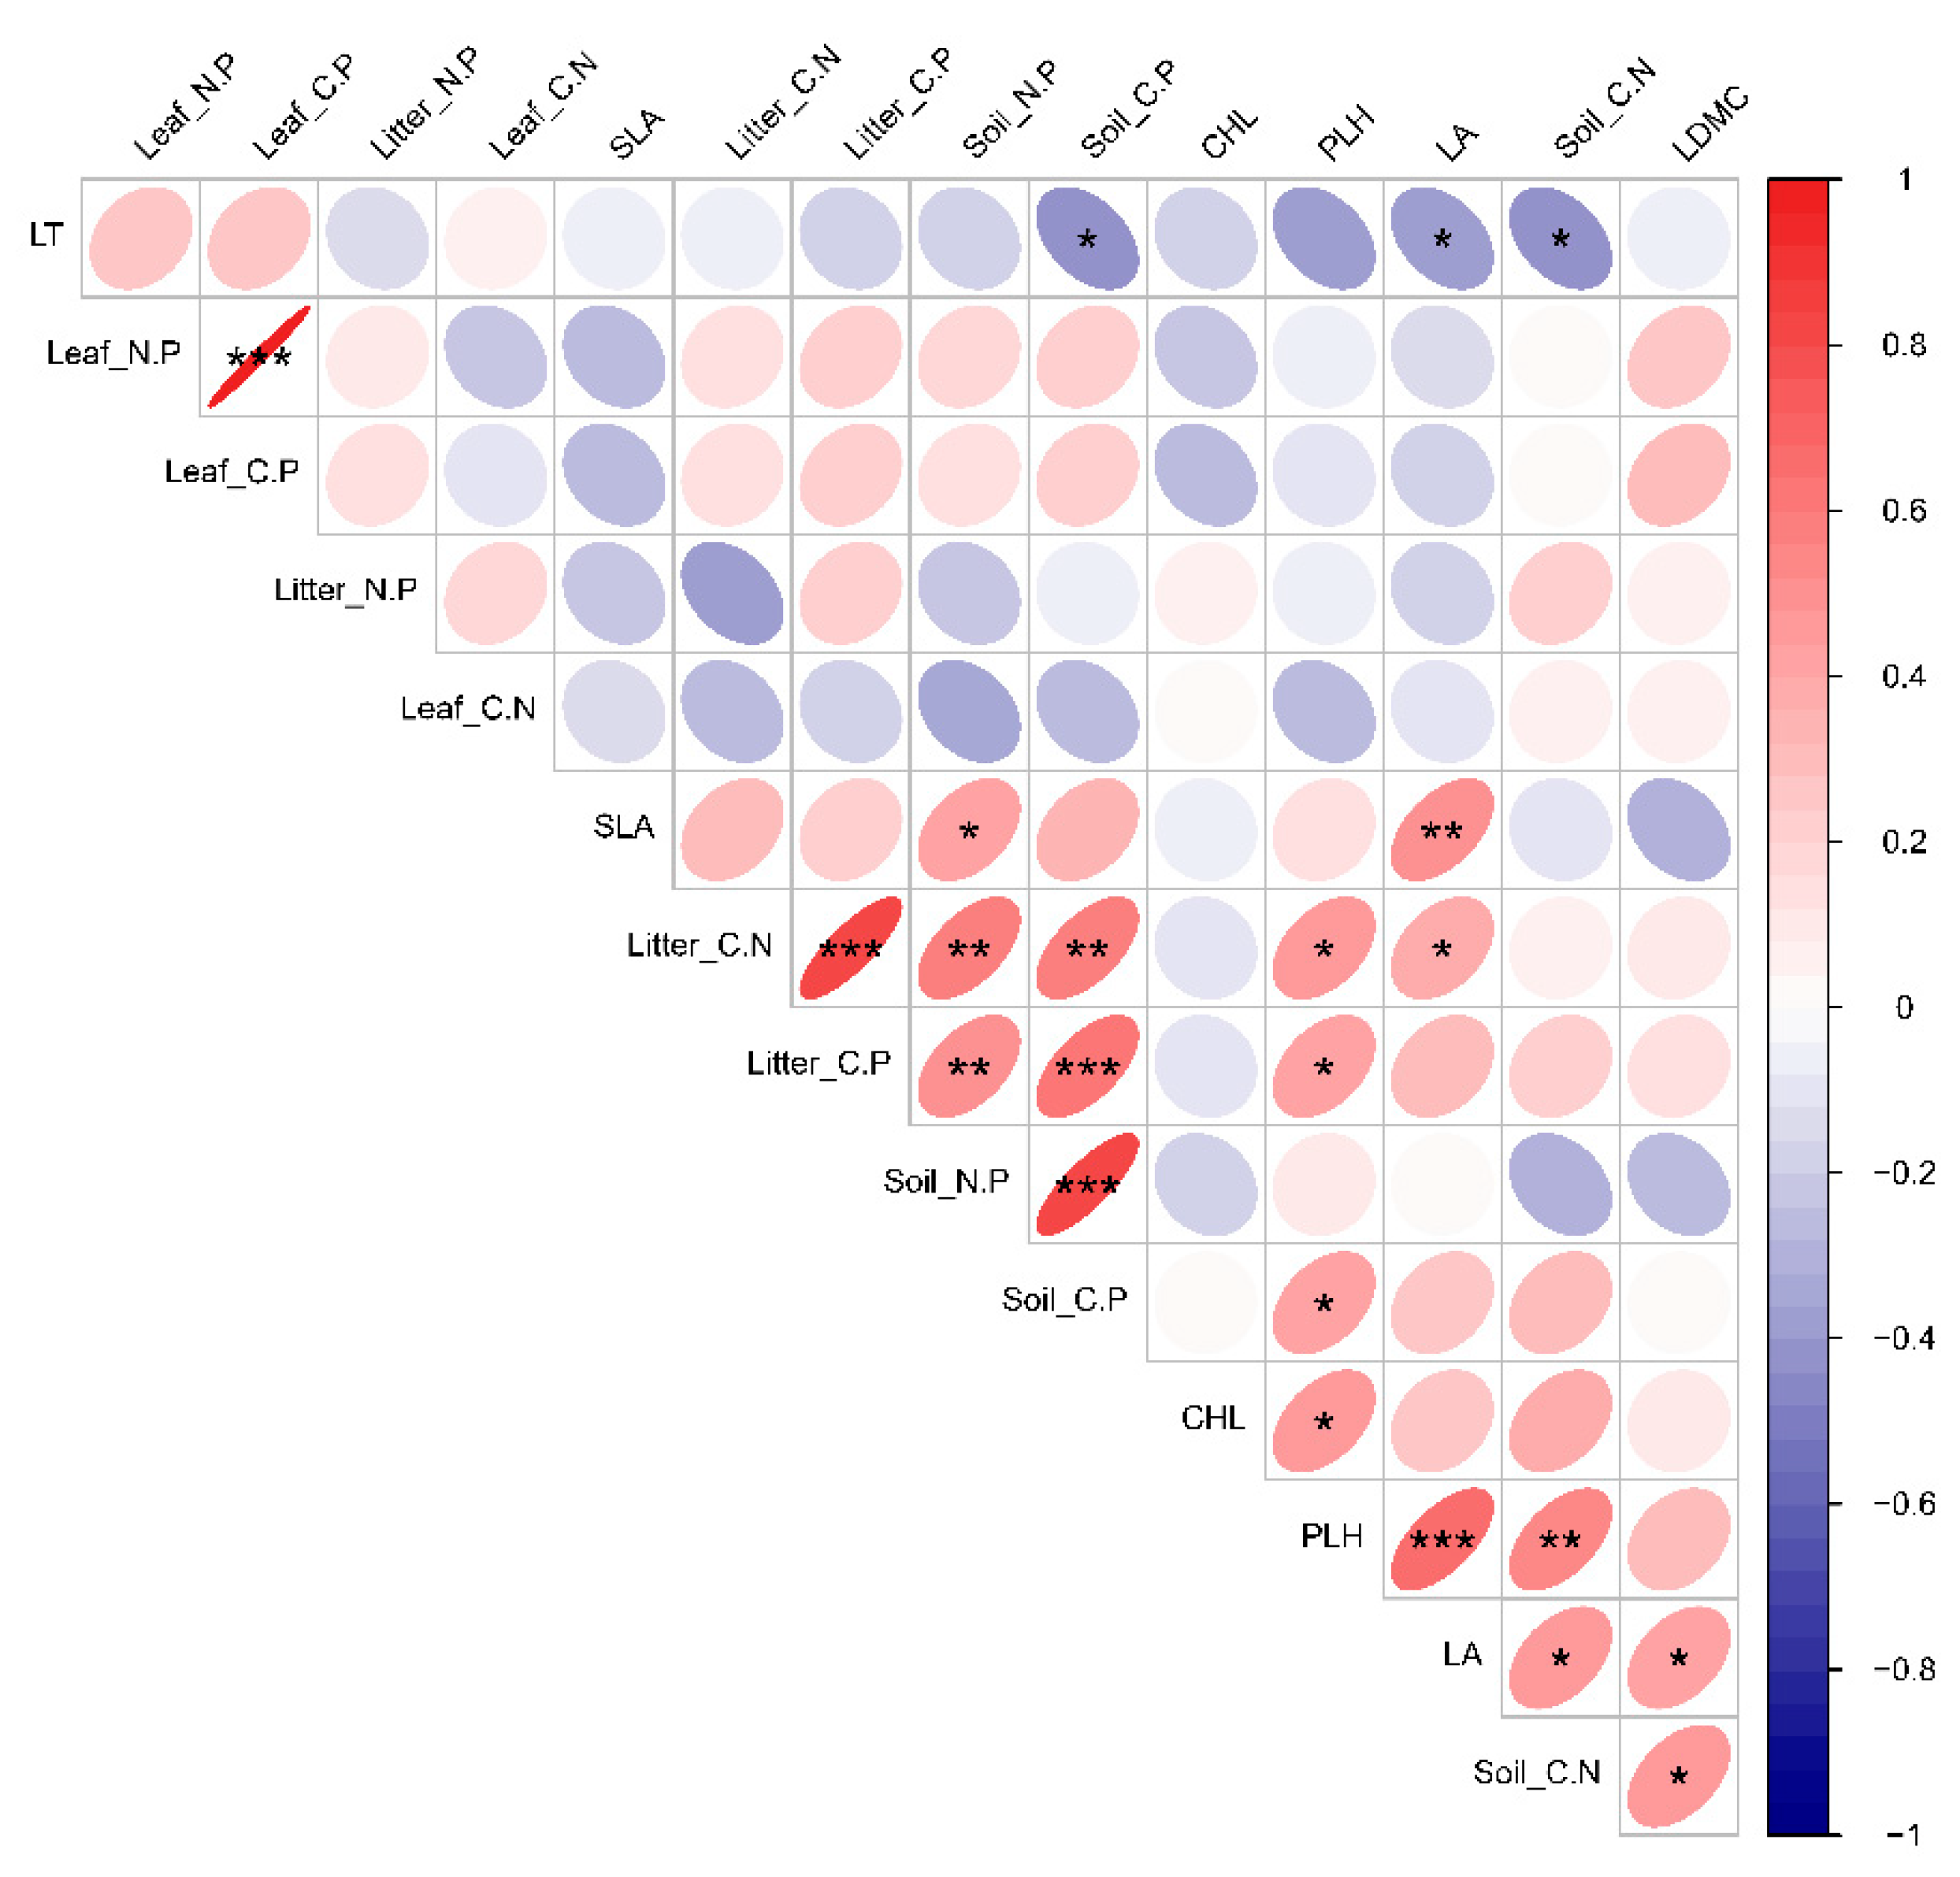
3.4. Relationships between Functional Traits of Dominant Species and Deciduous Leaf-Litter–Soil Ecological Stoichiometry in Plant Communities with Different Life Forms
4. Discussion
4.1. Changes in Functional Traits of Dominant Species in Plant Communities with Different Life Forms in Karst Areas
4.2. Changes in C, N, and P in the Leaf-Litter–Soil Ecological Stoichiometry of Dominant Species in Plant Communities with Different Life Forms in Karst Areas
4.3. Ecological Stoichiometric Correlations between Functional Traits of Dominant Species and Leaf Litter–Soil Interactions in Karst Areas with Plant Communities of Different Life Forms
5. Conclusions
- (1)
- The functional traits of various life forms within plant communities in karst regions demonstrate adaptation to environmental changes through diverse expressions and survival strategies. The growth of various plant communities in karst areas is more likely to be constrained by phosphorus (P), and the potential for apomictic decomposition and soil nutrient mineralization is comparatively weaker.
- (2)
- The functional traits of various life forms within karst plant communities exhibit greater sensitivity to soil C: N and apomictic C:N. Disparities in habitat may influence the ecological stoichiometry of the plant leaf–apomictic soil continuum.
Author Contributions
Funding
Data Availability Statement
Conflicts of Interest
References
- Liu, X.J.; Ma, K.P. Plant functional traits-concepts, applications and future directions. Sci. Sin. Vitae 2015, 45, 325–339. [Google Scholar] [CrossRef]
- Diaz, S.; Lavorel, S.; de Bello, F.; Quetier, F.; Grigulis, K.; Robson, T.M. Incorporating plant functional diversity effects in ecosystem service assessments. Proc. Natl. Acad. Sci. USA 2007, 104, 20684–20689. [Google Scholar] [CrossRef]
- Portela, A.P.; Durance, I.; Vieira, C.; Honrado, J. Response-effect trait overlap and correlation in riparian plant communities suggests sensitivity of ecosystem functioning and services to environmental change. Sci. Total Environ. 2023, 860, 160549. [Google Scholar] [CrossRef]
- Gladstone-Gallagher, R.V.; Pilditch, C.A.; Stephenson, F.; Thrush, S.F. Linking traits across ecological scales determines functional resilience. Trends Ecol. Evol. 2019, 34, 1080–1091. [Google Scholar] [CrossRef] [PubMed]
- Tsakalos, J.L.; Renton, M.; Riviera, F.; Veneklaas, E.J.; Dobrowolski, M.P.; Mucina, L. Trait-based formal definition of plant functional forms and functional communities in the multi-species and multi-traits context. Ecol. Complex. 2019, 40, 100787. [Google Scholar] [CrossRef]
- Wang, Y.; Zhang, L.; Chen, J.; Feng, L.; Li, F.; Yu, L. Study on the relationship between functional characteristics and environmental factors in karst plant communities. Ecol. Evol. 2022, 12, e9335. [Google Scholar] [CrossRef]
- Wang, Y.; Zhang, L.; Chen, J.; Feng, L.; Li, F.; Yu, L. Functional diversity of plant communities in relationship to leaf and soil stoichiometry in karst areas of southwest China. Forests 2022, 13, 864. [Google Scholar] [CrossRef]
- Lu, Z.; Wang, P.; Ou, H.; Wei, S.; Wu, L.; Jiang, Y.; Wang, R.; Liu, X.; Wang, Z.; Chen, L.; et al. Effects of different vegetation restoration on soil nutrients, enzyme activities, and microbial communities in degraded karst landscapes in southwest China. Forest Ecol. Manag. 2022, 508, 120002. [Google Scholar] [CrossRef]
- Liu, C.; Li, Y.; Yan, P.; He, N. How to improve the predictions of plant functional traits on ecosystem functioning? Front. Plant Sci. 2021, 12, 622260. [Google Scholar] [CrossRef] [PubMed]
- Wang, J.; Wang, Y.; He, N.; Ye, Z.; Chen, C.; Zang, R.; Feng, Y.; Lu, Q.; Li, J. Plant functional traits regulate soil bacterial diversity across temperate deserts. Sci. Total Environ. 2020, 715, 136976. [Google Scholar] [CrossRef]
- He, J.S.; Han, X.G. Ecological stoichiometry: Searching for unifying principle from individuals to ecosystems. Chin. J. Plan Ecol. 2010, 34, 2–6. [Google Scholar] [CrossRef]
- Elser, J.J.; Fagan, W.F.; Kerkhoff, A.J.; Swenson, N.G.; Enquist, B.J. Biological stoichiometry of plant production: Metabolism, scaling and ecological response to global change. New Phytol. 2010, 186, 593–608. [Google Scholar] [CrossRef]
- Wang, S.J. An outline of karst geomorphology zoning in the karst areas of southern China. Bull. Mineral. Petrol. Geochem. 2003, 33, 120–126. [Google Scholar] [CrossRef]
- Zeng, D.H.; Chen, G.S. Ecological stoichiometry: A science to explore the complexity of living systems. Acta Ecol. Sin. 2005, 29, 1007–1019. [Google Scholar] [CrossRef]
- Wang, L.J.; Wang, P.; Sheng, M.Y. Stoichiometry characteristics of soil nutrient elements and its influencing factors in typical in karst rocky desertification ecosystems, southwest China. Acta Ecol. Sin. 2018, 38, 6580–6593. [Google Scholar] [CrossRef]
- Yang, D.L.; Yu, Y.H.; Qin, S.Y.; Zhong, X.P. Contents and ecological stoichiometry characteristics of soil nutrients under different land utilization forms in stony desertification area. Southwest Chin. J. Agric. Sci. 2018, 31, 1875–1881. [Google Scholar] [CrossRef]
- Liu, N.; Yu, L.F.; Zhao, Q.; Wu, Y.N.; Yan, L.B. C: N: P stoichiometry of leaf-litter-soil continuum in secondary forests of the rocky desertification regions of the karst plateau. Chin. J. Appl. Environ. Biol. 2020, 26, 681–688. [Google Scholar] [CrossRef]
- Han, W.; Fang, J.; Guo, D.; Zhang, Y. Leaf nitrogen and phosphorus stoichiometry across 753 terrestrial plant species in China. New Phytol. 2005, 168, 377–385. [Google Scholar] [CrossRef]
- Wang, S.Q.; Yu, G.R. Ecological stoichiometry characteristics of ecosystem carbon, nitrogen and phosphorus elements. Acta Ecol. Sin. 2008, 28, 3937–3947. [Google Scholar] [CrossRef]
- Guittar, J.; Goldberg, D.; Klanderud, K.; Telford, R.J.; Vandvik, V. Can trait patterns along gradients predict plant community responses to climate change? Ecology 2016, 97, 2791–2801. [Google Scholar] [CrossRef] [PubMed]
- Li, J.X.; Xu, W.T.; Xiong, G.M.; Wang, Y.; Zhao, C.M.; Lu, Z.J.; Li, Y.L.; Xie, Z.Q. Leaf nitrogen and phosphorus concentration and the empirical regulations in dominant woody plants of shrublands across southern China. Chin. J. Plant Ecol. 2017, 41, 31–42. [Google Scholar]
- Zhong, Q.L.; Liu, L.B.; Xu, X.; Yang, Y.; Guo, Y.M.; Xu, H.Y.; Cai, X.L.; Ni, J. Variations of plant functional traits and adaptive strategy of woody species in a karst forest of central Guizhou province, southwestern China. Chin. J. Plant Ecol. 2018, 42, 562–572. [Google Scholar] [CrossRef]
- He, N.; Li, Y.; Liu, C.; Xu, L.; Li, M.; Zhang, J.; He, J.; Tang, Z.; Han, X.; Ye, Q.; et al. Plant trait networks: Improved resolution of the dimensionality of adaptation. Trends Ecol. Evol. 2020, 35, 908–918. [Google Scholar] [CrossRef]
- Yu, Y.H.; Zhong, X.P.; Zheng, W.; Chen, Z.X.; Wang, J.X. Species diversity, functional traits, stoichiometry and correlation of plant communities in different succession stages of karst forest. Acta Ecol. Sin. 2021, 41, 2408–2417. [Google Scholar] [CrossRef]
- Yan, M.M.; Zhou, Z.; Wang, J.; Gu, X.P.; Xiao, J.Y. Study on the dynamic change of soil moisture in karst area: A case of Huaxi district in Guiyang city. Carsol. Sin. 2016, 35, 446–452. [Google Scholar]
- Wang, Y.; Chen, J.; Zhang, L.; Feng, L.; Yan, L.; Li, F.; Zhao, X.; Yu, L.; Liu, N. Relationship between diversity and stability of a karst plant community. Ecol. Evol. 2022, 12, e9254. [Google Scholar] [CrossRef] [PubMed]
- Sheng, M.Y.; Xiong, K.N.; Cui, G.Y.; Liu, Y. Plant diversity and soil physical-chemical properties in karst rocky desertification ecosystem of Guizhou, China. Acta Ecol. Sin. 2015, 35, 434–448. [Google Scholar] [CrossRef]
- Pérezharguindeguy, N.; Díaz, S.; Garnier, E. New handbook for standardised measurement of plant functional traits worldwide. Aust. J. Bot. 2013, 61, 167–234. [Google Scholar] [CrossRef]
- Bao, S.D. Soil Agrochemical Analysis, 3rd ed.; Agricultural Press: Beijing, China, 2005; pp. 45–52. [Google Scholar]
- NY/T2017-2011; Determination of Nitrogen, Phosphorus and Potassium in Plants. Ministry of Agriculture: Beijing, China, 2011.
- LY/T1228-2015; Determination of Nitrogen in Forest Soil. Ministry of Agriculture: Beijing, China, 2015.
- LY/T1232-2015; Phosphorus Determination Methods of Forest Soils. Ministry of Agriculture: Beijing, China, 2015.
- The SPSSAU Project. SPSSAU, Version 25.0. 2022. Online Application Software. Available online: https://www.spssau.com (accessed on 12 February 2024).
- R Core Team. R: A Language and Environment for Statistical Computing. R Foundation for Statistical Computing. 2020. Available online: https://www.R-project.org/ (accessed on 12 February 2024).
- Wang, J.; Zhu, J.; Ai, X.R.; Yao, L.; Huang, X.; Wu, M.L.; Zhu, Q.; Hong, J.F. Effects of topography on leaf functional traits across plant life forms in Xingdou mountain, Hubei, China. Chin. J. Plant Ecol. 2019, 43, 447–457. [Google Scholar] [CrossRef]
- Yao, X.Y.; Hu, Y.S.; Liu, Y.H. Plant function traits and functional diversities of different communities in broad-leaved Korean pine forests in the Changbai mountain. Nat. Sci. Ed. 2014, 42, 77–84. [Google Scholar] [CrossRef]
- Kong, L.W.; Yu, Y.H.; Xiong, K.N.; Wei, C.S.; Zhang, S.H. Leaf functional traits of Zanthoxylum planispinum var. dintanensis and their response to management measures. J. Forest Environ. 2022, 42, 364–373. [Google Scholar] [CrossRef]
- Shui, W.; Guo, P.P.; Zhu, S.F.; Feng, J.; Sun, X.; Li, H. Variation of plant functional traits and adaptive strategy of woody species in degraded karst Tiankeng of Yunnan province. Sci. Geogra. Sin. 2022, 42, 1295–1306. [Google Scholar] [CrossRef]
- Koerselman, W.; Meuleman, A. The vegetation N:P ratio: A new tool to detect the nature of nutrient limitation. J. Appl. Ecol. 1996, 33, 1441–1450. [Google Scholar] [CrossRef]
- Han, W.X.; Wu, Y.; Tang, L.Y.; Chen, Y.H.; Li, L.P.; He, J.S.; Fang, J.Y. Leaf carbon, nitrogen and phosphorus stoichiometry across plant species in Beijing and its periphery. Acta Scin. Nat. Univ. Pekinensis 2009, 45, 855–860. [Google Scholar] [CrossRef]
- Pan, F.J.; Zhang, W.; Wang, K.L.; He, X.Y.; Liang, S.C.; Wei, G.F. Litter C:N:P ecological stoichiometry character of plant communities in typical karst Peak-Cluster depression. Acta Ecol. Sin. 2011, 31, 335–343. [Google Scholar]
- Song, Y.F.; Lu, Y.J.; Liu, T.J.; Liu, H.W.; Yan, Z.Y.; Wang, H.Q. Soil-plant-microbial C, N, P and their stoichiometric characteristics in different rainfall zones of desert steppe. Acta Ecol. Sin. 2020, 40, 4011–4023. [Google Scholar]
- Li, F.L.; Bao, W.K. Responses of the morphological and anatomical structure of the plant leaf to environmental change. Chin. Bull. Bot. 2005, 23, 118–127. [Google Scholar]
- Xu, Y.S.; Huang, H.X.; Shi, Q.R.; Yang, X.D.; Zhou, L.L.; Zhao, Y.T.; Zhang, Q.Q.; Yan, E.R. Response of soil water content to change in plant functional traits in evergreen broadleaved forests in eastern Zhejiang province. J. Plant Ecol. 2015, 39, 857–866. [Google Scholar] [CrossRef]
- Jiang, S.; Zhang, J.; Tang, Y.; Li, Z.; Liu, H.; Wang, L.; Wu, Y.; Liang, C. Plant functional traits and biodiversity can reveal the response of ecosystem functions to grazing. Sci. Total Environ. 2023, 899, 165636. [Google Scholar] [CrossRef]
- He, J.; Tian, Q.; Song, L.L. Community characteristics of herbaceous plants and analysis of C, N and P contents of main plant functional groups in high altitude area on the northern slope of Minshan Mountains. Ecol. Environ. Sci. 2020, 29, 489–497. [Google Scholar] [CrossRef]
- Zhou, G.; Xu, S.; Ciais, P.; Manzoni, S.; Fang, J.; Yu, G.; Tang, X.; Zhou, P.; Wang, W.; Yan, J.; et al. Climate and litter C/N ratio constrain soil organic carbon accumulation. Natl. Sci. Rev. 2019, 6, 746–757. [Google Scholar] [CrossRef]
- Funk, J.L.; Standish, R.J.; Stock, W.D.; Valladares, F. Plant functional traits of dominant native and invasive species in mediterranean-climate ecosystems. Ecology 2016, 97, 75–83. [Google Scholar] [CrossRef] [PubMed]
- Guo, Z.W.; Chen, S.L.; Yang, Q.P.; Li, Y.C. Effects of stand density on Oligostachyum lubricum leaf carbon, nitrogen, and phosphorus stoichiometry and nutrient resorption. Chin. J. Appl. Ecol. 2013, 24, 893–899. [Google Scholar] [CrossRef]
- Ma, K.; Guo, Q. Progress and recent trends of vegetation ecology in China. Sci. Sin. Vitae 2021, 51, 215–218. [Google Scholar] [CrossRef]
- Zhang, X.; Li, B.; Peñuelas, J.; Sardans, J.; Cheng, D.; Yu, H.; Zhong, Q. Resource-acquisitive species have greater plasticity in leaf functional traits than resource-conservative species in response to nitrogen addition in subtropical China. Sci. Total Environ. 2023, 903, 166177. [Google Scholar] [CrossRef] [PubMed]
- Chen, L.L.; Deng, Q.; Yuan, Z.Y.; Mu, X.M.; Kallenbach, R.L. Age-related C: N: P stoichiometry in two plantation forests in the loess Plateau of China. Ecol. Eng. 2018, 120, 857–866. [Google Scholar] [CrossRef]
- Zhang, Z.H.; Hu, G.; Zhu, J.D.; Ni, J. Scale-dependent spatial variation of species abundance and richness in two mixed evergreen-deciduous broad-leaved karst forests, southwest China. Acta Ecol. Sin. 2012, 32, 5663–5672. [Google Scholar] [CrossRef]


Disclaimer/Publisher’s Note: The statements, opinions and data contained in all publications are solely those of the individual author(s) and contributor(s) and not of MDPI and/or the editor(s). MDPI and/or the editor(s) disclaim responsibility for any injury to people or property resulting from any ideas, methods, instructions or products referred to in the content. |
© 2024 by the authors. Licensee MDPI, Basel, Switzerland. This article is an open access article distributed under the terms and conditions of the Creative Commons Attribution (CC BY) license (https://creativecommons.org/licenses/by/4.0/).
Share and Cite
Wang, Y.; Zhang, L.; Feng, L.; Fan, Z.; Deng, Y.; Feng, T. Influence of Functional Traits of Dominant Species of Different Life Forms and Plant Communities on Ecological Stoichiometric Traits in Karst Landscapes. Plants 2024, 13, 2407. https://doi.org/10.3390/plants13172407
Wang Y, Zhang L, Feng L, Fan Z, Deng Y, Feng T. Influence of Functional Traits of Dominant Species of Different Life Forms and Plant Communities on Ecological Stoichiometric Traits in Karst Landscapes. Plants. 2024; 13(17):2407. https://doi.org/10.3390/plants13172407
Chicago/Turabian StyleWang, Yang, Limin Zhang, Ling Feng, Zuhong Fan, Ying Deng, and Tu Feng. 2024. "Influence of Functional Traits of Dominant Species of Different Life Forms and Plant Communities on Ecological Stoichiometric Traits in Karst Landscapes" Plants 13, no. 17: 2407. https://doi.org/10.3390/plants13172407
APA StyleWang, Y., Zhang, L., Feng, L., Fan, Z., Deng, Y., & Feng, T. (2024). Influence of Functional Traits of Dominant Species of Different Life Forms and Plant Communities on Ecological Stoichiometric Traits in Karst Landscapes. Plants, 13(17), 2407. https://doi.org/10.3390/plants13172407