Article

Pleiotropic Quantitative Trait Loci (QTL) Mining for Regulating Wheat Processing Quality- and Yield-Related Traits

by
Jie Zhao
1,†,
Lijing Sun
1,†,
Mengyun Hu
1,
Qian Liu
1,
Junjie Xu
1,
Liming Mu
2,
Jianbing Wang
2,
Jing Yang
1,
Peinan Wang
1,
Qianying Li
1,
Hui Li
1 and
Yingjun Zhang
1,*
1
Hebei Key Laboratory of Crop Genetics and Breeding, Institute of Cereal and Oil Crops, Hebei Academy of Agriculture and Forestry Sciences, Shijiazhuang 050035, China
2
Dingxi Academy of Agricultural Sciences, Dingxi 743000, China
*
Author to whom correspondence should be addressed.
These authors contributed equally to this work.
Plants 2024, 13(18), 2545; https://doi.org/10.3390/plants13182545
Submission received: 5 July 2024 / Revised: 12 August 2024 / Accepted: 9 September 2024 / Published: 10 September 2024
(This article belongs to the Section Plant Molecular Biology)

Abstract

:
To investigate the genetic basis of processing quality- and yield-related traits in bread wheat (Triticum aestivum L., AABBDD), a systematic analysis of wheat processing quality- and yield-related traits based on genome-wide association studies (GWASs) of 285 regional test lines of wheat from Hebei province, China, was conducted. A total of 87 quantitative trait loci (QTL), including twenty-one for water absorption (WA), four for wet gluten content, eight for grain protein content, seventeen for dough stability time (DST), thirteen for extension area (EA), twelve for maximum resistance (MR), five for thousand-grain weight (TGW), one for grain length, and six for grain width were identified. These QTL harbored 188 significant single-nucleotide polymorphisms (SNPs). Twenty-five SNPs were simultaneously associated with multiple traits. Notably, the SNP AX-111015470 on chromosome 1A was associated with DST, EA, and MR. SNPs AX-111917292 and AX-109124553 on chromosome 5D were associated with wheat WA and TGW. Most processing quality-related QTL and seven grain yield-related QTL identified in this study were newly discovered. Among the surveyed accessions, 18 rare superior alleles were identified. This study identified significant QTL associated with quality-related and yield-related traits in wheat, and some of them showed pleiotropic effects. This study will facilitate molecular designs that seek to achieve synergistic improvements of wheat quality and yield.

1. Introduction

Bread wheat (Triticum aestivum L., AABBDD) feeds over 35% of the world’s population and is a crucial source of carbohydrates, proteins, minerals, and vitamins for humans [1]. Thus, improvements in wheat yield and quality are key considerations for wheat breeders. The main yield-related traits of wheat grain are thousand-grain weight (TGW), grain length (GL), and grain width (GW); the end-use quality of wheat is mainly determined by protein- and starch-related traits, such as grain protein content (GPC) and dough rheological properties. GPC is a primary determinant of wheat nutritional value and baking quality [2]; therefore, it is a key marketing characteristic. Gluten, a complex mixture of polymeric glutenins and monomeric gliadins, confers viscosity and elasticity to dough; accordingly, it is the most important wheat protein. The rheological property of dough, an indicator of its processing quality for noodles, steamed buns, breads, cakes, and other final products [3], can be assessed using farinographic and extensographic parameters [1]. Farinographic parameters include water absorption (WA), dough development time (DDT), and dough stability time (DST), which are used to assess kneading characteristics [4]. Extensographic parameters include the extension area (EA) and maximum resistance (MR), which comprise indicators of dough quality during proofing.
The underlying genetic architecture of grain yield [2,5,6,7,8] and the end-use quality traits [1,4,9,10,11,12] of wheat have been evaluated in multiple quantitative trait loci (QTL) mapping studies. Both relatively high-frequency QTL and significant QTL clusters have been identified. For example, eight stable loci on chromosomes 2A, 2D, 3B, 4A, 5B, 5D, and 7D were mapped in wheat grown under different environmental conditions, revealing associations with wheat yield [13]. Significant QTL for GPC and wet gluten content (WGC), explaining 53.04% and 36% of the phenotypic variation, respectively, were identified on chromosome 5A [14]; chromosomes 3B and 4D each harbored one QTL cluster (for milling quality and starch functionality, respectively) [15]. Major QTL for starch content, WGC, and the Zeleny sedimentation value were detected on chromosome 5D [16]. Lou identified 64 stable quality-related QTL, including some with pleiotropic effects, on chromosomes 6A and 5D [11].
Rapid developments in sequencing technology and high-density marker genotyping have enhanced the use of the genome-wide association study (GWAS) in efforts to determine the genetic basis of quantitative variation in complex traits among species such as wheat [17,18]. A GWAS is more efficient than traditional biparental linkage mapping analyses in terms of analyzing complex traits; the detected markers have a higher degree of polymorphism, more uniform distribution, and greater repeatability. In wheat, GWAS has been used to detect quality-associated loci, including GPC [19,20,21], WA [14,20,22], WGC [11], DDT [22], and DST [22]. A GWAS of 372 diverse European wheat varieties identified two major loci for GPC [21]. Using a GWAS approach, Guo identified 29 unconditional QTL and 13 conditional QTL for GPC, glutenin macropolymer content, amylopectin content, and amylose content during wheat grain development [23]. Similarly, Yang identified 40 core quantitative trait nucleotide (QTN) regions for six grain quality traits and three dough rheological properties [12]. However, considering the complexity of detecting wheat quality-related traits and the effects of genetic background on wheat populations, the contributions of most previously identified QTL were small and their phenotypic accuracies were low, thus limiting the application of quality-related QTL in wheat breeding [24]. Additionally, neither the extenso-graph parameters for dough nor the genetic basis of the synergistic regulation of wheat grain yield and quality have been adequately investigated.
In this study, a QTL analysis using the wheat 15K SNP array was performed for six quality-related traits (WA, WGC, GPC, DST, EA, and MR) and three grain yield-related traits (TGW, GL, GW) across 285 regional test lines of wheat in China. We aimed to use the GWAS approach to identify QTL for quality- and yield-related traits, thereby identifying important QTL for use in wheat breeding programs. A second QTL analysis was performed for wheat quality and yield traits such as GPC, dough rheological properties, and grain weight and shape; we sought to determine their relationships at the QTL level and detect trade-offs between grain yield and quality.

2. Results

2.1. Phenotype Assessments

Significant differences in the nine detected traits were identified among the test lines of wheat. The average WA, WGC, GPC, DST, EA, MR, TGW, GL, and GW in the surveyed accessions were 60.68% (range: 53.60–69.00%), 29.99% (22.50–45.20%), 14.68% (12.20–17.40%), 11.04 min (1.20–47.40 min), 72.34 cm2 (19.00–227.00 cm2), 351.10 EU (72.00–989.00 EU), 38.08 g (27.11–50.23 g), 6.35 mm (5.49–7.00 mm), and 3.16 mm (2.74–3.56 mm), respectively. The coefficient of variation ranged from 4.59% to 78.05%, indicating large differences in the detected traits for all genotypes (Table 1).
In pairwise analyses of correlations between the detected traits (Figure 1), positive correlations were identified in all comparisons of GPC, DST, EA, and MR (GPC vs. DST: r = 0.50 ***, GPC vs. EA: r = 0.46 ***, GPC vs. MR: r = 0.39 ***, DST vs. EA: r = 0.76 ***, DST vs. MR: r = 0.76 ***, and EA vs. MR: r = 0.98 ***). WA was positively correlated with WGC (r = 0.28 ***), TGW (r = 0.51 ***), and GW (r = 0.46 ***). Weakly positive correlations were detected between WA and GPC (r = 0.13 *) and between WA and GL (r = 0.17 *); WA displayed negative correlations with DST (r = −0.27 ***), EA (r = −0.47 ***), and MR (r = −0.51 ***). WGC was positively correlated with GPC (r = 0.53 ***) and weakly positively correlated with TGW (r = 0.19 *), GL (r = 0.14 *), and GW (r = 0.16 *); it showed a weakly negative correlation with MR (r = −0.16 *) but no significant correlations with DST or EA. TGW, GL, and GW exhibited negative correlations with GPC, DST, EA, and MR, with r values ranging from −0.33 to −0.60. In all pairwise comparisons of TGW, GL, and GW, the correlations were positive (TGW vs. GL: r = 0.65 ***, TGW vs. GW: r = 0.90 ***, and GW vs. GL: r = 0.50 ***).

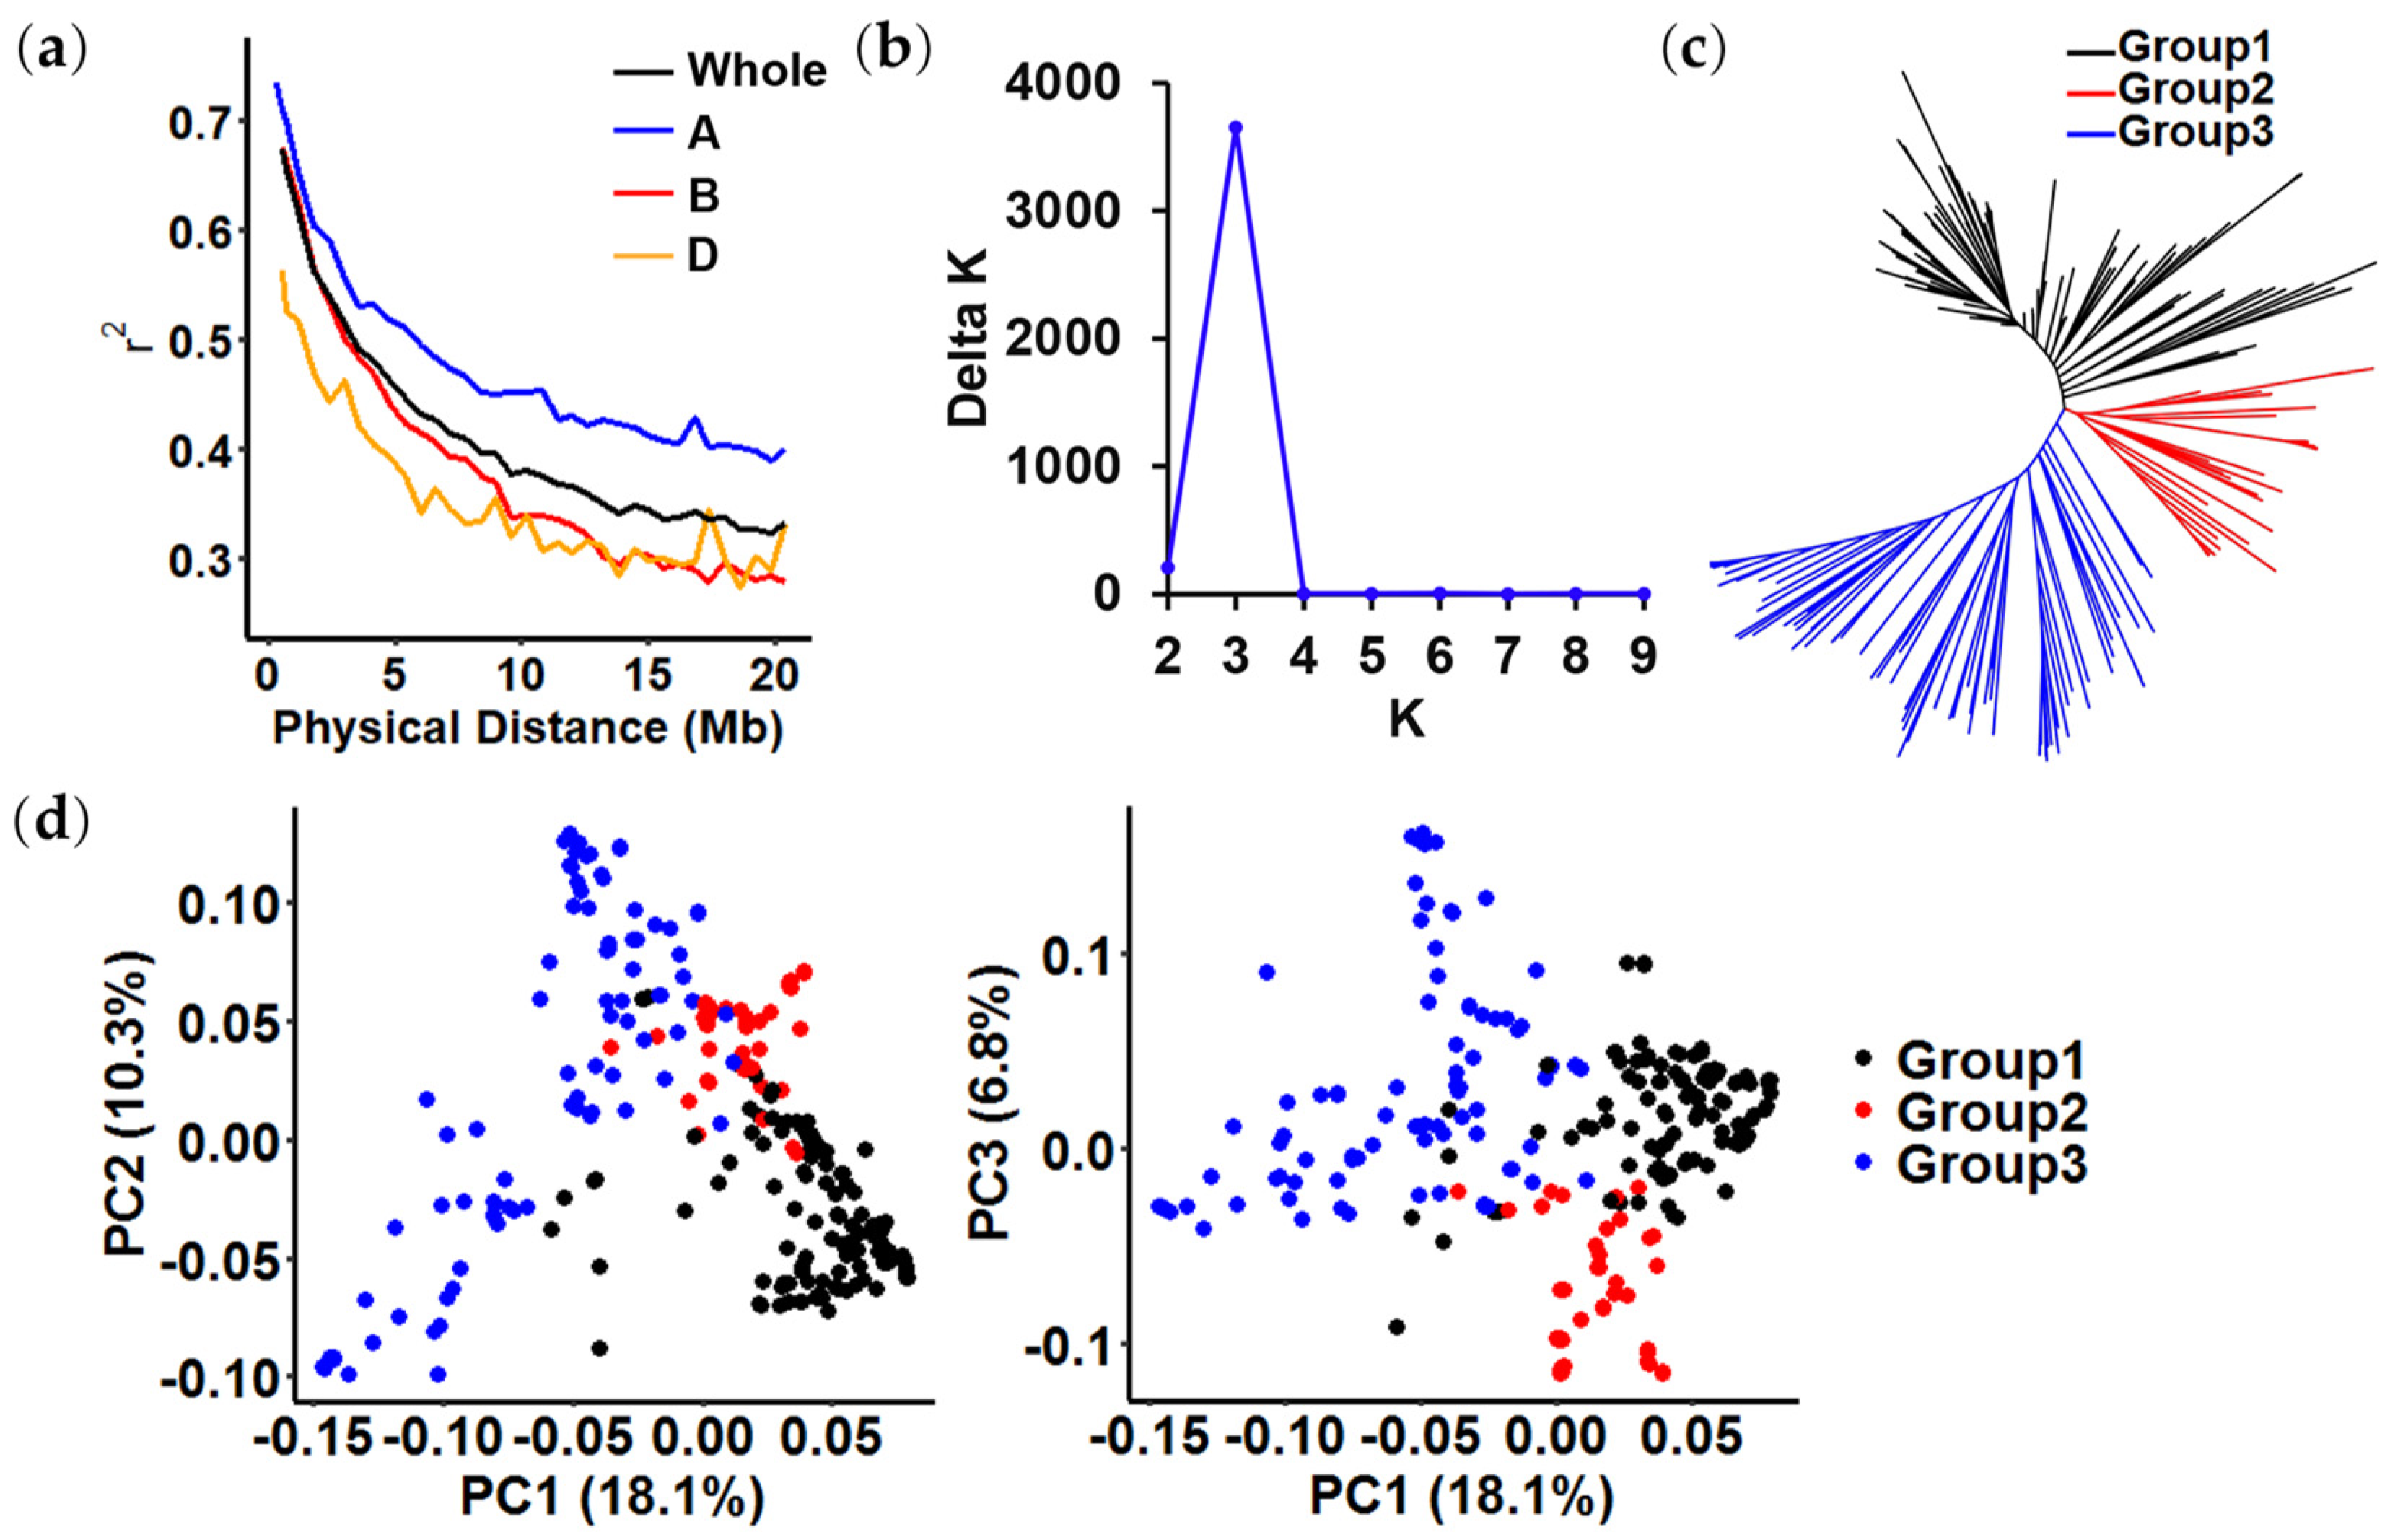
2.2. Linkage Disequilibrium (LD) Analysis and Population Structure

The average ranges of LD values for the A, B, and D sub-genomes and the whole genome, defined as the physical distance needed for r2 to decay to half of its maximum value, were approximately 20 Mb, 10 Mb, 10 Mb, and 13 Mb, respectively (Figure 2a).
Three methods were used to cluster the accessions and assess similarity, with the following results. First, the delta K value reached a sharp peak at K = 3 in the plot of K vs. ΔK, according to the Structure software (Figure 2b). Second, phylogenetic tree analysis classified the panel into three subpopulations (Figure 2c). Finally, despite sufficient admixture, principal component analysis (PCA) showed that the panel was divided into three major groups (Figure 2d).

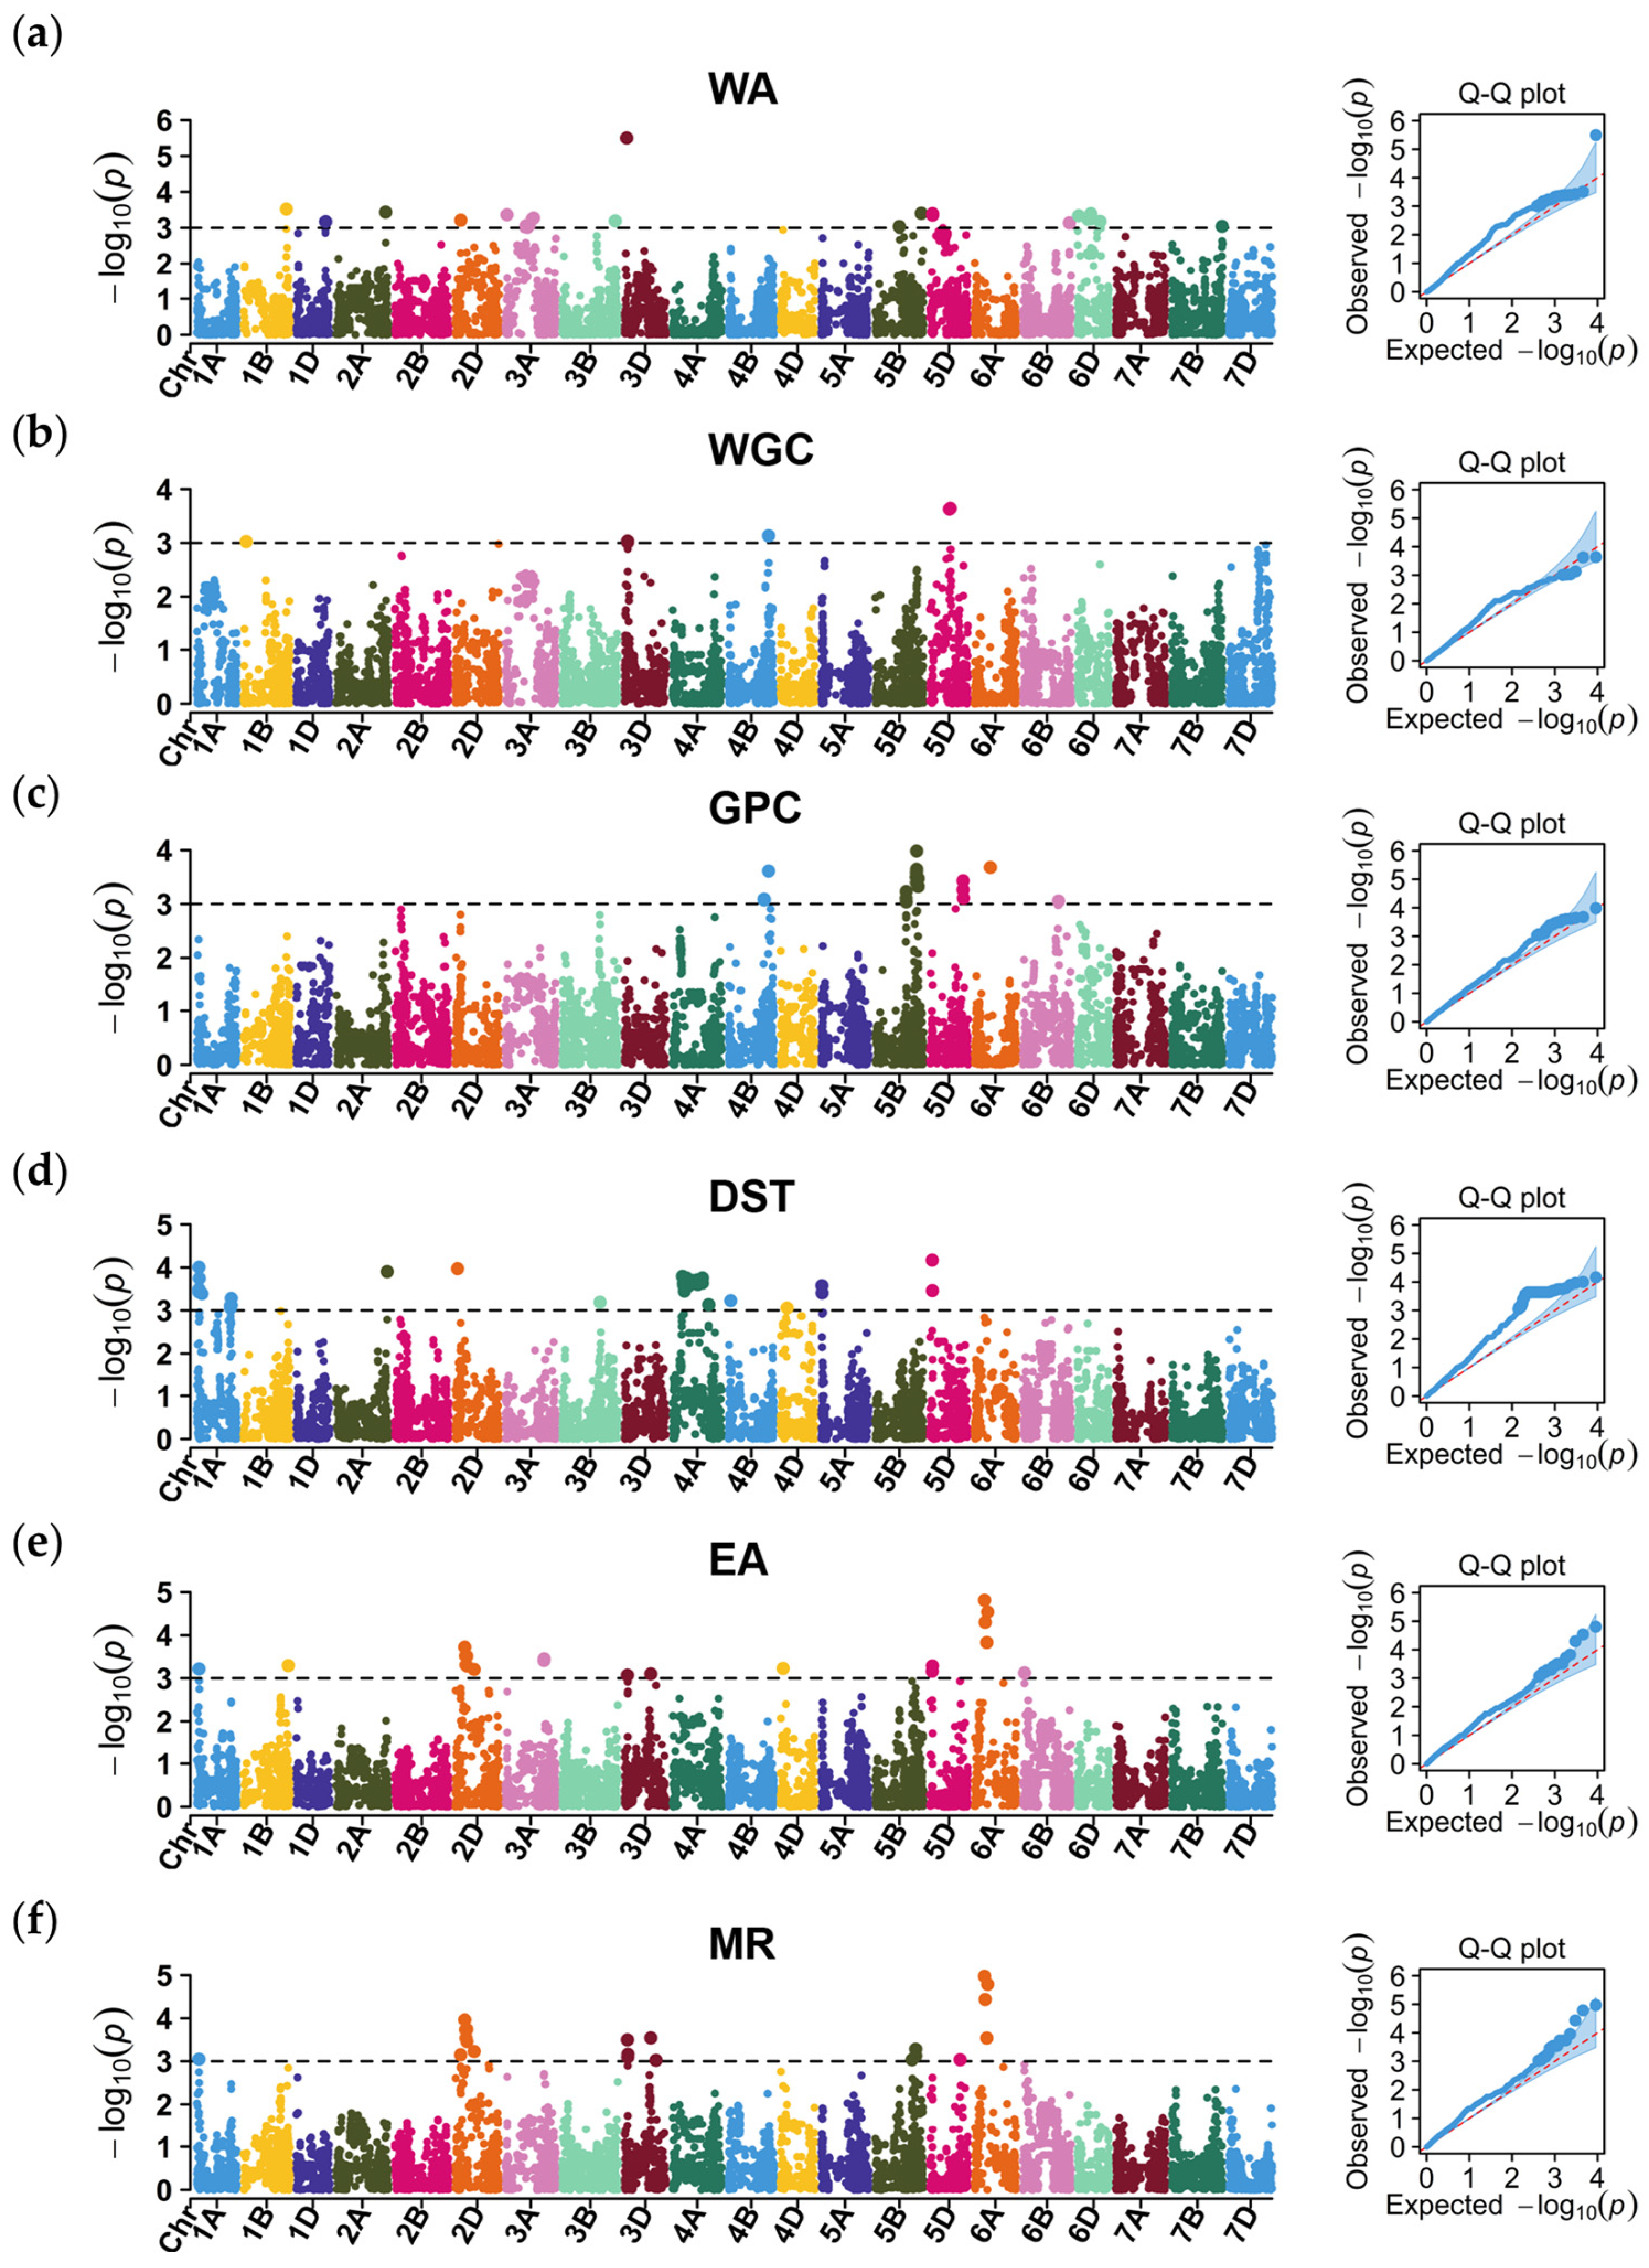
2.3. GWAS of the Grain Quality-Related Traits

The GWAS identified 162 marker–trait associations (MTAs), representing 75 QTL for grain quality traits on almost all wheat chromosomes (except 2B, 7A, and 7D) (Figure 3; Table S1).

2.3.1. Water Absorption

Twenty-one QTL for WA, represented by 24 MTAs, were detected on chromosomes 1B, 1D, 2A, 2D, 3A, 3B, 3D, 5B, 5D, 6B, 6D, and 7B (Figure 3a). Of these, chromosome 3A had six QTL for WA; these were represented by six different MTAs and explained 23.52% of the phenotypic variation. Four QTL were represented by five different MTAs, at 15.57 Mb, 152.26 Mb, 196.57–198.13 Mb, and 333.49 Mb (all on chromosome 6D), and explained 3.93–4.25% of the phenotypic variation. The QTL qWA-5B.1 and qWA-5B.2 were mapped to chromosome 5B, explaining 3.72–4.27% of the phenotypic variation. An important QTL, qWA-3D, was marked by AX-108907834, which was mapped to position 28.13 Mb on chromosome 3D and explained 7.51% of the phenotypic variation. Additionally, eight QTL, distributed on chromosomes 1B, 1D, 2A, 2D, 3B, 5D, 6B, and 7B, explained 3.73–4.45% of the phenotypic variation.

2.3.2. Wet Gluten Content

Four QTL, represented by six MTAs, were detected on chromosomes 1B, 3D, 4B, and 5D (Figure 3b). qWGC-5D, represented by two MTAs on chromosome 5D (290.06–302.00 Mb), explained 10.61% of the phenotypic variation for WGC. qWGC-3D was represented by two MTAs that mapped to position 42.30–42.41 Mb on chromosome 3D and explained 8.51% of the phenotypic variation. The QTL qWGC-1B and qWGC-4B, represented by AX-109435258 (42.30 Mb on chromosome 1B) and AX-109488694 (593.13 Mb on chromosome 4B), explained 4.26% and 4.44% of the phenotypic variation, respectively.

2.3.3. Grain Protein Content

Twenty-four MTAs were associated with eight loci and explained 3.21–4.45% of the phenotypic variation for GPC (Figure 3c). Two QTL on chromosome 4B explained 16.34% and 3.96% of the phenotypic variation, respectively. These two QTL were represented by five MTAs and one MTA, respectively. Three QTL on chromosome 5B included three (position 455.53–455.97 Mb), eight (605.16–611.93 Mb), and two (634.45–634.99 Mb) MTAs, respectively. Of these, qGPC-5B.2 was represented by eight single-nucleotide polymorphisms (SNPs) and explained 31.29% of the phenotypic variation. One QTL was represented by three SNPs, detected at 493.45–497.83 Mb on chromosome 5D and explaining 3.30–3.72% of the phenotypic variation. Additionally, two QTL marked by two different MTAs were detected on chromosomes 6A and 6B and explained 3.24% and 4.04% of the phenotypic variation, respectively.

2.3.4. Dough Stability Time

Seventeen QTL associated with DST, represented by 65 MTAs, were detected on chromosomes 1A, 2A, 2D, 3B, 4A, 4B, 4D, 5A, and 5D (Figure 3d). Three QTL (qDST-1A.1, qDST-1A.2, and qDST-1A.3) on chromosome 1A were represented by four, one, and seven MTAs, respectively, explaining 2.81–3.88% of the phenotypic variation. Three QTL (qDST-2A, qDST-2D, and qDST-3B), marked by AX-109384630, AX-94458060, and AX-109946806, respectively, explained 2.97–3.85% of the phenotypic variation. Seven QTL on chromosome 4A explained 2.90–3.64% of the phenotypic variation. These included the QTL qDST-4A.5, represented by 15 MTAs at 349.91–423.37 Mb on chromosome 4A, which explained 3.43–3.55% of the phenotypic variation. Three QTL (qDST-4A.2, qDST-4A.3, and qDST-4A.6) were represented by eight, nine, and four MTAs, respectively, explaining 3.25–3.60% of the phenotypic variation. Two QTL (qDST-4A.4 and qDST-4A.7), each represented by three different MTAs (including MTAs at 302.81–310.23 Mb and 540.34–541.33 Mb on chromosome 4A, respectively), explained 2.90–3.53% of the phenotypic variation. Finally, the QTL qDST-4A.1, represented by AX-111164022 (at 149.65 Mb on chromosome 4A), explained 3.64% of the phenotypic variation.

2.3.5. Extension Area

Thirteen QTL for EA, marked by 21 MTAs, were detected on chromosomes 1A, 1B, 2D, 3A, 3D, 4D, 5D, 6A, and 6B (Figure 3e). Among these, nine QTL—qEA-1A, qEA-1B, qEA-2D.2, qEA-3D.1, qEA-3D.2, qEA-4D, qEA-6A.2, qEA-6A.3, and qEA-6B—were represented by the MTAs AX-111015470, AX-109376365, AX-110426295, AX-110928411, AX-110000775, AX-109230716, AX-109974589, AX-110931567, and AX-108924932, respectively, explaining 2.93–4.66% of the phenotypic variation. One significant QTL, qEA-2D.1, was represented by six MTAs, which were marked at 143.23–175.28 Mb on chromosome 2D and explained 3.18–3.69% of the phenotypic variation. Furthermore, three QTL (qEA-3A, qEA-5D, and qEA-6A.1) were represented by two MTAs, respectively, explaining 3.32–4.37% of the phenotypic variation.

2.3.6. Maximum Resistance

Twelve QTL, including 22 MTAs, were detected on chromosomes 1A, 2D, 3D, 5B, 5D, and 6A; they explained 3.12–5.63% of the phenotypic variation (Figure 3f). The QTL qMR-1A and qMR-5D, represented by AX-111015470 and AX-111198874, explained 3.15% and 3.13% of the phenotypic variation, respectively. The QTL qMR-2D.1, qMR-2D.2, and qMR-2D.3, mapped to chromosome 2D, explained 3.27–4.30% of the phenotypic variation. Six MTAs marked qMR-2D.2 and collectively explained 23.75% of the phenotypic variation. Three QTL on chromosome 3D explained 3.12–3.77% of the phenotypic variation. Additionally, two QTL on chromosome 5B and another two QTL on chromosome 6A explained 3.13–3.44% and 3.76–5.63% of the phenotypic variation, respectively.

2.4. GWAS of the Grain Yield-Related Traits

The GWAS identified 26 MTAs, representing 12 QTL for TGW, GL, and GW, on chromosomes 1A, 2D, 4B, 5A, 5B, 5D, and 7D (Figure 4; Table S2).
Five QTL associated with TGW were identified on chromosomes 1A, 5A, 5B, and 5D. A key QTL, qTGW-5B, was composed of seven significant SNPs and explained 11.10% of the total phenotypic variation for TGW. Another QTL for TGW, qTGW-5D.1, was represented by two SNPs at positions 38.93–40.34 Mb on chromosome 5D. Additionally, three QTL (qTGW-1A, qTGW-5A, and qTGW-5D.2) for TGW were detected on chromosomes 1A, 5A, and 5D, respectively; they collectively explained 2.76% of the phenotypic variation.
qGL-4B, represented by the SNP AX-111057902, was located at 652.37 Mb on chromosome 4B and explained up to 5.55% of the phenotypic variation in GL.
GW was associated with six QTL on chromosomes 1A, 2D, 5A, 5B, 5D, and 7D. qGW-5A, marked by SNP AX-95213349 at position 685.43 Mb on chromosome 5A, was the most significant QTL, explaining 8.13% of the phenotypic variation. Another three QTL (qGW-1A, qGW-2D, and qGW-7D), on chromosomes 1A, 2D, and 7D, were represented by two SNPs, respectively; they explained 5.76–7.95% of the phenotypic variation for GW. Notably, the QTL qGW-5B (on chromosome 5B) and qGW-5D (on chromosome 5D) had a position similar or identical to qTGW-5B and qTGW-5D.2, respectively.

2.5. Analysis of Pleiotropic and Flour Quality-Related and Grain Yield-Related MTAs

Many MTAs were simultaneously associated with multiple traits. For example, AX-109488694, at 593.13 Mb on chromosome 4B, was associated with WGC and GPC. AX-111015470, at 29.78 Mb on chromosome 1A, was associated with DST, EA, and MR. Two MTAs (AX-110978247 and AX-89603436), at 34.79 Mb and 37.13 Mb on chromosome 5D, respectively, were associated with both DST and EA. Additionally, 13 MTAs for EA, including all MTAs detected on chromosomes 2D, 3D, and 6A, were simultaneously associated with DST. TGW had six SNPs (AX-108958865, AX-110576628, AX-108827033, AX-111672485, AX-111030246, and AX-108735670) in common with GW. Both AX-111917292 and AX-109124553, at 38.93 Mb and 40.34 Mb on chromosome 5D, were associated with WA and TGW.

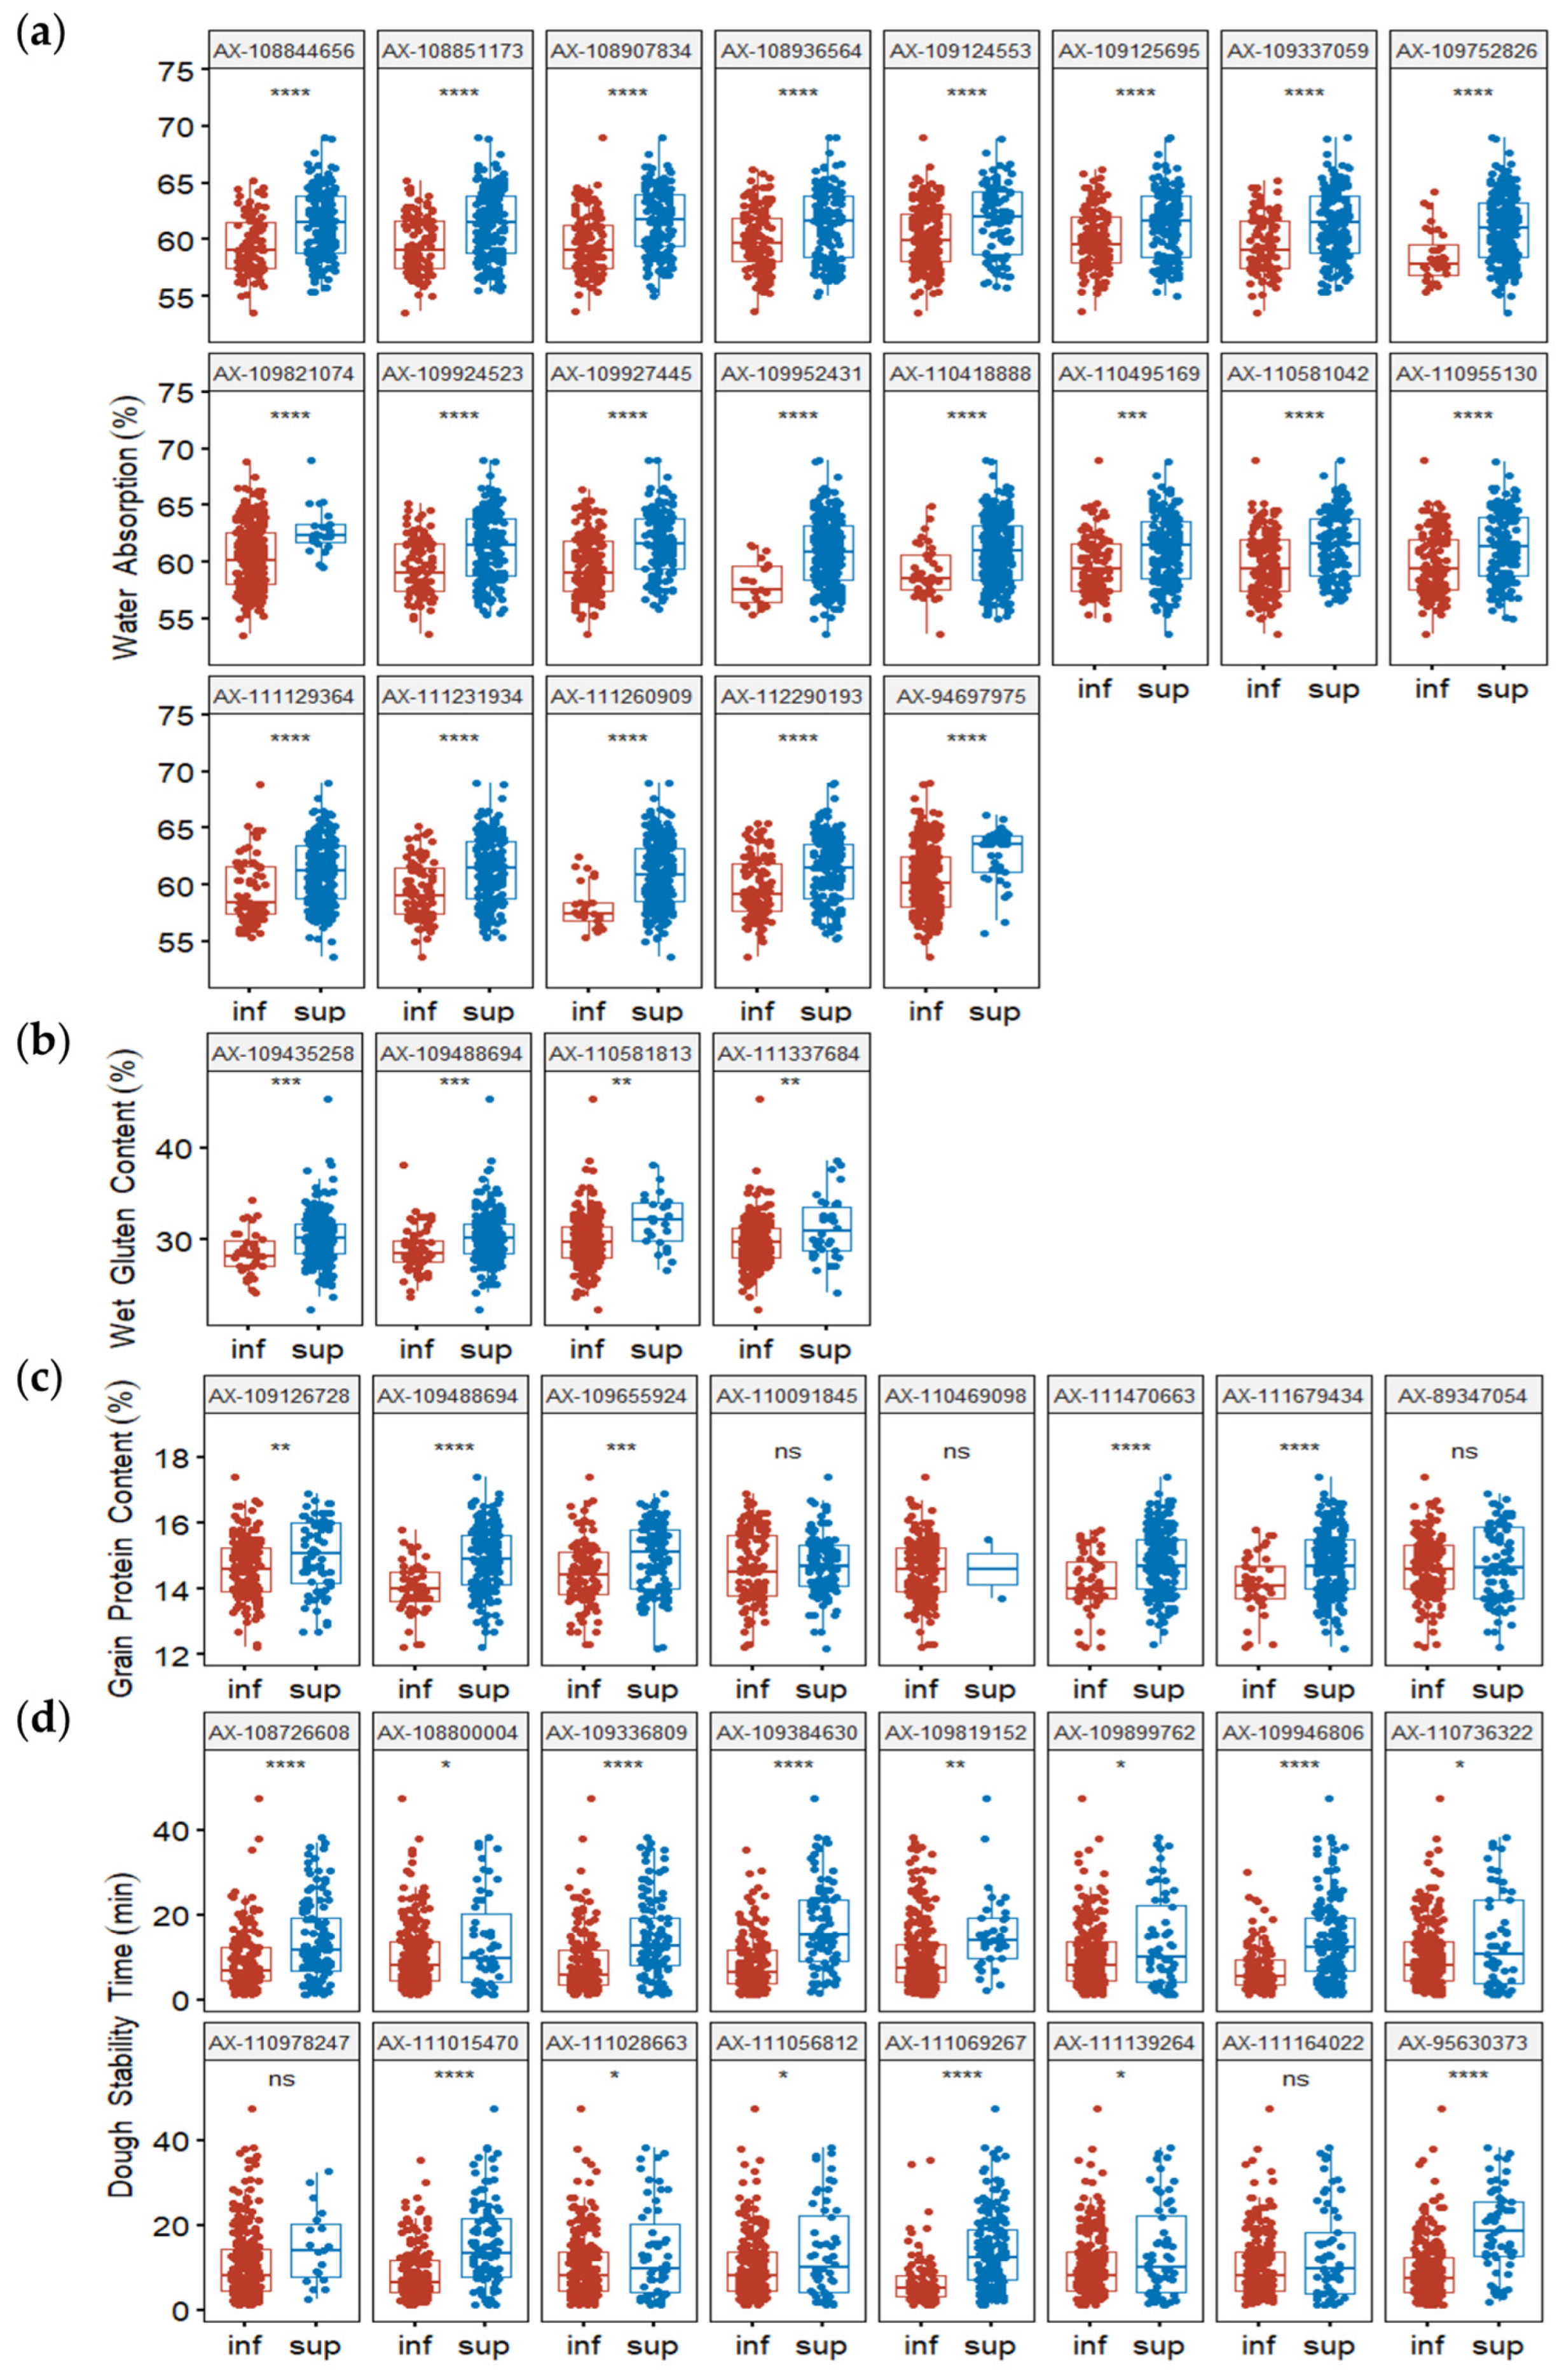
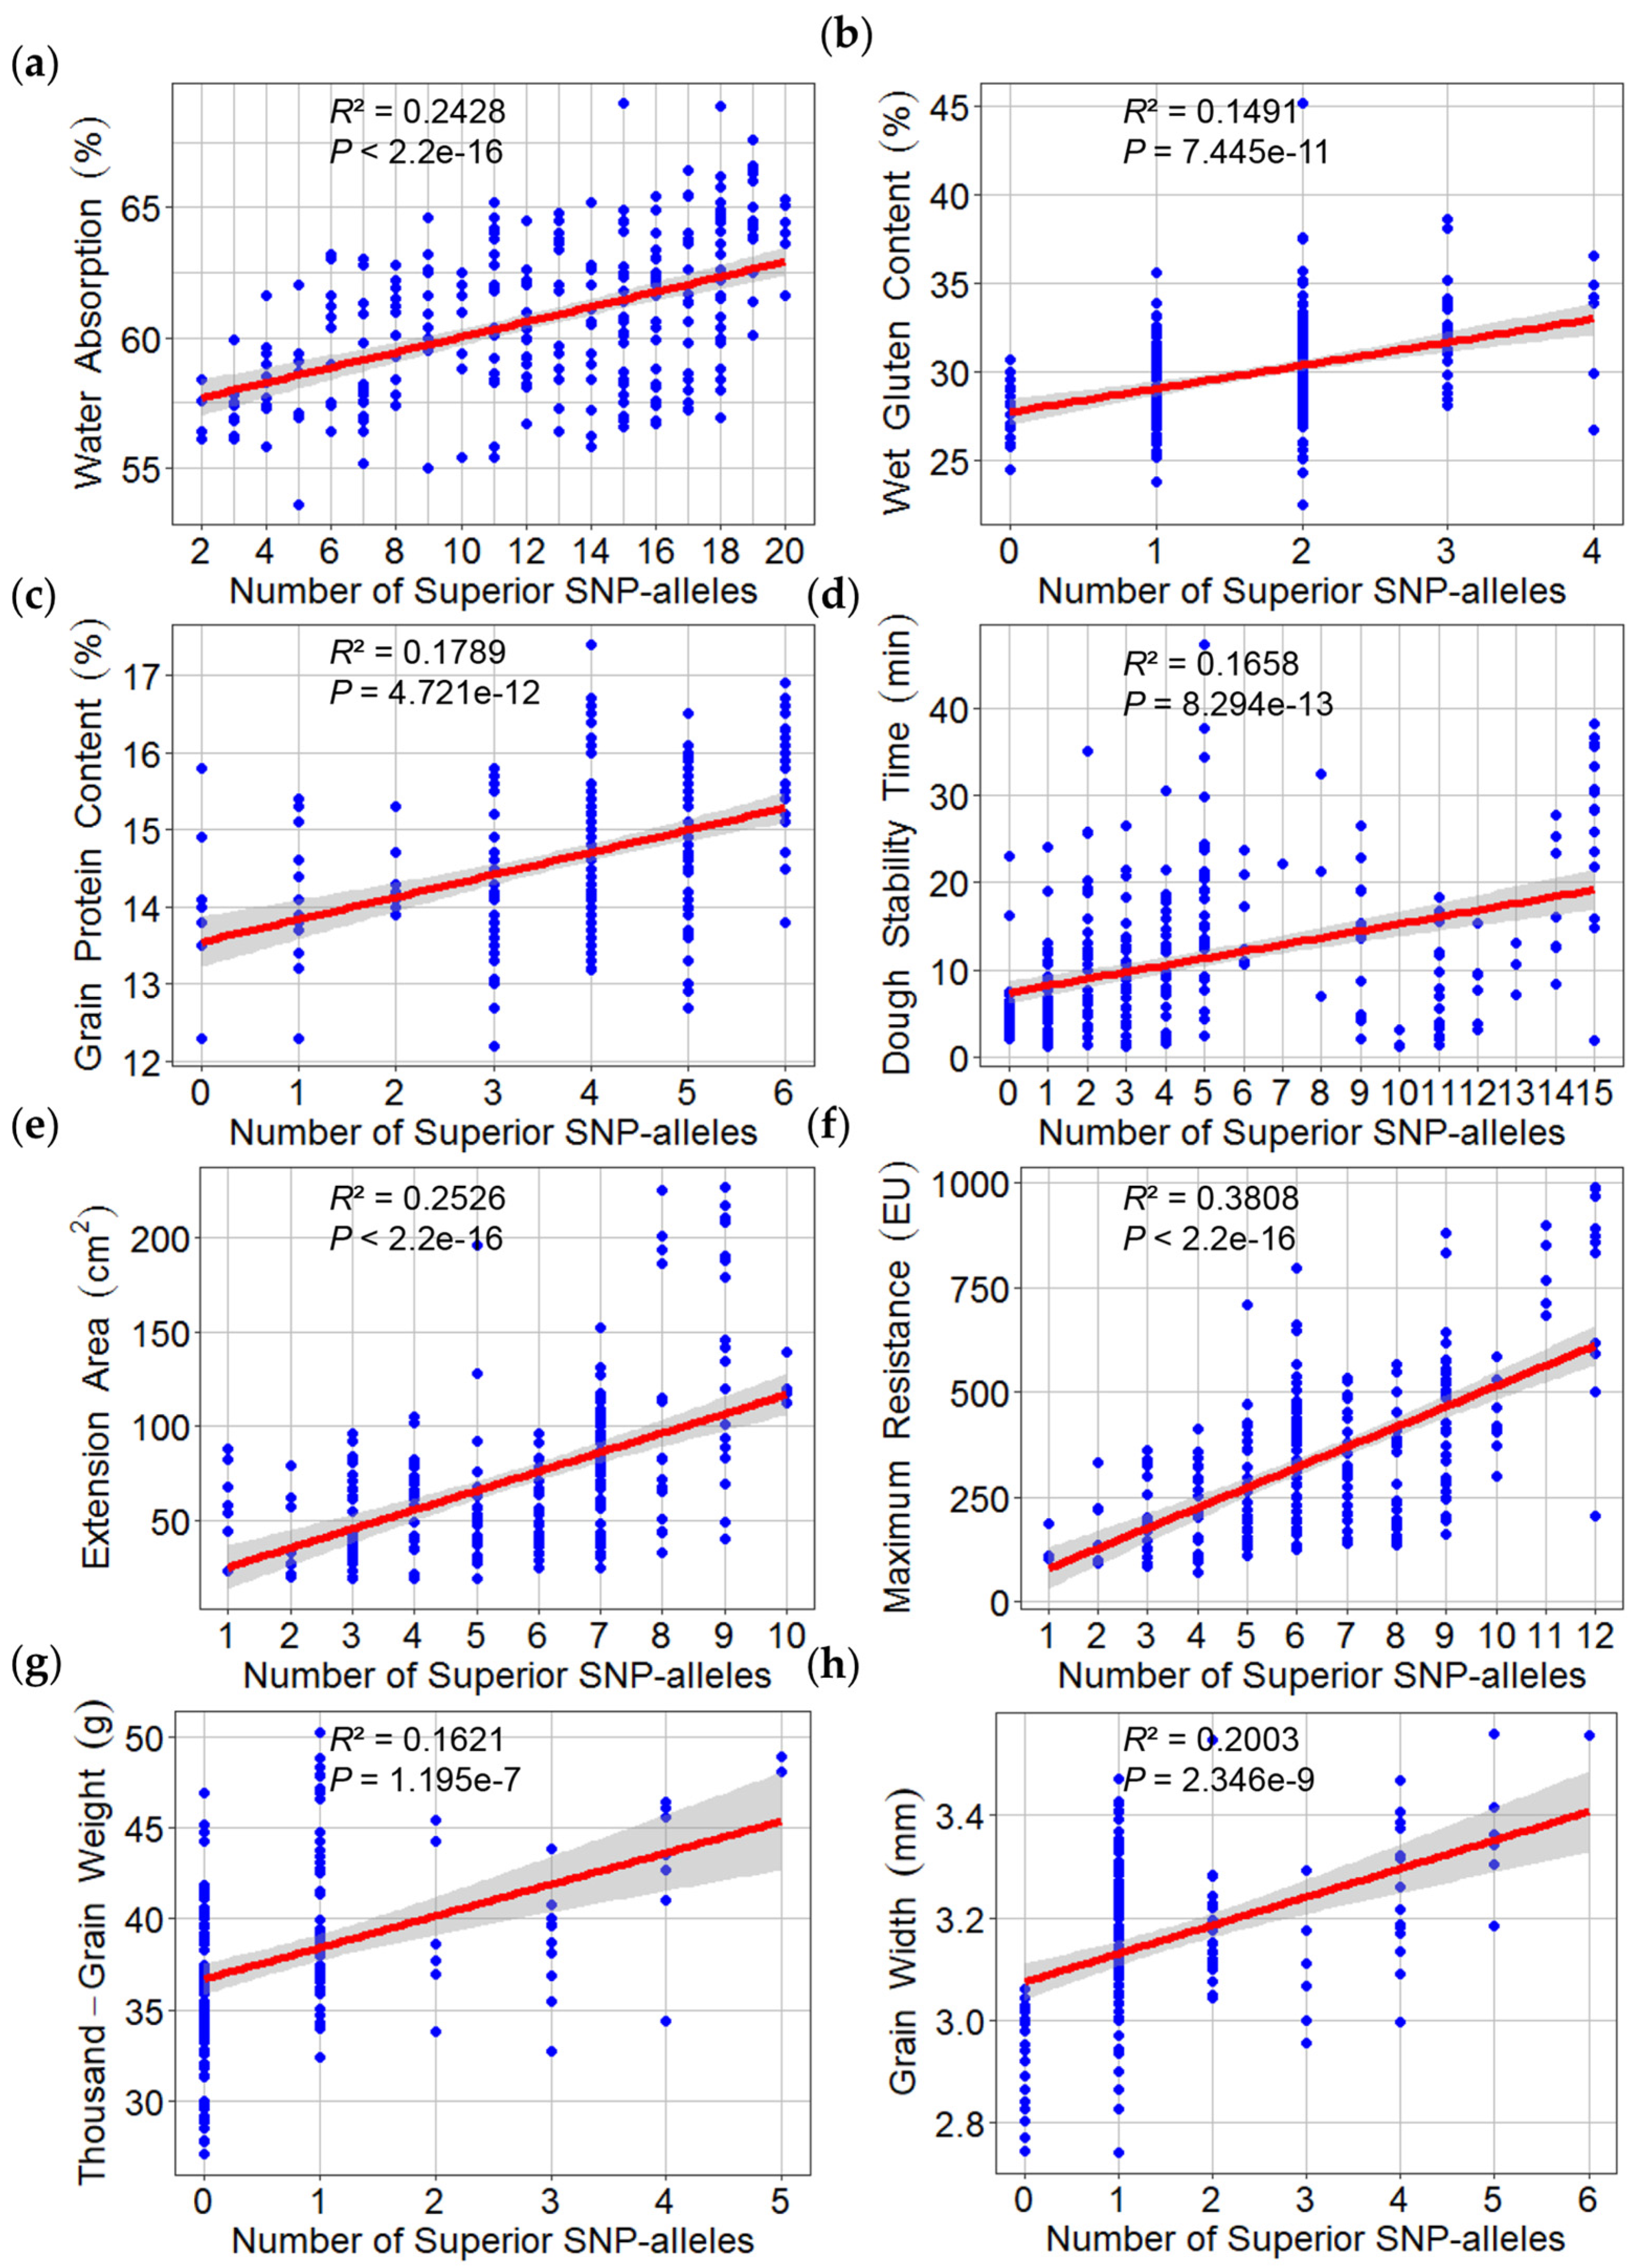
2.6. Effects of Superior Alleles on Phenotypes and Allelic SNPs on Wheat Quality and Yield

To simplify the description of allelic effects, marker alleles associated with a high phenotypic value were defined as “superior alleles”; all other marker alleles were considered “inferior alleles”. To confirm those effects, MTAs with the minimum p-value for detected QTL were used to determine whether differences in phenotypic values (grouped according to polymorphism) reached statistical significance. For the most representative MTAs, the phenotypic values of superior alleles were significantly higher than the phenotypic values of inferior alleles, as determined by t-tests (p < 0.05) (Figure 5 and Figure 6). MTAs representative of detected QTL were used to calculate the number of superior alleles in each wheat line. The patterns of relationships between the number of superior alleles and the phenotypic value were similar for all detected traits, such that the phenotypic value increased with the number of superior alleles: WA (R2 = 0.2428), WGC (R2 = 0.1491), GPC (R2 = 0.1789), DST (R2 = 0.1658), EA (R2 = 0.2526), MR (R2 = 0.3808), TGW (R2 = 0.1621), and GW (R2 = 0.2003) (Figure 7).

3. Discussion

3.1. Identification of MTAs and Comparisons with Previous Findings

In this study, 188 MTAs were identified, representing 87 QTL for six quality-related and three grain yield-related traits. A comparison of these loci with previously identified loci showed that some were in the same region, indicating that our results were reliable.
Among the characteristics of bread, WA plays an important role. A high WA can increase the bread output per unit of flour, increase bread softness, and extend the shelf life of fresh bread. In this study, 21 QTL for WA were detected on chromosomes 1B, 1D, 2A, 2D, 3A, 3B, 3D, 5B, 5D, 6B, 6D, and 7B. qWA-2A, represented by AX-111129364 at 735.35 Mb on chromosome 2A, was located at a position similar to the location of QLWA.cau-2A, associated with WA under late sowing time conditions [11].
For WGC, four QTL were identified on chromosomes 1B, 3D, 4B, and 5D. qWGC-3D included the MTA AX-110928411 located next to TaNAC019-D, which encodes an endosperm-specific NAC transcription factor that regulates the expression of HMW-GS (high molecular weight glutenin subunit) and TaSPA (storage protein accumulation) genes [25]. The position of qWGC-3D was similar to the positions of qEA-3D.1 and qMR-3D.1, suggesting an important role for this locus in regulating wheat quality.
Eight QTL for GPC were identified on chromosomes 4B, 5B, 5D, 6A, and 6B. The position of qGPC-5B.3 was close to the position of the previously detected QTL QGpc.caas-5B.1 [26].
For DST, qDST-1A.3, represented by seven MTAs, contained the Glu-1Ax and Glu-1Ay genes that encode HMW-GS [27,28]. The positions of qDST-4B and qDST-5A were similar to the positions of QST.caas.4BS [22] and QLDST.cau-5A.1 [11], which have been associated with DST.
Most QTL for EA were colocalized with MR-associated QTL, a finding supported by the strong correlation between these two traits. Because few studies have focused on the genetic dissection of flour EA and MR, our identification of the QTL for these traits provides an important reference for studies of flour quality traits.
Comparative analysis revealed that qTGW-5A, a quantitative trait locus for TGW, was mapped to the chromosome 5AL and therefore located near a previously reported quantitative trait locus for GW [29]. Many QTL for TGW have been detected on chromosome 5B [30,31,32,33,34,35]; some of these QTL coincide with QTL for GL and/or GW [30,32,33,34,35]. In the present study, the QTL qTGW-5B and qGW-5B were detected in a similar region; they were adjacent to QTkw-5B.1, a quantitative trait locus for TGW detected in three recombinant inbred line populations [30], and adjacent to a quantitative trait locus affecting TGW, GL, and GW in the Rye Selection 111/ Chinese Spring recombinant inbred population [35]. The TGW QTL qTGW-5D.1 and the WA QTL qWA-5D for WA were present at similar intervals on chromosome 5D, in a region containing TaARF25-5D. Notably, TaARF25-5D encodes an auxin response factor (ARF) that interacts with TaIAA21 to regulate wheat grain size and weight development [36]. A comparison of qGW-2D, a quantitative trait locus for GW detected in the present study, with previously identified QTL controlling TGW, GL, and/or GW showed that these significant QTL were mapped within an approximately equivalent or contiguous chromosomal region [32,37].
To our knowledge, the present study identified several novel QTL: two for TGW (qTGW-1A and qTGW-5D.2), one for GL (qGL-4B), four for GW (qGW-1A, qGW-5A, qGW-5D, and qGW-7D), and nearly all wheat quality-related QTL detected in this study (except qWA-2A, qWGC-3D, qEA-3D.1, qMR-3D.1, qGPC-5B.3, qDST-1A.3, qDST-4B, and qDST-5A).

3.2. The Validation of Rare and Multiple Phenotype-Related MTAs in the Association Population

In the present study, 188 MTAs were identified, representing 87 QTL for wheat quality and yield. MTAs with the minimum p-value for the detected QTL were used to calculate the frequencies of rare loci. MTAs associated with a high WA, WGC, GPC, EA, and MR, as well as a long DST, were defined as superior alleles; all others were regarded as inferior alleles. The frequencies of 18 superior alleles among the accessions were <15%, indicating that they have not been fully utilized but should receive greater consideration in molecular breeding. For WA, the frequencies of superior alleles of the SNPs AX-94697975 on chromosome 5B and AX-109821074 on chromosome 6D among wheat accessions were 12.63% and 8.07%, respectively. For WGC, two rare superior alleles were identified involving the SNPs AX-111337684 on chromosome 3D (14.04%) and AX-110581813 on chromosome 5D (8.42%). Among the surveyed accessions, the frequency of the superior allele of the SNP AX-110469098 for GPC on chromosome 6A was 0.70%, suggesting that this SNP is a very rare locus; it should be more extensively explored and more fully utilized in wheat breeding. Two superior alleles for DST (AX-109819152 on chromosome 4B and AX-110978247 on chromosome 5D) and another two for MR (AX-110426295 on chromosome 2D and AX-109999625 on chromosome 3D) were present in < 13% of the surveyed accessions. For EA, five superior alleles (AX-110426295, AX-111458518, AX-109230716, AX-89603436, and AX-109974589) were detected in <11% of the surveyed accessions, although these loci are likely significant for improvements in EA. For example, AX-110426295 was significantly associated with EA and MR. For TGW, three rare superior alleles (AX-110673287 on chromosome 1A, AX-95177077 on chromosome 5A, and AX-110576628 on chromosome 5B) were present in <15% of the surveyed accessions. For GW, the frequencies of superior alleles of the SNPs AX-111341034 on chromosome 2D and AX-109287932 on chromosome 7D among the surveyed accessions were 6.67% and 13.33%, respectively.
Among the detected traits, relatively strong correlations were determined for some phenotypes, whereas 25 MTAs showed pleiotropic effects on multiple phenotypes. For example, WGC shared the MTA AX-109488694 with GPC on chromosome 4B. DST had one and three SNPs in common with MR and EA, respectively; the SNP AX-111015470 was associated with both MR and EA. Among the 14 SNPs shared between EA and MR, one was associated with DST, EA, and MR. This result was closely related to the traits of EA and MR, with positive correlations of up to 0.98. Similarly, six MTAs were associated with both TGW and GW; there was a significantly positive correlation between the latter two traits. TGW shared two SNPs on chromosome 5D (AX-111917292 and AX-109124553) with WA, indicating that these SNPs simultaneously control wheat quality and yield. The specific association of some MTAs with several traits suggests that these loci control multiple phenotypes, whereas other loci play key roles in specific phenotypes. The collaborative expression of these QTL can synergistically improve wheat quality and yield.

4. Materials and Methods

4.1. Materials

This study examined 285 regional test lines of wheat from the year 2020 in Hebei Province, China, the primary province involved in producing strong gluten-containing and high-quality wheat in China.

4.2. Measurements of Flour Quality and Grain Traits

A scaled camera-assisted phenotyping system (SC-G, Wanshen Detection Technology Co., Ltd., Hangzhou, China) was used to record grain yield-related traits (TGW, GL, and GW). GPC was measured on 0.2000 g of wholemeal samples using a full-automatic Kjeldahl analysis device (FOSS Kjeltec 8400, Copenhagen, Denmark) according to Chinese standard GB 5009.5-2016. EA and MR were determined using an extensograph (Brabender Extensograph®-E, Duisburg, Germany) according to Chinese standard GB/T 14615-2019. When measuring EA and MR, the amount of flour sample used was calculated using the following formula: m = 300 g × 0.86/(100% − MCF), where m was the weight of flour sample; 0.86 was the dry matter content; and MCF was the moisture content of flour. DST and WA were determined using a full-automatic farinograph (Brabender 810151.001, Germany) according to Chinese standard GB/T 14614-2019. WGC was determined on 10.00 g of flour using a gluten measuring system (Perten GM2200, Hägersten, Sweden) according to Chinese standard GB/T 5506.2-2008. During assessments of quality traits, each sample was measured at least twice, and the mean value was used in subsequent analyses.

4.3. Phenotypic Data Analysis

All statistical analyses were conducted using R v4.3.3 software. Two groups were compared using two-tailed Student’s t-tests. Correlations among traits were calculated using Pearson correlation coefficients.

4.4. SNP Genotyping

The fresh leaves of 285 regional test lines of wheat in this study were used to extract DNA with the modified CTAB method [38] for sequencing with the wheat iSelect 15K SNP array http://www.cgmb.com.cn/index.php/Home/Index/ke_suc_case_xiangqing?id=47 (accessed on 1 April 2020) from China Golden Maker Biotechnology Co., Ltd. (Beijing, China) http://www.cgmb.com.cn/ (accessed on 1 April 2020) [13]. This wheat iSelect 15K SNP array contains 13,947 SNPs, of which 1272 are functional markers and 12,674 are genomic coverage markers. For quality control assessments of SNP data, SNPs with a missing rate > 20% and minor allele frequency (MAF) < 5% were deleted using PLINK v1.9 software (https://www.cog-genomics.org/plink2/) (accessed on 1 January 2024) [39]. After filtering, 9138 SNPs remained available for the GWAS. These filtered SNPs were distributed on all wheat chromosomes, with 3211, 3838, and 2089 SNPs in the A, B, and D sub-genomes, respectively. SNP positions were determined via BLAST search IWGSC RefSeq v1.0 2018; http://wheat-urgi.versailles.inra.fr/Tools/BLAST (accessed on 1 January 2023).

4.5. Linkage Disequilibrium

LD was calculated as the squared allele frequency correlation (r2), using PLINK v1.9 software. The LD decay distance and half decay distance were generated with r2 values for the distances of SNP pairs, using the ggplot2 package in R software.

4.6. Population Structure and Kinship Analysis

Three clustering methods were used to assess genetic structures at the population level. First, the population structure was analyzed using the Structure v2.3.4 software, as previously described [40,41]. Second, a phylogenetic tree was generated using TASSEL v5.2.73 software and the neighbor-joining method [42]. Third, PCA was conducted using PLINK v1.9 [39]. The relative kinship matrix was estimated in TASSEL 5.2.73 software using the four-scaled identity-by-state (IBS) method, with a reasonable estimate of additive genetic variance followed by selection using the pheatmap package in R software [42].

4.7. Genome-Wide Association Mapping

The GWAS methodology was implemented using the GAPIT package in R software, combined with a mixed linear model (PCA + relative kinship) [43], which controlled for false positives caused by the population structure and relative kinship. The first five principal components were regarded as covariate variables and included in the GWAS model. Relative kinship was determined using TASSEL 5 software [42]. To decrease type II errors, significant MTAs were set to −log10 (p-value) ≥ 3.0, as shown in the Manhattan and Q-Q plots [13,44].

5. Conclusions

In this study, QTL for quality-related and yield-related traits in wheat were identified through a GWAS of six quality-related traits (WA, GPC, WGC, EA, MR, and DST) and three grain yield–related traits (TGW, GL, GW) in 285 regional test lines of wheat from Hebei Province, China, using the wheat 15 K array. Among the 87 QTL harboring 188 detected MTAs, twenty-five MTAs on chromosomes 1A, 2D, 3D, 4B, 5B, 5D, and 6A were pleiotropic for multiple traits. AX-111015470 on chromosome 1A exhibited pleiotropic effects on DST, EA, and MR. SNPs AX-111917292 and AX-109124553 on chromosome 5D showed pleiotropic effects on wheat WA and TGW. This study also identified several new QTL. In the surveyed accessions, 18 rare superior alleles were identified on chromosomes 1A, 2D, 3A, 3D, 4B, 4D, 5A, 5B, 5D, 6A, 6D, and 7D; these alleles merit greater consideration in wheat breeding. The results of this study provide important genetic information for cultivating high-yield and high-quality varieties of wheat, which will contribute to the development of new wheat varieties with desirable alleles that synergistically improve wheat quality and yield.

Supplementary Materials

The following supporting information can be downloaded at https://www.mdpi.com/article/10.3390/plants13182545/s1, Table S1: the QTL and significant SNPs identified by GWAS for valued traits; Table S2: the QTL and significant SNPs identified by GWAS for grain yield-related traits.

Author Contributions

Conceptualization, Y.Z.; methodology, J.Z. and M.H.; investigation, J.W.; resources, Q.L. (Qian Liu); data curation, L.S., J.Y., P.W. and Q.L. (Qianying Li); writing—original draft preparation, J.Z.; writing—review and editing, Y.Z. and J.Z.; supervision, J.X.; project administration, L.S., L.M., H.L. and Y.Z. All authors have read and agreed to the published version of the manuscript.

Funding

This work was supported by the Hebei Modern Agricultural Industrial Technology System (HBCT2023010201), National Natural Science Foundation of China (32372197), National Key R&D Program (2023YFD1201003), Project for Hebei Scientific and Technological Innovation (21326318D-6), Basic Research Funds of Hebei Academy of Agriculture and Forestry Sciences (2024060205), Project for Youth Innovation Fund of Institute of Cereal and Oil Crops, Hebei Academy of Agriculture and Forestry Sciences (2021LYS01), Science and Technology Project of Shijiazhuang (231490082A), and the Dingxi Science and Technology Plan (DX2022AZ01).

Data Availability Statement

The data and results are available to every reader upon reasonable request.

Acknowledgments

The authors thank Han Wu for his assistance in revising the article.

Conflicts of Interest

The authors declare no conflicts of interest.

Abbreviations

QTLQuantitative trait loci
GWASGenome-wide association study
WAWater absorption
WGCWet gluten content
GPCGrain protein content
DSTDough stability time
EAExtension area
MRMaximum resistance
TGWThousand-grain weight
GLGrain length
GWGrain width
SNPSignificant single-nucleotide polymorphism
MTAMarker–trait association

References

  1. Hu, J.; Xiao, G.; Jiang, P.; Zhao, Y.; Zhang, G.; Ma, X.; Yao, J.; Xue, L.; Su, P.; Bao, Y. QTL detection for bread wheat processing quality in a nested association mapping population of semi-wild and domesticated wheat varieties. BMC Plant Biol. 2022, 22, 129. [Google Scholar] [CrossRef] [PubMed]
  2. Cui, F.; Fan, X.; Chen, M.; Zhang, N.; Zhao, C.; Zhang, W.; Han, J.; Ji, J.; Zhao, X.; Yang, L.; et al. QTL detection for wheat kernel size and quality and the responses of these traits to low nitrogen stress. Theor. Appl. Genet. 2016, 129, 469–484. [Google Scholar] [CrossRef] [PubMed]
  3. Goel, S.; Singh, K.; Singh, B.; Grewal, S.; Dwivedi, N.; Alqarawi, A.A.; Abd Allah, E.F.; Ahmad, P.; Singh, N.K. Analysis of genetic control and QTL mapping of essential wheat grain quality traits in a recombinant inbred population. PLoS ONE 2019, 14, e0200669. [Google Scholar] [CrossRef]
  4. Guo, Y.; Zhang, G.; Guo, B.; Qu, C.; Zhang, M.; Kong, F.; Zhao, Y.; Li, S. QTL mapping for quality traits using a high-density genetic map of wheat. PLoS ONE 2020, 15, e0230601. [Google Scholar] [CrossRef] [PubMed]
  5. Wang, P.; Tian, T.; Ma, J.; Liu, Y.; Zhang, P.; Chen, T.; Shahinnia, F.; Yang, D. Genome-Wide Association Study of Kernel Traits Using a 35K SNP Array in Bread Wheat (Triticum aestivum L.). Front. Plant Sci. 2022, 13, 905660. [Google Scholar] [CrossRef]
  6. Gasparis, S.; Miloszewski, M.M. Genetic basis of grain size and weight in rice, wheat, and barley. Int. J. Mol. Sci. 2023, 24, 16921. [Google Scholar] [CrossRef]
  7. Zanke, C.D.; Ling, J.; Plieske, J.; Kollers, S.; Ebmeyer, E.; Korzun, V.; Argillier, O.; Stiewe, G.; Hinze, M.; Neumann, F. Analysis of main effect QTL for thousand grain weight in European winter wheat (Triticum aestivum L.) by genome-wide association mapping. Front. Plant Sci. 2015, 6, 644. [Google Scholar] [CrossRef]
  8. Sajjad, M.; Khan, S.; Ahmad, M.; Rasheed, A.; Mujeeb-Kazi, A.; Khan, I. Association mapping identifies QTLs on wheat chromosome 3A for yield related traits. Cereal Res. Commun. 2014, 42, 177–188. [Google Scholar] [CrossRef]
  9. Soriano, J.M.; Colasuonno, P.; Marcotuli, I.; Gadaleta, A. Meta-QTL analysis and identification of candidate genes for quality, abiotic and biotic stress in durum wheat. Sci. Rep. 2021, 11, 11877. [Google Scholar] [CrossRef]
  10. Semagn, K.; Iqbal, M.; Chen, H.; Perez-Lara, E.; Bemister, D.H.; Xiang, R.; Zou, J.; Asif, M.; Kamran, A.; N’Diaye, A.; et al. Physical mapping of QTL associated with agronomic and end-use quality traits in spring wheat under conventional and organic management systems. Theor. Appl. Genet. 2021, 134, 3699–3719. [Google Scholar] [CrossRef]
  11. Lou, H.; Zhang, R.; Liu, Y.; Guo, D.; Zhai, S.; Chen, A.; Zhang, Y.; Xie, C.; You, M.; Peng, H.; et al. Genome-wide association study of six quality-related traits in common wheat (Triticum aestivum L.) under two sowing conditions. Theor. Appl. Genet. 2021, 134, 399–418. [Google Scholar] [CrossRef] [PubMed]
  12. Yang, Y.; Chai, Y.; Zhang, X.; Lu, S.; Zhao, Z.; Wei, D.; Chen, L.; Hu, Y.G. Multi-locus GWAS of quality traits in bread wheat: Mining more candidate genes and possible regulatory network. Front. Plant Sci. 2020, 11, 1091. [Google Scholar] [CrossRef] [PubMed]
  13. Zhao, J.; Sun, L.; Gao, H.; Hu, M.; Mu, L.; Cheng, X.; Wang, J.; Zhao, Y.; Li, Q.; Wang, P.; et al. Genome-wide association study of yield-related traits in common wheat (Triticum aestivum L.) under normal and drought treatment conditions. Front. Plant Sci. 2023, 13, 1098560. [Google Scholar] [CrossRef] [PubMed]
  14. Li, J.; Cui, F.; Ding, A.M.; Zhao, C.H.; Wang, X.Q.; Wang, L.; Bao, Y.G.; Qi, X.L.; Li, X.F.; Gao, J.R.; et al. QTL detection of seven quality traits in wheat using two related recombinant inbred line populations. Euphytica 2012, 183, 207–226. [Google Scholar] [CrossRef]
  15. Carter, A.H.; Garland-Campbell, K.; Morris, C.F.; Kidwell, K.K. Chromosomes 3B and 4D are associated with several milling and baking quality traits in a soft white spring wheat (Triticum aestivum L.) population. Theor. Appl. Genet. 2012, 124, 1079–1096. [Google Scholar] [CrossRef]
  16. Krystkowiak, K.; Langner, M.; Adamski, T.; Salmanowicz, B.P.; Kaczmarek, Z.; Krajewski, P.; Surma, M. Interactions between Glu-1 and Glu-3 loci and associations of selected molecular markers with quality traits in winter wheat (Triticum aestivum L.) DH lines. J. Appl. Genet. 2017, 58, 37–48. [Google Scholar] [CrossRef]
  17. Nordborg, M.; Weigel, D. Next-generation genetics in plants. Nature 2008, 456, 720–723. [Google Scholar] [CrossRef]
  18. Hayes, B. Overview of statistical methods for genome-wide association studies (GWAS). Methods Mol. Biol. 2013, 1019, 149–169. [Google Scholar]
  19. Gao, L.; Meng, C.; Yi, T.; Xu, K.; Cao, H.; Zhang, S.; Yang, X.; Zhao, Y. Genome-wide association study reveals the genetic basis of yield- and quality-related traits in wheat. BMC Plant Biol. 2021, 21, 144. [Google Scholar] [CrossRef]
  20. Fan, X.; Liu, X.; Feng, B.; Zhou, Q.; Deng, G.; Long, H.; Cao, J.; Guo, S.; Ji, G.; Xu, Z.; et al. Construction of a novel wheat 55 K SNP array-derived genetic map and its utilization in QTL mapping for grain yield and quality related traits. Front. Genet. 2022, 13, 978880. [Google Scholar] [CrossRef]
  21. Muqaddasi, Q.H.; Brassac, J.; Ebmeyer, E.; Kollers, S.; Korzun, V.; Argillier, O.; Stiewe, G.; Plieske, J.; Ganal, M.W.; Roder, M.S. Prospects of GWAS and predictive breeding for European winter wheat’s grain protein content, grain starch content, and grain hardness. Sci. Rep. 2020, 10, 12541. [Google Scholar] [CrossRef] [PubMed]
  22. Jin, H.; Wen, W.; Liu, J.; Zhai, S.; Zhang, Y.; Yan, J.; Liu, Z.; Xia, X.; He, Z. Genome-wide QTL mapping for wheat processing quality parameters in a Gaocheng 8901/Zhoumai 16 recombinant inbred line population. Front. Plant Sci. 2016, 7, 1032. [Google Scholar] [CrossRef] [PubMed]
  23. Guo, Y.; Wang, G.; Guo, X.; Chi, S.; Yu, H.; Jin, K.; Huang, H.; Wang, D.; Wu, C.; Tian, J.; et al. Genetic dissection of protein and starch during wheat grain development using QTL mapping and GWAS. Front. Plant Sci. 2023, 14, 1189887. [Google Scholar] [CrossRef] [PubMed]
  24. Li, N.; Miao, Y.; Ma, J.; Zhang, P.; Chen, T.; Liu, Y.; Che, Z.; Shahinnia, F.; Yang, D. Consensus genomic regions for grain quality traits in wheat revealed by Meta-QTL analysis and in silico transcriptome integration. Plant Genome 2023, 16, e20336. [Google Scholar] [CrossRef]
  25. Gao, Y.; An, K.; Guo, W.; Chen, Y.; Zhang, R.; Zhang, X.; Chang, S.; Rossi, V.; Jin, F.; Cao, X.; et al. The endosperm-specific transcription factor TaNAC019 regulates glutenin and starch accumulation and its elite allele improves wheat grain quality. Plant Cell 2021, 33, 603–622. [Google Scholar] [CrossRef]
  26. Yi, L.; Song, Y.; Zhou, R.; Granlard, G.; Jia, J. Detection of QTLs for bread-making quality in wheat using a recombinant inbred line population. Plant Breed. 2009, 128, 235–243. [Google Scholar]
  27. Payne, P.I.; Holt, L.M.; Worland, A.J.; Law, C.N. Structural and genetical studies on the high-molecular-weight subunits of wheat glutenin: Part 3. Telocentric mapping of the subunit genes on the long arms of the homoeologous group 1 chromosomes. Theor. Appl. Genet. 1982, 63, 129–138. [Google Scholar] [CrossRef]
  28. Shewry, P.R.; Halford, N.G.; Lafiandra, D. Genetics of wheat gluten proteins. Adv. Genet. 2003, 49, 111–184. [Google Scholar]
  29. Yang, Y.; Amo, A.; Wei, D.; Chai, Y.; Zheng, J.; Qiao, P.; Cui, C.; Lu, S.; Chen, L.; Hu, Y.G. Large-scale integration of meta-QTL and genome-wide association study discovers the genomic regions and candidate genes for yield and yield-related traits in bread wheat. Theor. Appl. Genet. 2021, 134, 3083–3109. [Google Scholar] [CrossRef]
  30. Cui, F.; Zhao, C.; Ding, A.; Li, J.; Wang, L.; Li, X.; Bao, Y.; Li, J.; Wang, H. Construction of an integrative linkage map and QTL mapping of grain yield-related traits using three related wheat RIL populations. Theor. Appl. Genet. 2014, 127, 659–675. [Google Scholar] [CrossRef]
  31. Huang, X.Q.; Coster, H.; Ganal, M.W.; Roder, M.S. Advanced backcross QTL analysis for the identification of quantitative trait loci alleles from wild relatives of wheat (Triticum aestivum L.). Theor. Appl. Genet. 2003, 106, 1379–1389. [Google Scholar] [CrossRef] [PubMed]
  32. Su, Q.; Zhang, X.; Zhang, W.; Zhang, N.; Song, L.; Liu, L.; Xue, X.; Liu, G.; Liu, J.; Meng, D.; et al. QTL detection for kernel size and weight in bread wheat (Triticum aestivum L.) using a high-density SNP and SSR-based linkage map. Front. Plant Sci. 2018, 9, 1484. [Google Scholar] [CrossRef] [PubMed]
  33. Zhai, H.; Feng, Z.; Du, X.; Song, Y.; Liu, X.; Qi, Z.; Song, L.; Li, J.; Li, L.; Peng, H.; et al. A novel allele of TaGW2-A1 is located in a finely mapped QTL that increases grain weight but decreases grain number in wheat (Triticum aestivum L.). Theor. Appl. Genet. 2018, 131, 539–553. [Google Scholar] [CrossRef] [PubMed]
  34. Yang, L.; Zhao, D.; Meng, Z.; Xu, K.; Yan, J.; Xia, X.; Cao, S.; Tian, Y.; He, Z.; Zhang, Y. QTL mapping for grain yield-related traits in bread wheat via SNP-based selective genotyping. Theor. Appl. Genet. 2020, 133, 857–872. [Google Scholar] [CrossRef]
  35. Prashant, R.; Kadoo, N.; Desale, C.; Kore, P.; Dhaliwal, H.S.; Chhuneja, P.; Gupta, V. Kernel morphometric traits in hexaploid wheat (Triticum aestivum L.) are modulated by intricate QTL× QTL and genotype× environment interactions. J. Cereal Sci. 2012, 56, 432–439. [Google Scholar] [CrossRef]
  36. Jia, M.; Li, Y.; Wang, Z.; Tao, S.; Sun, G.; Kong, X.; Wang, K.; Ye, X.; Liu, S.; Geng, S.; et al. TaIAA21 represses TaARF25-mediated expression of TaERFs required for grain size and weight development in wheat. Plant J. 2021, 108, 1754–1767. [Google Scholar] [CrossRef]
  37. Ramya, P.; Chaubal, A.; Kulkarni, K.; Gupta, L.; Kadoo, N.; Dhaliwal, H.S.; Chhuneja, P.; Lagu, M.; Gupta, V. QTL mapping of 1000-kernel weight, kernel length, and kernel width in bread wheat (Triticum aestivum L.). J. Appl. Genet. 2010, 51, 421–429. [Google Scholar] [CrossRef]
  38. Sharp, P.J.; Kreis, M.; Shewry, P.R.; Gale, M.D. Location of β-amylase sequences in wheat and its relatives. Theor. Appl. Genet. 1988, 75, 286–290. [Google Scholar] [CrossRef]
  39. Purcell, S.; Neale, B.; Todd-Brown, K.; Thomas, L.; Ferreira, M.A.; Bender, D.; Maller, J.; Sklar, P.; de Bakker, P.I.; Daly, M.J.; et al. PLINK: A tool set for whole-genome association and population-based linkage analyses. Am. J. Hum. Genet. 2007, 81, 559–575. [Google Scholar] [CrossRef]
  40. Pritchard, J.K.; Stephens, M.; Donnelly, P. Inference of population structure using multilocus genotype data. Genetics 2000, 155, 945–959. [Google Scholar] [CrossRef]
  41. Zhang, P.; Yan, X.; Gebrewahid, T.W.; Zhou, Y.; Yang, E.; Xia, X.; He, Z.; Li, Z.; Liu, D. Genome-wide association mapping of leaf rust and stripe rust resistance in wheat accessions using the 90K SNP array. Theor. Appl. Genet. 2021, 134, 1233–1251. [Google Scholar] [CrossRef] [PubMed]
  42. Bradbury, P.J.; Zhang, Z.; Kroon, D.E.; Casstevens, T.M.; Ramdoss, Y.; Buckler, E.S. TASSEL: Software for association mapping of complex traits in diverse samples. Bioinformatics 2007, 23, 2633–2635. [Google Scholar] [CrossRef] [PubMed]
  43. Wang, J.; Tang, Y.; Zhang, Z. Performing genome-wide association studies with multiple models using GAPIT. Methods Mol. Biol. 2022, 2481, 199–217. [Google Scholar] [PubMed]
  44. Wang, X.; Guan, P.; Xin, M.; Wang, Y.; Chen, X.; Zhao, A.; Liu, M.; Li, H.; Zhang, M.; Lu, L.; et al. Genome-wide association study identifies QTL for thousand grain weight in winter wheat under normal- and late-sown stressed environments. Theor. Appl. Genet. 2021, 134, 143–157. [Google Scholar] [CrossRef] [PubMed]
Figure 1. Phenotypic performances, distributions, and correlation coefficients of traits in 285 wheat (Triticum aestivum L.) accessions. The frequency distribution of phenotypic data for each trait is shown in histogram format. X-Y scatter plots include adjusted Pearson’s coefficients. * p ≤ 0.05, *** p ≤ 0.001. WA, water absorption; WGC, wet gluten content; GPC, grain protein content; DST, dough stability time; EA, extension area; MR, maximum resistance; TGW, thousand-grain weight; GL, grain length; GW, grain width.
Plants 13 02545 g001
Figure 2. Population structure analysis of the 285 wheat accessions. (a) Linkage disequilibrium decay values for the whole genome and the A, B, and D sub-genomes of wheat; (b) population structure analysis using Structure software; (c) neighbor-joining tree of all wheat accessions; (d) principal component analysis showing the population structure in the diversity panel.
Plants 13 02545 g002
Figure 3. Manhattan and quantile–quantile (Q-Q) plots for (a) water absorption (WA), (b) wet gluten content (WGC), (c) grain protein content (GPC), (d) dough stability time (DST), (e) extension area (EA), and (f) maximum resistance (MR).
Plants 13 02545 g003
Figure 4. Manhattan and Q-Q plots for (a) thousand-grain weight (TGW), (b) grain length (GL), and (c) grain width (GW).
Plants 13 02545 g004
Figure 5. Average phenotypic values of accessions with different alleles for water absorption (a), wet gluten content (b), grain protein content (c), and dough stability time (d). p-values were determined by two-tailed Student’s t-tests. ns: no significant difference, p > 0.05; * p < 0.05; ** p < 0.01; *** p < 0.001; **** p < 0.0001; inf: inferior allele; sup: superior allele.
Plants 13 02545 g005
Figure 6. Average phenotypic values of accessions with different alleles for extension area (a), maximum resistance (b), thousand-grain weight (c), grain length (d), and grain width (e). p-values were determined by two-tailed Student’s t-tests. ns: no significant difference, p > 0.05; * p < 0.05; ** p < 0.01; *** p < 0.001; **** p < 00001; inf: inferior allele; sup: superior allele.
Plants 13 02545 g006
Figure 7. Superior allelic effects of the highest –log10 (p) single-nucleotide polymorphisms (SNPs) within the quantitative trait loci (QTL) detected by the genome-wide association study (GWAS) based on linear regression analysis for water absorption (a), wet gluten content (b), grain protein content (c), dough stability time (d), extension area (e), maximum resistance (f), thousand-grain weight (g), and grain width (h). Values shown at the bottom of the box plot correspond to each SNP allele.
Plants 13 02545 g007
Table 1. Statistics for water absorption (WA), wet gluten content (WGC), grain protein content (GPC), dough stability time (DST), extension area (EA), maximum resistance (MR), thousand-grain weight (TGW), grain length (GL), and grain width (GW).
TraitWA (%)WGC (%)GPC (%)DST (min)EA (cm2)MR (EU)TGW (g)GL (mm)GW (mm)
Mean60.68 29.99 14.68 11.04 72.34 351.10 38.08 6.35 3.16
Min53.60 22.50 12.20 1.20 19.00 72.00 27.11 5.49 2.74
Max69.00 45.20 17.40 47.40 227.00 989.00 50.23 7.00 3.56
SD a2.93 2.77 0.99 8.62 43.85 195.18 5.04 0.29 0.16
CV b (%)4.82 9.23 6.78 78.05 60.62 55.59 13.25 4.59 5.13
a SD, standard deviation; b CV, coefficient of variation.
Disclaimer/Publisher’s Note: The statements, opinions and data contained in all publications are solely those of the individual author(s) and contributor(s) and not of MDPI and/or the editor(s). MDPI and/or the editor(s) disclaim responsibility for any injury to people or property resulting from any ideas, methods, instructions or products referred to in the content.

