
Diverging Elevational Patterns of Tree vs. Epiphyte Species Density, Beta Diversity, and Biomass in a Tropical Dry Forest


Abstract
:1. Introduction
2. Results
2.1. Environment
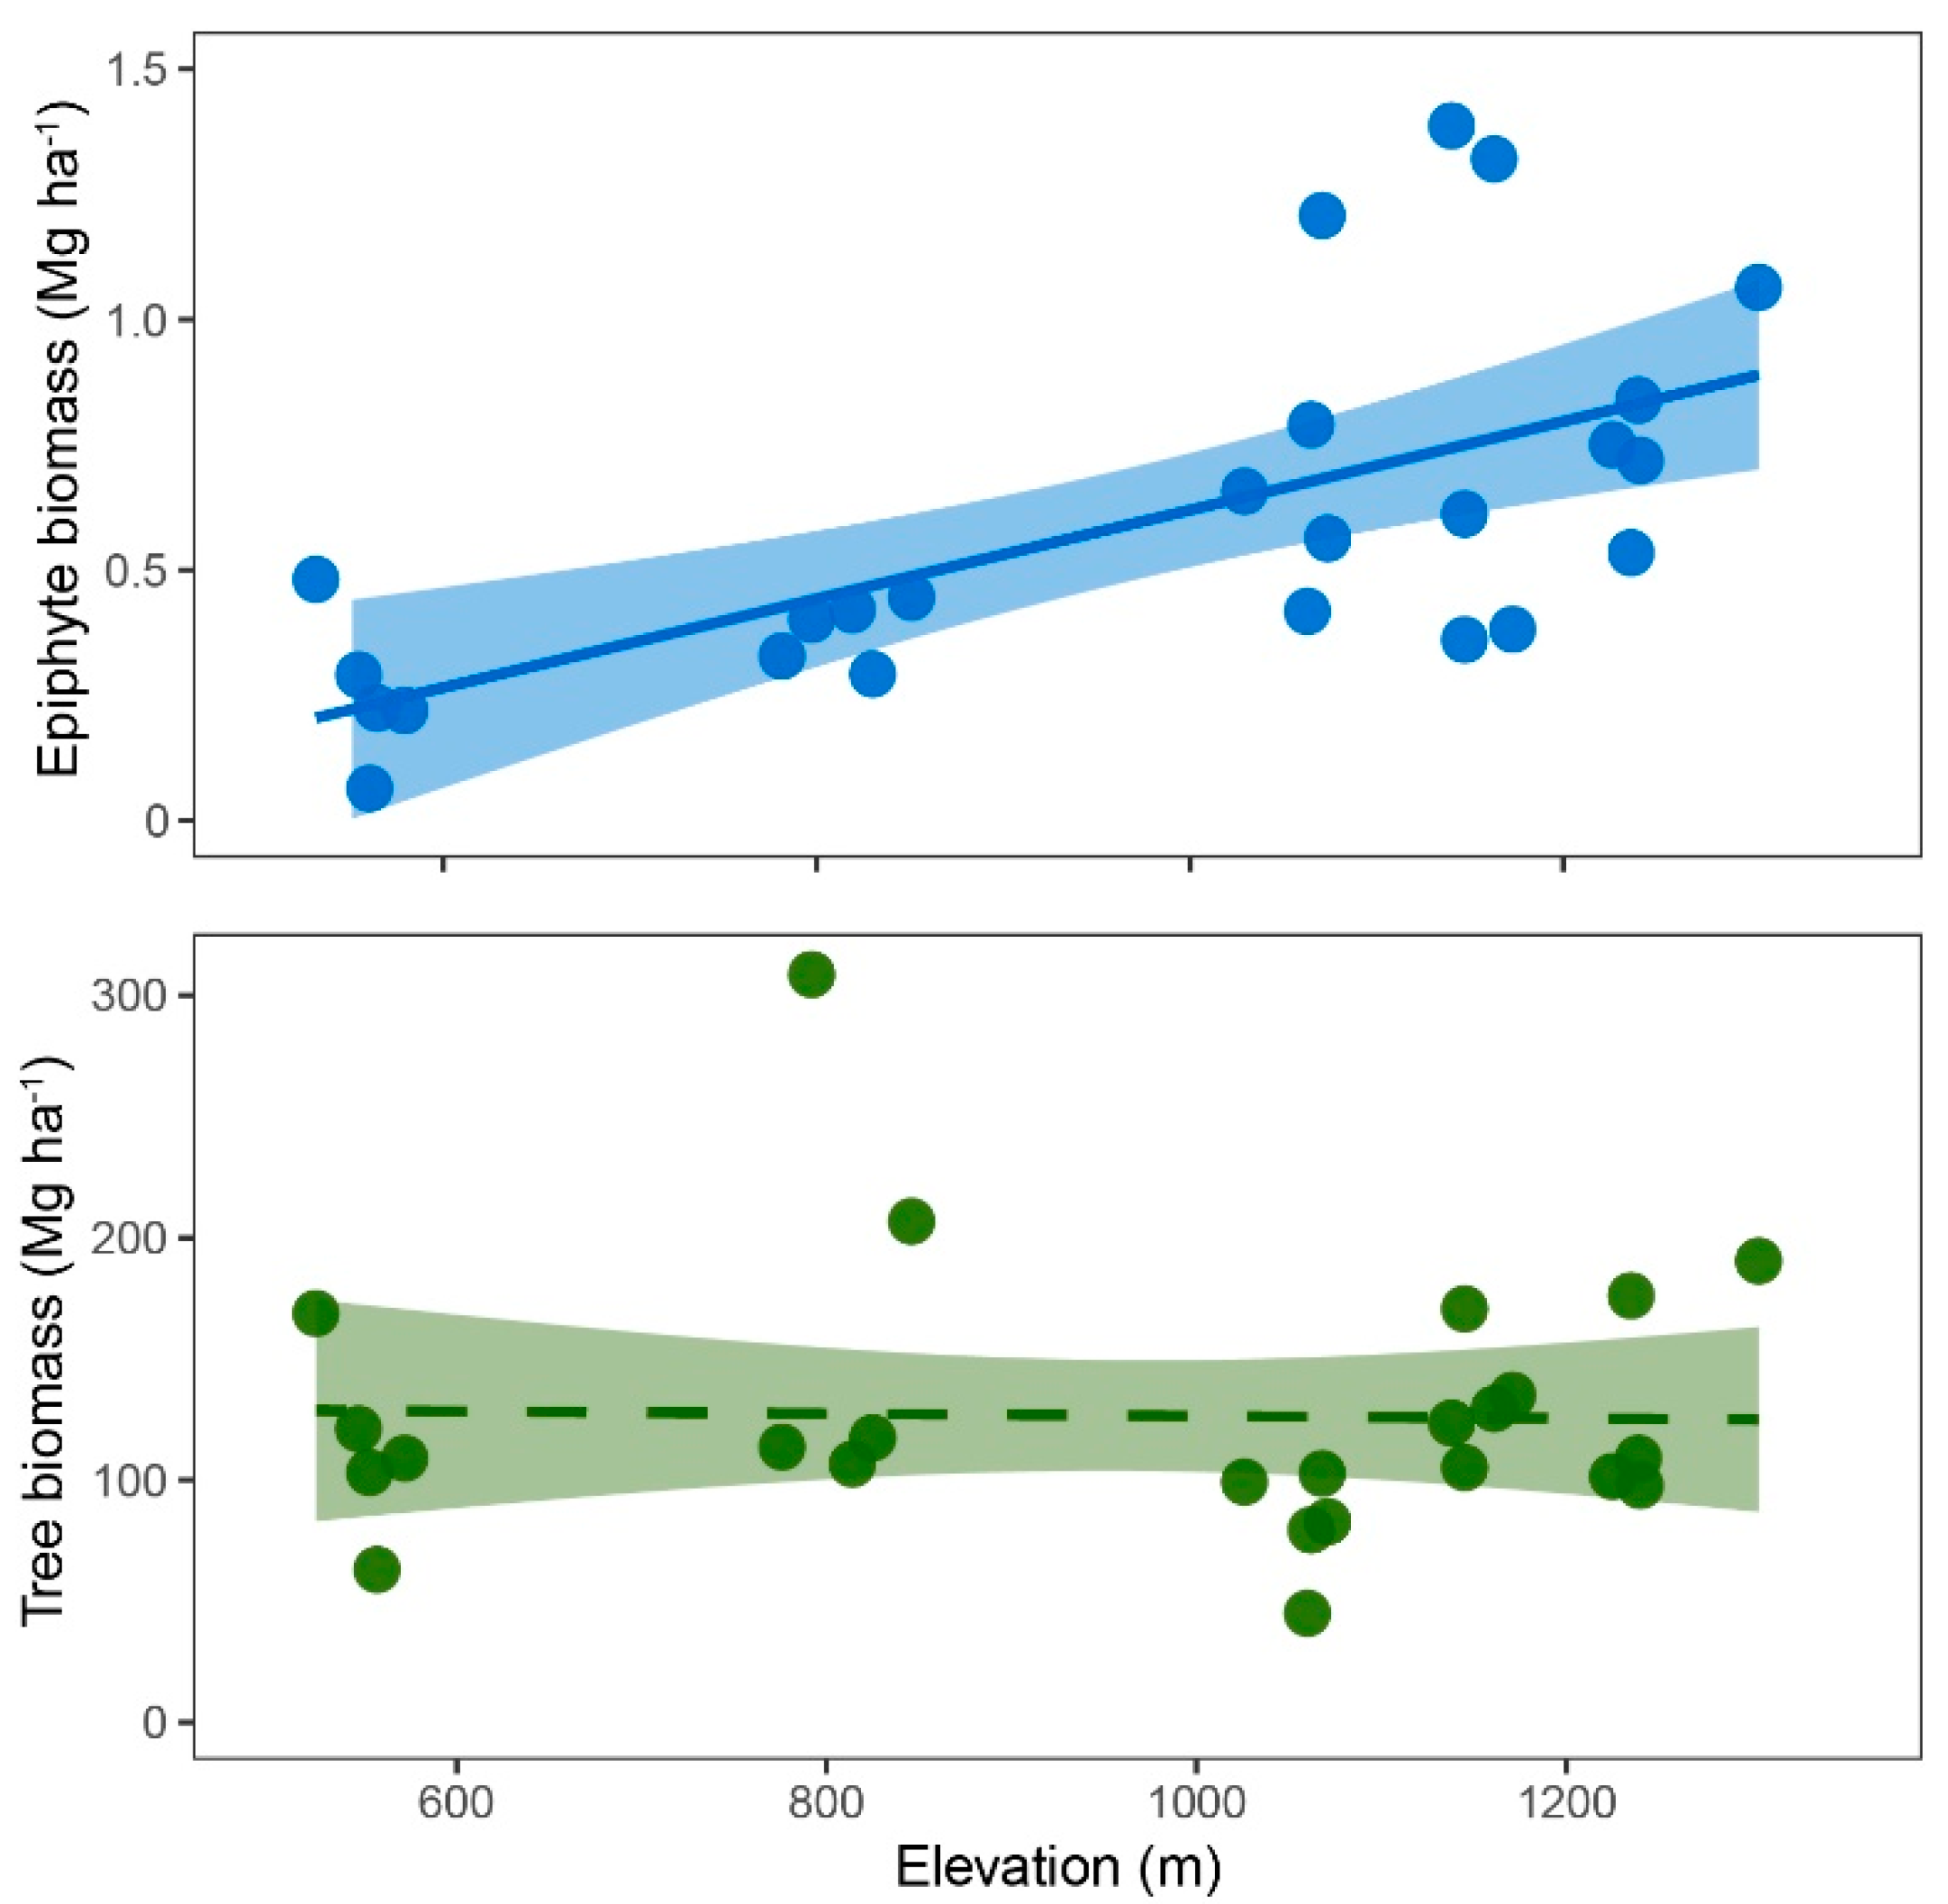
2.2. Biomass
2.3. Floristics
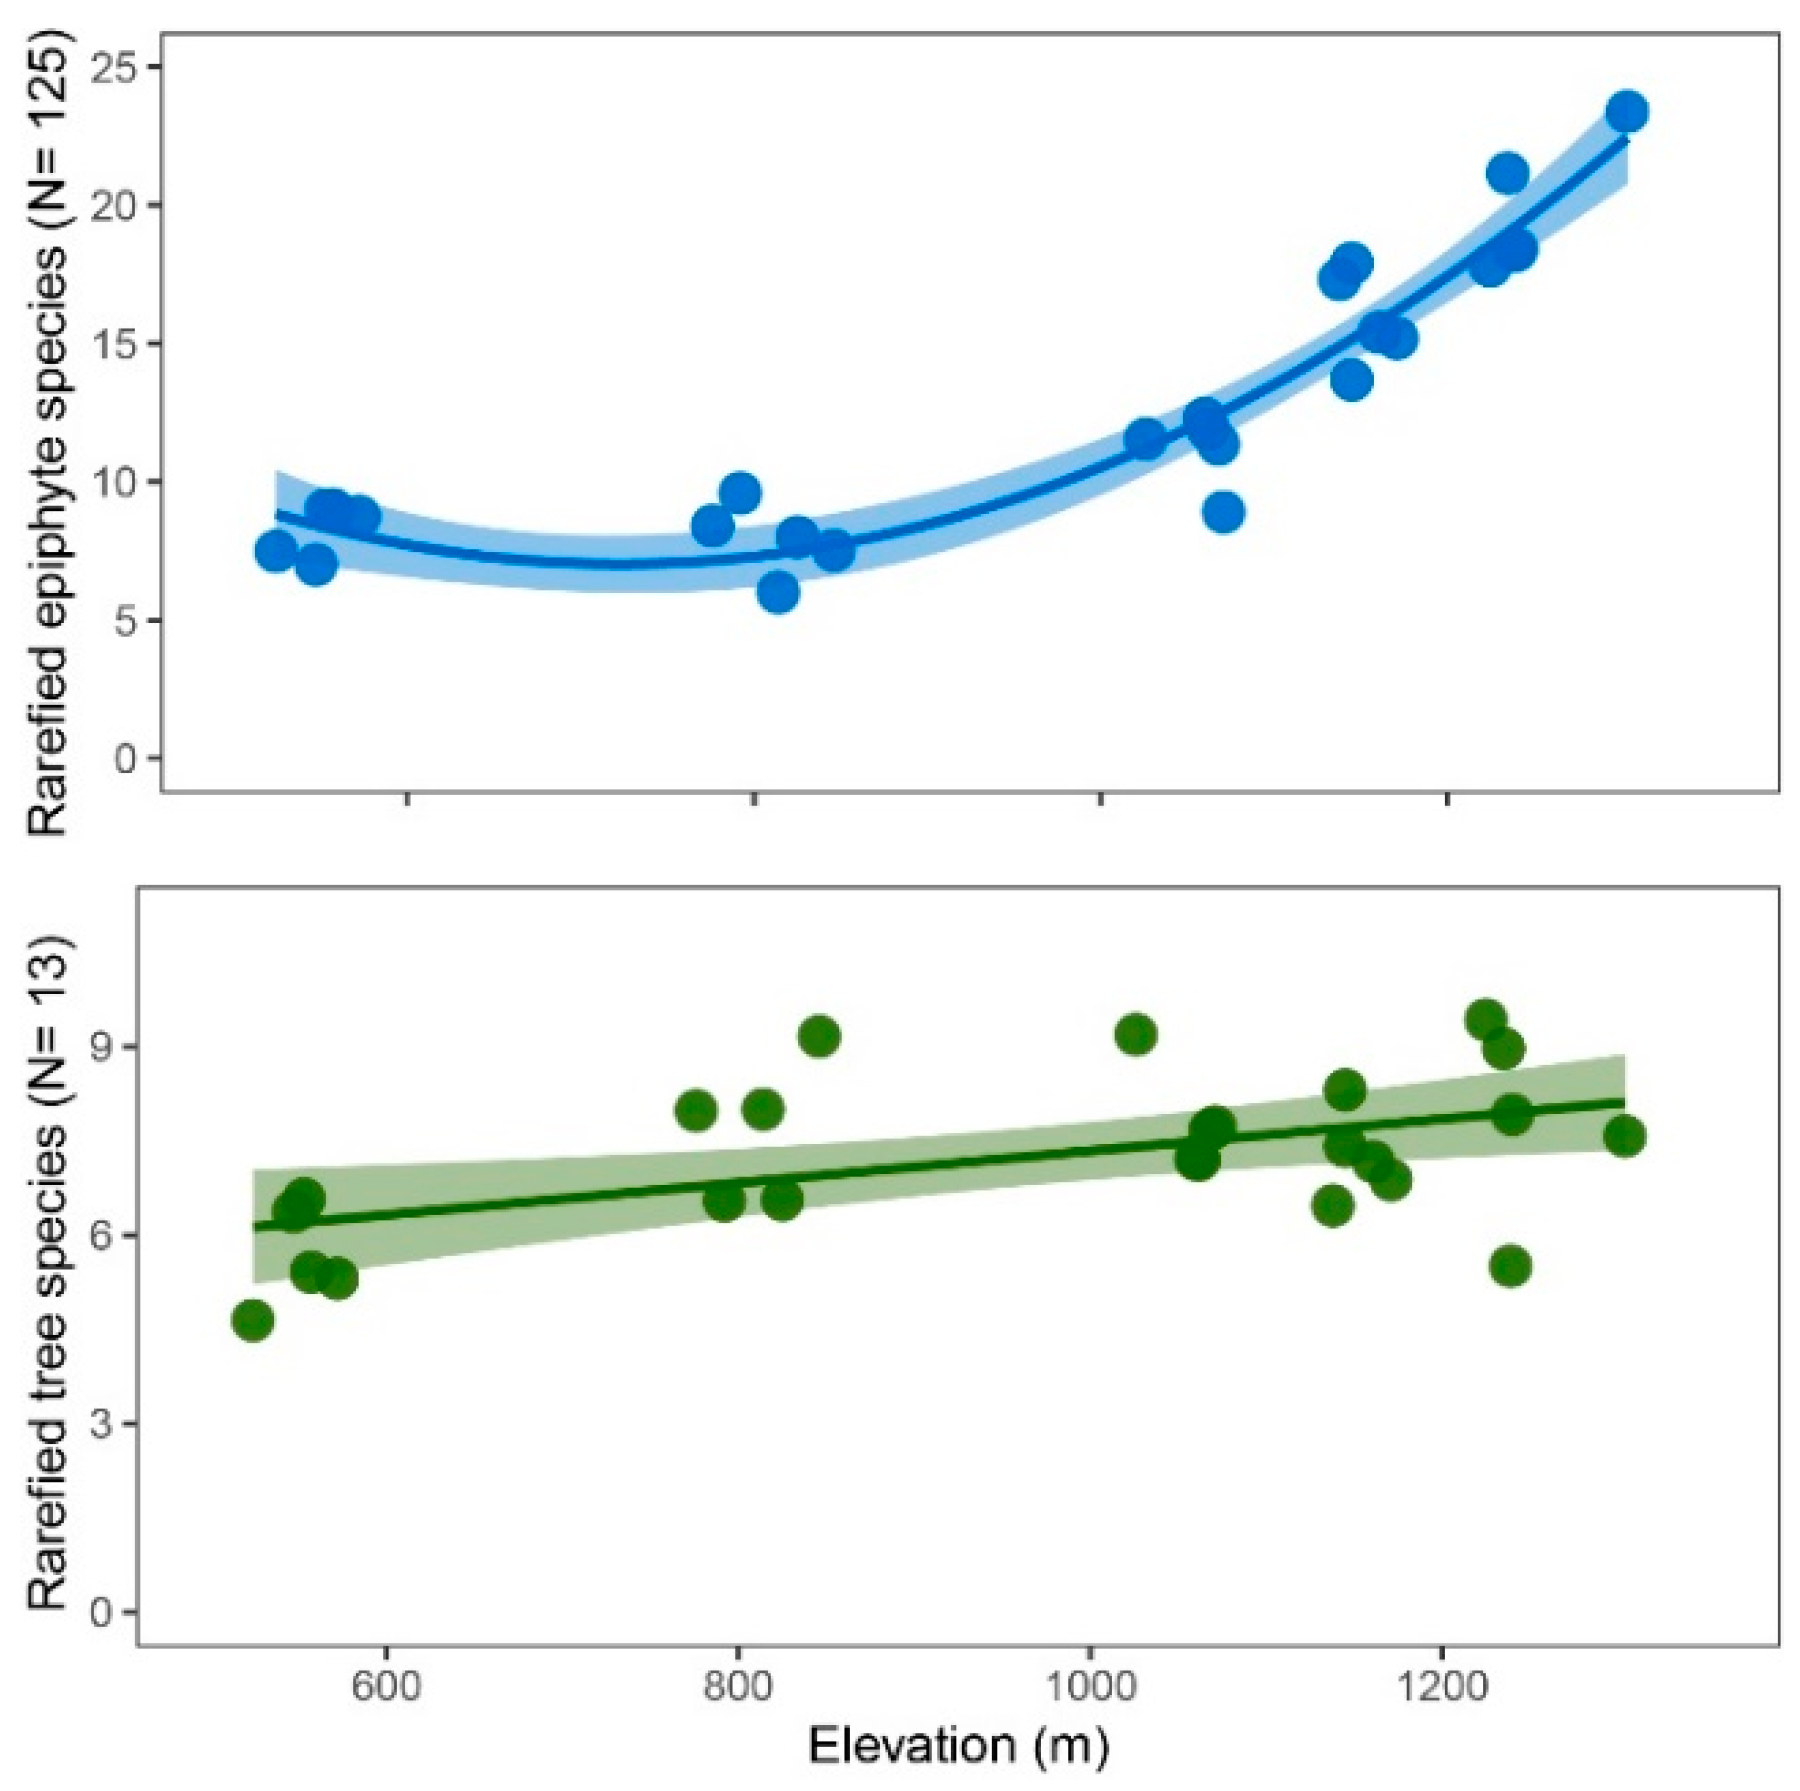
2.4. Species Density and Richness
2.5. Interactions between Trees and Epiphytes
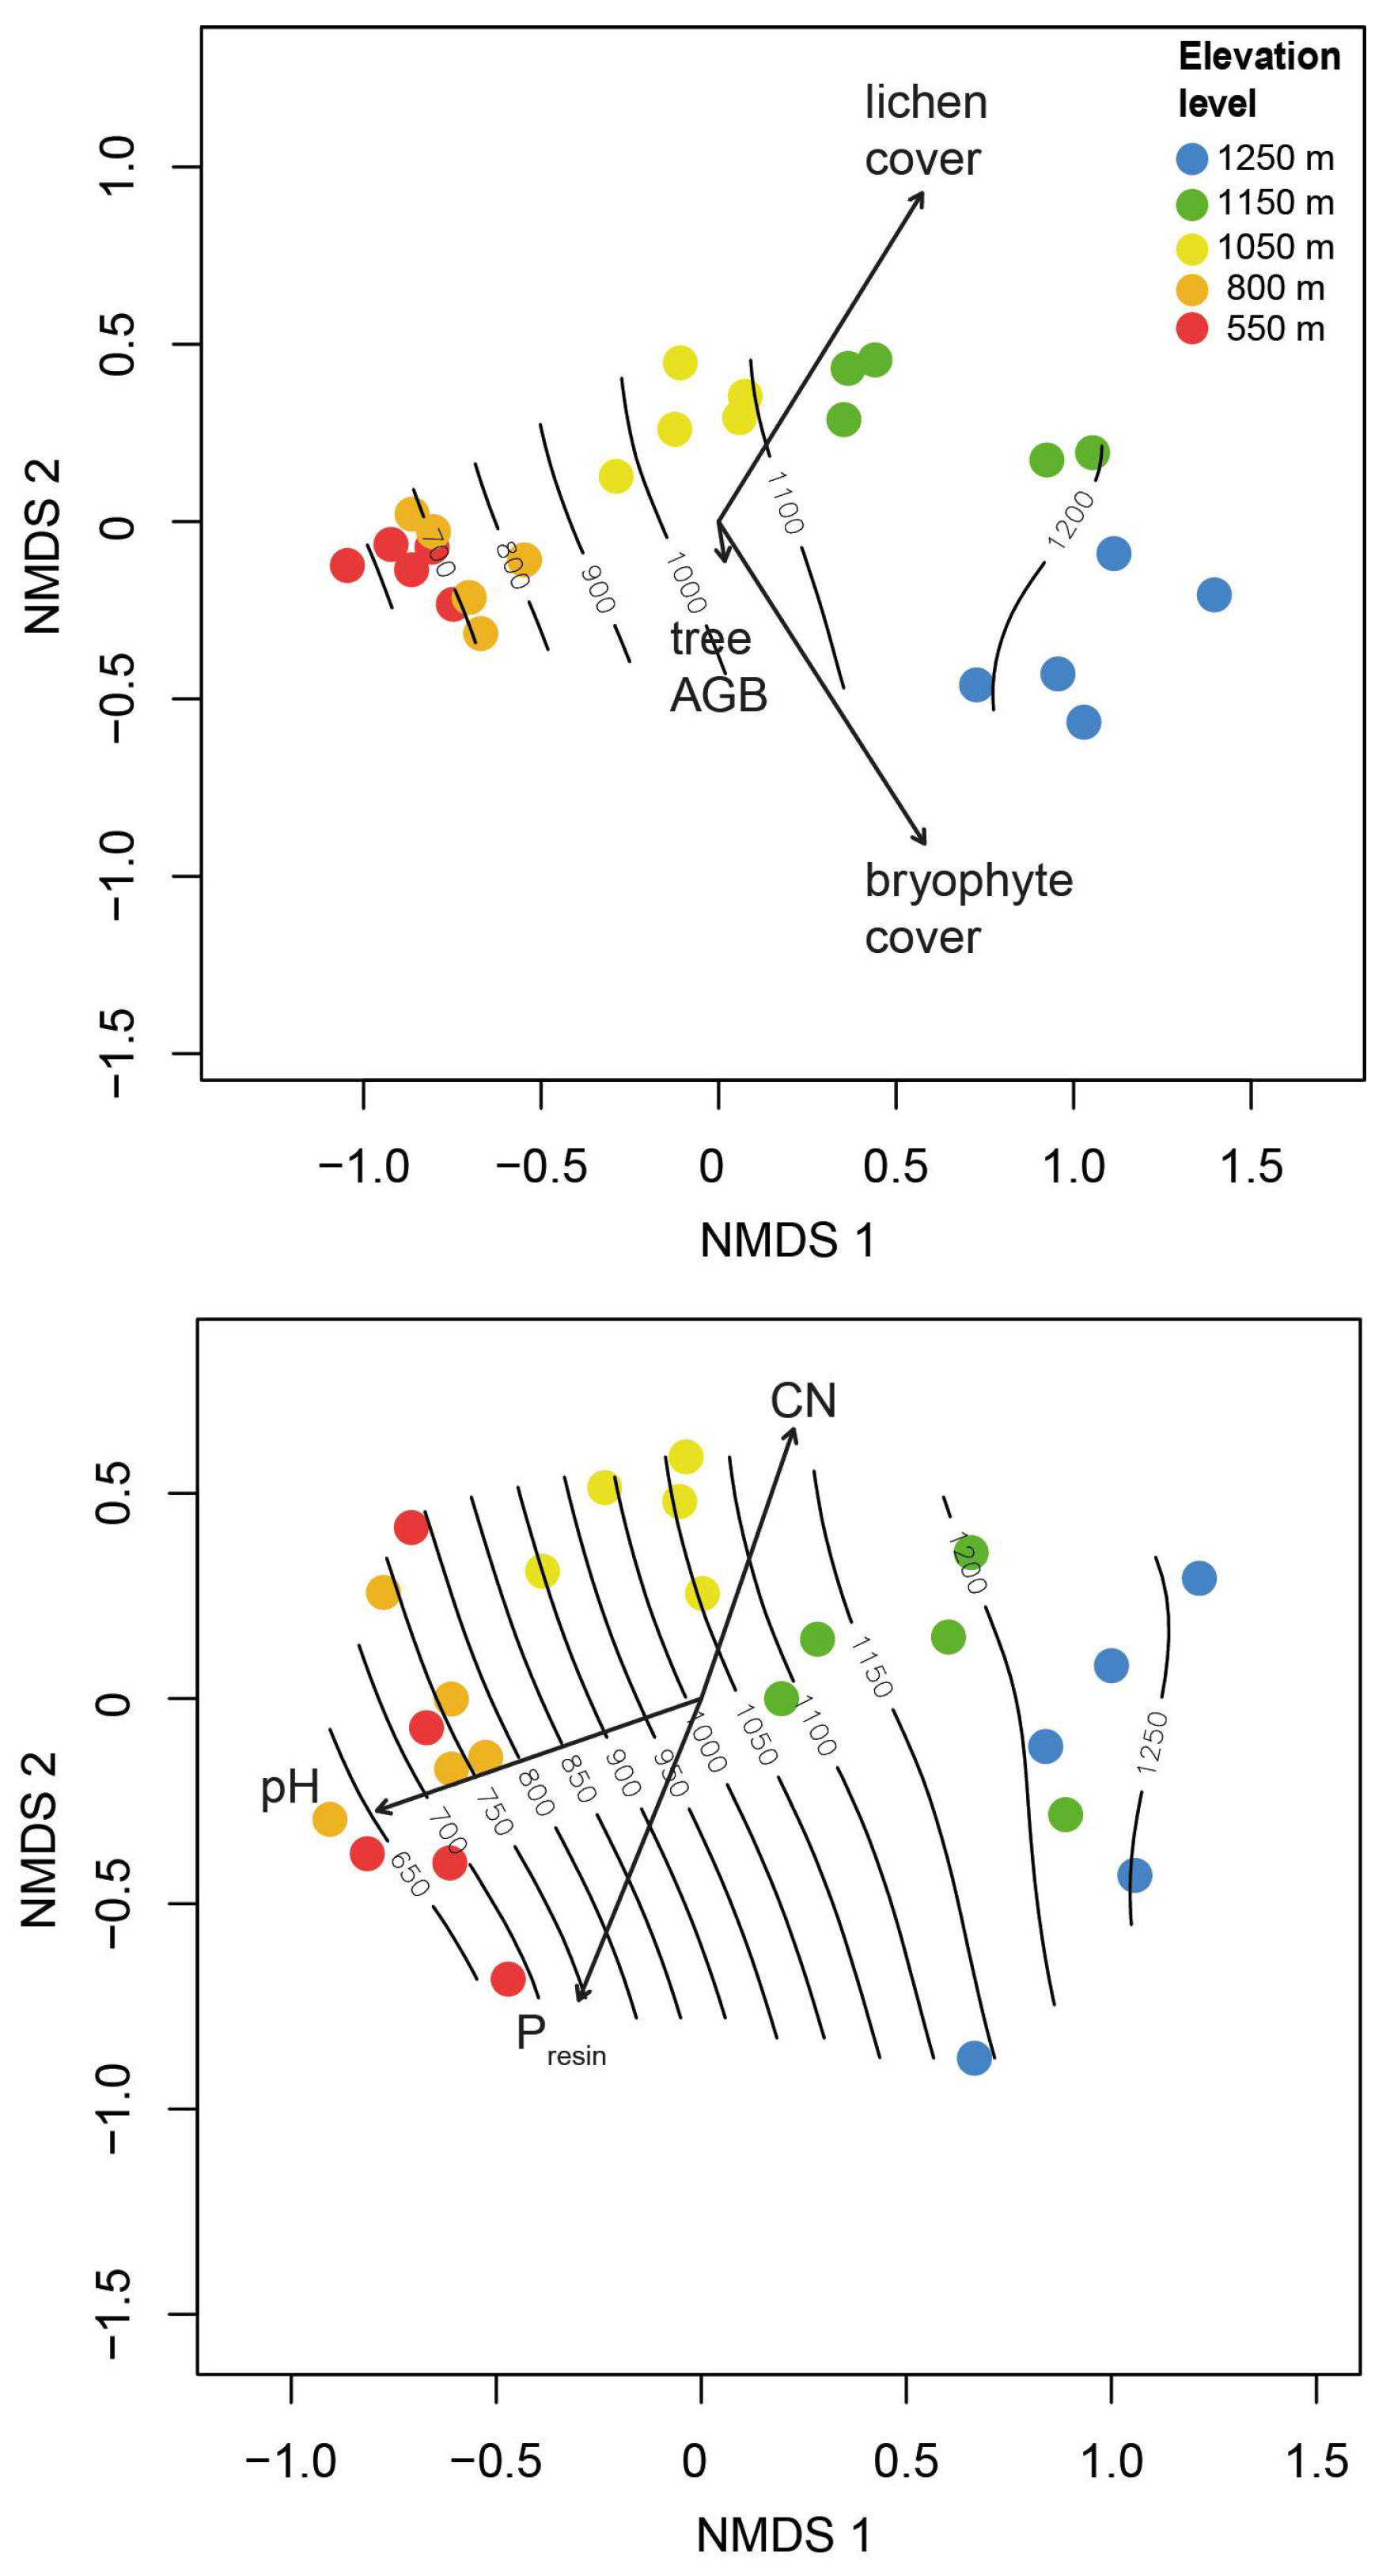
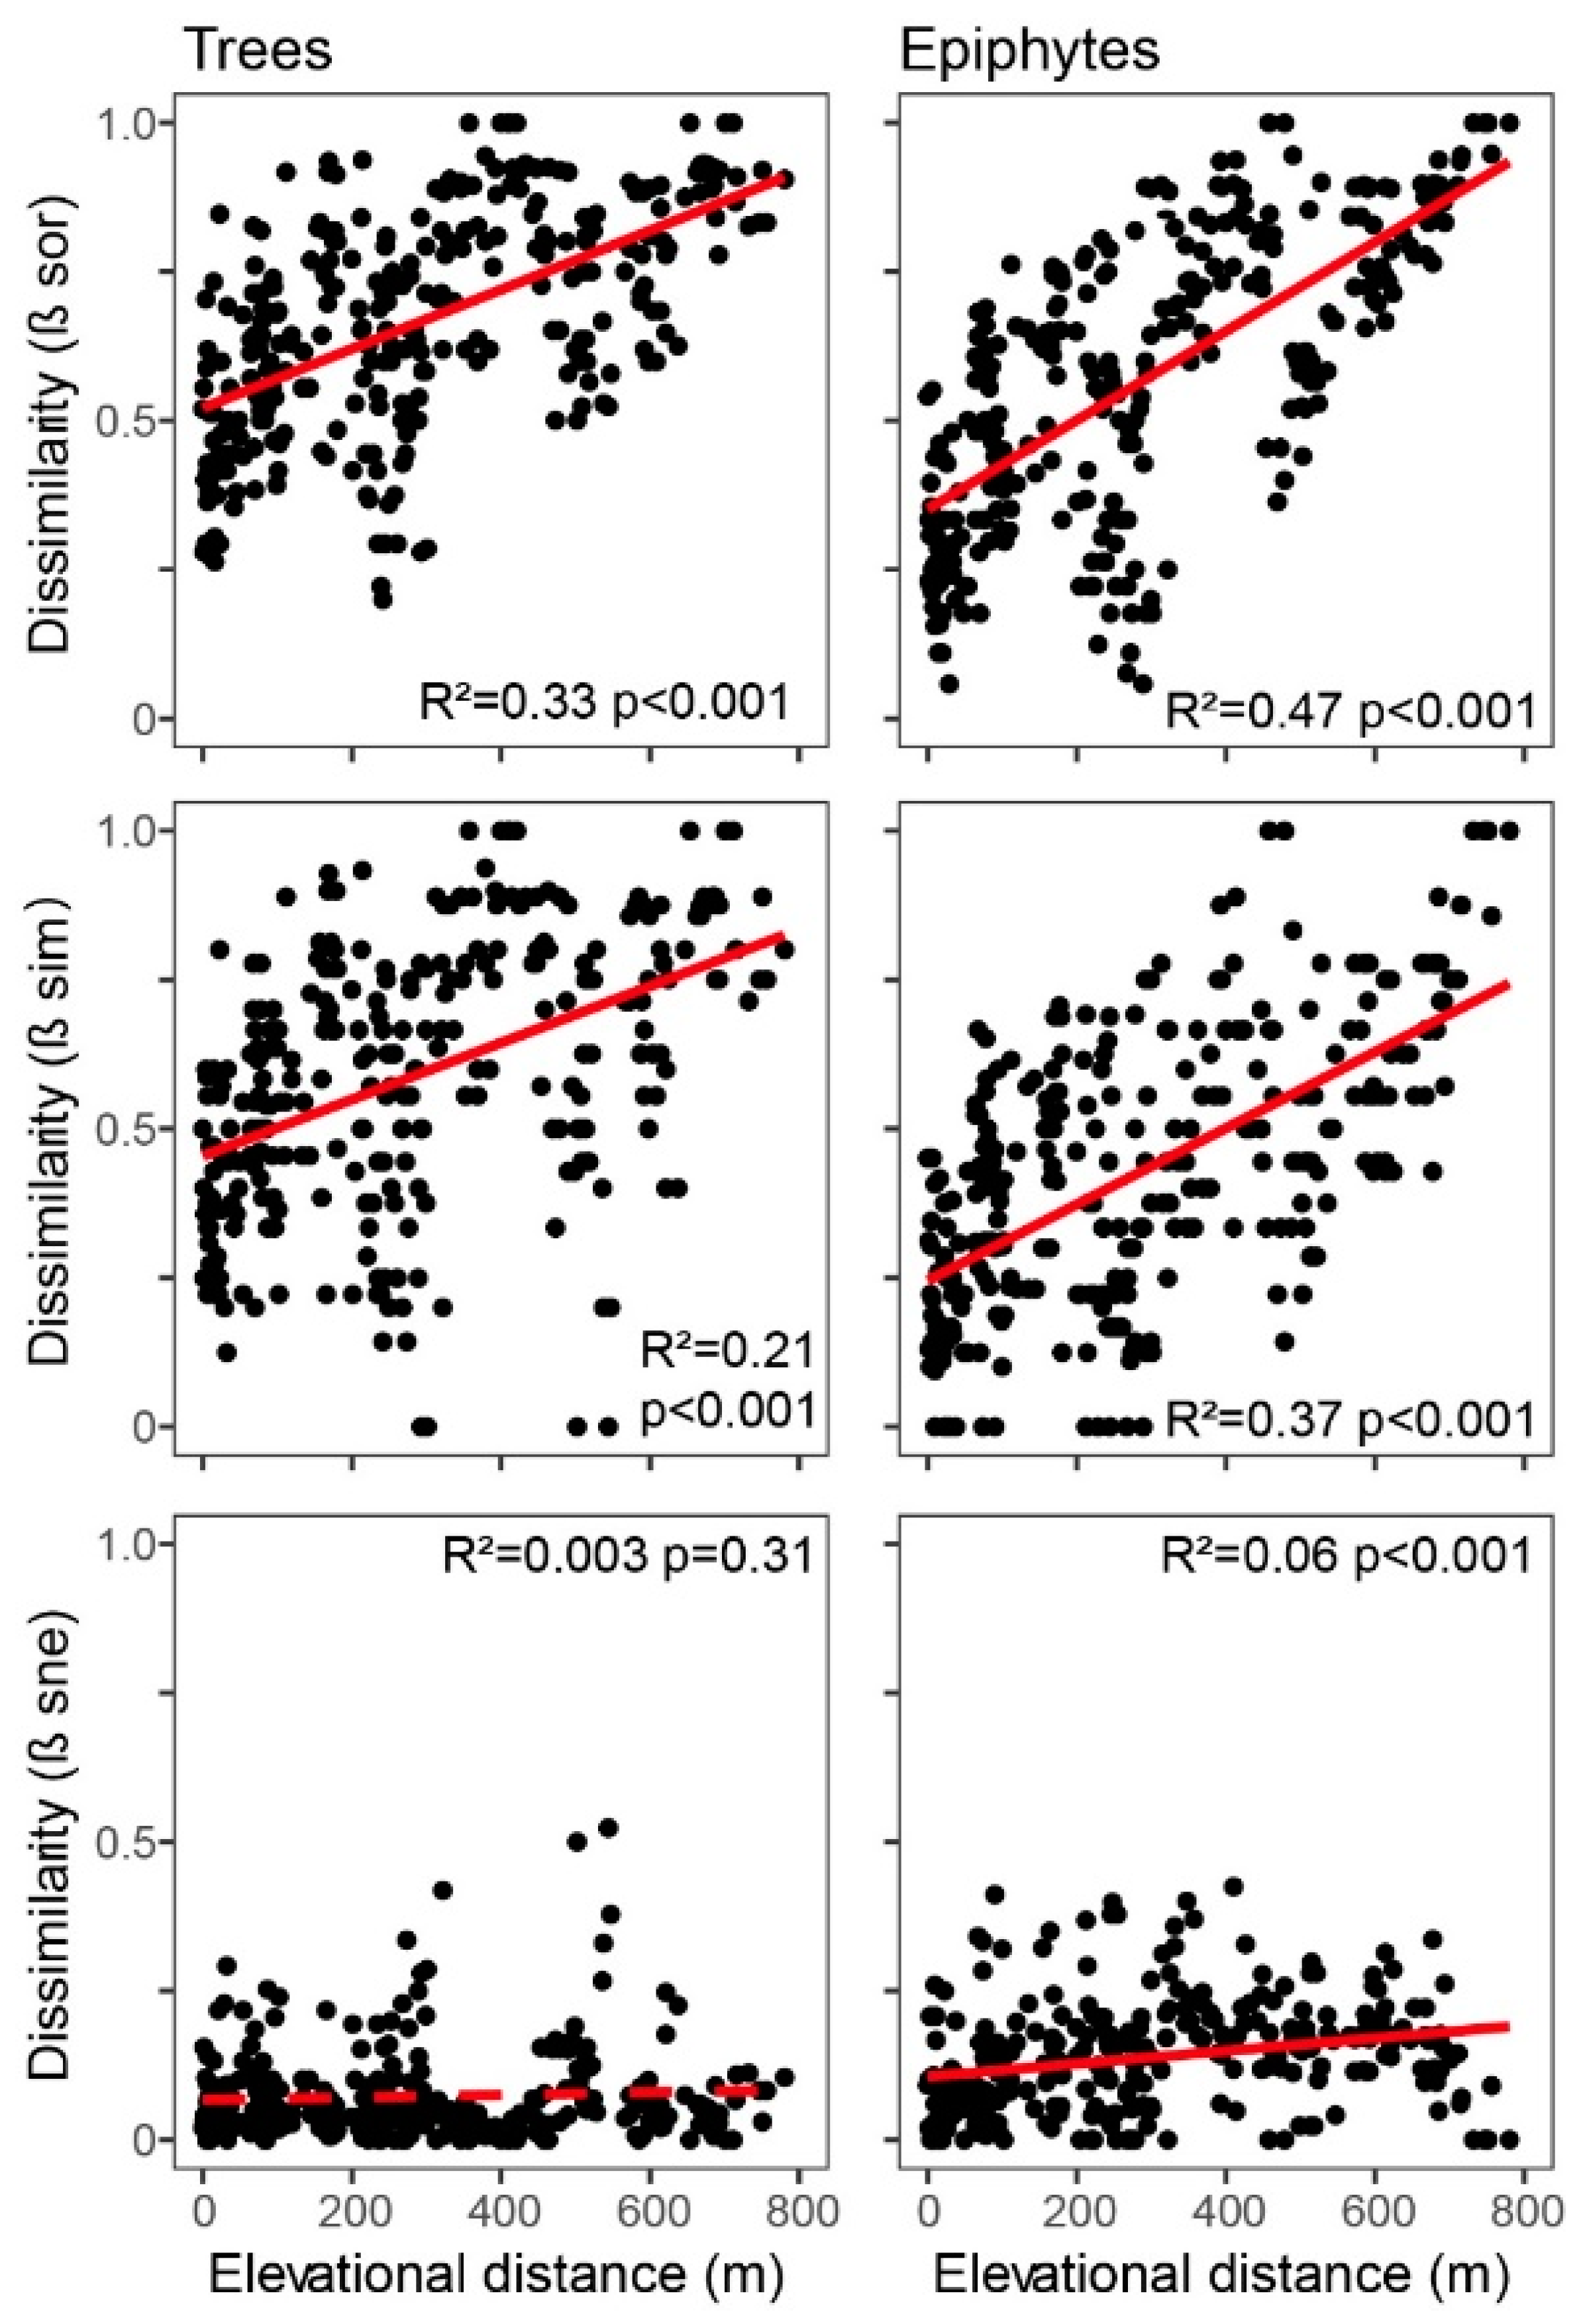
2.6. Composition and Turnover
3. Discussion
3.1. Biomass
3.2. Diversity and Composition
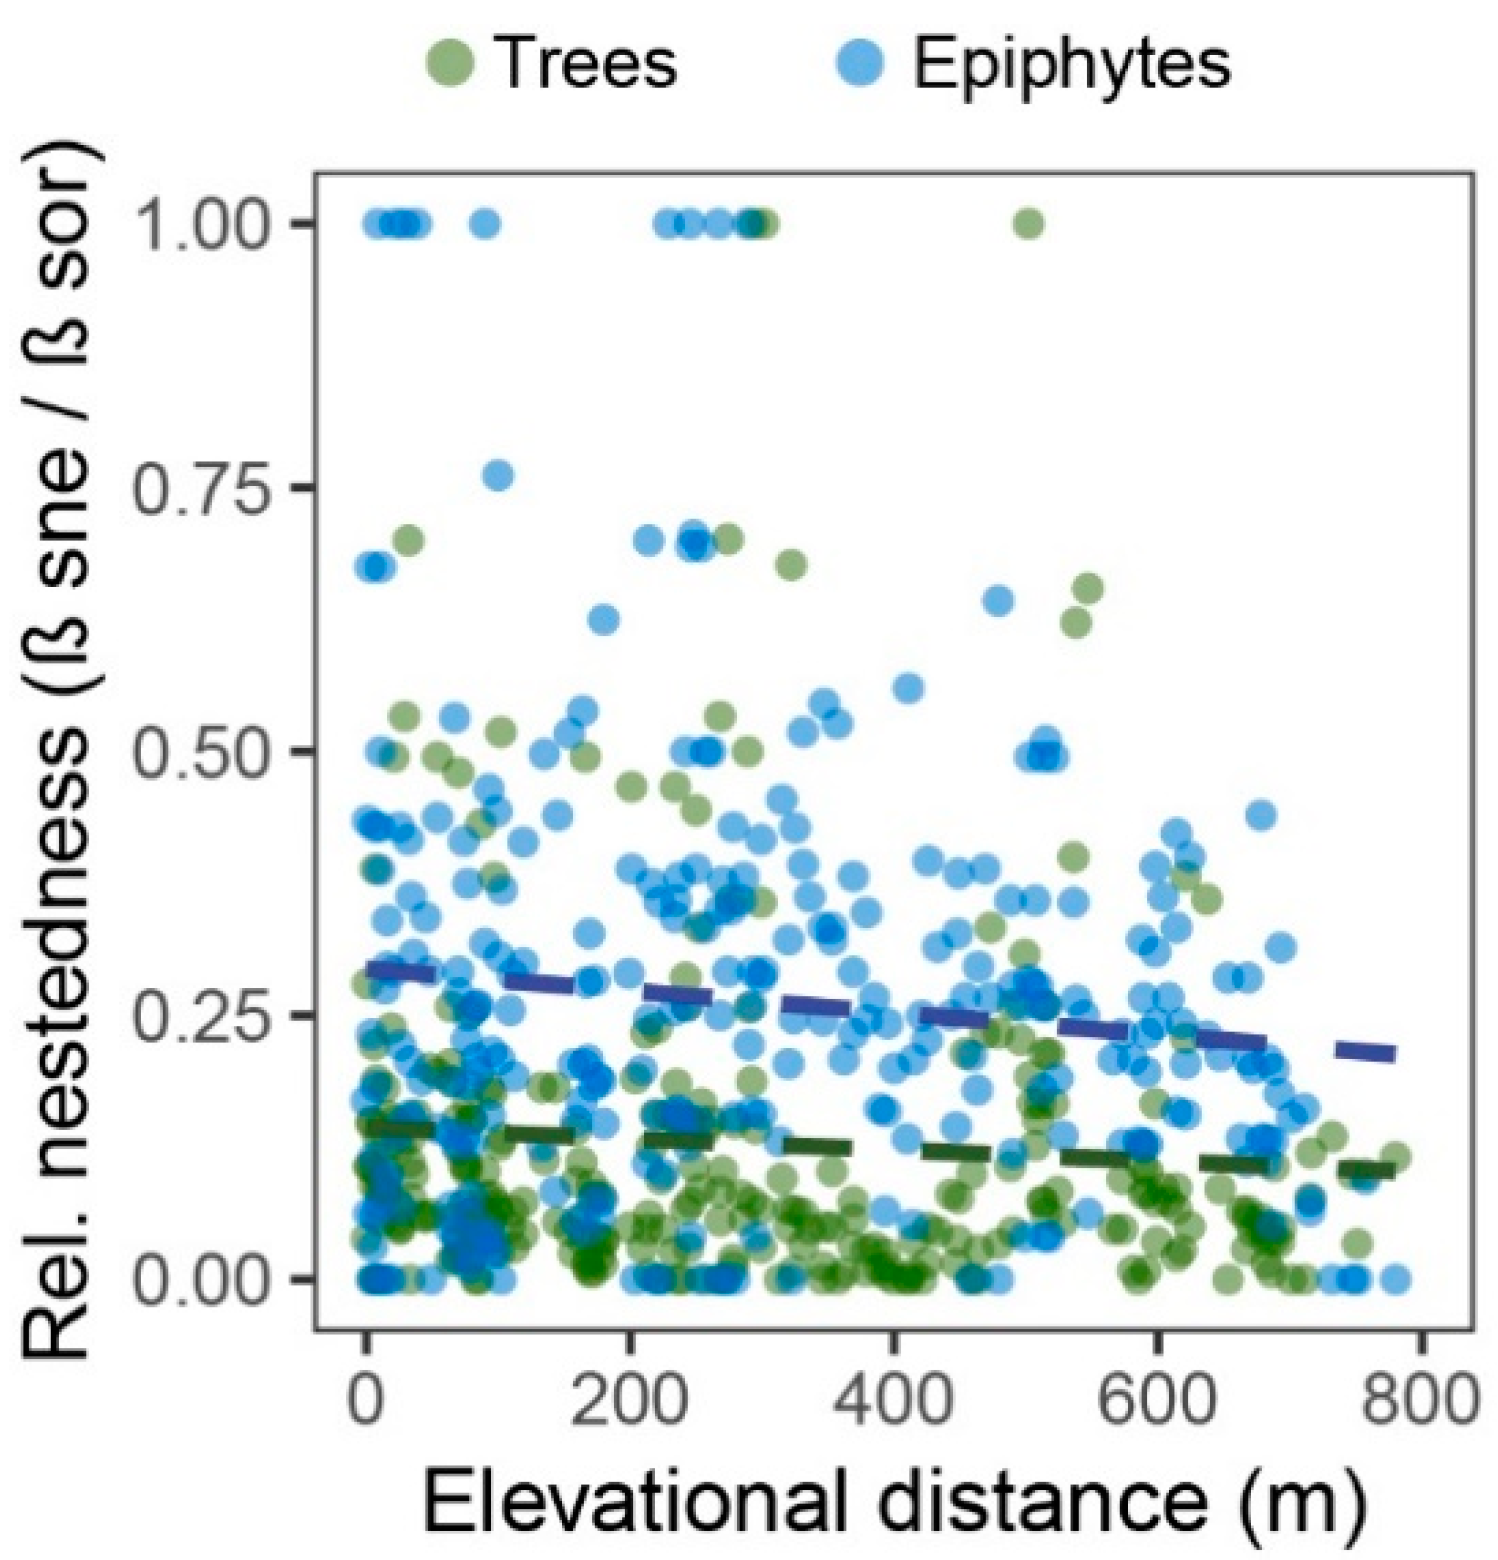
3.3. Turnover and Nestedness
4. Methods
4.1. Study Site
4.2. Forest Inventory
4.3. Epiphyte and Tree Biomass Estimation
4.4. Data Analysis
5. Conclusions
Supplementary Materials
Author Contributions
Funding
Data Availability Statement
Acknowledgments
Conflicts of Interest
References
- Fjeldså, J. How broad-scale studies of patterns and processes can serve to guide conservation planning in Africa. Conserv. Biol. 2007, 21, 659–667. [Google Scholar] [CrossRef] [PubMed]
- Thomas, C.D.; Anderson, B.J.; Moilanen, A.; Eigenbrod, F.; Heinemeyer, A.; Quaife, T.; Roy, D.B.; Gillings, S.; Armsworth, P.R.; Gaston, K.J. Reconciling biodiversity and carbon conservation. Ecol. Lett. 2013, 16, 39–47. [Google Scholar] [CrossRef] [PubMed]
- Marco, M.; Harwood, T.; Hoskins, A.; Ware, C.; Hill, S.; Ferrier, S. Projecting impacts of global climate and land-use scenarios on plant biodiversity using compositional-turnover modelling. Glob. Chang. Biol. 2019, 25, 2763–2778. [Google Scholar] [CrossRef]
- Bründl, A.; Sallé, L.; Lejeune, L.; Sorato, E.; Thiney, A.; Chaine, A.; Russell, A. Elevational gradients as a model for understanding associations among temperature, breeding phenology and success. Front. Ecol. Evol. 2020, 8, 563377. [Google Scholar] [CrossRef]
- DRYFLOR. Plant diversity patterns in neotropical dry forests and their conservation implications. Science 2016, 353, 1383–1387. [Google Scholar] [CrossRef] [PubMed]
- Buchadas, A.; Jung, M.; Bustamante, M.; Fernández-Llamazares, Á.; Garnett, S.; Nanni, A.; Ribeiro, N.; Meyfroidt, P.; Kuemmerle, T. Tropical dry woodland loss occurs disproportionately in areas of highest conservation value. Glob. Chang. Biol. 2023, 29, 4880–4897. [Google Scholar] [CrossRef]
- Aguirre Mendoza, Z.; Geada-Lopez, G. Estado de conservación de los bosques secos de la provincia de Loja, Ecuador. Arnaldoa 2017, 24, 207–228. [Google Scholar]
- Rivas, C.A.; Guerrero-Casado, J.; Navarro-Cerillo, R.M. Deforestation and fragmentation trends of seasonal dry tropical forest in Ecuador: Impact on conservation. For. Ecosyst. 2021, 8, 46. [Google Scholar] [CrossRef]
- Buchadas, A.; Baumann, M.; Meyfroidt, P.; Kuemmerle, T. Uncovering major types of deforestation frontiers across the world’s tropical dry woodlands. Nat. Sustain. 2022, 5, 619–627. [Google Scholar] [CrossRef]
- Amici, A.; Nadkarni, N.; Williams, C.; Gotsch, S. Differences in epiphyte biomass and community composition along landscape and within-crown spatial scales. Biotropica 2019, 52, 46–58. [Google Scholar] [CrossRef]
- Jaramillo, V.J.; Martínez-Yrízar, A.; Sanford, R.L. Primary productivity and biogeochemistry of seasonally dry tropical forests. In Seasonally Dry Tropical Forests: Ecology and Conservation; Bullock, S.H., Mooney, H.A., Eds.; Stanford University: Stanford, CA, USA, 2011; pp. 109–128. [Google Scholar]
- Homeier, J.; Leuschner, C. Factors controlling the productivity of tropical Andean forests: Climate and soil are more important than tree diversity. Biogeosciences 2021, 18, 1525–1541. [Google Scholar] [CrossRef]
- Malizia, A.; Blundo, C.; Carilla, J.; Osinaga Acosta, O.; Cuesta, F.; Duque, A.; Young, K.R. Elevation and latitude drives structure and tree species composition in Andean forests: Results from a large-scale plot network. PLoS ONE 2020, 15, e0231553. [Google Scholar] [CrossRef] [PubMed]
- Gómez-Díaz, J.A.; Bautista-Bello, A.P.; Carvajal-Hernández, C.I.; Guzmán-Jacob, V.; Monge-González, M.L.; Krömer, T. Diversity Patterns of Vascular Plant Groups Along Gradients of Elevation and Disturbance in Mexico. In Neotropical Gradients and Their Analysis; Myster, R., Ed.; Springer: Heidelberg, Germany, 2023; pp. 391–418. [Google Scholar]
- Kreft, H.; Köster, N.; Küper, W.; Nieder, J.; Barthlott, W. Diversity and biogeography of vascular epiphytes in Western Amazonia, Yasuní, Ecuador. J. Biogeogr. 2004, 31, 1463–1476. [Google Scholar] [CrossRef]
- Werner, F.A. Reduced growth and survival of vascular epiphytes on isolated remnant trees in a recent tropical montane forest clear-cut. Bas. Appl. Ecol. 2009, 12, 172–181. [Google Scholar] [CrossRef]
- Gotsch, S.; Davidson, K.; Murray, J.; Duarte, V.; Draguljic, D. Vapor pressure deficit predicts epiphyte abundance across an elevational gradient in a tropical montane region. Am. J. Bot. 2017, 104, 1790–1801. [Google Scholar] [CrossRef]
- Werner, F.A.; Gradstein, S.R. Diversity of epiphytes along a gradient of disturbance in an interandean dry forest, northern Ecuador. J. Veg. Sci. 2009, 20, 59–68. [Google Scholar] [CrossRef]
- Zotz, G.; Hietz, P.; Schmidt, G. Small plants large plants. J. Experim. Bot. 2001, 52, 2051–2056. [Google Scholar] [CrossRef]
- Werner, F.A.; Gradstein, S.R. Establishment of vascular epiphytes on isolated and enclosed forest trees in an Andean landscape, Ecuador. Biodiv. Cons. 2008, 17, 3195–3207. [Google Scholar] [CrossRef]
- Gentry, A.H.; Dodson, C.H. Contribution of nontrees to species richness of a tropical rain forest. Biotropica 1987, 19, 149–156. [Google Scholar] [CrossRef]
- Werner, F.A.; Homeier, J.; Oesker, M.; Boy, J. Epiphytic biomass of a tropical Andean forest varies with topography. J. Trop. Ecol. 2012, 28, 23–31. [Google Scholar] [CrossRef]
- Hofstede, R.G.M.; Wolf, J.H.D.; Benzing, D.H. Epiphytic biomass and nutrient status of a Colombian upper montane rain forest. Selbyana 1993, 14, 37–45. [Google Scholar]
- Benzing, D.H. Vascular Epiphytes: General biology and Related Biota; Cambridge University Press: New York, NY, USA, 1990. [Google Scholar]
- Burns, K.C.; Zotz, G. A hierarchical framework for investigating epiphyte assemblages: Networks, meta-communities, and scale. Ecology 2010, 91, 377–385. [Google Scholar] [CrossRef] [PubMed]
- Spicer, M.E.; Woods, C.L. A case for studying biotic interactions in epiphyte ecology and evolution. Perspect. Plant Ecol. Evol. Syst. 2022, 54, 125658. [Google Scholar] [CrossRef]
- Matsuo, T.; Martínez-Ramos, M.; Onoda, Y.; Bongers, F.; Lohbeck, M.; Poorter, L. Light competition drives species replacement during secondary tropical forest succession. Oecologia 2024, 205, 1–11. [Google Scholar] [CrossRef] [PubMed]
- Gei, M.G.; Powers, J.S. Nutrient cycling in tropical dry forests. In Tropical Dry Forests in the Americas: Ecology, Conservation, and Management; Sanchez-Azofeifa, G.A., Powers, J.S., Fernandes, G.W., Quesada, M., Eds.; CRC Press: Boca Raton, FL, USA, 2014; pp. 141–155. [Google Scholar]
- Mendieta-Leiva, G.; Porada, P.; Bader, M.Y. Interactions of epiphytes with precipitation partitioning. In Precipitation Partitioning by Vegetation: A Global Synthesis; Aubrey, D.P., Ed.; Springer: Heidelberg, Germany, 2020; pp. 133–146. [Google Scholar]
- Victoriano-Romero, E.; Valencia-Díaz, S.; García-Franco, J.; Mehltreter, K.; Toledo-Hernández, V.; Flores-Palacios, A. Interactions between epiphytes during canopy soil formation: An experiment in a lower montane cloud forest of southeastern Mexico. Plant Biol. 2023, 25, 468–477. [Google Scholar] [CrossRef]
- Dudgeon, W. Successions of epiphytes in the Quercus incana forests at Landour, Western Himalayas. J. Ind. Bot. Soc. 1923, 3, 270–272. [Google Scholar]
- Johansson, D. Ecology of Vascular Epiphytes in West African Rain Forest. Ph.D. Thesis, Uppsala University, Uppsala, Sweden, 1974. [Google Scholar]
- Wolf, J.H.D. Non-vascular epiphyte diversity patterns in the canopy of an upper montane rain forest (2550–3670 m), Central Cordillera, Colombia. Selbyana 1995, 16, 185–195. [Google Scholar]
- Ingram, S.W.; Nadkarni, N.M. Composition and distribution of epiphytic organic matter in a Neotropical cloud forest, Costa Rica. Biotropica 1993, 25, 370–383. [Google Scholar] [CrossRef]
- Taylor, A.; Burns, K. Plant composition patterns inside an endemic birds’ nest fern (Asplenium goudeyi) on Lord Howe Island. J. Trop. Ecol. 2015, 31, 413–421. [Google Scholar] [CrossRef]
- Nadkarni, N.M. Epiphyte biomass and nutrient capital of a Neotropical elfin forest. Biotropica 1984, 16, 249–256. [Google Scholar] [CrossRef]
- Baselga, A. Partitioning the turnover and nestedness components of beta diversity. Global Ecol. Biogeogr. 2010, 19, 134–143. [Google Scholar] [CrossRef]
- Si, X.; Baselga, A.; Ding, P. Revealing beta-diversity patterns of breeding bird and lizard communities on inundated land-bridge islands by separating the turnover and nestedness components. PLoS ONE 2015, 10, e0127692. [Google Scholar] [CrossRef] [PubMed]
- Bergamin, R.; Bastazini, V.; Vélez-Martin, E.; Debastiani, V.; Zanini, K.; Loyola, R.; Müller, S. Linking beta diversity patterns to protected areas: Lessons from the Brazilian Atlantic Rainforest. Biodiv. Cons. 2017, 26, 1557–1568. [Google Scholar] [CrossRef]
- Palacios, W. Pradosia aureae. Cinchonia 2024, 19, 296–302. [Google Scholar]
- Pennington, R.T.; Lehmann, C.E.; Rowland, L.M. Tropical savannas and dry forests. Curr. Biol. 2018, 28, R541–R545. [Google Scholar] [CrossRef]
- Unger, M.; Leuschner, C.; Homeier, J. Variability of indices of macronutrient availability in soils at different spatial scales along an elevation transect in tropical moist forests (NE Ecuador). Plant Soil 2010, 336, 443–458. [Google Scholar] [CrossRef]
- Rahbek, C.; Borregaard, M.K.; Colwell, R.K.; Dalsgaard, B.; Holt, B.G.; Morueta-Holme, N.; Nogues-Bravo, D.; Whittaker, R.J.; Fjeldså, J. Humboldt’s enigma: What causes global patterns of mountain biodiversity? Science 2019, 365, 1108–1113. [Google Scholar] [CrossRef]
- Krömer, T.; Acebey, A.; Kluge, J.; Kessler, M. Effects of altitude and climate in determining elevational plant species richness patterns: A case study from Los Tuxtlas, Mexico. Flora 2013, 208, 197–210. [Google Scholar] [CrossRef]
- Sanger, J.C.; Kirkpatrick, J.B. Moss and vascular epiphyte distributions over host tree and elevation gradients in Australian subtropical rainforest. Austral. J. Bot. 2015, 63, 696–704. [Google Scholar] [CrossRef]
- Ding, Y.; Liu, G.; Zang, R.; Lu, X.; Huang, J. Distribution of vascular epiphytes along a tropical elevational gradient: Disentangling abiotic and biotic determinants. Nature 2016, 6, 19706. [Google Scholar] [CrossRef]
- Rodríguez Quiel, C.; Zotz, G. Vascular epiphytes assemblages along an elevational gradient on isolated trees in Southwest Panama. Diversity 2021, 13, 49. [Google Scholar] [CrossRef]
- Berrios, H.K.; Coronado, I.; Marsico, T.D. High species richness and turnover of vascular epiphytes is associated with water availability along the elevation gradient of Volcán Maderas, Nicaragua. Ecol. Evol. 2022, 12, e9501. [Google Scholar] [CrossRef]
- Karger, D.N.; Kluge, J.; Abrahamczyk, S.; Salazar, L.; Homeier, J.; Lehnert, M.; Kessler, M. Bryophyte cover of trees as proxy for air humidity in the tropics. Ecol. Indic. 2012, 20, 277–281. [Google Scholar] [CrossRef]
- Batke, S.P.; Murphy, B.R.; Hill, N.; Kelly, D.L. Can air humidity and temperature regimes within cloud forest canopies be predicted from bryophyte and lichen cover? Ecol. Indic. 2015, 56, 1–5. [Google Scholar] [CrossRef]
- Pharo, E.J.; Vitt, D.H. Local variation in bryophyte and macro-lichen cover and diversity in montane forests of western Canada. Bryologist 2000, 103, 455–466. [Google Scholar] [CrossRef]
- Werner, F.A.; Gradstein, S.R. Spatial distribution and abundance of epiphytes along a gradient of human disturbance in an interandean dry valley, Ecuador. Selbyana 2010, 30, 208–215. [Google Scholar]
- Miranda-Gonzalez, R.; McCune, B. The weight of the crust: Biomass of crustose lichens in tropical dry forest represents more than half of foliar biomass. Biotropica 2020, 52, 1298–1308. [Google Scholar] [CrossRef]
- Homeier, J.; Salazar, L.; Chinchero, M.A.; Bossen, S.; Trogisch, S.; Unger, M.; Leuschner, C. Diversidad de plantas vasculares en relación con factores edafológicos y climáticos en los bosques de la Reserva Biosfera Sumaco y sus alrededores. In Gente, Bosque y Biodiversidad: El rol del Bosque Sobre la Biodiversidad y las Poblaciones Rurales; Torres, B., Vargas, J.C., Arteaga, Y., Torres, A., Lozano, P., Eds.; Universidad Estatal Amazónica, Programa Economía de Recursos Naturales y Desarrollo Empresarial: Puyo, Ecuador, 2017; pp. 203–218. [Google Scholar]
- Krömer, T.; Kessler, M.; Gradstein, S.R.; Acebey, A.R. Diversity patterns of vascular epiphytes along an elevational gradient in the Andes. J. Biogeogr. 2005, 32, 1799–1809. [Google Scholar] [CrossRef]
- Gehrig-Downie, C.; Obregón, A.; Bendix, J.; Gradstein, S. Epiphyte biomass and canopy microclimate in the tropical lowland cloud forest of French Guiana. Biotropica 2011, 43, 591–596. [Google Scholar] [CrossRef]
- Pardow, A.; Gehrig-Downie, C.; Gradstein, S.; Lakatos, M. Functional diversity of epiphytes in two tropical lowland rainforests, French Guiana: Using bryophyte life-forms to detect areas of high biodiversity. Biodiv. Cons. 2012, 21, 3637–3655. [Google Scholar] [CrossRef]
- Woods, C. Primary ecological succession in vascular epiphytes: The species accumulation model. Biotropica 2017, 49, 452–460. [Google Scholar] [CrossRef]
- Komada, N.; Itioka, T.; Nakanishi, A.; Tagane, S.; Shimizu-Kaya, U.; Nakagawa, M.; Meleng, P.; Pungga, R.; Kanzaki, M. Effects of host tree size on the species richness and abundance of epiphyte assemblages in a Bornean lowland tropical forest. Tropics 2022, 30, 53–61. [Google Scholar] [CrossRef]
- Hietz, P.; Hietz-Seifert, U. Structure and ecology of epiphyte communities of a cloud forest in central Veracruz, Mexico. J. Veg. Sci. 1995, 6, 719–728. [Google Scholar] [CrossRef]
- Cardelús, C.L.; Colwell, R.K.; Watkins, J.E. Vascular epiphyte distribution patterns: Explaining the mid-elevation richness peak. J. Ecol. 2006, 94, 144–156. [Google Scholar] [CrossRef]
- Jiménez-López, D.A.; Martínez-Camilo, R.; Martínez-Meléndez, N.; Kessler, M. Diversity of epiphyte ferns along an elevational gradient in El Triunfo Biosphere Reserve, southern Mexico. Plant Ecol. Evol. 2023, 153, 12–21. [Google Scholar] [CrossRef]
- Jørgensen, P.M.; León-Yánez, S. (Eds.) Catalogue of the vascular plants of Ecuador. In Monographs in Systematic Botany from the Missouri Botanical Garden; Missouri Botanical Garden Press: St. Louis, MO, USA, 1999; Volume 75, pp. 1–1182. [Google Scholar]
- Küper, W.; Kreft, H.; Nieder, J.; Köster, N.; Barthlott, W. Large-scale diversity patterns of vascular epiphytes in Neotropical montane rain forests. J. Biogeogr. 2004, 31, 1477–1487. [Google Scholar] [CrossRef]
- Homeier, J.; Breckle, S.W.; Günter, S.; Rollenbeck, R.T.; Leuschner, C. Tree diversity, forest structure and productivity along altitudinal and topographical gradients in a species-rich Ecuadorian montane rain forest. Biotropica 2010, 42, 140–148. [Google Scholar] [CrossRef]
- Whitmore, T.C.; Peralta, R.; Brown, K. Total species count in a Costa Rican tropical rain forest. J. Trop. Ecol. 1985, 1, 375–378. [Google Scholar] [CrossRef]
- Kelly, D.L.; Tanner, E.V.J.; Lughadha, E.N.; Kapos, V. Floristics and biogeography of a rain forest in the Venezuelan Andes. J. Biogeogr. 1994, 21, 421–440. [Google Scholar] [CrossRef]
- ter Steege, H.; Ek, R.; van Andel, T. A comparison of diversity patterns of tree and non-tree groups. In Plant Diversity in Guyana. With Recommendation for a Protected Areas Strategy; Series 18; ter Steege, H., Ed.; Tropenbos International: Ede, The Netherlands, 2000; Chapter 9. [Google Scholar]
- Balslev, H.; Valencia, R.; Paz y Miño, G.; Christensen, H.; Nielsen, I. Forest Biodiversity in North, Central and South America and the Carribean: Research and Monitoring; Man and the Biosphere Series; Dallmeier, F., Comiskey, J.A., Eds.; UNESCO and The Parthenon Publishing Group: Carnforth, UK, 1998; pp. 591–600. [Google Scholar]
- Linares-Palomino, R.; Cardona, V.; Hennig, E.I.; Hensen, I.; Hoffmann, D.; Lendzion, J.; Soto, D.; Herzog, S.K.; Kessler, M. Non-woody life-form contribution to vascular plant species richness in a tropical American forest. Plant Ecol. 2009, 201, 87–99. [Google Scholar] [CrossRef]
- Soininen, J.; Heino, J.; Wang, J. A meta-analysis of nestedness and turnover components of beta diversity across organisms and ecosystems. Glob. Ecol. Biogeogr. 2017, 27, 96–109. [Google Scholar] [CrossRef]
- Hylander, K.; Nilsson, C.; Jonsson, B.; Göthner, T. Difference in habitat quality explain nestedness in a land snail meta-community. Oikos 2005, 108, 351–361. [Google Scholar] [CrossRef]
- Mendieta-Leiva, G.; Buckley, H.L.; Zotz, G. Directional changes over time in the species composition of tropical vascular epiphyte assemblages. J. Ecol. 2021, 110, 553–568. [Google Scholar] [CrossRef]
- Guzmán-Jacob, V.; Zotz, G.; Craven, D.; Taylor, A.; Krömer, T.; Monge, M.; Kreft, H. Effects of forest-use intensity on vascular epiphyte diversity along an elevational gradient. Div. Distr. 2019, 26, 4–15. [Google Scholar] [CrossRef]
- Nascimbene, J.; Spitale, D. Patterns of beta-diversity along elevational gradients inform epiphyte conservation in alpine forests under a climate change scenario. Biol. Cons. 2017, 216, 26–32. [Google Scholar] [CrossRef]
- Weigend, M. Observations on the biogeography of the Amotape-Huancabamba zone in northern Peru. Bot. Rev. 2002, 68, 38–54. [Google Scholar] [CrossRef]
- Richter, M.; Diertl, K.-H.; Emck, P.; Peters, T.; Beck, E. Reasons for an outstanding plant diversity in the tropical Andes of Southern Ecuador. Landsc. Online 2009, 12, 1–35. [Google Scholar] [CrossRef]
- Manchego, C.E.; Hildebrandt, P.; Cueva, J.; Espinosa, C.I.; Stimm, B.; Günter, S. Climate change versus deforestation: Implications for tree species distribution in the dry forests of southern Ecuador. PLoS ONE 2017, 12, e0190092. [Google Scholar] [CrossRef]
- Wurz, A.; Bendix, J.; Homeier, J.; Matt, F.; Paladines, P.; Serrano, F.; Farwig, N. A hidden gem in the Tumbesian dry forest in southern Ecuador: Estacíon Científica Laipuna. Ecotropica 2023, 25, 202301. [Google Scholar]
- Best, B.; Kessler, M. Biodiversity and Conservation in Tumbesian Ecuador and Peru; BirdLife International: Cambridge, UK, 1995. [Google Scholar]
- Pucha Cofrep, D.; Peters, T.; Bräuning, A. Wet season precipitation during the past century reconstructed from tree-rings of a tropical dry forest in Southern Ecuador. Glob. Planet. Chang. 2015, 133, 65–78. [Google Scholar] [CrossRef]
- Spannl, S.; Volland, F.; Pucha, D.; Peters, T.; Cueva, E.; Bräuning, A. Climate variability, tree increment patterns and ENSO-related carbon sequestration reduction of the tropical dry forest species Loxopterygium huasango of Southern Ecuador. Trees 2016, 30, 1245–1258. [Google Scholar] [CrossRef]
- Butz, P.; Hölscher, D.; Cueva, E.; Graefe, S. Tree water use patterns as influenced by phenology in a dry forest of Southern Ecuador. Front. Plant Sci. 2018, 9, 945. [Google Scholar] [CrossRef] [PubMed]
- Peters, T.; Richter, M. Climate Station Data Reserva Laipuna Mountain Peak. 2011. From DFG-FOR816dw. Available online: http://www.tropicalmountainforest.org/data_pre.do?citid=963 (accessed on 14 August 2024).
- Nieder, J.; Prosperi, J.; Michaloud, G. Epiphytes and their contribution to canopy diversity. Plant Ecol. 2001, 153, 51–63. [Google Scholar] [CrossRef]
- Sanford, W.W. Distribution of epiphytic orchids in semi-deciduous tropical forest in southern Nigeria. J. Ecol. 1968, 56, 697–705. [Google Scholar] [CrossRef]
- Chave, J.; Andalo, C.; Brown, S.; Cairns, M.A.; Chambers, J.Q.; Eamus, D.; Fölster, H.; Fromard, F.; Higuchi, N.; Kira, T.; et al. Tree allometry and improved estimation of carbon stocks and balance in tropical forests. Oecologia 2005, 145, 87–99. [Google Scholar] [CrossRef]
- Chave, J.; Muller-Landau, H.C.; Baker, T.R.; Easdale, T.A.; Steege, H.T.; Webb, C.O. Regional and phylogenetic variation of wood density across 2456 neotropical tree species. Ecol. Appl. 2006, 16, 2356–2367. [Google Scholar] [CrossRef]
- Gonzalez, K.C. Variación Altitudinal del Contenido de Carbono Aéreo de Bosques Secos en la Reserva Natural Laipuna al sur de Ecuador. Master’s Thesis, Universidad Nacional de Loja, Loja, Ecuador, 29 November 2023. [Google Scholar]
- Hammer, Ø.; Harper, D.A.T.; Ryan, P.D. PAST: Paleontological statistics software package for education and data analysis. Palaeontol. Electron. 2001, 4, 1–9. Available online: http://palaeo-electronica.org/2001_1/past/issue1_01.htm (accessed on 14 August 2024).
- Colwell, R.K. EstimateS: Statistical Estimation of Species Richness and Shared Species from Samples. 2006. Available online: http://purl.oclc.org/estimates (accessed on 14 August 2024).
- Oksanen, J.; Simpson, G.; Blanchet, F.; Kindt, R.; Legendre, P.; Minchin, P.; O′Hara, R.; Solymos, P.; Stevens, M.; Szoecs, E.; et al. Vegan: Community Ecology Package_. R package version 2.6-4, 2022. Available online: https://CRAN.R-project.org/package=vegan (accessed on 14 August 2024).
- Baselga, A.; Leprieur, F. Comparing methods to separate components of beta diversity. Meth. Ecol. Evol. 2015, 6, 1069–1079. [Google Scholar] [CrossRef]
- Baselga, A.; Orme, D.; Villeger, S.; De Bortoli, J.; Leprieur, F.; Logez, M.; Martinez-Santalla, S.; Martin-Devasa, R.; Gomez-Rodriguez, C.; Crujeiras, R. Betapart: Partitioning Beta Diversity into Turnover and Nestedness Components. R package version 1.6. 2023. Available online: https://CRAN.R-project.org/package=betapart (accessed on 14 August 2024).
- R Core Team. R: A Language and Environment for Statistical Computing; R Foundation for Statistical Computing: Vienna, Austria, 2024. Available online: https://www.R-project.org/ (accessed on 14 August 2024).
- Werner, F.A.; Homeier, J.; Gradstein, S.R. Ecology of vascular epiphytes on isolated remnant trees in the montane forest belt of southern Ecuador. Ecotropica 2005, 11, 21–40. [Google Scholar]
- Köster, N.; Friedrich, K.; Nieder, J.; Barthlott, W. Conservation of epiphyte diversity in an Andean landscape transformed by human land use. Conserv. Biol. 2009, 23, 911–919. [Google Scholar] [CrossRef]
- Mendieta-Leiva, G.; Ramos, F.N.; Elias, J.P.; Zotz, G.; Acuña-Tarazona, M.; Alvim, F.S.; Barbosa, D.E.F.; Basílio, G.A.; Batke, S.P.; Benavides, A.M.; et al. EpIG-DB: A database of vascular epiphyte assemblages in the Neotropics. J. Veg. Sci. 2020, 31, 518–528. [Google Scholar] [CrossRef]


| 550 m | 800 m | 1050 m | 1150 m | 1250 m | |||||||||||
|---|---|---|---|---|---|---|---|---|---|---|---|---|---|---|---|
| Mean | ± | SD | Mean | ± | SD | Mean | ± | SD | Mean | ± | SD | Mean | ± | SD | |
| Elevation (m a.s.l.) | 550.6 | ± | 17.5 | 810.6 | ± | 27.5 | 1057.4 | ± | 18.1 | 1152.0 | ± | 13.6 | 1248.6 | ± | 31.5 |
| Slope inclination (°) | 30.6 | ± | 4.8 | 29.8 | ± | 8.1 | 22.0 | ± | 3.8 | 26.5 | ± | 6.3 | 29.2 | ± | 4.2 |
| Soil pH (KCl) | 6.5 | ± | 0.1 | 6.6 | ± | 0.1 | 5.9 | ± | 0.1 | 5.7 | ± | 0.2 | 5.9 | ± | 0.3 |
| Soil Ntotal (%) | 0.2 | ± | 0.0 | 0.3 | ± | 0.0 | 0.3 | ± | 0.1 | 0.3 | ± | 0.1 | 0.6 | ± | 0.1 |
| Soil C/N | 10.1 | ± | 1.0 | 10.7 | ± | 0.7 | 11.6 | ± | 0.5 | 11.2 | ± | 0.5 | 11.0 | ± | 0.3 |
| Soil Presin (µmol g−1) | 0.6 | ± | 1.2 | 2.5 | ± | 0.9 | 0.5 | ± | 0.2 | 1.4 | ± | 0.7 | 1.9 | ± | 1.0 |
| Soil cation exchange capacity (µmol g−1) | 23.1 | ± | 29.6 | 58.0 | ± | 42.1 | 32.4 | ± | 22.6 | 176.1 | ± | 202.5 | 296.5 | ± | 206.3 |
| Soil base saturation (%) | 99.7 | ± | 0.3 | 95.0 | ± | 11.3 | 89.0 | ± | 22.5 | 88.6 | ± | 11.5 | 88.8 | ± | 6.8 |
| Lichen cover understorey (%) | 1.2 | ± | 0.4 | 7.0 | ± | 3.7 | 26.6 | ± | 15.7 | 37.8 | ± | 12.4 | 24.0 | ± | 9.5 |
| Lichen cover canopy (%) | 2.2 | ± | 2.2 | 3.0 | ± | 2.7 | 29.4 | ± | 11.5 | 46.4 | ± | 7.8 | 33.6 | ± | 13.3 |
| Bryophyte cover understorey (%) | 1.2 | ± | 0.4 | 1.0 | ± | 0.0 | 7.4 | ± | 5.9 | 9.6 | ± | 2.7 | 41.4 | ± | 6.8 |
| Bryophyte cover canopy (%) | 1.0 | ± | 0.0 | 1.0 | ± | 0.0 | 3.6 | ± | 2.9 | 4.8 | ± | 1.5 | 18.6 | ± | 4.0 |
| 550 m | 800 m | 1050 m | 1150 m | 1250 m | |||||||||||
|---|---|---|---|---|---|---|---|---|---|---|---|---|---|---|---|
| Mean | ± | SD | Mean | ± | SD | Mean | ± | SD | Mean | ± | SD | Mean | ± | SD | |
| Trees | |||||||||||||||
| Individuals | 22.2 | ± | 3.8 | 24.4 | ± | 8.5 | 43.8 | ± | 5.1 | 33.0 | ± | 8.7 | 48.8 | ± | 9.1 |
| Basal area (cm2 plot−1) | 8902 | ± | 2773 | 17,453 | ± | 9400 | 10,695 | ± | 1398 | 9838 | ± | 2735 | 10,081 | ± | 2595 |
| AGB (Mg ha−1) a | 113 | ± | 38 | 171 | ± | 87 | 82 | ± | 23 | 133 | ± | 24 | 135 | ± | 45 |
| Species density raw | 7.4 | ± | 1.5 | 10.4 | ± | 3.2 | 14.0 | ± | 1.6 | 11.2 | ± | 1.5 | 16.0 | ± | 3.7 |
| Species density rarefied (n = 13) | 5.7 | ± | 0.8 | 7.6 | ± | 1.1 | 7.8 | ± | 0.8 | 7.2 | ± | 0.7 | 7.9 | ± | 1.5 |
| Species richness observed | 17 | 21 | 28 | 22 | 38 | ||||||||||
| Species richness estimated | |||||||||||||||
| Chao 1 | 20.3 | ± | 4.1 | 28.0 | ± | 7.1 | 29.3 | ± | 1.7 | 24.5 | ± | 3.2 | 39.3 | ± | 1.6 |
| Chao 2 | 31.4 | ± | 13.1 | 25.5 | ± | 4.4 | 30.9 | ± | 2.8 | 23.7 | ± | 2.1 | 41.1 | ± | 2.7 |
| Jackknife 1 | 24.2 | ± | 1.5 | 27.4 | ± | 3.5 | 35.2 | ± | 1.5 | 26.8 | ± | 2.3 | 47.6 | ± | 2.7 |
| Jackknife 2 | 29.2 | 30.4 | 36.6 | 27.7 | 47.6 | ||||||||||
| Michaelis–Menten (mean) | 24.2 | 27.6 | 37.0 | 29.1 | 59.0 | ||||||||||
| Epiphytes | |||||||||||||||
| Stands (no.) | 176 | ± | 56 | 253 | ± | 25 | 570 | ± | 339 | 700 | ± | 178 | 604 | ± | 287 |
| Plant dry weight (g) b | 47.7 | ± | 19.1 | 52.0 | ± | 12.6 | 51.4 | ± | 14.6 | 38.3 | ± | 15.6 | 52.1 | ± | 25.3 |
| Biomass (Mg ha−1 slope-corrected) | 0.26 | ± | 0.15 | 0.38 | ± | 0.06 | 0.73 | ± | 0.30 | 0.81 | ± | 0.50 | 0.78 | ± | 0.19 |
| Species density raw | 8.4 | ± | 0.9 | 8.4 | ± | 1.5 | 14.4 | ± | 2.9 | 24.4 | ± | 4.0 | 27.6 | ± | 3.1 |
| Species density rarefied (n = 125) | 8.2 | ± | 0.9 | 7.9 | ± | 1.3 | 11.2 | ± | 1.3 | 15.9 | ± | 1.7 | 19.8 | ± | 2.4 |
| Species richness observed | 12 | 14 | 24 | 45 | 50 | ||||||||||
| Species richness estimated | |||||||||||||||
| Chao 1 | 12.0 | ± | 0.2 | 17.0 | ± | 4.2 | 25.5 | ± | 2.6 | 45.8 | ± | 1.3 | 59.3 | ± | 8.9 |
| Chao 2 | 12.3 | ± | 0.8 | 26.0 | ± | 11.0 | 24.9 | ± | 1.3 | 48.1 | ± | 2.8 | 53.8 | ± | 3.2 |
| Jackknife 1 | 13.6 | ± | 1.0 | 18.8 | ± | 1.5 | 28.0 | ± | 1.3 | 53.8 | ± | 3.4 | 59.6 | ± | 2.4 |
| Jackknife 2 | 13.9 | 22.4 | 27.4 | 54.6 | 61.0 | ||||||||||
| Michaelis–Menten (mean) | 13.3 | 15.8 | 28.6 | 57.0 | 62.0 | ||||||||||
Disclaimer/Publisher’s Note: The statements, opinions and data contained in all publications are solely those of the individual author(s) and contributor(s) and not of MDPI and/or the editor(s). MDPI and/or the editor(s) disclaim responsibility for any injury to people or property resulting from any ideas, methods, instructions or products referred to in the content. |
© 2024 by the authors. Licensee MDPI, Basel, Switzerland. This article is an open access article distributed under the terms and conditions of the Creative Commons Attribution (CC BY) license (https://creativecommons.org/licenses/by/4.0/).
Share and Cite
Werner, F.A.; Homeier, J. Diverging Elevational Patterns of Tree vs. Epiphyte Species Density, Beta Diversity, and Biomass in a Tropical Dry Forest. Plants 2024, 13, 2555. https://doi.org/10.3390/plants13182555
Werner FA, Homeier J. Diverging Elevational Patterns of Tree vs. Epiphyte Species Density, Beta Diversity, and Biomass in a Tropical Dry Forest. Plants. 2024; 13(18):2555. https://doi.org/10.3390/plants13182555
Chicago/Turabian StyleWerner, Florian A., and Jürgen Homeier. 2024. "Diverging Elevational Patterns of Tree vs. Epiphyte Species Density, Beta Diversity, and Biomass in a Tropical Dry Forest" Plants 13, no. 18: 2555. https://doi.org/10.3390/plants13182555