
RNA-Seq Analysis and Candidate Gene Mining of Gossypium hirsutum Stressed by Verticillium dahliae Cultured at Different Temperatures

 ,
, 
Abstract
:1. Introduction
2. Results
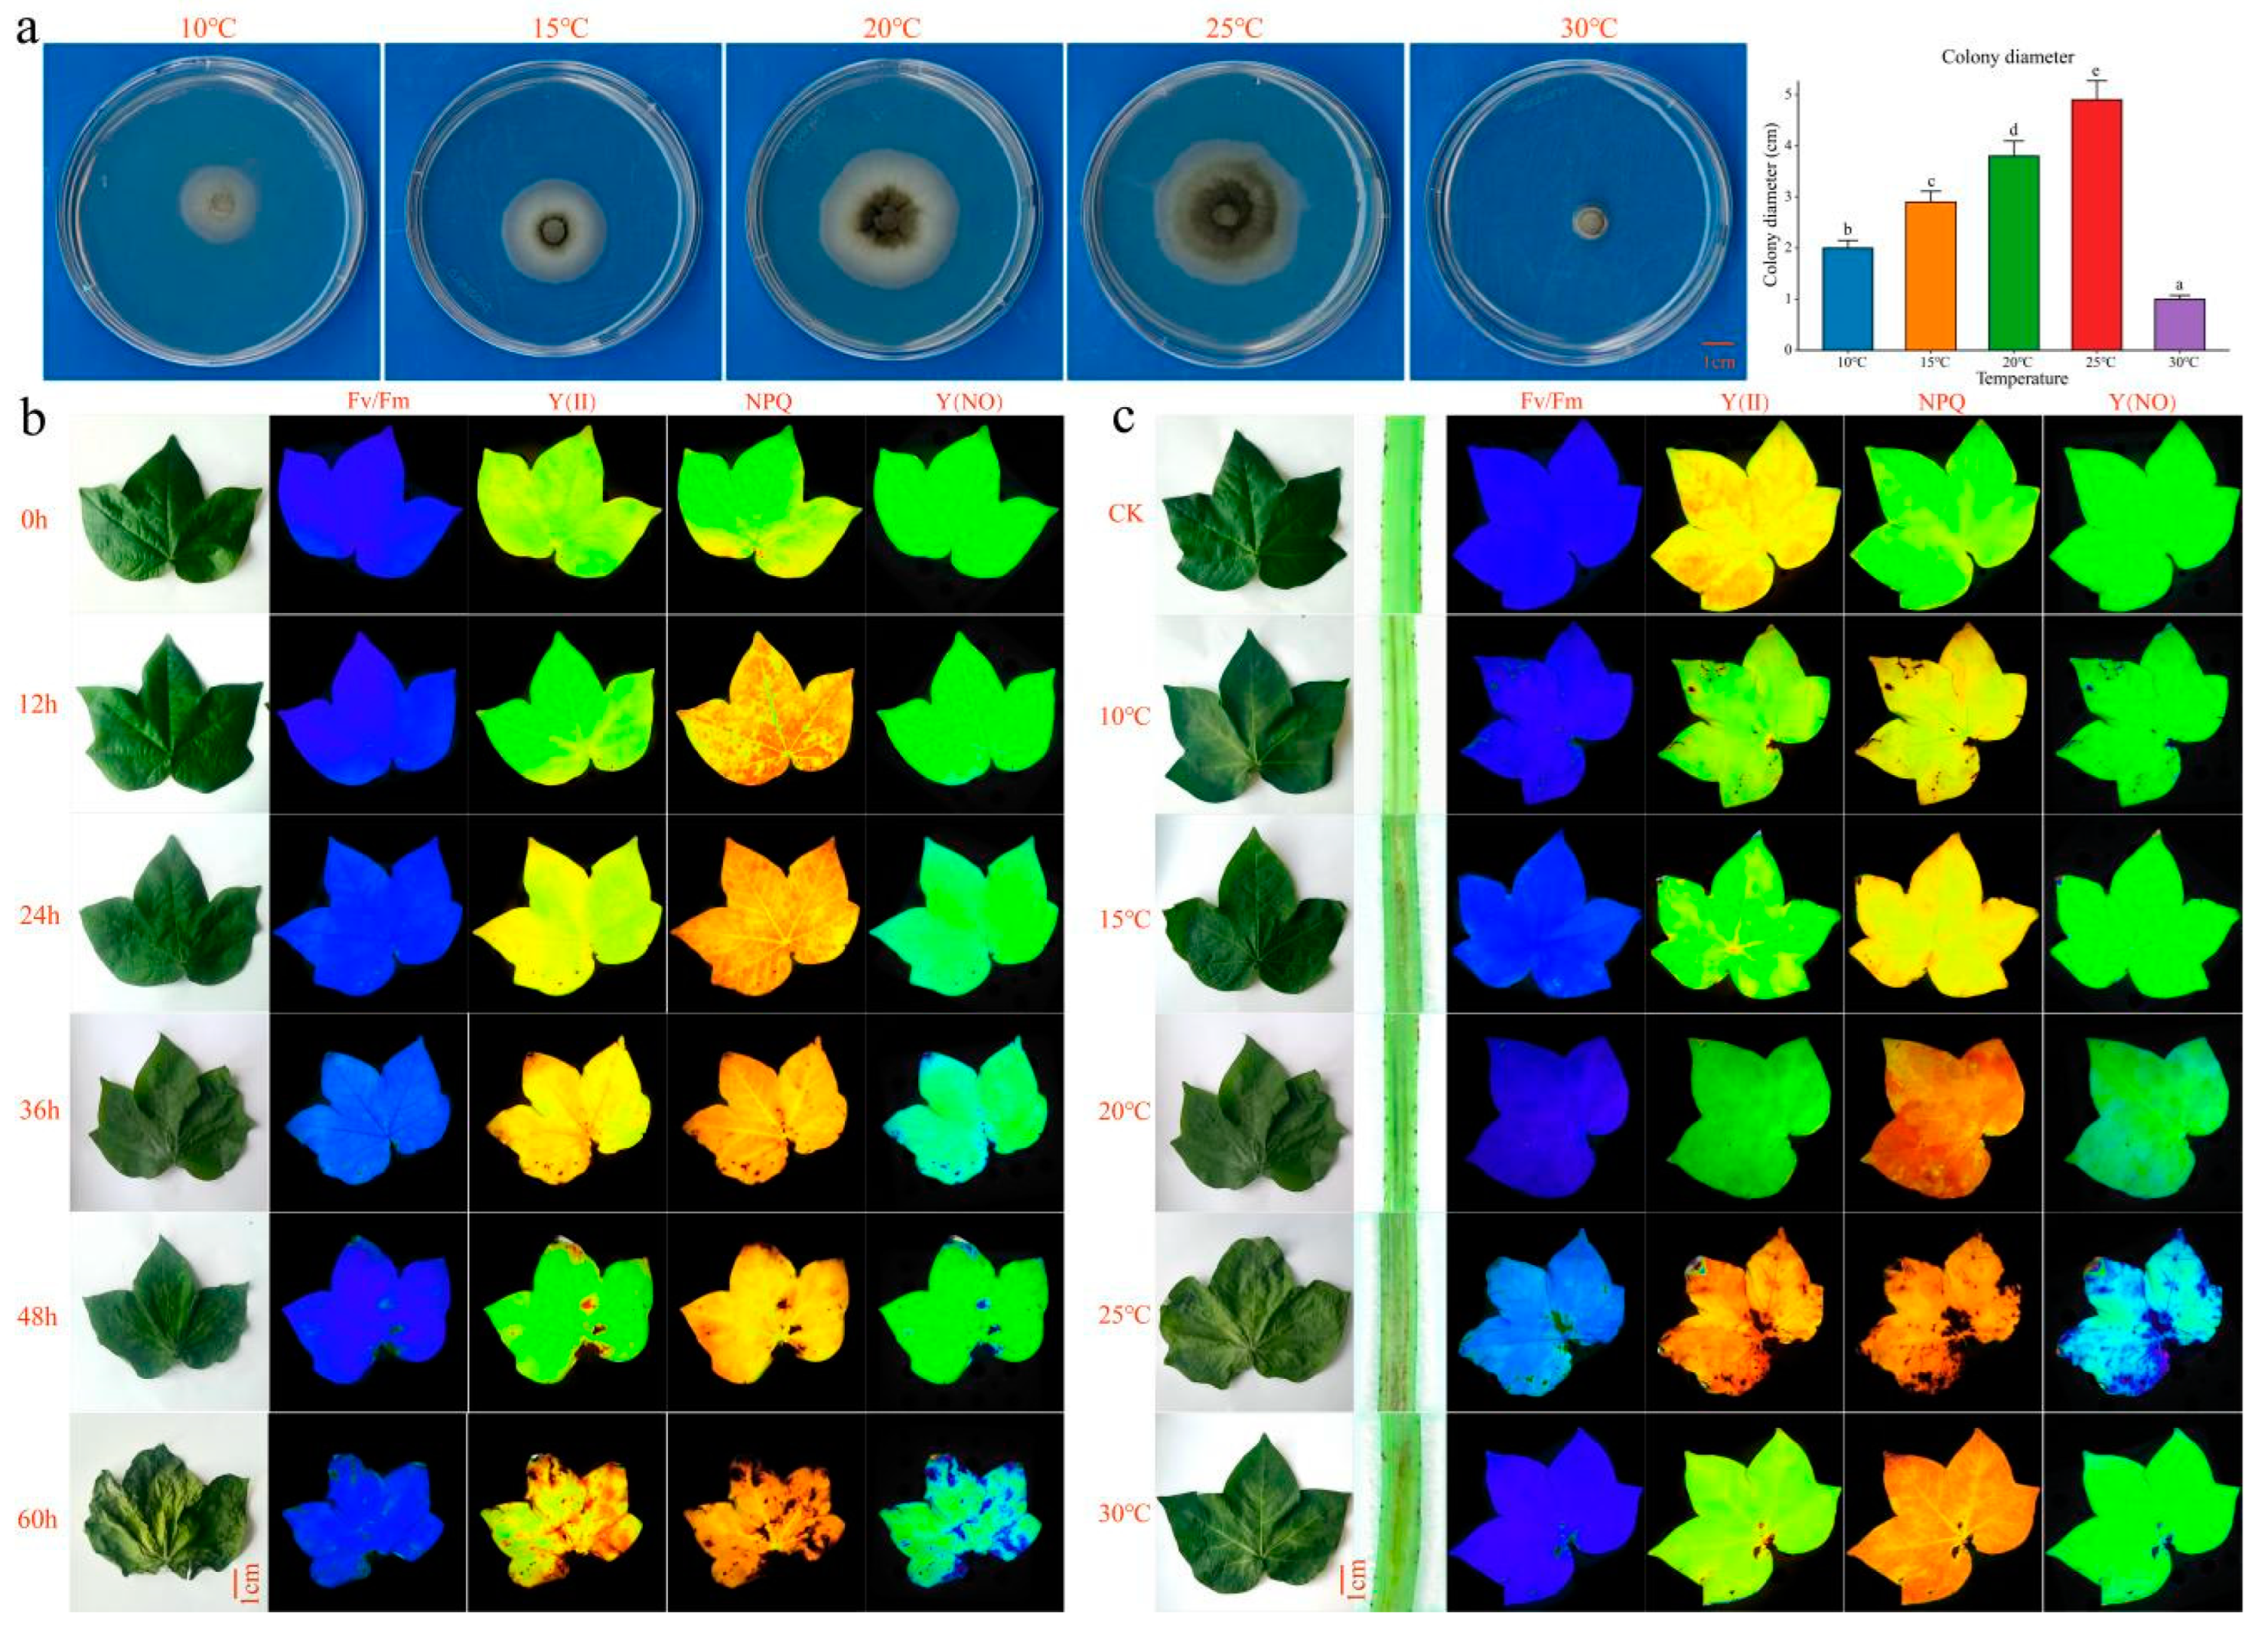
2.1. Phenotypes of Vd-3 Inoculated at Different Times and Temperatures
2.2. RNA-Seq Data Analysis
2.3. Differential Expression Analysis
2.4. Analysis of Patterns of Gene Expression in the JA, SA, and ET Pathways
2.5. WGCNA
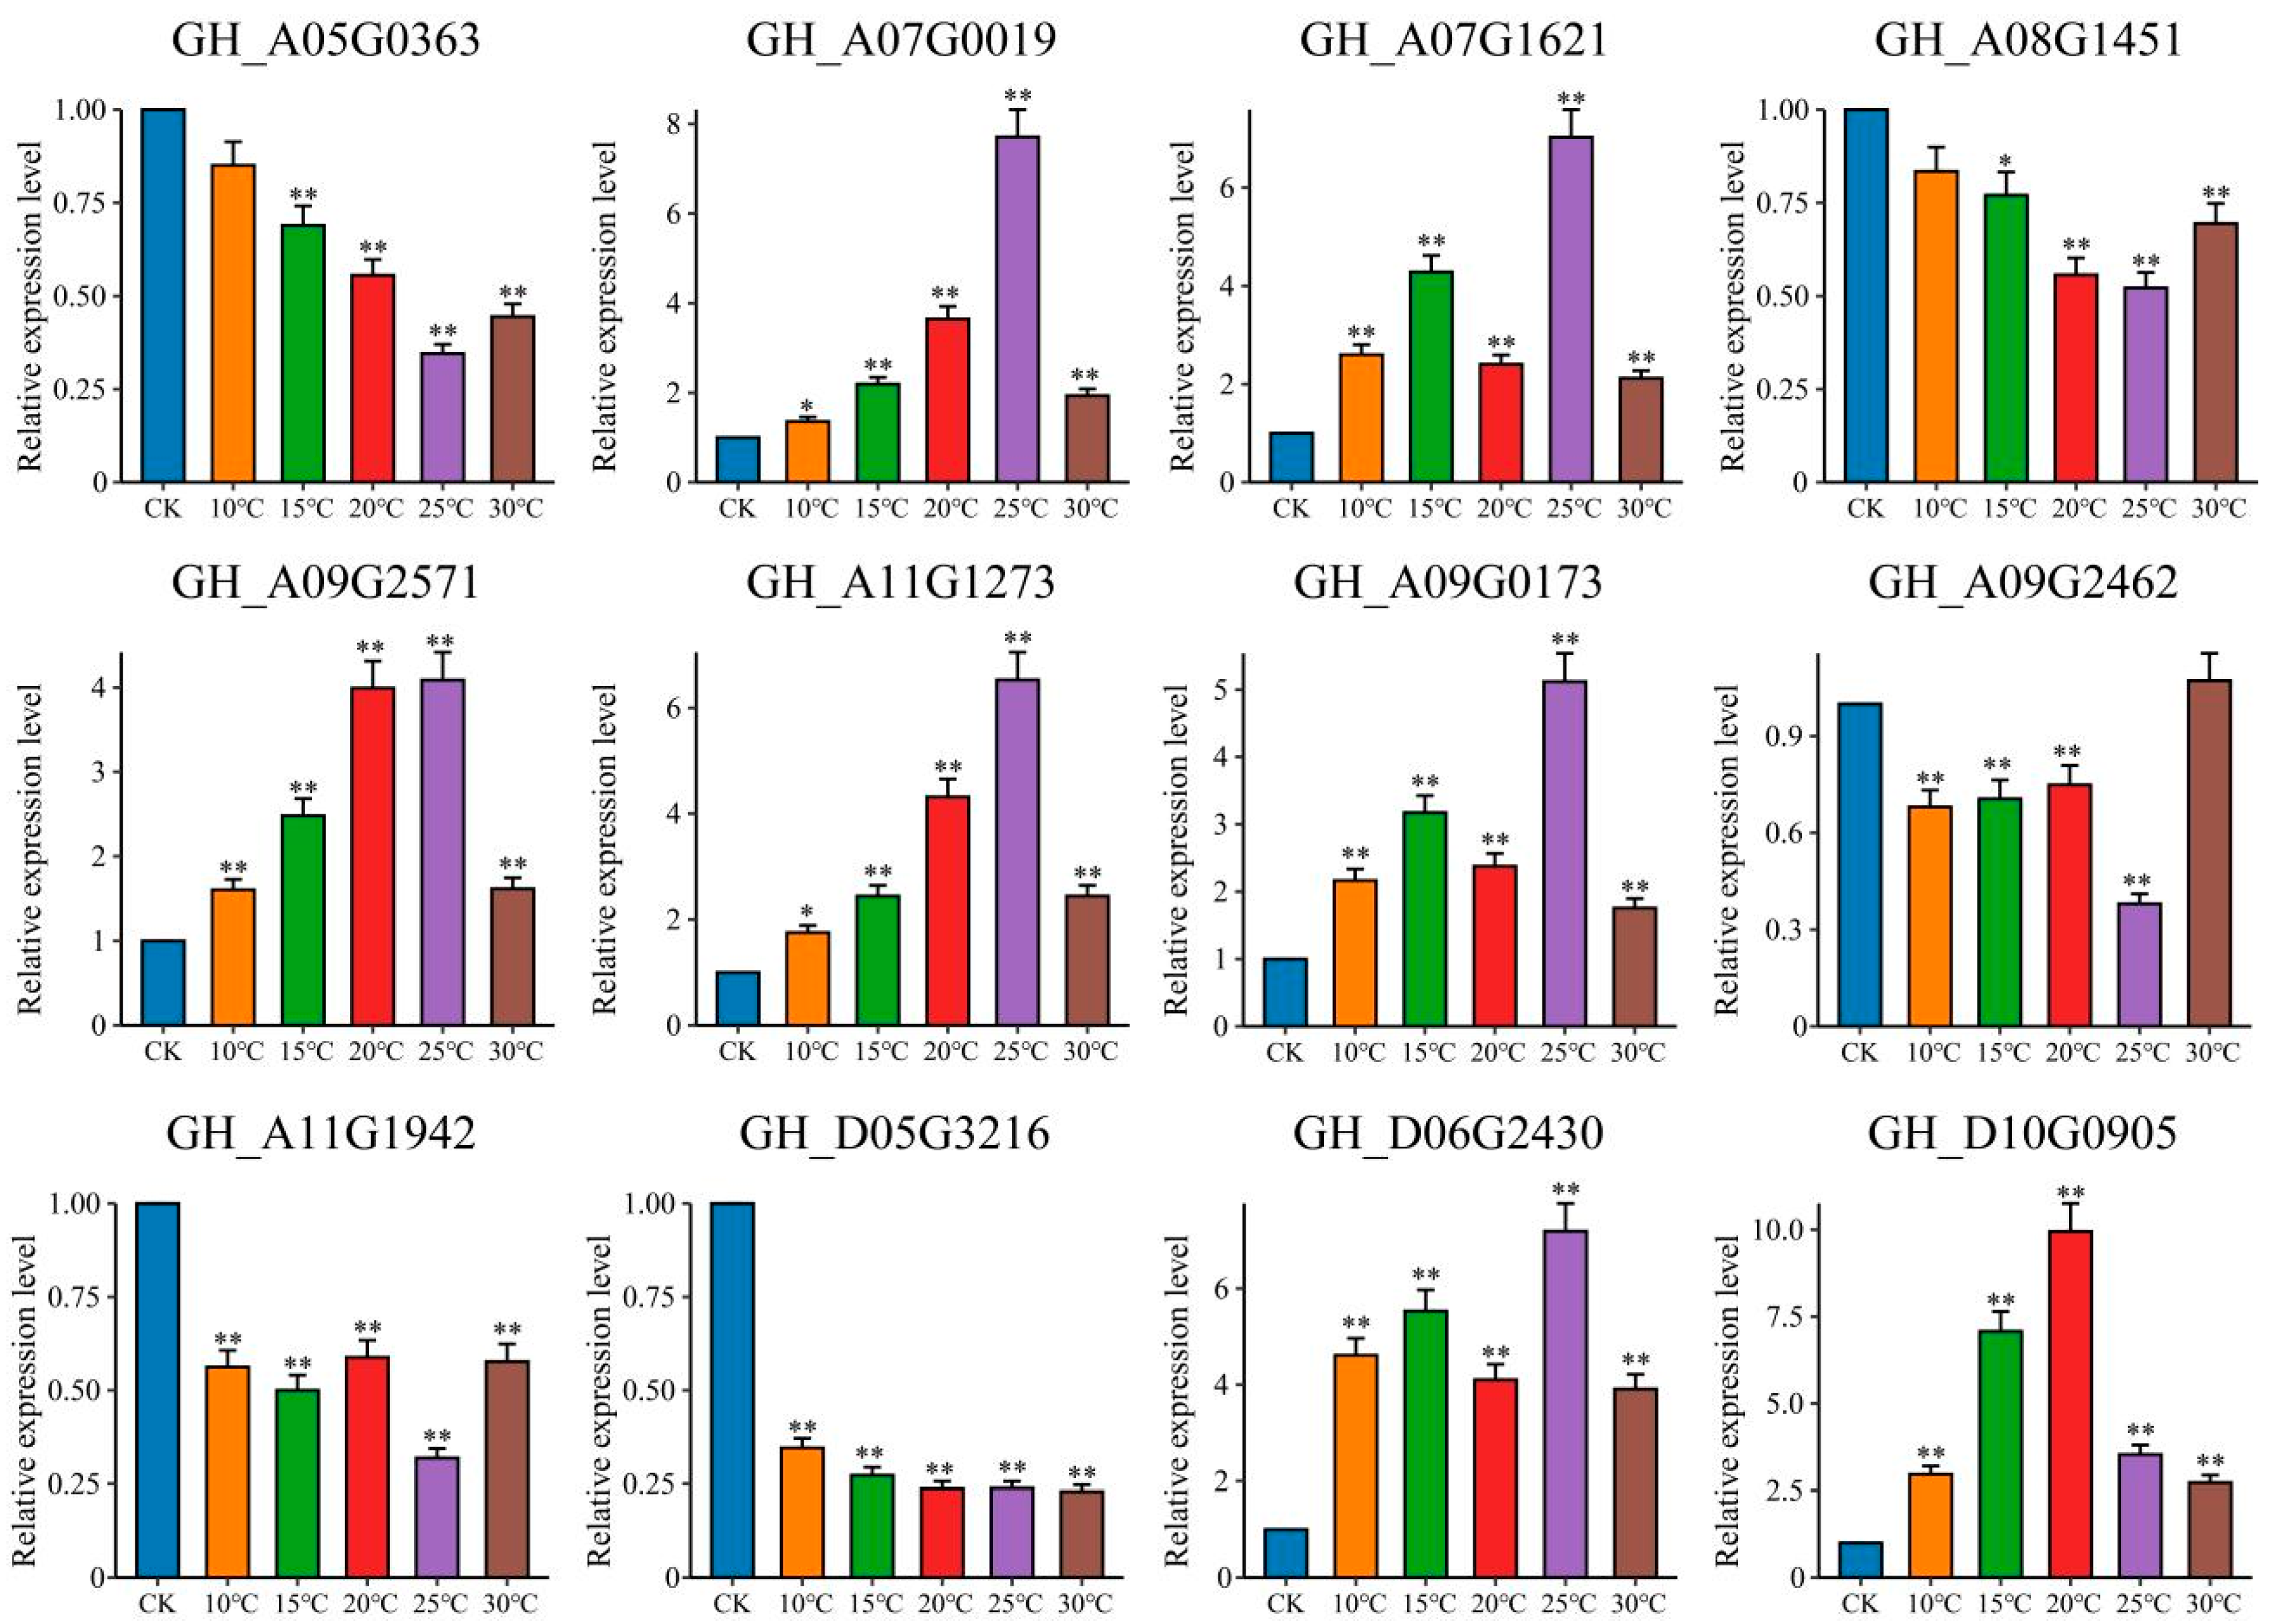
2.6. qRT-PCR
3. Discussion
4. Materials and Methods
4.1. Plant Materials
4.2. Exploration of the Physiological Changes in Cotton Resistance to Vd-3 Virus-Produced Toxins
4.3. RNA-Seq Library Construction and Sequencing
4.4. RNA-Seq Analysis
4.5. WGCNA
4.6. qRT-PCR
5. Conclusions
Supplementary Materials
Author Contributions
Funding
Data Availability Statement
Conflicts of Interest
References
- Skelsey, P.; Kessel, G.J.; Rossing, W.A.; van der Werf, W. Parameterization and evaluation of a spatiotemporal model of the potato late blight pathosystem. Phytopathology 2009, 99, 290–300. [Google Scholar] [CrossRef] [PubMed]
- Cheng, C.; Gao, X.; Feng, B.; Sheen, J.; Shan, L.; He, P. Plant immune response to pathogens differs with changing temperatures. Nat. Commun. 2013, 4, 2530. [Google Scholar] [CrossRef]
- Calderón, R.; Lucena, C.; Trapero-Casas, J.L.; Zarco-Tejada, P.J.; Navas-Cortés, J.A. Soil temperature determines the reaction of olive cultivars to Verticillium dahliae pathotypes. PLoS ONE 2014, 9, e110664. [Google Scholar] [CrossRef] [PubMed]
- Zhang, G.; Meng, Z.; Ge, H.; Yuan, J.; Qiang, S.; Jiang, P.; Ma, D. Investigating Verticillium wilt occurrence in cotton and its risk management by the direct return of cotton plants infected with Verticillium dahliae to the field. Front. Plant Sci. 2023, 14, 1220921. [Google Scholar] [CrossRef]
- Requena-Mullor, J.M.; García-Garrido, J.M.; García, P.A.; Rodríguez, E. Climatic drivers of Verticillium dahliae occurrence in Mediterranean olive-growing areas of southern Spain. PLoS ONE 2020, 15, e0232648. [Google Scholar] [CrossRef]
- Wu, J.; Zhang, F.; Liu, G.; Abudureheman, R.; Bai, S.; Wu, X.; Zhang, C.; Ma, Y.; Wang, X.; Zha, Q.; et al. Transcriptome and coexpression network analysis reveals properties and candidate genes associated with grape (Vitis vinifera L.) heat tolerance. Front. Plant Sci. 2023, 14, 1270933. [Google Scholar] [CrossRef]
- Zhang, T.; Xie, Z.; Zhou, J.; Feng, H.; Zhang, T. Temperature impacts on cotton yield superposed by effects on plant growth and verticillium wilt infection in China. Int. J. Biometeorol. 2024, 68, 199–209. [Google Scholar] [CrossRef] [PubMed]
- Zhang, J.; Jiamahate, A.; Feng, H.; Bozorov, T.A.; Zhang, D.; Guo, J.; Yang, H.; Zhang, D. Distribution and Pathogenicity Differentiation of Physiological Races of Verticillium dahliae from Cotton Stems in Western China. Pathogens 2024, 13, 525. [Google Scholar] [CrossRef]
- Meng, F.; Zhao, Q.; Zhao, X.; Yang, C.; Liu, R.; Pang, J.; Zhao, W.; Wang, Q.; Liu, M.; Zhang, Z.; et al. A rice protein modulates endoplasmic reticulum homeostasis and coordinates with a transcription factor to initiate blast disease resistance. Cell Rep. 2022, 39, 110941. [Google Scholar] [CrossRef]
- Jia, M.; Ni, Y.; Zhao, H.; Liu, X.; Yan, W.; Zhao, X.; Wang, J.; He, B.; Liu, H. Full-length transcriptome and RNA-Seq analyses reveal the resistance mechanism of sesame in response to Corynespora cassiicola. BMC Plant Biol. 2024, 24, 64. [Google Scholar] [CrossRef]
- Li, G.; Mo, Y.; Lv, J.; Han, S.; Fan, W.; Zhou, Y.; Yang, Z.; Deng, M.; Xu, B.; Wang, Y.; et al. Unraveling verticillium wilt resistance: Insight from the integration of transcriptome and metabolome in wild eggplant. Front. Plant Sci. 2024, 15, 1378748. [Google Scholar] [CrossRef]
- Zhu, H.; Song, J.; Dhar, N.; Shan, Y.; Ma, X.Y.; Wang, X.L.; Chen, J.Y.; Dai, X.F.; Li, R.; Wang, Z.S. Transcriptome Analysis of a Cotton Cultivar Provides Insights into the Differentially Expressed Genes Underlying Heightened Resistance to the Devastating Verticillium Wilt. Cells 2021, 10, 2961. [Google Scholar] [CrossRef]
- Mei, J.; Wu, Y.; Niu, Q.; Miao, M.; Zhang, D.; Zhao, Y.; Cai, F.; Yu, D.; Ke, L.; Feng, H.; et al. Integrative Analysis of Expression Profiles of mRNA and MicroRNA Provides Insights of Cotton Response to Verticillium dahliae. Int. J. Mol. Sci. 2022, 23, 4702. [Google Scholar] [CrossRef] [PubMed]
- Cavicchioli, R.; Ripple, W.J.; Timmis, K.N.; Azam, F.; Bakken, L.R.; Baylis, M.; Behrenfeld, M.J.; Boetius, A.; Boyd, P.W.; Classen, A.T.; et al. Scientists’ warning to humanity: Microorganisms and climate change. Nat. Rev. Microbiol. 2019, 17, 569–586. [Google Scholar] [CrossRef] [PubMed]
- Fan, L.L.; Yong, M.L.; Li, D.Y.; Liu, Y.J.; Lai, C.H.; Chen, H.M.; Cheng, F.M.; Hu, D.W. Effect of temperature on the development of sclerotia in Villosiclava virens. J. Integr. Agric. 2016, 15, 2550–2555. [Google Scholar] [CrossRef]
- Lu, Y.; Yao, J. Chloroplasts at the Crossroad of Photosynthesis, Pathogen Infection and Plant Defense. Int. J. Mol. Sci. 2018, 19, 3900. [Google Scholar] [CrossRef] [PubMed]
- Bhattacharyya, D.; Gnanasekaran, P.; Kumar, R.K.; Kushwaha, N.K.; Sharma, V.K.; Yusuf, M.A.; Chakraborty, S. A geminivirus betasatellite damages the structural and functional integrity of chloroplasts leading to symptom formation and inhibition of photosynthesis. J. Exp. Bot. 2015, 66, 5881–5895. [Google Scholar] [CrossRef]
- Caplan, J.L.; Mamillapalli, P.; Burch-Smith, T.M.; Czymmek, K.; Dinesh-Kumar, S.P. Chloroplastic protein NRIP1 mediates innate immune receptor recognition of a viral effector. Cell 2008, 132, 449–462. [Google Scholar] [CrossRef]
- Zhao, J.; Liu, Q.; Zhang, H.; Jia, Q.; Hong, Y.; Liu, Y. The rubisco small subunit is involved in tobamovirus movement and Tm-2²-mediated extreme resistance. Plant Physiol. 2013, 161, 374–383. [Google Scholar] [CrossRef]
- Tu, J.C.; Ford, R.E.; Krass, C.J. Comparison of chloroplasts in maize dwarf mosaic virus-infected and healthy corn, sorghum and Johnson grass. Phytopathology 1967, 57, 834. [Google Scholar]
- Li, C.; Wang, K.; Xu, F.; Lei, C.; Jiang, Y.; Zheng, Y. Sucrose metabolism and sensory evaluation in peach as influenced by β-aminobutyric acid (BABA)-induced disease resistance and the transcriptional mechanism involved. Postharvest Biol. Technol. 2021, 174, 111465. [Google Scholar] [CrossRef]
- Winter, H.; Huber, S.C. Regulation of sucrose metabolism in higher plants: Localization and regulation of activity of key enzymes. Crit. Rev. Biochem. Mol. Biol. 2000, 35, 253–289. [Google Scholar] [CrossRef] [PubMed]
- Sood, M.; Kapoor, D.; Kumar, V.; Kalia, N.; Bhardwaj, R.; Sidhu, G.P.S.; Sharma, A. Mechanisms of Plant Defense Under Pathogen Stress: A Review. Curr. Protein Pept. Sci. 2021, 22, 376–395. [Google Scholar] [CrossRef]
- Yao, T.; Gai, X.T.; Pu, Z.J.; Gao, Y.; Xuan, Y.H. From Functional Characterization to the Application of SWEET Sugar Transporters in Plant Resistance Breeding. J. Agric. Food Chem. 2022, 70, 5273–5283. [Google Scholar] [CrossRef]
- Levy, Y.; Tal, K. The effect of water deficiency in corn plants on the development of three corn diseases. Phytoparasitica 1985, 13, 141–144. [Google Scholar] [CrossRef]
- Liu, Y.H.; Song, Y.H.; Ruan, Y.L. Sugar conundrum in plant-pathogen interactions: Roles of invertase and sugar transporters depend on pathosystems. J. Exp. Bot. 2022, 73, 1910–1925. [Google Scholar] [CrossRef]
- Qi, G.; Chen, J.; Chang, M.; Chen, H.; Hall, K.; Korin, J.; Liu, F.; Wang, D.; Fu, Z.Q. Pandemonium Breaks Out: Disruption of Salicylic Acid-Mediated Defense by Plant Pathogens. Mol. Plant. 2018, 11, 1427–1439. [Google Scholar] [CrossRef]
- Monte, I. Jasmonates and salicylic acid: Evolution of defense hormones in land plants. Curr. Opin. Plant Biol. 2023, 76, 102470. [Google Scholar] [CrossRef]
- Kakar, K.U.; Nawaz, Z.; Cui, Z.; Ahemd, N.; Ren, X. Molecular breeding approaches for production of disease-resilient commercially important tobacco. Brief. Funct. Genomics. 2020, 19, 10–25. [Google Scholar] [CrossRef] [PubMed]
- Viswanath, K.K.; Kuo, S.Y.; Tu, C.W.; Hsu, Y.H.; Huang, Y.W.; Hu, C.C. The Role of Plant Transcription Factors in the Fight against Plant Viruses. Int. J. Mol. Sci. 2023, 24, 8433. [Google Scholar] [CrossRef] [PubMed]
- Saha, B.; Nayak, J.; Srivastava, R.; Samal, S.; Kumar, D.; Chanwala, J.; Dey, N.; Giri, M.K. Unraveling the involvement of WRKY TFs in regulating plant disease defense signaling. Planta 2023, 259, 7. [Google Scholar] [CrossRef] [PubMed]
- Guo, W.; Jin, L.; Miao, Y.; He, X.; Hu, Q.; Guo, K.; Zhu, L.; Zhang, X. An ethylene response-related factor, GbERF1-like, from Gossypium barbadense improves resistance to Verticillium dahliae via activating lignin synthesis. Plant Mol. Biol. 2016, 91, 305–318. [Google Scholar] [CrossRef] [PubMed]
- Xiao, S.; Hu, Q.; Shen, J.; Liu, S.; Yang, Z.; Chen, K.; Klosterman, S.J.; Javornik, B.; Zhang, X.; Zhu, L. GhMYB4 downregulates lignin biosynthesis and enhances cotton resistance to Verticillium dahliae. Plant Cell Rep. 2021, 40, 735–751. [Google Scholar] [CrossRef] [PubMed]
- Xiong, X.; Sun, S.; Li, Y.; Zhang, X.; Sun, J.; Xue, F. The cotton WRKY transcription factor GhWRKY70 negatively regulates the defense response against Verticillium dahliae. Crop J. 2019, 7, 393–402. [Google Scholar] [CrossRef]
- Xiong, X.P.; Sun, S.C.; Zhang, X.Y.; Li, Y.J.; Liu, F.; Zhu, Q.H.; Xue, F.; Sun, J. GhWRKY70D13 Regulates Resistance to Verticillium dahliae in Cotton Through the Ethylene and Jasmonic Acid Signaling Pathways. Front. Plant Sci. 2020, 25, 69. [Google Scholar] [CrossRef]
- He, X.; Zhu, L.; Wassan, G.M.; Wang, Y.; Miao, Y.; Shaban, M.; Hu, H.; Sun, H.; Zhang, X. GhJAZ2 attenuates cotton resistance to biotic stresses via the inhibition of the transcriptional activity of GhbHLH171. Mol. Plant Pathol. 2018, 19, 896–908. [Google Scholar] [CrossRef]
- Chen, S.; Zhou, Y.; Chen, Y.; Gu, J. fastp: An ultra-fast all-in-one FASTQ preprocessor. Bioinformatics 2018, 34, i884–i890. [Google Scholar] [CrossRef]
- Kim, D.; Paggi, J.M.; Park, C.; Bennett, C.; Salzberg, S.L. Graph-based genome alignment and genotyping with HISAT2 and HISAT-genotype. Nat. Biotechnol. 2019, 37, 907–915. [Google Scholar] [CrossRef]
- Hu, Y.; Chen, J.; Fang, L.; Zhang, Z.; Ma, W.; Niu, Y.; Ju, L.; Deng, J.; Zhao, T.; Lian, J.; et al. Gossypium barbadense and Gossypium hirsutum genomes provide insights into the origin and evolution of allotetraploid cotton. Nat. Genet. 2019, 51, 739–748. [Google Scholar] [CrossRef]
- Liao, Y.; Smyth, G.K.; Shi, W. featureCounts: An efficient general purpose program for assigning sequence reads to genomic features. Bioinformatics 2014, 30, 923–930. [Google Scholar] [CrossRef]
- Love, M.I.; Huber, W.; Anders, S. Moderated estimation of fold change and dispersion for RNA-seq data with DESeq2. Genome Biol. 2014, 15, 550. [Google Scholar] [CrossRef] [PubMed]
- Yu, G.; Wang, L.G.; Han, Y.; He, Q.Y. clusterProfiler: An R package for comparing biological themes among gene clusters. Omics 2012, 16, 284–287. [Google Scholar] [CrossRef] [PubMed]
- Langfelder, P.; Horvath, S. WGCNA: An R package for weighted correlation network analysis. BMC Bioinform. 2008, 9, 559. [Google Scholar] [CrossRef] [PubMed]
- Shannon, P.; Markiel, A.; Ozier, O.; Baliga, N.S.; Wang, J.T.; Ramage, D.; Amin, N.; Schwikowski, B.; Ideker, T. Cytoscape: A software environment for integrated models of biomolecular interaction networks. Genome Res. 2003, 13, 2498–2504. [Google Scholar] [CrossRef]
- Livak, K.J.; Schmittgen, T.D. Analysis of relative gene expression data using real-time quantitative PCR and the 2(-Delta Delta C(T)) Method. Methods 2001, 25, 402–408. [Google Scholar] [CrossRef]


Disclaimer/Publisher’s Note: The statements, opinions and data contained in all publications are solely those of the individual author(s) and contributor(s) and not of MDPI and/or the editor(s). MDPI and/or the editor(s) disclaim responsibility for any injury to people or property resulting from any ideas, methods, instructions or products referred to in the content. |
© 2024 by the authors. Licensee MDPI, Basel, Switzerland. This article is an open access article distributed under the terms and conditions of the Creative Commons Attribution (CC BY) license (https://creativecommons.org/licenses/by/4.0/).
Share and Cite
Yang, N.; Gong, Z.; Liang, Y.; Geng, S.; Sun, F.; Li, X.; Qian, S.; Lai, C.; Yusuyin, M.; Wang, J.; et al. RNA-Seq Analysis and Candidate Gene Mining of Gossypium hirsutum Stressed by Verticillium dahliae Cultured at Different Temperatures. Plants 2024, 13, 2688. https://doi.org/10.3390/plants13192688
Yang N, Gong Z, Liang Y, Geng S, Sun F, Li X, Qian S, Lai C, Yusuyin M, Wang J, et al. RNA-Seq Analysis and Candidate Gene Mining of Gossypium hirsutum Stressed by Verticillium dahliae Cultured at Different Temperatures. Plants. 2024; 13(19):2688. https://doi.org/10.3390/plants13192688
Chicago/Turabian StyleYang, Ni, Zhaolong Gong, Yajun Liang, Shiwei Geng, Fenglei Sun, Xueyuan Li, Shuaishuai Qian, Chengxia Lai, Mayila Yusuyin, Junduo Wang, and et al. 2024. "RNA-Seq Analysis and Candidate Gene Mining of Gossypium hirsutum Stressed by Verticillium dahliae Cultured at Different Temperatures" Plants 13, no. 19: 2688. https://doi.org/10.3390/plants13192688