
A Study of the Diversity Patterns of Desert Vegetation Communities in an Arid Zone of China

 , ,
, ,
Abstract
:1. Introduction
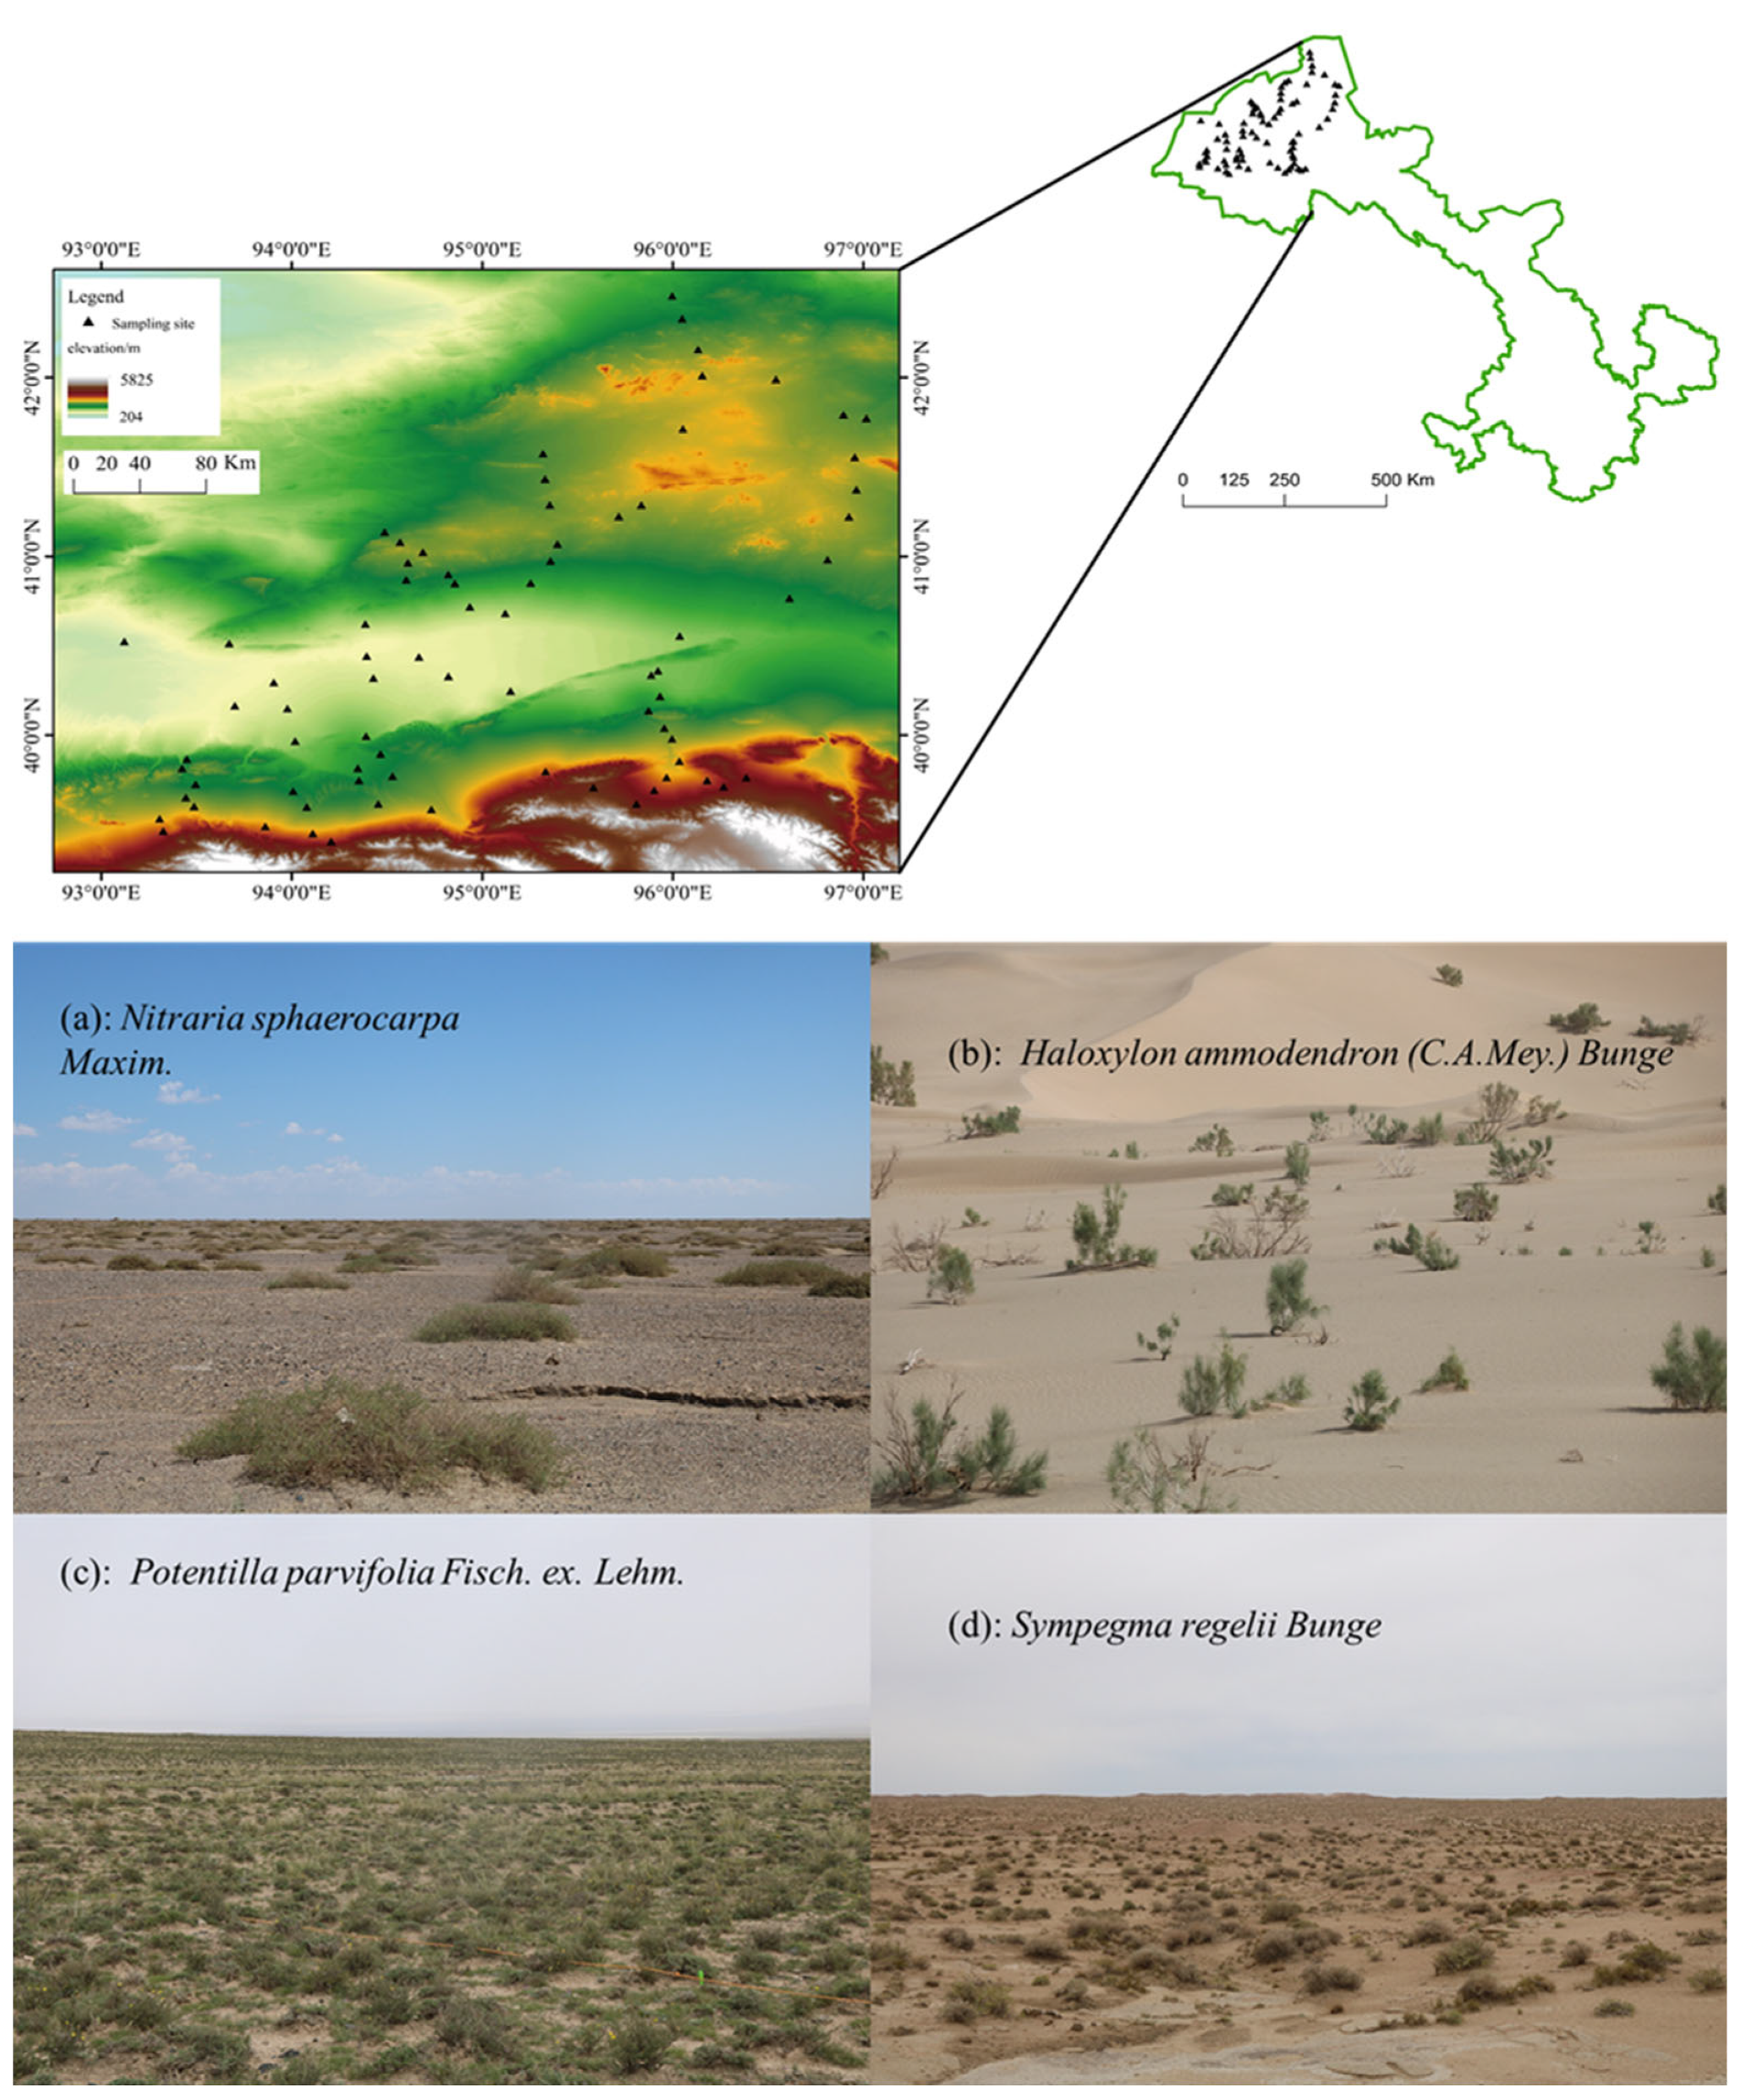
2. Study Area
3. Materials and Methods
3.1. Sample Plot Setting and In-Site Survey
3.2. Soil Survey and Sampling
3.3. Climate Data Acquisition
3.4. Data Analysis
3.4.1. Calculation of Bray–Curtis Dissimilarity Index
3.4.2. Environmental Distance Calculation
3.4.3. Mantel Test
3.4.4. Analysis of Multiple Regressions on Dissimilarity Matrices
4. Results and Analysis
4.1. β-Diversity and Its Components in Plant Communities
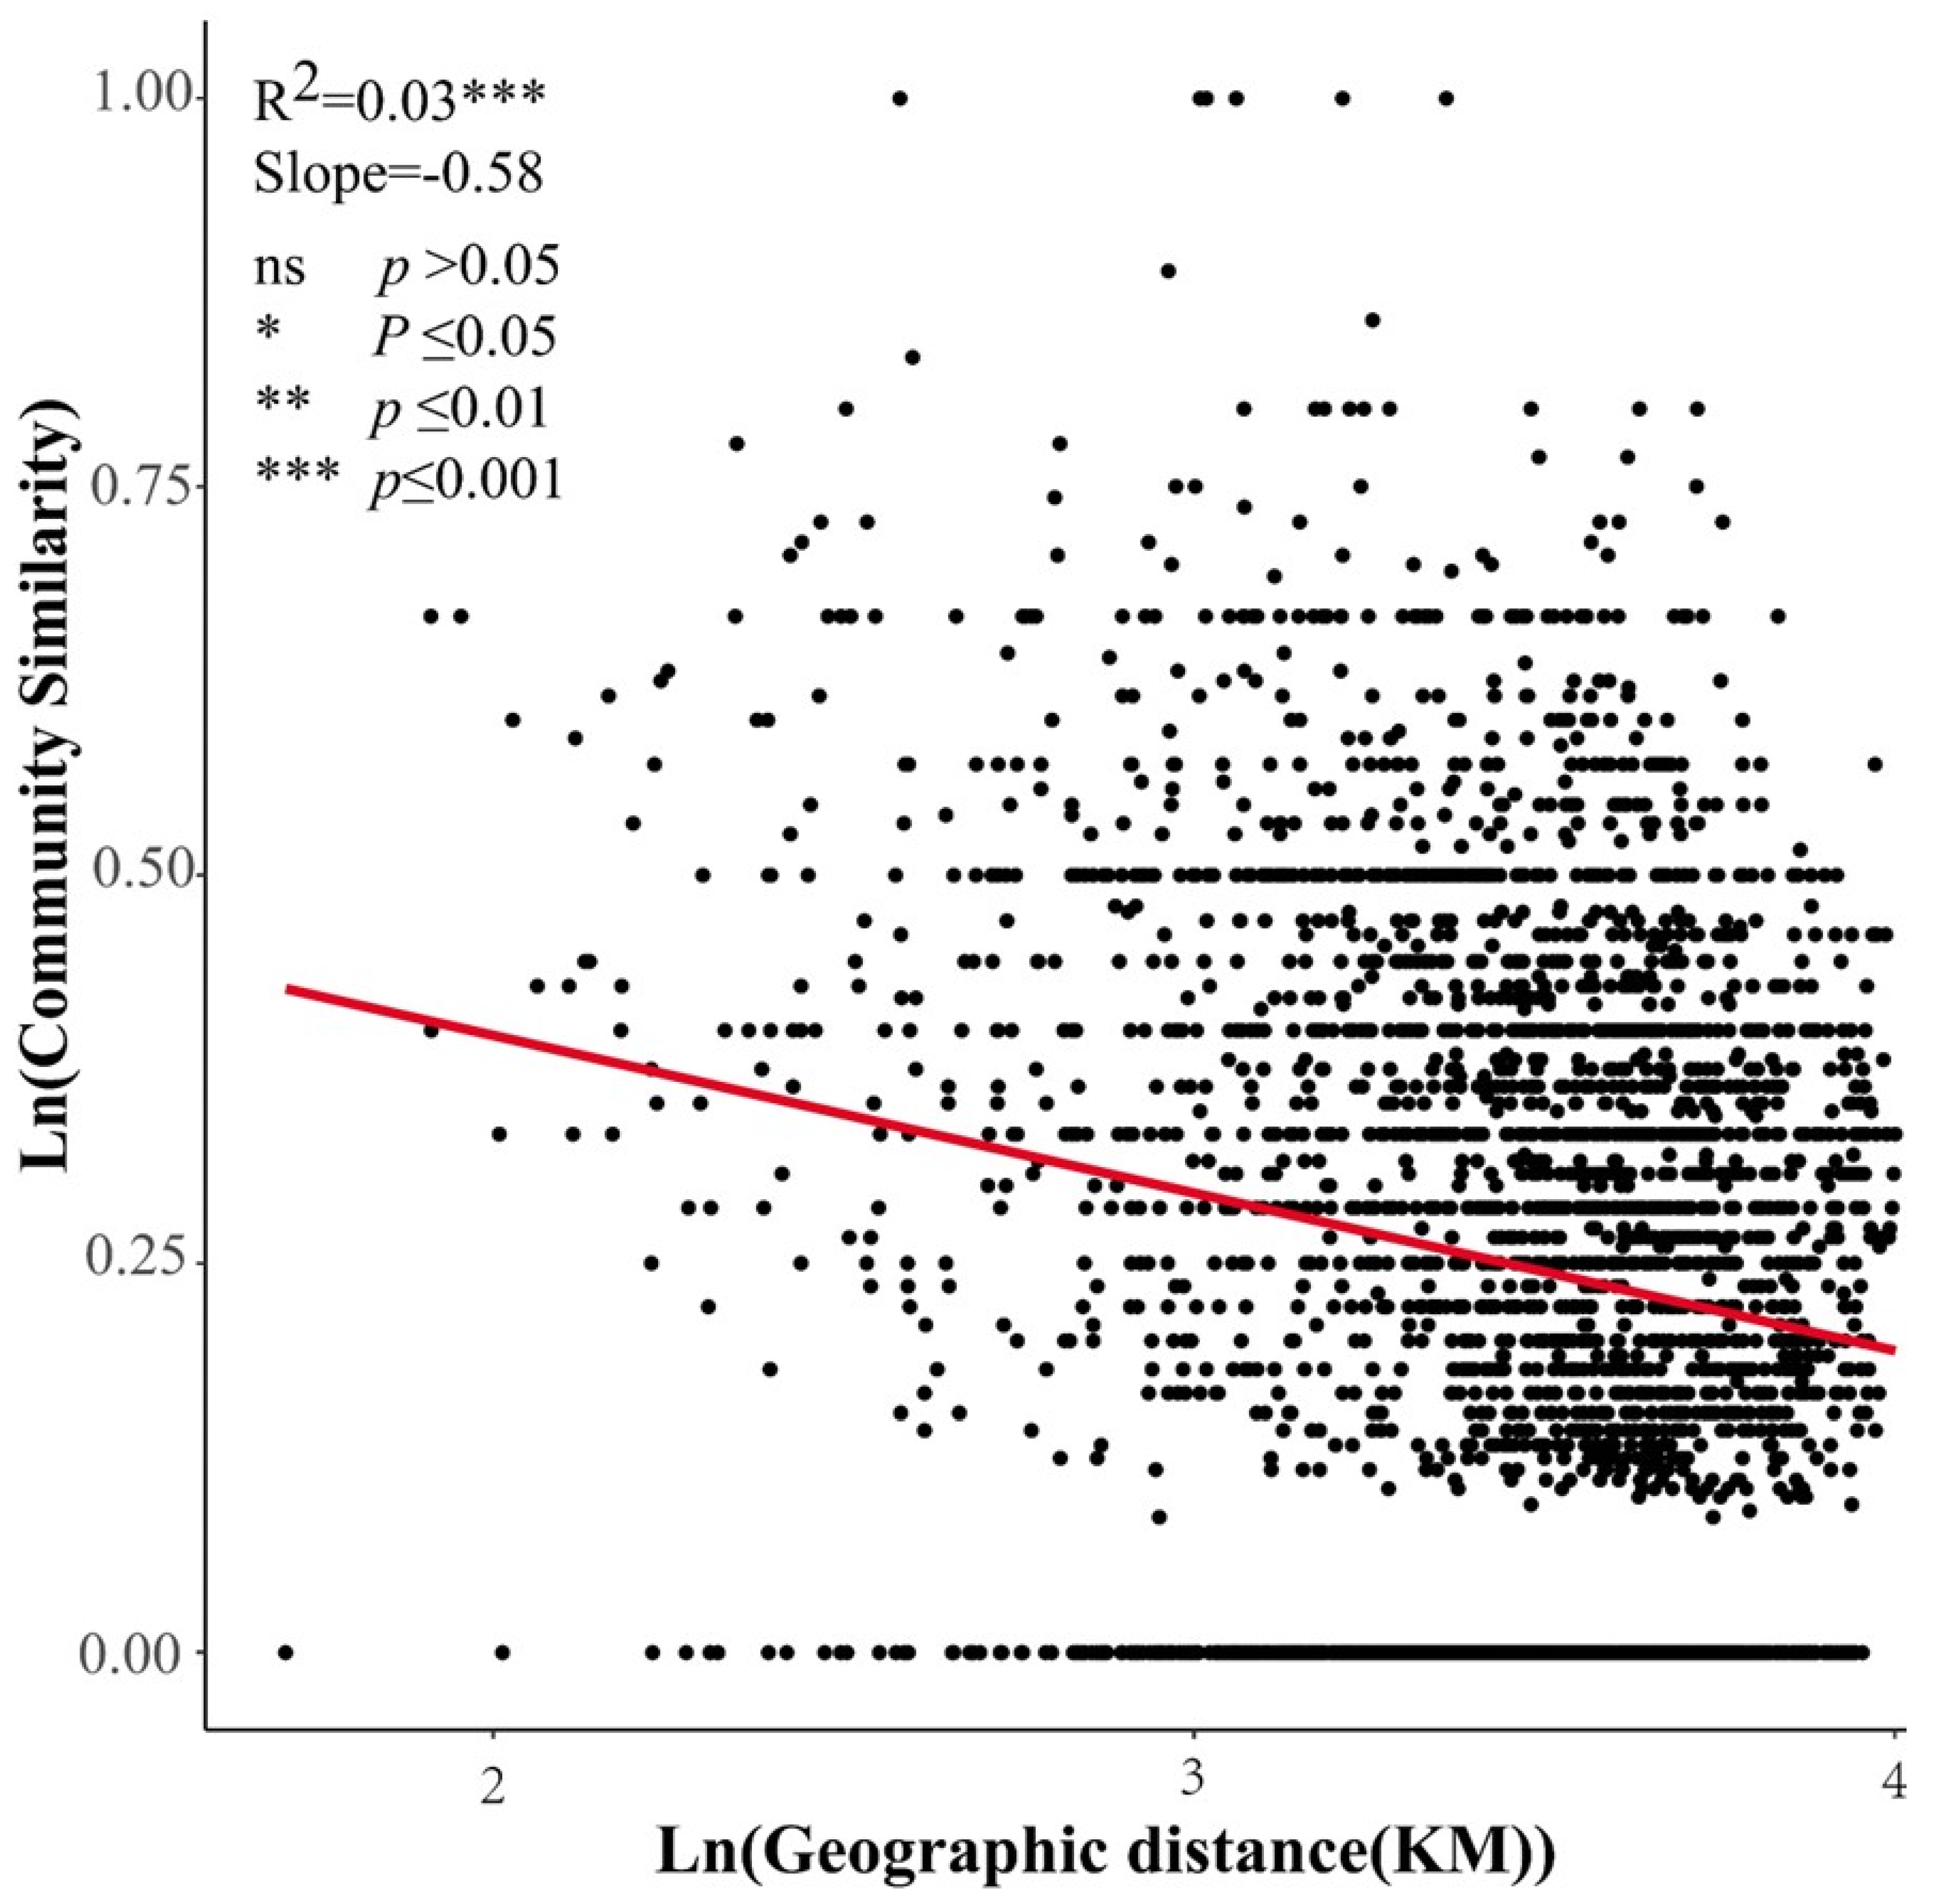
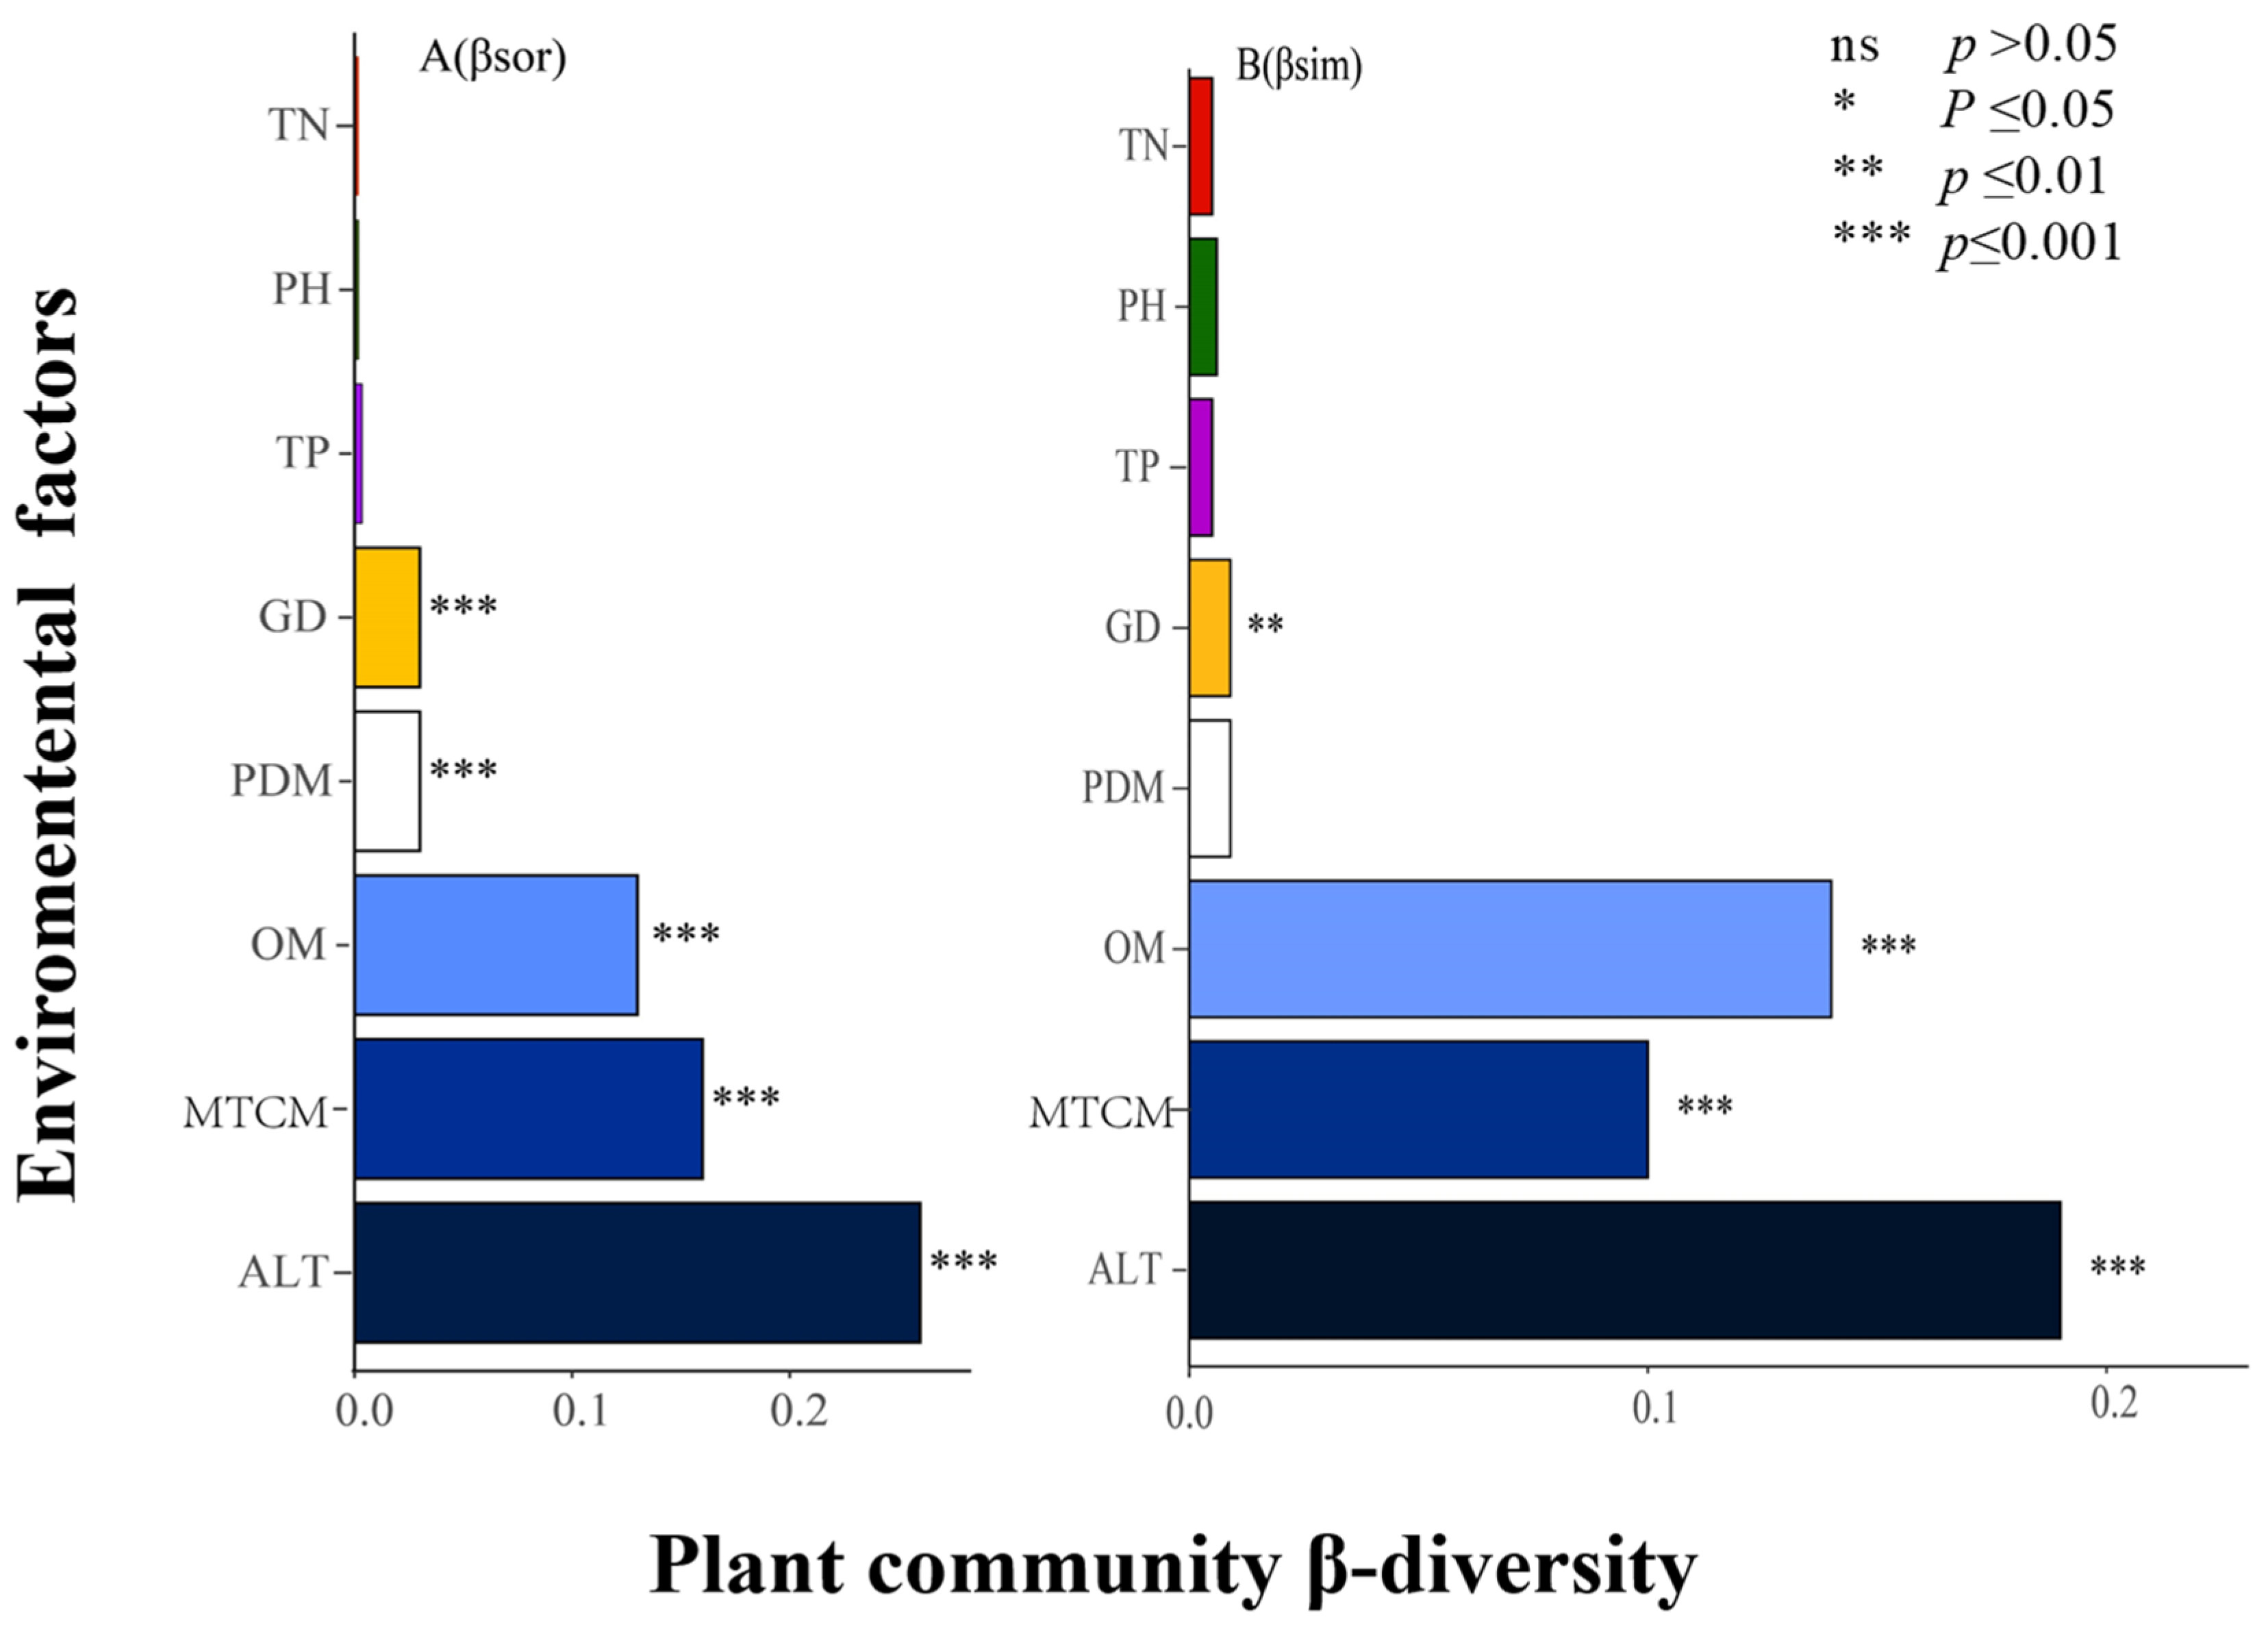
4.2. Effects of Environmental Factors and Geographical Distance on β-Diversity and Its Components
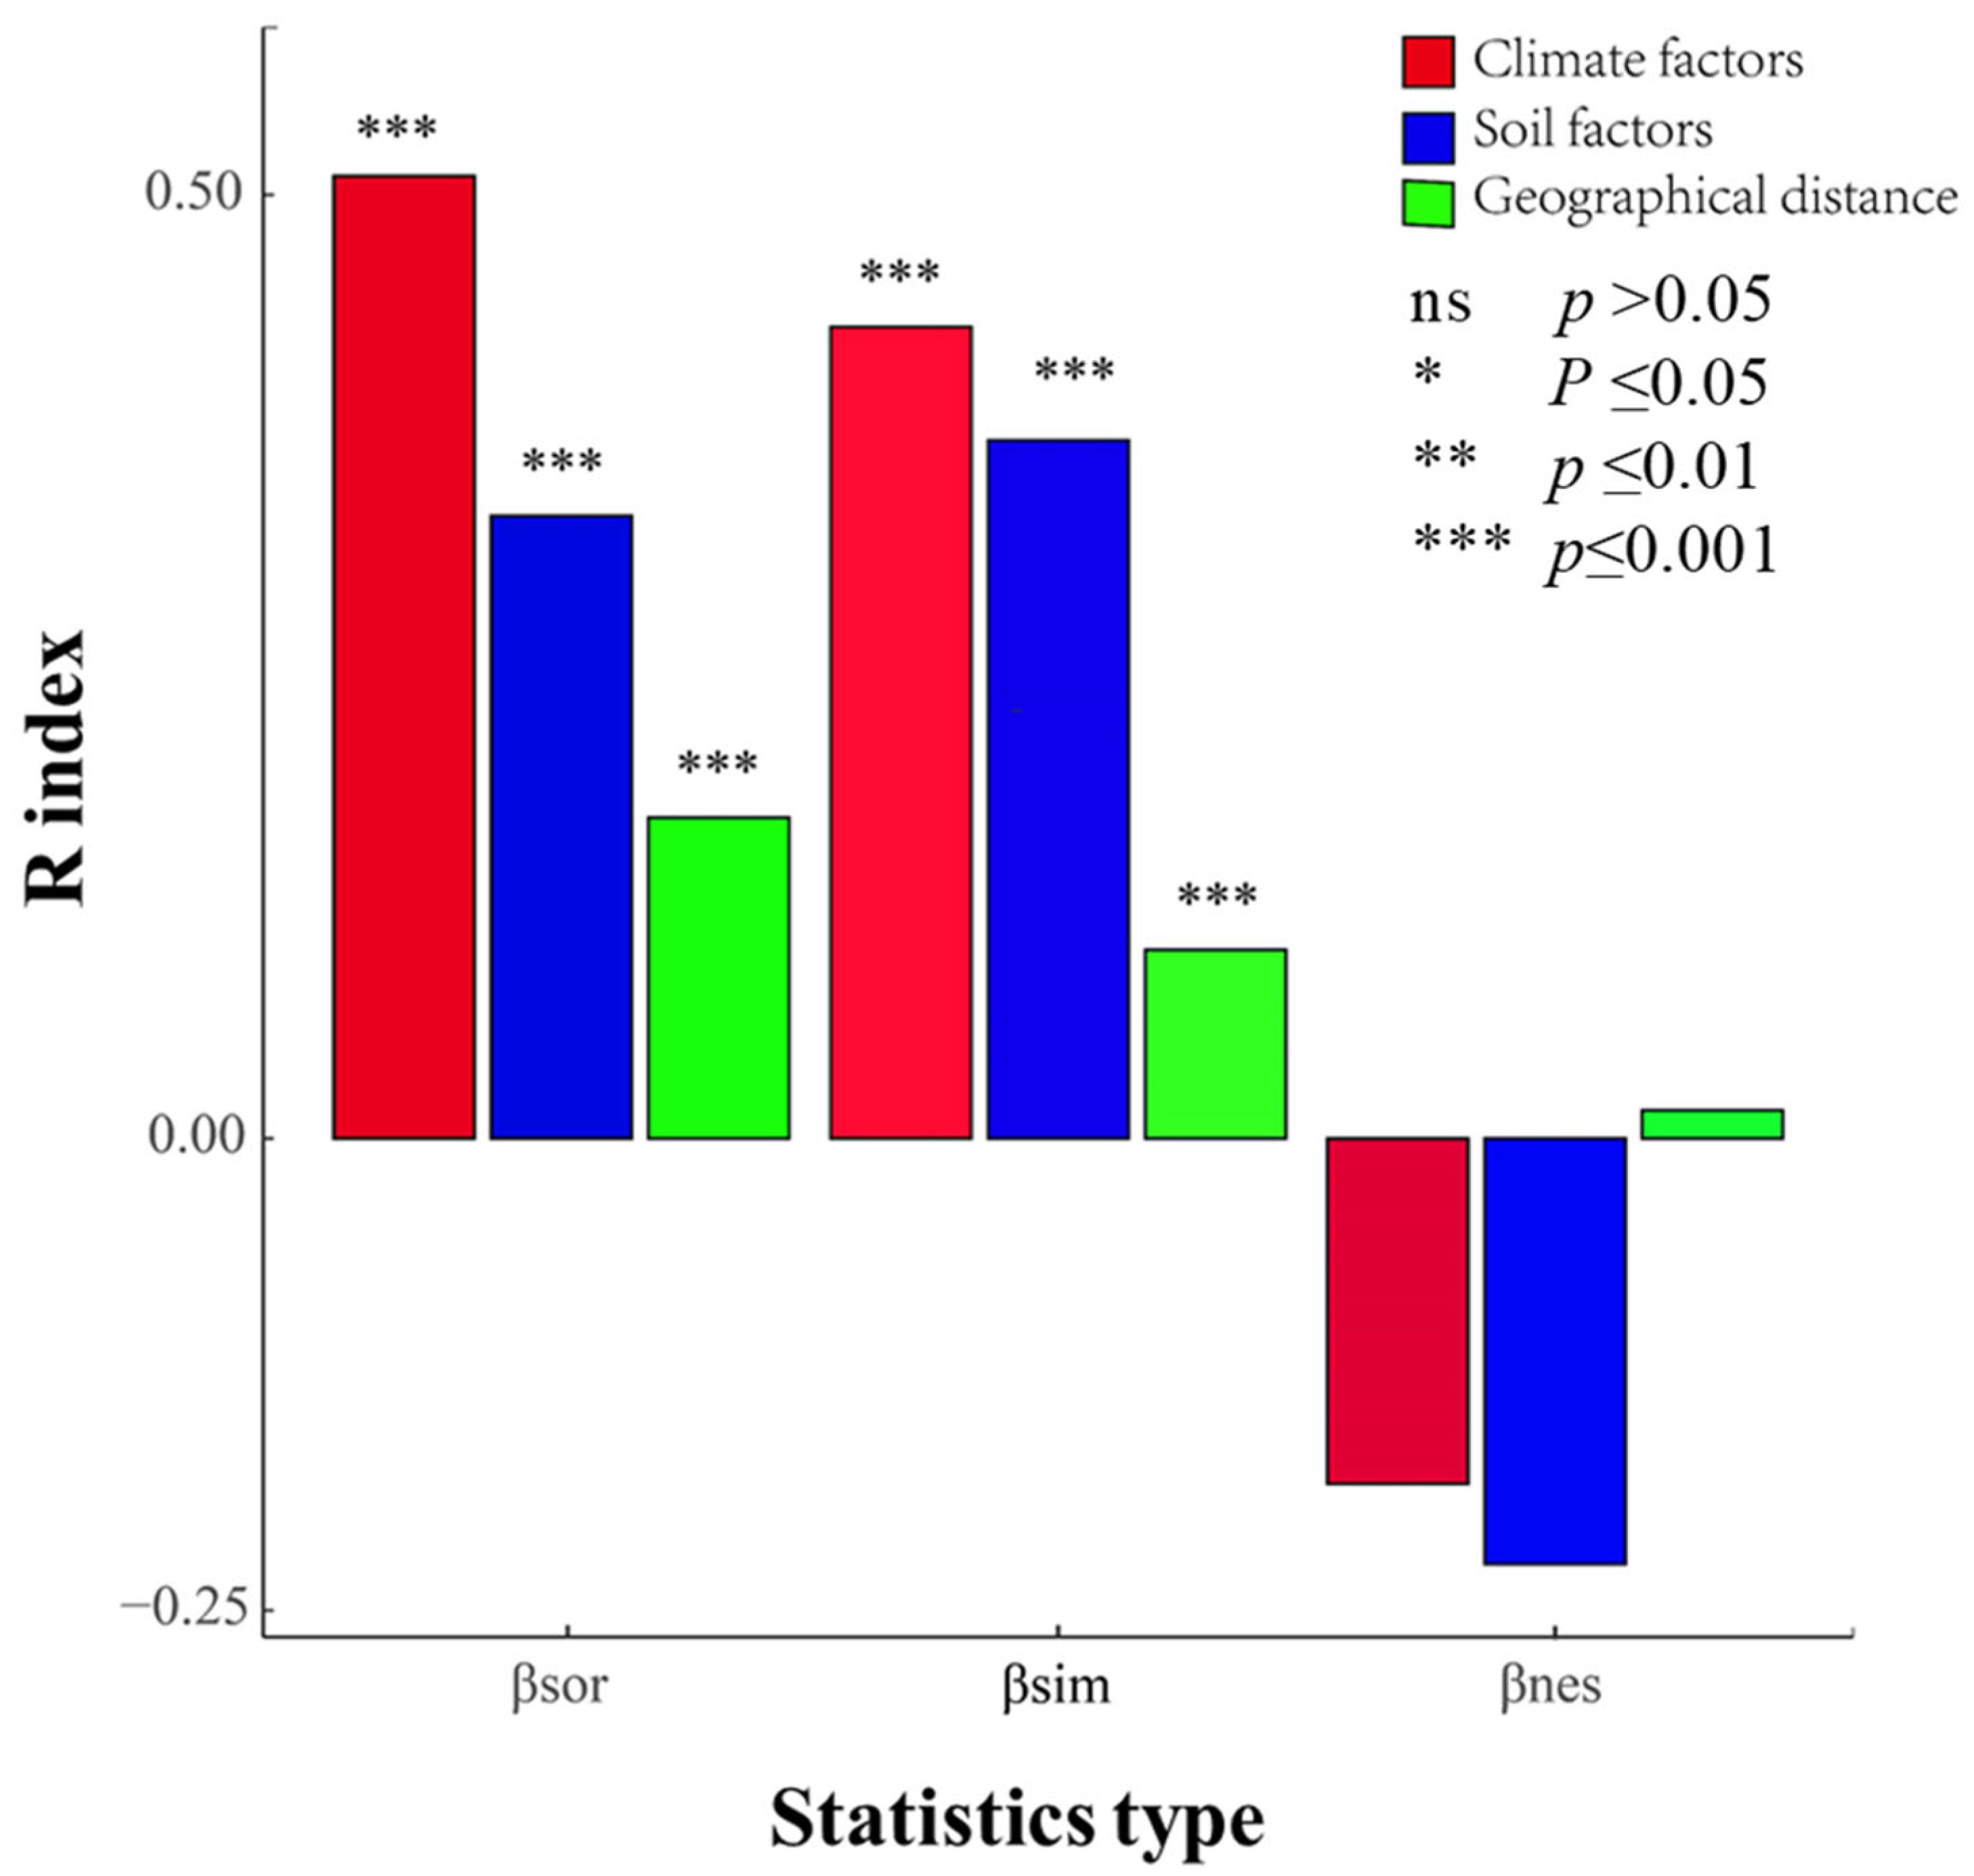
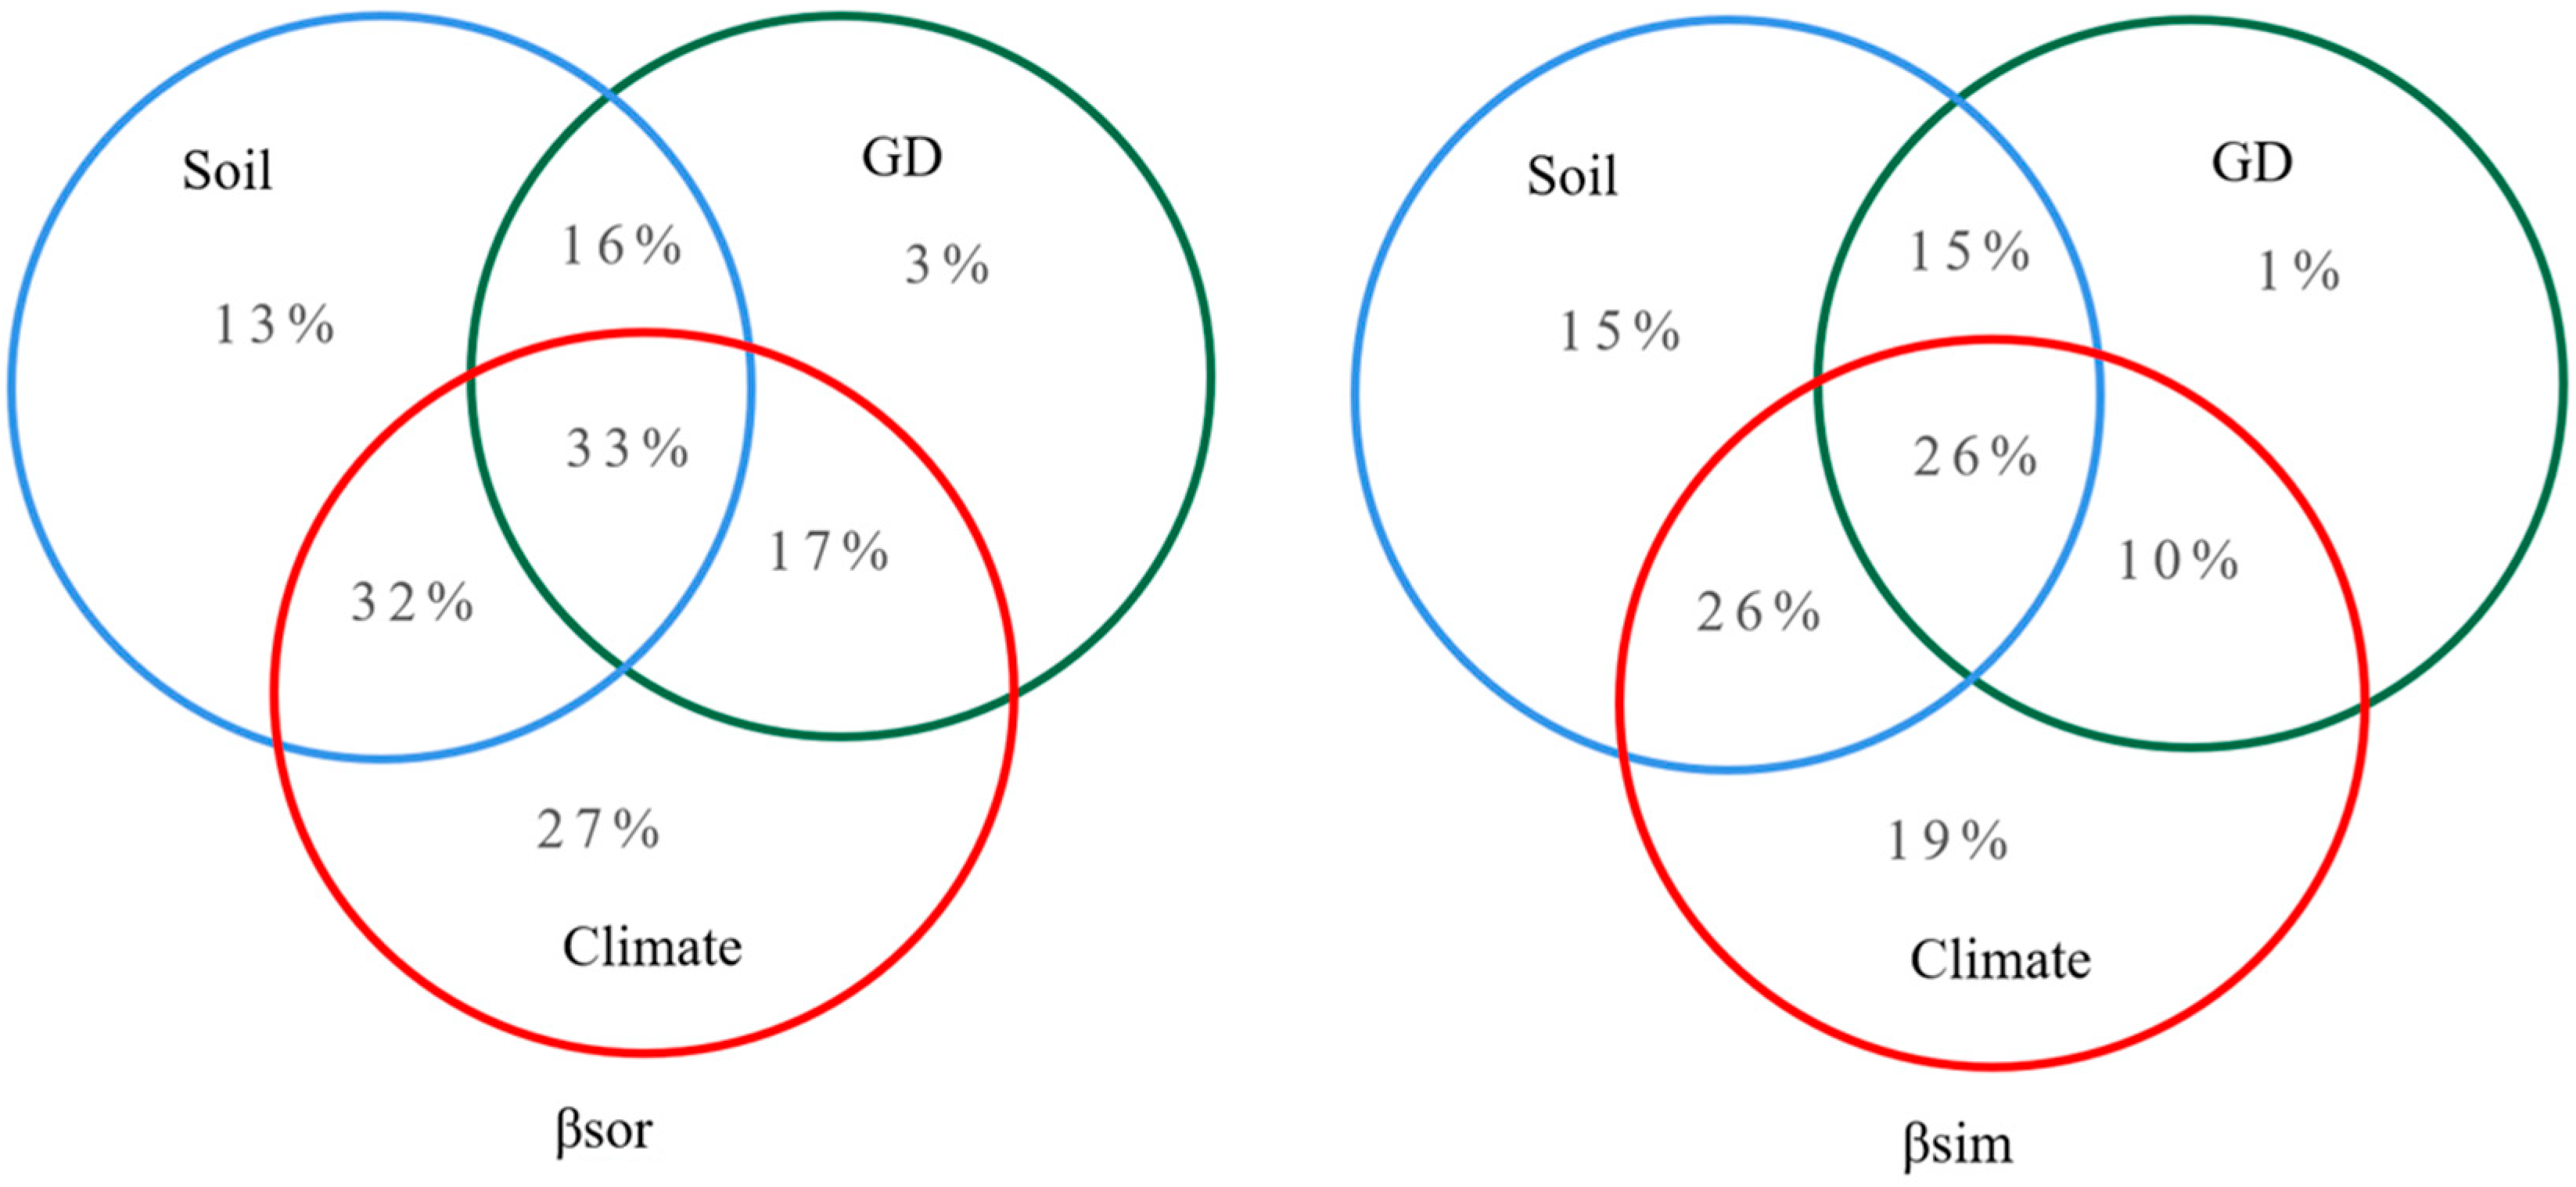
4.3. Roles of Climate, Soil Factors, and Geographical Distance on Community β-Diversity and Species Turnover
5. Discussion
5.1. Community β-Diversity and Its Components in the Arid Zone
5.2. Effects of Climatic Factors, Soil Factors, and Geographical Distance on β-Diversity and Its Components
5.3. Roles of Environmental Filtering and Dispersal Limitation on Plant Community β-Diversity
6. Conclusions
Author Contributions
Funding
Data Availability Statement
Acknowledgments
Conflicts of Interest
References
- Bastin, J.-F.; Berrahmouni, N.; Grainger, A.; Maniatis, D.; Mollicone, D.; Moore, R.; Patriarca, C.; Picard, N.; Sparrow, B.; Abraham, E.M. The extent of forest in dryland biomes. Science 2017, 356, 635–638. [Google Scholar] [CrossRef] [PubMed]
- Hu, H.-W.; Macdonald, C.A.; Trivedi, P.; Anderson, I.C.; Zheng, Y.; Holmes, B.; Bodrossy, L.; Wang, J.-T.; He, J.-Z.; Singh, B.K. Effects of climate warming and elevated CO2 on autotrophic nitrification and nitrifiers in dryland ecosystems. Soil Biol. Biochem. 2016, 92, 1–15. [Google Scholar] [CrossRef]
- Cheng, Y.; Yang, W.; Zhan, H.; Jiang, Q.; Shi, M.; Wang, Y.; Li, X.; Xin, Z. On change of soil moisture distribution with vegetation reconstruction in Mu Us sandy land of China, with newly designed lysimeter. Front. Plant Sci. 2021, 12, 609529. [Google Scholar] [CrossRef] [PubMed]
- Cardoso, P.; Rigal, F.; Carvalho, J.C.; Fortelius, M.; Borges, P.A.; Podani, J.; Schmera, D. Partitioning taxon, phylogenetic and functional beta diversity into replacement and richness difference components. J. Biogeogr. 2014, 41, 749–761. [Google Scholar] [CrossRef]
- Lebrija-Trejos, E.; Pérez-García, E.A.; Meave, J.A.; Bongers, F.; Poorter, L. Functional traits and environmental filtering drive community assembly in a species-rich tropical system. Ecology 2010, 91, 386–398. [Google Scholar] [CrossRef] [PubMed]
- Gralka, M.; Szabo, R.; Stocker, R.; Cordero, O.X. Trophic interactions and the drivers of microbial community assembly. Curr. Biol. 2020, 30, R1176–R1188. [Google Scholar] [CrossRef]
- Gianuca, A.T.; Declerck, S.A.; Lemmens, P.; De Meester, L. Effects of dispersal and environmental heterogeneity on the replacement and nestedness components of β-diversity. Ecology 2017, 98, 525–533. [Google Scholar] [CrossRef]
- Pequeno, P.A.; Franklin, E.; Norton, R.A. Modelling selection, drift, dispersal and their interactions in the community assembly of Amazonian soil mites. Oecologia 2021, 196, 805–814. [Google Scholar] [CrossRef]
- Rominger, A.; Goodman, K.; Lim, J.; Armstrong, E.; Becking, L.; Bennett, G.; Brewer, M.; Cotoras, D.; Ewing, C.; Harte, J. Community assembly on isolated islands: Macroecology meets evolution. Glob. Ecol. Biogeogr. 2016, 25, 769–780. [Google Scholar] [CrossRef]
- Hu, Y.; Zhang, J.; Wang, Y.; Hu, S. Distinct mechanisms shape prokaryotic community assembly across different land-use intensification. Water Res. 2023, 245, 120601. [Google Scholar] [CrossRef]
- Wan, X.; Fang, Y.; Jiang, Y.; Lu, X.; Zhu, L.; Feng, J. Temperature and nutrients alter the relative importance of stochastic and deterministic processes in the coastal macroinvertebrates biodiversity assembly on long-time scales. Ecol. Evol. 2024, 14, e11062. [Google Scholar] [CrossRef] [PubMed]
- Niu, X.; Ren, W.; Xu, C.; Wang, R.; Zhang, J.; Wang, H. Taxonomic and functional β-diversity patterns reveal stochastic assembly rules in microbial communities of seagrass beds. Front. Plant Sci. 2024, 15, 1367773. [Google Scholar]
- Fu, H.; Zhou, Y.; Yuan, G.; Peng, H.; Wu, A.; Li, W.; Jeppesen, E. Environmental and spatial drivers for wetland plant communities in a freshwater lake: Reduced coupling of species and functional turnover. Ecol. Eng. 2021, 159, 106092. [Google Scholar] [CrossRef]
- Wang, X.; Zhong, M.; Yang, S.; Jiang, J.; Hu, J. Multiple β-diversity patterns and the underlying mechanisms across amphibian communities along a subtropical elevational gradient. Divers. Distrib. 2022, 28, 2489–2502. [Google Scholar] [CrossRef]
- McNew, S.M.; Barrow, L.N.; Williamson, J.L.; Galen, S.C.; Skeen, H.R.; DuBay, S.G.; Gaffney, A.M.; Johnson, A.B.; Bautista, E.; Ordoñez, P. Contrasting drivers of diversity in hosts and parasites across the tropical Andes. Proc. Natl. Acad. Sci. USA 2021, 118, e2010714118. [Google Scholar] [CrossRef]
- Wu, N.; Zhou, S.; Zhang, M.; Peng, W.; Guo, K.; Qu, X.; He, F. Spatial and local environmental factors outweigh geo-climatic gradients in structuring taxonomically and trait-based β-diversity of benthic algae. J. Biogeogr. 2021, 48, 1842–1857. [Google Scholar] [CrossRef]
- Yu, C.; Fan, C.; Zhang, C.; Zhao, X.; Gadow, K.v. Decomposing Spatial β-Diversity in the temperate forests of Northeastern China. Ecol. Evol. 2021, 11, 11362–11372. [Google Scholar] [CrossRef]
- Wang, J.; Qu, M.; Wang, Y.; Feng, Y.; Wu, B.; Lu, Q.; He, N.; Li, J. The drivers of plant taxonomic, functional, and phylogenetic β-diversity in the gobi desert of northern Qinghai-Tibet Plateau. Biodivers. Sci. 2022, 30, 21503. [Google Scholar] [CrossRef]
- Omidipour, R.; Tahmasebi, P.; Faizabadi, M.F.; Faramarzi, M.; Ebrahimi, A. Does β diversity predict ecosystem productivity better than species diversity? Ecol. Indic. 2021, 122, 107212. [Google Scholar] [CrossRef]
- Xu, L.; He, N.; Li, X.; Cao, H.; Li, C.; Wang, R.; Wang, C.; Yao, M.; Zhou, S.; Wang, J. Local community assembly processes shape β-diversity of soil phoD-harbouring communities in the Northern Hemisphere steppes. Glob. Ecol. Biogeogr. 2021, 30, 2273–2285. [Google Scholar] [CrossRef]
- Germain, R.M.; Hart, S.P.; Turcotte, M.M.; Otto, S.P.; Sakarchi, J.; Rolland, J.; Usui, T.; Angert, A.L.; Schluter, D.; Bassar, R.D. On the origin of coexisting species. Trends Ecol. Evol. 2021, 36, 284–293. [Google Scholar] [CrossRef] [PubMed]
- Nishizawa, K.; Shinohara, N.; Cadotte, M.W.; Mori, A.S. The latitudinal gradient in plant community assembly processes: A meta-analysis. Ecol. Lett. 2022, 25, 1711–1724. [Google Scholar] [CrossRef] [PubMed]
- Newbold, T.; Oppenheimer, P.; Etard, A.; Williams, J.J. Tropical and Mediterranean biodiversity is disproportionately sensitive to land-use and climate change. Nat. Ecol. Evol. 2020, 4, 1630–1638. [Google Scholar] [CrossRef]
- Yang, J.; Su, P.; Zhou, Z.; Shi, R.; Ding, X. Environmental filtering rather than dispersal limitation dominated plant community assembly in the Zoige Plateau. Ecol. Evol. 2022, 12, e9117. [Google Scholar] [CrossRef] [PubMed]
- Soininen, J.; McDonald, R.; Hillebrand, H. The distance decay of similarity in ecological communities. Ecography 2007, 30, 3–12. [Google Scholar] [CrossRef]
- Fine, P.V. Ecological and evolutionary drivers of geographic variation in species diversity. Annu. Rev. Ecol. Evol. Syst. 2015, 46, 369–392. [Google Scholar] [CrossRef]
- Huang, X.; Wang, J.; Dumack, K.; Liu, W.; Zhang, Q.; He, Y.; Di, H.; Bonkowski, M.; Xu, J.; Li, Y. Protists modulate fungal community assembly in paddy soils across climatic zones at the continental scale. Soil Biol. Biochem. 2021, 160, 108358. [Google Scholar] [CrossRef]
- Qu, M. Influence of geographic distance and environmental factors on beta diversity of plants in the Alxa gobi region in northern China. Biodivers. Sci. 2022, 30, 22029. [Google Scholar] [CrossRef]
- Laiolo, P.; Pato, J.; Obeso, J.R. Ecological and evolutionary drivers of the elevational gradient of diversity. Ecol. Lett. 2018, 21, 1022–1032. [Google Scholar] [CrossRef]
- Zhang, H.; Feng, Y.; Guan, W.; Cao, X.; Li, Z.; Ding, J. Using unmanned aerial vehicles to quantify spatial patterns of dominant vegetation along an elevation gradient in the typical Gobi region in Xinjiang, Northwest China. Glob. Ecol. Conserv. 2021, 27, e01571. [Google Scholar] [CrossRef]
- Li, S.; Su, P.; Zhang, H.; Zhou, Z.; Xie, T.; Shi, R.; Gou, W. Distribution patterns of desert plant diversity and relationship to soil properties in the Heihe River Basin, China. Ecosphere 2018, 9, e02355. [Google Scholar] [CrossRef]
- Wang, J.; Wang, Y.; Qu, M.; Feng, Y.; Wu, B.; Lu, Q.; He, N.; Li, J. Testing the Functional and Phylogenetic Assembly of Plant Communities in Gobi Deserts of Northern Qinghai–Tibet Plateau. Front. Plant Sci. 2022, 13, 952074. [Google Scholar] [CrossRef] [PubMed]
- Cheng, Y.; Li, X.; Wang, Y.; Zhan, H.; Yang, W.; Jiang, Q. New measures of deep soil water recharge during the vegetation restoration process in semi-arid regions of northern China. Hydrol. Earth Syst. Sci. 2020, 24, 5875–5890. [Google Scholar] [CrossRef]
- Ricotta, C.; Podani, J. On some properties of the Bray-Curtis dissimilarity and their ecological meaning. Ecol. Complex. 2017, 31, 201–205. [Google Scholar] [CrossRef]
- Dallas, T. metacom: An R package for the analysis of metacommunity structure. Ecography 2014, 37, 402–405. [Google Scholar] [CrossRef]
- Scherrer, D.; Mod, H.K.; Pottier, J.; Litsios-Dubuis, A.; Pellissier, L.; Vittoz, P.; Götzenberger, L.; Zobel, M.; Guisan, A. Disentangling the processes driving plant assemblages in mountain grasslands across spatial scales and environmental gradients. J. Ecol. 2019, 107, 265–278. [Google Scholar] [CrossRef]
- Sun, L.; Wang, H.; Cai, Y.; Yang, Q.; Chen, C.; Lv, G. Disentangling the Interspecific and Intraspecific Variation in Functional Traits of Desert Plant Communities under Different Moisture Gradients. Forests 2022, 13, 1088. [Google Scholar] [CrossRef]
- Karp, D.S.; Rominger, A.J.; Zook, J.; Ranganathan, J.; Ehrlich, P.R.; Daily, G.C. Intensive agriculture erodes β-diversity at large scales. Ecol. Lett. 2012, 15, 963–970. [Google Scholar] [CrossRef]
- Menegotto, A.; Dambros, C.S.; Netto, S.A. The scale-dependent effect of environmental filters on species turnover and nestedness in an estuarine benthic community. Ecology 2019, 100, e02721. [Google Scholar] [CrossRef]
- Chalcraft, D.R.; Williams, J.W.; Smith, M.D.; Willig, M.R. Scale dependence in the species-richness–productivity relationship: The role of species turnover. Ecology 2004, 85, 2701–2708. [Google Scholar] [CrossRef]
- Lewthwaite, J.M.; Debinski, D.M.; Kerr, J.T. High community turnover and dispersal limitation relative to rapid climate change. Glob. Ecol. Biogeogr. 2017, 26, 459–471. [Google Scholar] [CrossRef]
- Xin, Z.; Feng, W.; Zhan, H.; Bai, X.; Yang, W.; Cheng, Y.; Wu, X. Atmospheric Vapor Impact on Desert Vegetation and Desert Ecohydrological System. Plants 2023, 12, 223. [Google Scholar] [CrossRef] [PubMed]
- Cheng, Y.; Zhan, H.; Yang, W.; Dang, H.; Li, W. Is annual recharge coefficient a valid concept in arid and semi-arid regions? Hydrol. Earth Syst. Sci. 2017, 21, 5031–5042. [Google Scholar] [CrossRef]
- Rahbek, C. The role of spatial scale and the perception of large-scale species-richness patterns. Ecol. Lett. 2005, 8, 224–239. [Google Scholar] [CrossRef]
- Bennie, J.; Wiltshire, A.; Joyce, A.; Clark, D.; Lloyd, A.; Adamson, J.; Parr, T.; Baxter, R.; Huntley, B. Characterising inter-annual variation in the spatial pattern of thermal microclimate in a UK upland using a combined empirical–physical model. Agric. For. Meteorol. 2010, 150, 12–19. [Google Scholar] [CrossRef]
- Zhang, T.; Li, B.; Yuan, Y.; Gao, X.; Sun, Q.; Xu, L.; Jiang, Y. Spatial downscaling of TRMM precipitation data considering the impacts of macro-geographical factors and local elevation in the Three-River Headwaters Region. Remote Sens. Environ. 2018, 215, 109–127. [Google Scholar] [CrossRef]
- Yang, H.; Wang, Y.; Wang, J.; Xia, Y.; Li, J.; Jia, X.; Wu, B. Effects of environmental filtering and dispersal limitation on the β-diversity of plant communities in the south fringe of Kumtag Desert. J. Desert Res. 2021, 41, 147. [Google Scholar]
- Kessler, M.; Herzog, S.K.; Fjeldså, J.; Bach, K. Species richness and endemism of plant and bird communities along two gradients of elevation, humidity and land use in the Bolivian Andes. Divers. Distrib. 2001, 7, 61–77. [Google Scholar] [CrossRef]
- Segura, G.; Balvanera, P.; Durán, E.; Pérez, A. Tree community structure and stem mortality along a water availability gradient in a Mexican tropical dry forest. Plant Ecol. 2002, 169, 259–271. [Google Scholar] [CrossRef]
- Vetaas, O.R.; Grytnes, J.A. Distribution of vascular plant species richness and endemic richness along the Himalayan elevation gradient in Nepal. Glob. Ecol. Biogeogr. 2002, 11, 291–301. [Google Scholar] [CrossRef]
- Darwish, O.; Persaud, N.; Martens, D. Effect of long-term application of animal manure on physical properties of three soils. Plant Soil 1995, 176, 289–295. [Google Scholar] [CrossRef]
- Shi, W.; Wang, Y.Q.; Xiang, W.S.; Li, X.K.; Cao, K.F. Environmental filtering and dispersal limitation jointly shaped the taxonomic and phylogenetic beta diversity of natural forests in southern China. Ecol. Evol. 2021, 11, 8783–8794. [Google Scholar] [CrossRef] [PubMed]
- Dong, L.; Liang, C.; Li, F.Y.; Zhao, L.; Ma, W.; Wang, L.; Wen, L.; Zheng, Y.; Li, Z.; Zhao, C. Community phylogenetic structure of grasslands and its relationship with environmental factors on the Mongolian Plateau. J. Arid Land 2019, 11, 595–607. [Google Scholar] [CrossRef]
- Tilman, D. Niche tradeoffs, neutrality, and community structure: A stochastic theory of resource competition, invasion, and community assembly. Proc. Natl. Acad. Sci. USA 2004, 101, 10854–10861. [Google Scholar] [CrossRef] [PubMed]
- Peay, K.G.; Kennedy, P.G.; Talbot, J.M. Dimensions of biodiversity in the Earth mycobiome. Nat. Rev. Microbiol. 2016, 14, 434–447. [Google Scholar] [CrossRef]
- El-Keblawy, A.; Soliman, S.; Al-Khoury, R.; Ghauri, A.; Al Rammah, H.; Hussain, S.E.; Rashid, S.; Manzoor, Z. Effect of maturation conditions on light and temperature requirements during seed germination of Citrullus colocynthis from the Arabian Desert. Plant Biol. 2019, 21, 292–299. [Google Scholar] [CrossRef]


| NO. | Plant Families | Genus | Species | ||
|---|---|---|---|---|---|
| Quantity/pc | Percentage % | Quantity | Percentage % | ||
| 1 | Chenopodiaceae | 12 | 26.70% | 14 | 24.56% |
| 2 | Asteraceae | 6 | 13.33% | 12 | 21.05% |
| 3 | Poaceae | 6 | 13.33% | 7 | 12.28% |
| 4 | Fabaceae | 4 | 8.89% | 4 | 7.02% |
| 5 | Zygophyllaceae | 3 | 6.67% | 4 | 7.02% |
| 6 | Liliaceae | 1 | 2.22% | 3 | 5.26% |
| 7 | Polygonaceae | 2 | 4.44% | 2 | 3.52% |
| 8 | Brassicaceae | 2 | 4.44% | 2 | 3.52% |
| 9 | Tamaricaceae | 2 | 4.44% | 2 | 3.52% |
| 10 | Apocynaceae | 1 | 2.22% | 1 | 1.75% |
| 11 | Crassulaceae | 1 | 2.22% | 1 | 1.75% |
| 12 | White Flowering Danes | 1 | 2.22% | 1 | 1.75% |
| 13 | Ephedra | 1 | 2.22% | 1 | 1.75% |
| 14 | Buttercup family | 1 | 2.22% | 1 | 1.75% |
| 15 | Rosaceae | 1 | 2.22% | 1 | 1.75% |
| 16 | Caryophyllaceae | 1 | 2.22% | 1 | 1.75% |
| Influencing Factors | β-Diversity | Turnover | ||
|---|---|---|---|---|
| R2 | p | R2 | p | |
| Climate factors | 0.27 | <0.001 | 0.19 | <0.001 |
| Soil factors | 0.13 | <0.001 | 0.15 | <0.001 |
| Geographical distance | 0.03 | <0.001 | 0.01 | <0.001 |
| Climate factor with soil factor | 0.32 | <0.001 | 0.26 | <0.001 |
| Climatic factors with geographical distance | 0.17 | <0.001 | 0.10 | <0.001 |
| Soil factor with Geographical distance | 0.16 | <0.001 | 0.15 | <0.001 |
| Climatic factor, Soil factor and Geographical distance | 0.33 | <0.001 | 0.26 | <0.001 |
Disclaimer/Publisher’s Note: The statements, opinions and data contained in all publications are solely those of the individual author(s) and contributor(s) and not of MDPI and/or the editor(s). MDPI and/or the editor(s) disclaim responsibility for any injury to people or property resulting from any ideas, methods, instructions or products referred to in the content. |
© 2024 by the authors. Licensee MDPI, Basel, Switzerland. This article is an open access article distributed under the terms and conditions of the Creative Commons Attribution (CC BY) license (https://creativecommons.org/licenses/by/4.0/).
Share and Cite
Xin, Z.; Li, X.; Li, Y.; Dong, X.; Duan, R.; Chang, X.; Cheng, Y.; Wu, X.; Li, W. A Study of the Diversity Patterns of Desert Vegetation Communities in an Arid Zone of China. Plants 2024, 13, 2783. https://doi.org/10.3390/plants13192783
Xin Z, Li X, Li Y, Dong X, Duan R, Chang X, Cheng Y, Wu X, Li W. A Study of the Diversity Patterns of Desert Vegetation Communities in an Arid Zone of China. Plants. 2024; 13(19):2783. https://doi.org/10.3390/plants13192783
Chicago/Turabian StyleXin, Zhiming, Xing Li, Yonghua Li, Xue Dong, Ruibing Duan, Xu Chang, Yiben Cheng, Xiuqing Wu, and Wei Li. 2024. "A Study of the Diversity Patterns of Desert Vegetation Communities in an Arid Zone of China" Plants 13, no. 19: 2783. https://doi.org/10.3390/plants13192783