Article

Assessment of Genetic Diversity and Population Structure of Exotic Sugar Beet (Beta vulgaris L.) Varieties Using Three Molecular Markers

1
Academy of Modern Agriculture and Ecological Environment, Heilongjiang University, Harbin 150080, China
2
Shihezi Academy of Agricultural Sciences, Shihezi 832061, China
*
Authors to whom correspondence should be addressed.
Plants 2024, 13(21), 2954; https://doi.org/10.3390/plants13212954
Submission received: 31 August 2024 / Revised: 20 October 2024 / Accepted: 21 October 2024 / Published: 22 October 2024
(This article belongs to the Section Plant Molecular Biology)

Abstract

:
Sugar beet (Beta vulgaris L.) is a biennial herb belonging to the Amaranthaceae family. It contributes to approximately 30% of the world’s total sucrose production and is an economically important crop. In this study, we analyzed the genetic diversity and population structure of 132 exotic sugar beet varieties using three molecular makers: four pairs of simple sequence repeat (SSR) primers, three pairs of insertion–deletion sequence (InDel) primers, and 20 cis-element amplification polymorphism (CEAP) primers. The results indicated that the number of alleles (Na) was 298, among which the number of effective alleles (Ne) was 182.426 (accounting for approximately 61.2%). The mean value of the genetic diversity index was 0.836. The polymorphic information content (PIC) was 0.639–0.907 (mean = 0.819), indicating a high level of polymorphism. These sugar beet varieties were classified into six clusters using the UPGMA method of cluster analysis. Population structure analysis revealed that the most ideal K value was 6. This indicated that the test materials could be divided into six categories, consistent with the clustering results. The clustering results indicated that most sugar beet varieties from the same breeding company clustered together, and the genetic distance between them was small, indicating that they may share the same male and/or female parent. Some varieties from different companies clustered together, indicating a narrow genetic base and potential exchange of germplasm resources between breeding companies. This study revealed the genetic differences among exotic sugar beet varieties and characteristics of the population structure. It provided a scientific basis for the identification of sugar beet varieties and markers-assisted breeding in China in the future.

1. Introduction

Sugar beet (Beta vulgaris L.), belonging to the Amaranthaceae family [1], is a cultivated species that originated from the European region. Sugar beet is one of the world’s most economically valuable sugar crops and an important source of cane sugar in temperate regions of the Northern Hemisphere. Sugar beet contributes to approximately 30% of the world’s total sugar production [2]. Sugar beet exhibits cold and alkali resistance, which contributes to significant economic benefits. As an important sugar crop in China, the annual sugar production from sugar beet accounts for approximately 14% of the total sugar production in the country [3]. The dominant production areas of sugar beet in China are mainly located in the north, northwest, and northeast and other areas north of 40° N latitude, with the total planting area and production accounting for more than 95% of the national total in the country [4]. Cultivated beets are usually divided into four categories according to their usage: sugar beets, leaf beets, edible beets, and forage beets [5]. Among them, sugar beet is the main cultivated variety in agricultural production. Sugar beet is a biennial herb [6] that grows in temperate climates. It can be used to produce not only edible sugar but also raw materials for the production of methanol, ethanol, and acetone [7]. Moreover, the byproducts after sugar production can be utilized to produce a variety of secondary goods. In addition, the stems, leaves, and hair and tail roots of beets can be used to extract betaine and to manufacture agricultural feed [8].
Beet is a cross-pollinated crop, exhibiting self-incompatibility and a high degree of heterogeneity within the population. Therefore, its original genetic integrity is susceptible to various factors [9]. In 1906, sugar beet was introduced to China, becoming the earliest source of sugar beet genes [10]. The genetic improvement of crops and related research depends on the quantity and quality of existing germplasm resources. In addition to quantity and quality, the in-depth study of germplasm resources directly affects the efficiency of their utilization and sustainable development of the modern seed industry [11]. However, the existing sugar beet germplasm resources in China are not complete or adequate; the kinship relationship among germplasm resources is relatively close, and the genetic base is narrow. This limits sugar beet breeding in China [12].
Currently, almost all sugar beet varieties used in China are exotic and are regarded as monoembryonic types. Therefore, it is of great significance to understand their genetic diversity and population structure. The results of relevant studies are favorable for the construction of fingerprints and guiding the selection and breeding of superior sugar beet varieties in China. With the development of science and technology, molecular marker technology has become more advantageous [13] than morphological marker [14], cellular marker [15], and biochemical marker [16] technologies. Various molecular marker techniques such as SNP [17], RFLP [18], RAPD [19], lSSR [20], insertion–deletion sequence (InDel) [21], and simple sequence repeats (SSR) [22] have been widely used in recent decades in the study of genetic variation in several crops. Among them, SSR or microsatellite DNA markers are the most widely used because they are simple and convenient to use, can help in determining the size of alleles via nondenaturing polyacrylamide gel electrophoresis, and provide a large amount of genetic information through the large number of alleles at each locus [23]. Therefore, they provide a basis for studying genetic relationships, population structure, and genetic diversity of crops. InDel markers are third-generation molecular markers based on whole-genome sequencing, which are length polymorphic variations generated by the insertion or deletion of a relatively short nucleotide sequence in a certain number of nucleotides at an allelic locus [24]. The number of bands amplified by InDel molecular marker technology is small and highly recognizable, which reduces the possibility of subsequent identification errors caused by excessive clutter of bands [21]. Peng et al. [25] analyzed the genetic diversity, population structure, and cluster analysis of 129 sugar beet germplasm resources to screen superior germplasms for breeding using the 27 simple sequence repeat (SSR) and 33 pairs of insertion–deletion (InDel) molecular markers. Liang et al. [26] assess the genetic variation and genetic structure of 111 sugar beet varieties by utilizing simple sequence repeat (SSR), restriction site amplified polymorphism (RSAP), direct amplification of minisatellite DNA by PCR (DAMD), and start codon targeted (SCoT) molecular markers. Patel et al. [27] used 14 pairs of SSR and 21 pairs of InDel primers to analyze the genetic diversity of 19 colored and white rice genotypes and reported the highest genetic diversity between genotypes Krishna Kamod (white pericarp) and IRST 1 (red pericarp) and the lowest genetic diversity between genotypes Lal Kada (red pericarp) and Krishna Kamod (white pericarp). DNA markers are widely distributed in the genome, independent of the environment, and could be recognized at any developmental period and in any tissue.
The newly developed cis-element amplified polymorphism (CEAP) marker in recent years is a novel promoter and gene-targeted molecular marker based on cis-elements that are highly conserved among species [28]. It contains eight cis-elements: AAAG, ACGTG, CCGA, ACTCAT, GGTCA, TATCC, TGAC, and GATAA, which are closely related to plant growth and development, signaling, and response to adversity. Through cloning and sequencing, it was verified that the CEAP marker could be amplified from the promoter region, promoter and gene region only at the base polymorphisms due to region, gene, and 3′ non-coding regions. Chen [29] used CEAP molecular markers to amplify eight mango germplasm resources via PCR and reported that CEAP primers could amplify clear and high polymorphic bands. In addition, CEAP markers could well amplify germplasm resources of rice, tomato, potato, winter melon, citrus, and longan, and the primers had good generalization for the species [29]. The use of CEAP markers for genetic diversity analysis, kinship identification, and marker-assisted breeding in plants is a novel, simple, and low-cost method, and CEAP markers are universal among different species.
In this study, we aimed to understand the genetic diversity and population structure of 132 varieties of exotic sugar beet using three different kinds of molecular markers, namely, SSR, InDel, and CEAP, with 27 pairs (bands) of core primers. This study provided support for the selection and breeding of sugar beet germplasm resources in the future and the foundation for fully exploring and utilizing the excellent sugar beet genetic resources and formulating new hybrid combinations.

2. Results

2.1. Analysis of Genetic Diversity

A total of 298 alleles (Na) were detected in 27 pairs (bands) (Table 1), and 5 (AAAG28) to 19 (D32) alleles were amplified from each pair (band) primers with an average of 11 alleles. The average effective allele (Ne) value was 6.757, and the highest allele effective number of primers was 11.035 (TGAC28). The Shannon information index (I) ranged from 1.3689 (AAAG28) to 2.549 (TCAC26) (average 2.044). The maximum and minimum values of the observed heterozygosity (Ho) were 1.000 (TGAC23) and 0.207 (ACGTG4), respectively. The maximum and minimum values of the expected heterozygosity (He) were 0.913 (TGAC28) and 0.688 (AAAG28), respectively. Nei’s expected heterozygosity ranged from 0.683 (AAAG28) to 0.909 (TGAC28). The polymorphism information content (PIC) of the primers ranged from 0.639 (AAAG28) to 0.907 (TGAC26) (average 0.819), and all PIC values were >0.5. Among them, the PIC values of primers TCAC26 and AAAG28 were the highest and lowest, respectively.

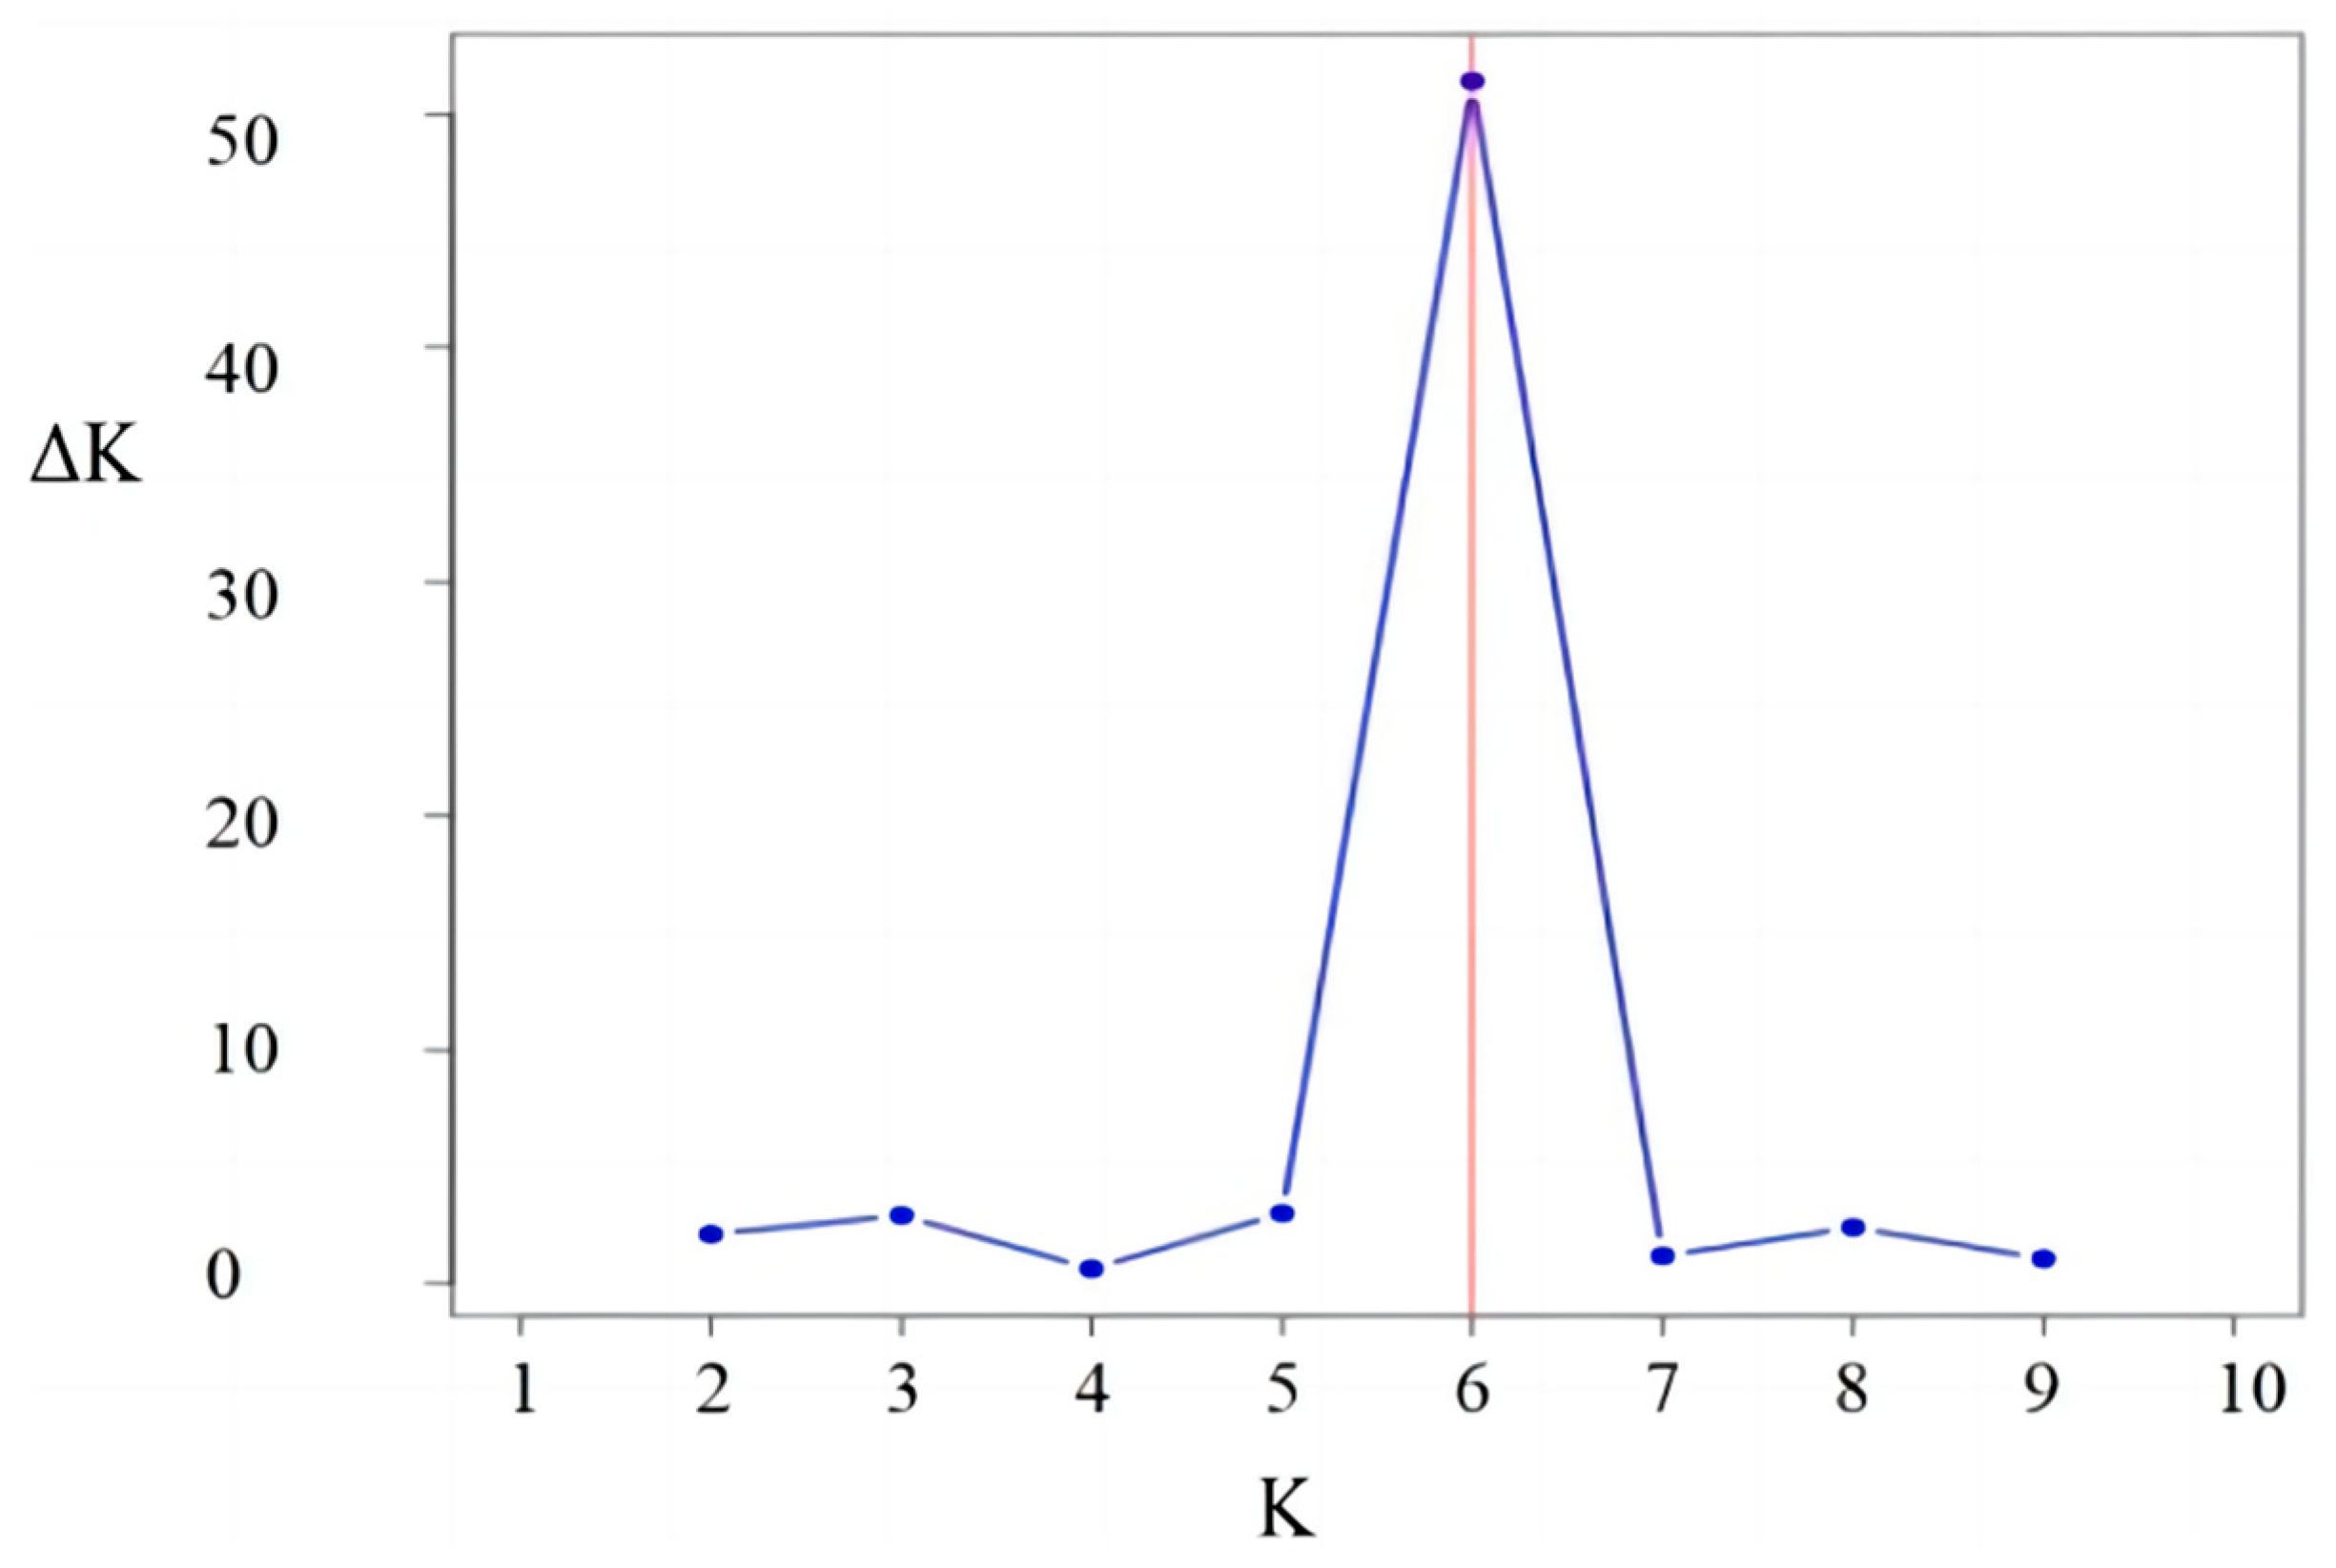
2.2. Analysis of Population Structure

The maximum value of ∆K occurred at K = 6 (Figure 1). This indicated that the 132 sugar beet varieties could be divided into six different groups (Figure 2). The six different colors corresponded to six subgroups (I, II, III, IV, V, and VI), among which most sugar beet varieties in subgroup I were from Maribohilleshog ApS. The sugar beet varieties in subgroups II, III, IV, and V were mostly from Maribohilleshog APS and SES VanderHave, Maribohilleshog ApS, KWS SAAT SE, and SES VanderHave, respectively.

2.3. Genetic Distance and Cluster Analysis

In conformity with the outcomes derived from the PCR amplification, an extensive analysis of the samples of exotic sugar beet varieties was conducted utilizing the MEGA7 software application. Consequently, the genetic distance metrics for 132 sugar beet varieties were ascertained, as detailed in Table S1. The genetic distances among the 132 samples spanned a range of 0.065 to 0.287, with an average value of 0.207. Moreover, the genetic distances among the predominant sugar beet cultivars were observed to cluster within the range of 0.19 to 0.23, as documented in Table S1. Most sugar beet varieties from the same company exhibited a small genetic distance between each other and were clustered into a class. For example, sugar beet varieties 89 and 90 (both from Maribohilleshög ApS) exhibited a genetic distance of 0.081; the varieties 30 and 31 (both from KWS SAAT SE) exhibited a genetic distance of 0.106 (Table S1). However, in some cases, the genetic distance between sugar beet varieties from different companies was small. For example, the genetic distance between the varieties 103 and 107 (from SES VanderHave and BETASEED, respectively) was 0.065 (Table S1).
Based on the genetic distance matrix of the 132 test samples, clustering analysis was performed using the UPGMA method, and a dendrogram of the 132 sugar beet varieties in terms of relatedness was constructed (Figure 3). Most sugar beet varieties from the same breeding company were clustered together, and the genetic distance between them was small (Figure 3). However, few sugar beet varieties from different companies were clustered together. It may be due to the narrow genetic base of sugar beet or the exchange of sugar beet resources between different companies while breeding sugar beet varieties. At a genetic distance of 0.255, the test materials could be divided into six categories, which corresponded to the six colors in the figure. Category I (green) included 24 sugar beet varieties, most of which were from STRUBE. Category II (blue) included 24 varieties, mostly from SES VanderHave and BETASEED. Category III (purple) included 12 varieties, all from Maribohilleshog ApS. Category IV (orange) included 24 varieties, mostly from KWS SAAT SE and a few from STRUBE and Lion Seeds Ltd. Category V (red) included 24 varieties, mostly from SES VanderHave. Category VI (pink) included 24 varieties, mostly from KWS SAAT SE.

2.4. Analysis of Molecular Variance

We conducted an investigation into the genetic diversity of 132 exotic sugar beet cultivars utilizing AMOVA (analysis of molecular variance). The results showed that the main genetic variation of exotic sugar beet varieties was 95% within the population, and only a small part of the genetic variation was 5% among the various populations. The genetic differentiation among these populations was minor, quantified at 0.057 with a p-value less than 0.001, which suggests a considerable degree of genetic fluidity. Furthermore, the gene flow, denoted as Nm, was calculated to be equivalent to 4.98 immigrants per generation, as detailed in Table 2.

3. Discussion

A pivotal element in achieving breakthroughs in sugar beet breeding is the cultivation and deployment of superior germplasm resources. In recent years, researchers have systematically evaluated and analyzed a large number of crop germplasm resources by using SSR, SNP, and InDel markers to analyze their genetic diversity and population structure so as to facilitate subsequent germplasm improvement and innovation. Significant advancements in the analysis of genetic diversity and population structure have been realized in numerous crops, including soybean [30], rice [31], maize [32], wheat [33], tobacco [34], and potato [35], transitioning from rudimentary phenotypic assessments to sophisticated molecular-level investigations.
The collection of beet varieties from different regions is essential for the analysis and utilization of available beet germplasm resources. In this study, the selected sugar beet varieties were composed of 132 materials from France, the United States, the United Kingdom, Denmark, and Germany. These sugar beet varieties were introduced by six different breeding companies, and they have a high market share of sugar beet varieties, so it is representative and convincing to study the genetic diversity and population structure of high-quality exotic sugar beet varieties.
SSR marker has a wide range of applications and is simple and convenient. However, the bands amplified by InDel molecular marker technology are more accurate and clearer. In addition, newly developed CEAP primers in recent years can amplify clear and highly polymorphic bands, and CEAP markers are widely distributed in plants to prevent errors brought on by specificity and complexity. Given the advantages of these three markers, we decided to combine them to improve the efficacy of this study and yield superior and reliable findings when examining the genetic diversity of sugar beet germplasm. The evaluation of the twenty-seven primers suggested that all primers have PIC values greater than 0.5, and they were considered “highly informative” in the current study (Table 1), following the classification of Botstein et al. [36].
In this study, the genetic distances among sugar beet varieties from six different breeding companies ranged from 0.065 to 0.287, with small variations in genetic distances and insignificant differences in genetic backgrounds. This could be due to the narrow genetic base of sugar beet or the exchange of sugar beet resources among different breeding companies, which in turn resulted in smaller genetic distances [37]. Moreover, the exotic sugar beet varieties had significant gene exchange, which suggests a close genetic affinity among them. Liu et al. [38] used Indel and SSR molecular markers to study the genetic diversity of 21 red beet varieties. Through cluster analysis, they found that red beet varieties were scarce, and most of them were close relatives and had small genetic distances. Tehseen et al. [39] evaluated the potential of publicly available germplasm for sugar beet improvement by genetic diversity analysis with SNPs (single-nucleotide polymorphisms). Covering the whole genome of sugar beet was conducted using 1936 publicly available germplasm lines in the United States. The results confirmed the narrow genetic base of sugar beet. These conclusions are consistent with the findings of this paper. This indicates that the problem of a narrow genetic basis between the parents for the allocation of hybrid combinations has not been fundamentally solved.
This study provided a theoretical foundation for germplasm innovation and variety selection. In the future, it is necessary to make use of wild beet resources and various mutagenesis methods, increase the efforts to innovate beet germplasm resources, and expand the genetic basis of beet so as to better adapt to the development of future beet breeding.

4. Materials and Methods

4.1. Plant Material

A total of 132 exotic sugar beet varieties from six sugar beet breeding companies were used in this study [34 from SES VanderHave (France), 22 from STRUBE (Germany), 32 from KWS SAAT SE (Germany), 28 from Maribohilleshög ApS (Denmark), 8 from Lion Seeds Ltd. (UK), and 8 from BETASEED (USA)]. The number and name of sugar beet varieties and name of the breeding company are given in Table 3.

4.2. DNA Extraction of Sugar Beet Varieties

The cetyltrimethylammonium bromide (CTAB) protocol was employed for the isolation of genomic DNA from sugar beet samples [40]. DNA extraction was performed upon the emergence of 2–3 pairs of true leaves. The concentration and purity of the isolated DNA were evaluated utilizing a NanoDrop 2000/2000c Ultra-Micro UV–Vis Spectrophotometer (manufactured by Thermo Fisher, based in Madison, WI, USA). The DNA stock solution was subsequently diluted to a concentration of 10 ng/μL to create a working solution. The remaining DNA aliquots were preserved at a temperature of −20 °C for future experimental applications.

4.3. Primer Information Used in the Experiment

Three primers with high levels of polymorphism were selected to amplify the DNA samples of sugar beet varieties, including 27 pairs (bands) of 4 pairs of SSR primers, 3 pairs of InDel primers, and 20 CEAP makers (Table 4). The SSR primers 27,906, 11,965, and 57,236 were selected from earlier studies [41,42,43], whereas the SSR primers 2305 and InDel primers were designed and provided by the Laboratory of Molecular Genetics, Heilongjiang University, using the whole genome sequence of sugar beet. All CEAP primers were designed by the Germplasm Resources Laboratory of Guangxi University using the whole genome sequence of mangoes. All the primers were synthesized by Shanghai Bioengineering Co., Ltd. (Shanghai, China).

4.4. PCR Amplification Reaction System and Procedure

The PCR amplification volume was 5 µL, consisting of 2.5 µL 2 × Taq PCR Master Mix (BioTeke Corporation, Wuxi, China), 0.4 µL primer, 1.1 µL distilled water (ddH2O), and 1 µL DNA sample of the beet variety. PCR was performed using the Veriti 96-well thermal cycler (Ther-moFisher Scientific™, Shanghai, China).
The touchdown program was used for InDel and CEAP primers: predenaturation at 94 °C for 3 min, 15 s at 94 °C, annealing at 65 °C for 15 s, two cycles of 65–56 °C for every one degree down to 56 °C, and extension at 72 °C for 30 s. This was followed by 20 cycles of 15 s at 94 °C, 15 s at 55 °C, 30 s at 72 °C, and final extension at 72 °C for 5 min. The PCR reaction procedure used for SSR primers was predenaturation at 94 °C for 3 min, followed by 32 cycles of denaturation at 95 °C for 15 s, annealing at 57 °C for 15 s, and extension at 72 °C for 30 s, and finally, extension at 72 °C for 5 min.
The PCR products of SSR primers and InDel primers were detected by 8% nondenatured polyacrylamide gel electrophoresis, which was run for 1.5 h at a constant 180 V. The gel was stained with the nontoxic G-Red nucleic acid dye (BioTeke Corporation, Wuxi, China) and was photographed using a gel imager.
The PCR products of CEAP primers were detected using 2% agarose gel electrophoresis. A 5 µL amount of it was loaded on 2% agarose gel containing Gold View fluorescent nucleic acid dye. The horizontal electrophoresis cell voltage was set at 130 V, and electrophoresis was performed for 30 min. The agarose gel was taken out, and the band type was observed under the gel imager and photographed.
As mentioned above, the images generated under two different electrophoretic treatments were saved and exported for subsequent manual observation and recording in the corresponding Excel forms.

4.5. Statistical Analysis of Data

The outcomes of molecular marker detection were ascertained via the 0/1 assignment method. Initially, the amplified bands were meticulously analyzed manually, with their types documented in a corresponding table. Subsequently, to generate a binary data matrix comprising 0 s and 1 s, a value of “1” was allocated in instances where bands were present at identical positions, whereas a “0” was designated when no bands were observed.PopGen1.32 [44] was used to calculate genetic diversity indicators, including Na, Ne, Ho, He, I, and Nei’s. PowerMarker 3.25 [45] was used to calculate the genetic diversity index and PIC among different populations [46]. Based on genetic variation information, markers with PIC >0.5 were considered high-information markers, those with 0.5 > PIC > 0.25 as informative markers, and those with PIC <0.25 as “noninformative markers” [36]. The Structure v.2.3.4 software [47] was used to analyze the population structure of sugar beet varieties, and the optimal number of subgroups was calculated. This model-based software uses a Bayesian clustering method [48]. Using the Markov Chain Monte Carlo (MCMC) technique, the posterior probabilities were computed. The MCMC chains were run using a model that allowed for admixture and correlated allele frequencies with a burning period of 100,000, followed by 100,000 iterations. For each K-value, 10 runs were performed with K ranging from 1 to 10 to obtain an accurate estimation of the number of populations. The optimal number of subpopulations of the population was later determined by the rate of change in the posteriori probability values (∆K) [48] using the web-based program STRUCTURE HARVESTER [49]. By combining the data of the three different kinds of primers, a clustered dendrogram [36] of the 132 sugar beet varieties was generated based on Nei’s genetic distance [47], using the unweighted pair–group method with arithmetic averaging (UPGMA) [50]. Molecular variance analysis (AMOVA) and gene flow estimation are also involved. The original genotype data of exotic sugar beet varieties were used to calculate the variation, differentiation, and significance test in GenAlEx version 6.501 software. Gene flow (Nm) was calculated based on the genetic differentiation coefficient (Fst) obtained from GenAlEx version 6.501 [51].

5. Conclusions

In this study, we analyzed the genetic diversity and population structure of 132 sugar beet varieties from six sugar beet breeding companies. Their DNA samples were labeled using 27 pairs (bands) of primers. The results indicated that the genetic distance among 132 sugar beet varieties, both within the same company and between different companies, is small, and a significant portion of these varieties exhibit gene exchange. Consequently, the findings from these 132 sugar beet varieties reveal populations characterized by a low level of genetic diversity. This underscores the ongoing challenge of addressing the narrow genetic base issue in sugar beet breeding.
This study provides a theoretical basis for the innovation of beet germplasm resources and the selection of varieties. In the future, it is necessary to use wild sugar beet resources combined with various mutagenesis breeding, gene editing breeding, and other advanced technologies to broaden the genetic basis of sugar beet and better adapt to the development needs of future sugar beet breeding.

Supplementary Materials

The following supporting information can be downloaded at: https://www.mdpi.com/article/10.3390/plants13212954/s1, Table S1: Genetic distance results of 132 sugar beet (Beta vulgaris L.) varieties.

Author Contributions

Conceptualization, B.S. and Z.W.; methodology, Z.W. and R.W.; software, B.S.; validation, S.L., Z.P. and Z.W.; formal analysis, B.S.; investigation, B.S. and Z.W.; resources, Z.W. and R.W.; data curation, B.S.; writing—original draft preparation, B.S.; writing—review and editing, S.L., Z.P. and Z.W.; visualization, B.S.; supervision, Z.W.; project administration, Z.W. and R.W.; funding acquisition, Z.W. and R.W. All authors have read and agreed to the published version of the manuscript.

Funding

This work was supported by the Special Fund for the Improvement of High-quality Sugar Beet Varieties of the National Sugar Modern Agricultural Industrial Technology System (CARS-170111) and Kazakhstan new sugar beet varieties efficient planting technology demonstration park construction (2024BA002).

Data Availability Statement

The original contributions presented in the study are included in the article/Supplementary Materials, further inquiries can be directed to the corresponding author/s.

Conflicts of Interest

The authors declare no conflicts of interest.

References

  1. Romeiras, M.M.; Vieira, A.; Silva, D.N.; Moura, M.; Santos-Guerra, A.; Batista, D.; Duarte, M.C.; Paulo, O.S. Evolutionary and Biogeographic Insights on the Macaronesian Beta-Patellifolia Species (Amaranthaceae) from a Time-Scaled Molecular Phylogeny. PLoS ONE 2016, 11, e0152456. [Google Scholar] [CrossRef] [PubMed]
  2. Li, J.; Schulz, B.; Stich, B. Population structure and genetic diversity in elite sugar beet germplasm investigated with SSR markers. Euphytica 2010, 175, 35–42. [Google Scholar] [CrossRef]
  3. Deng, D.D.; Shen, L.; Li, M.; Guo, J.X.; Liu, X. Overview of the World Sugar Market in the 2021/22 Cruising Season. Sugarcane Canesugar 2022, 51, 91–99. [Google Scholar]
  4. Xu, Q.L.; Lu, B.F. Review and Prospect of Mechanization Development of Sugar Beet Production. Sugar Crops China 2016, 38, 73–75+78. [Google Scholar]
  5. Stevanato, P.; Chiodi, C.; Broccanello, C.; Concheri, G.; Biancardi, E.; Pavli, O.; Skaracis, G. Sustainability of the Sugar Beet Crop. Sugar Tech 2019, 21, 703–716. [Google Scholar] [CrossRef]
  6. Schwichtenberg, K.; Wenke, T.; Zakrzewski, F.; Seibt, K.M.; Minoche, A.; Dohm, J.C.; Weisshaar, B.; Himmelbauer, H.; Schmidt, T. Diversification, evolution and methylation of short interspersed nuclear element families in sugar beet and related Amaranthaceae species. Plant J. 2016, 85, 229–244. [Google Scholar] [CrossRef] [PubMed]
  7. Liu, D.; An, Z.; Mao, Z.; Ma, L.; Lu, Z. Enhanced Heavy Metal Tolerance and Accumulation by Transgenic Sugar Beets Expressing Streptococcus thermophilus StGCS-GS in the Presence of Cd, Zn and Cu Alone or in Combination. PLoS ONE 2015, 10, e0128824. [Google Scholar] [CrossRef]
  8. Craig, S.A.S. Betaine in human nutrition. Am. J. Clin. Nutr. 2004, 80, 539–549. [Google Scholar] [CrossRef]
  9. Curcic, Z.; Taski-Ajdukovic, K.; Nagl, N. Relationship between hybrid performance and genetic variation in self-fertile and self-sterile sugar beet pollinators as estimated by SSR markers. Euphytica 2017, 213, 108. [Google Scholar] [CrossRef]
  10. Wang, Z.H.; Wu, Z.D.; Wang, X.W.; Fang, Z.Y. Analysis of the Genetic Diversity in Different Types of Sugar Beets by SRAP and SSR Markers. Acta Agron. Sin. 2008, 1, 37–46. [Google Scholar] [CrossRef]
  11. Witzel, K.; Kurina, A.B.; Artemyeva, A.M. Opening the Treasure Chest: The Current Status of Research on Brassica oleracea and B. rapa Vegetables from ex situ Germplasm Collections. Front. Plant Sci. 2021, 12, 643047. [Google Scholar] [CrossRef] [PubMed]
  12. Ni, H.T.; Ni, H.B.; Zhang, F.S. Application of Molecular Marker Technology in Sugarbeet Breeding. Chin. Agric. Sci. Bull. 2016, 32, 132–137. [Google Scholar]
  13. McGrath, J.M. Assisted Breeding in Sugar Beets. Sugar Tech 2010, 12, 187–193. [Google Scholar] [CrossRef]
  14. Vieira, E.A.; de Carvalho, F.I.F.; Bertan, I.; Kopp, M.M.; Zimmer, P.D.; Benin, G.; da Silva, J.A.G.; Hartwig, I.; Malone, G.; de Oliveira, A.C. Association between genetic distances in wheat (Triticum aestivum L.) as estimated by AFLP and morphological markers. Genet. Mol. Biol. 2007, 30, 392–399. [Google Scholar] [CrossRef]
  15. Zhang, Y.G.; Yuan, X.Y.; Zhang, G.F.; Li, Y.J.; Yin, J.H.; Lin, J.X.; Li, X.J. The Application of Click Chemistry Reactions in Plant Cell Labeling. Chin. Bull. Bot. 2023, 58, 956–965. [Google Scholar]
  16. Hannani, M.T.; Thudium, C.S.; Karsdal, M.A.; Ladel, C.; Mobasheri, A.; Uebelhoer, M.; Larkin, J.; Bacardit, J.; Struglics, A.; Bay-Jensen, A.C. From biochemical markers to molecular endotypes of osteoarthritis: A review on validated biomarkers. Expert Rev. Mol. Diagn. 2024, 24, 23–38. [Google Scholar] [CrossRef] [PubMed]
  17. Bakooie, M.; Pourjam, E.; Mahmoudi, S.B.; Safaie, N.; Naderpour, M. Development of an SNP Marker for Sugar Beet Resistance/Susceptible Genotyping to Root-Knot Nematode. J. Agric. Sci. Technol. 2015, 17, 443–454. [Google Scholar]
  18. Kritsiriwuthinan, K.; Ngrenngarmlert, W.; Patrapuvich, R.; Phuagthong, S.; Choosang, K. Distinct Allelic Diversity of Plasmodium vivax Merozoite Surface Protein 3-Alpha (PvMSP-3α) Gene in Thailand Using PCR-RFLP. J. Trop. Med. 2023, 2023, 8855171. [Google Scholar] [CrossRef]
  19. Mousa, H.M.; Abd Al-Abbas, M.J. Random Amplified Polymorphic DNA for identical Streptococcus salivarius strains isolated from tongue of peoples before and after Listerine In vivo. J. Popul. Ther. Clin. Pharmacol. 2023, 30, E9–E13. [Google Scholar]
  20. Rini, D.S.; Budiyanti, Y.; Valentine, M.; Permana, R. ISSR and SRAP for assessing genetic variability of Indonesian local rice genotypes (Oryza sativa L.). Crop Breed. Appl. Biotechnol. 2023, 23, e448923411. [Google Scholar] [CrossRef]
  21. Sathapondecha, P.; Suksri, P.; Nuanpirom, J.; Nakkanong, K.; Nualsri, C.; Whankaew, S. Development of Gene-Based InDel Markers on Putative Drought Stress-Responsive Genes and Genetic Diversity of Durian (Durio zibethinus). Biochem. Genet. 2024. [Google Scholar] [CrossRef] [PubMed]
  22. Ma, T.; Hu, Y.; Li, F.; Liu, L.; Cui, L. Development of genomic SSR markers and genetic diversity of Sphaerulina musiva in China. J. Phytopathol. 2024, 172, e13253. [Google Scholar] [CrossRef]
  23. Srinivas, P.R. Introduction to Protein Electrophoresis. Methods Mol. Biol. (Clifton N.J.) 2012, 869, 23–28. [Google Scholar]
  24. Jander, G.; Norris, S.R.; Rounsley, S.D.; Bush, D.F.; Levin, I.M.; Last, R.L. Arabidopsis map-based cloning in the post-genome era. Plant Physiol. 2002, 129, 440–450. [Google Scholar] [CrossRef]
  25. Peng, F.; Pi, Z.; Li, S.N.; Wu, Z.D. Genetic Diversity and Population Structure Analysis of Excellent Sugar Beet (Beta vulgaris L.) Germplasm Resources. Horticulturae 2024, 10, 120. [Google Scholar] [CrossRef]
  26. Liang, X.M.; Pi, Z.; Wu, Z.D.; Li, S.N. Constructing DNA Fingerprinting and Evaluating Genetic Diversity Among Sugar Beet (Beta vulgaris L.) Varieties Based on Four Molecular Markers. Sugar Tech 2023, 25, 1361–1373. [Google Scholar] [CrossRef]
  27. Patel, S.; Ravikiran, R.; Chakraborty, S.; Macwana, S.; Sasidharan, N.; Trivedi, R.; Aher, B. Genetic diversity analysis of colored and white rice genotypes using Microsatellite (SSR) and Insertion-Deletion (INDEL) markers. Emir. J. Food Agric. 2014, 26, 497–507. [Google Scholar] [CrossRef]
  28. Chen, M.; He, X.; Huang, X.; Lu, T.; Zhang, Y.; Zhu, J.; Yu, H.; Luo, C. Cis-element amplified polymorphism (CEAP), a novel promoter- and gene-targeted molecular marker of plants. Physiol. Mol. Biol. Plants 2022, 28, 1407–1419. [Google Scholar] [CrossRef]
  29. Chen, M.Y. A Novel Cis-Element Amplified Polymorphism (CEAP), and Its Application in the Analysis of Mango Germplasm Resources. Bachelor’s Thesis, Guangxi University, Guangxi, China, 2022. [Google Scholar]
  30. Liu, Z.; Li, J.; Fa, X.; Htwe, N.M.P.S.; Wang, S.; Huang, W.; Yang, J.; Xing, L.; Chen, L.; Li, Y. Assessing the numbers of SNPs needed to establish molecular IDs and characterize the genetic diversity of soybean cultivars derived from Tokachi nagaha. Crop J. 2017, 5, 326–336. [Google Scholar] [CrossRef]
  31. Pathaichindachote, W.; Panyawut, N.; Sikaewtung, K.; Patarapuwadol, S.; Muangprom, A. Genetic Diversity and Allelic Frequency of Selected Thai and Exotic Rice Germplasm Using SSR Markers. Rice Sci. 2019, 26, 393–403. [Google Scholar] [CrossRef]
  32. Mikel, M.A. Genetic diversity and improvement of contemporary proprietary North American dent corn. Crop Sci. 2008, 48, 1686–1695. [Google Scholar] [CrossRef]
  33. Zhao, J.P.; Quan, B.Q.; Ren, J.C.; Guo, P.Y.; Xu, Y. DNA Molecular Marker Technology and its Application in Wheat Genetic Breeding. Barley Cereal Sci. 2024, 41, 9–13. [Google Scholar]
  34. Zhang, J.; Ge, X.; Zhao, Z.; Zheng, X.; Lu, C.; Jiang, N.; Liu, Y. Population genetic diversity of tomato spotted wilt orthotospovirus isolates from tobacco in Yunnan Province, China. Physiol. Mol. Plant Pathol. 2024, 130, 102228. [Google Scholar] [CrossRef]
  35. Babarinde, S.; Burlakoti, R.R.; Peters, R.D.; Al-Mughrabi, K.; Novinscak, A.; Sapkota, S.; Prithiviraj, B. Genetic structure and population diversity of Phytophthora infestans strains in Pacific western Canada. Appl. Microbiol. Biotechnol. 2024, 108, 237. [Google Scholar] [CrossRef]
  36. Botstein, D.; White, R.L.; Skolnick, M.; Davis, R.W. Construction of a genetic linkage map in man using restriction fragment length polymorphisms. Am. J. Hum. Genet. 1980, 32, 314–331. [Google Scholar]
  37. Wu, Z.D.; Zhang, W.B. The evolution of the world’s major sugar beet breeding companies and their enlightenment to the development of China’s sugar beet industry. Sugar Crops China 2014, 3, 82–84+86. [Google Scholar]
  38. Liu, R.; Liu, N.X.; Wu, Y.M.; Wu, Z.D.; Xing, W.; Wang, Q.H. Genetic Diversity Analysis of Red Beet: Based on SSR and Indel Molecular Markers. Chin. Agric. Sci. Bull. 2019, 35, 47–52. [Google Scholar]
  39. Tehseen, M.M.; Poore, R.C.; Fugate, K.K.; Bolton, M.D.; Ramachandran, V.; Wyatt, N.A.; Li, X.H.; Chu, C.G. Potential of publicly available Beta vulgaris germplasm for sustainable sugarbeet improvement indicated by combining analysis of genetic diversity and historic resistance evaluation. Crop Sci. 2023, 4, 2255–2273. [Google Scholar] [CrossRef]
  40. Wu, C.H.; Yang, L.; Xiang, S.Z.; Hu, Q.Q.; Zhou, Z.X.; Zheng, B.; Shi, X.P.; Liu, M. Study on Genomic DNA Extraction Methods for the Rare and Endangered Tree Species Dipteronia sinensis Oliv. J. Anhui Agric. Sci. 2024, 52, 91–94. [Google Scholar]
  41. Smulders, M.J.M.; Esselink, G.D.; Everaert, I.; De Riek, J.; Vosman, B. Characterisation of sugar beet (Beta vulgari L. ssp vulgaris) varieties using microsatellite markers. BMC Genet. 2010, 11, 41. [Google Scholar] [CrossRef]
  42. Fugate, K.K.; Fajardo, D.; Schlautman, B.; Ferrareze, J.P.; Bolton, M.D.; Campbell, L.G.; Wiesman, E.; Zalapa, J. Generation and Characterization of a Sugarbeet Transcriptome and Transcript-Based SSR Markers. Plant Genome 2014, 7, 1–13. [Google Scholar] [CrossRef]
  43. Plomion, C.; Liu, B.H.; O’Malley, D.M. Genetic analysis using trans-dominant linked markers in an F2 family. Theor. Appl. Genet. 1996, 93, 1083–1089. [Google Scholar] [CrossRef]
  44. Yeh, F.C.; Boyle, T.J.B. Population genetic analysis of co-dominant and dominant markers and quantitative traits. Belg. J. Bot. 1996, 129, 157. [Google Scholar]
  45. Liu, K.; Muse, S.V. PowerMarker: An integrated analysis environment for genetic marker analysis. Bioinformatics 2005, 21, 2128–2129. [Google Scholar] [CrossRef]
  46. Weir, B.S. Genetic Data Analysis II: Methods for Discrete Population Genetic Data; Sinauer Associates: Sunderland, MA, USA, 1996. [Google Scholar]
  47. Falush, D.; Stephens, M.; Pritchard, J.K. Inference of population structure using multilocus genotype data: Dominant markers and null alleles. Mol. Ecol. Notes 2007, 7, 574–578. [Google Scholar] [CrossRef] [PubMed]
  48. Evanno, G.; Regnaut, S.; Goudet, J. Detecting the number of clusters of individuals using the software STRUCTURE: A simulation study. Mol. Ecol. 2005, 14, 2611–2620. [Google Scholar] [CrossRef] [PubMed]
  49. Earl, D.A.; vonHoldt, B.M. STRUCTURE HARVESTER: A website and program for visualizing STRUCTURE output and implementing the Evanno method. Conserv. Genet. Resour. 2012, 4, 359–361. [Google Scholar] [CrossRef]
  50. Hall, B.G. Building Phylogenetic Trees from Molecular Data with MEGA. Mol. Biol. Evol. 2013, 30, 1229–1235. [Google Scholar] [CrossRef]
  51. Ge, X.J.; Yu, Y.; Yuan, Y.M.; Huang, H.W.; Yan, C. Genetic diversity and geographic differentiation in endangered Ammopiptanthus (Leguminosae) populations in desert regions of northwest China as revealed by ISSR analysis. Ann. Bot. 2005, 95, 843–851. [Google Scholar] [CrossRef]
Figure 1. The magnitude of ∆K as a function of K. The corresponding ∆K value (K = 6) statistics determined the optimal structural allocation for 132 sugar beet varieties.
Plants 13 02954 g001
Figure 2. Population genetic structure of 132 sugar beet varieties at K = 6 based on four bands of SSR, three pairs of InDel, and 20 CEAP markers. At K = 6, the population was divided into six (I, II, III, IV, V, and VI) based on STRUCTURE analysis.
Plants 13 02954 g002
Figure 3. Clustering of 132 sugar beet varieties based on the three markers using UPGMA. The test materials were divided into six categories, distinguished by green, blue, purple, orange, red, and pink colors.
Plants 13 02954 g003
Table 1. Characterization of genetic diversity via amplification using 27 primer pairs (bands) in 132 sugar beet varieties.
NumberPrimersNaNeIHoHeNei’sPIC
127,906108.2522.2060.9850.8820.8790.869
22305136.5852.1150.9300.8510.8480.840
311,965157.0232.3210.8790.8610.8580.847
457,23696.2691.9590.7910.8440.8400.847
5D17179.1262.4200.8140.8940.8900.886
6D31158.0472.3440.8300.8790.8760.871
7D32199.3002.4510.6510.8960.8930.892
8TGAC984.8111.7380.8980.7950.7920.781
9TGAC10117.6402.1860.9310.8730.8690.860
10TCAC261710.5792.5490.9060.9090.9060.907
11TCAC27107.0772.0960.6050.8640.8590.801
12TGAC281511.0352.5150.9540.9130.9090.906
13ACGTG495.4831.8280.2070.8220.8180.781
14GATAA1127.8182.2020.7540.8760.8720.876
15GATAA2114.0011.8060.4870.7530.7500.773
16TGAC2363.5911.4701.0000.7240.7220.682
17TGAC1997.1892.0710.8870.8650.8610.866
18TGAC1896.8332.0150.4180.8600.8540.700
19TGAC1274.0481.5590.8580.7560.7530.737
20TGAC6116.1542.0170.7140.7950.8380.781
21TGAC785.7011.8460.8570.8430.8250.817
22TGAC20118.2202.1930.7800.8830.8780.859
23TGAC21106.4101.9950.9540.8470.8440.831
24TGAC22106.0131.9500.9300.8370.8340.824
25ACGTG1115.4731.9480.9300.8210.8170.808
26ACGTG3106.5932.0070.9020.8520.8480.830
27AAAG2853.1551.3680.2210.6880.6830.639
Total298182.42655.17521.07322.68322.61622.111
Mean116.7572.0440.7800.8400.8380.819
Note: 1–4 are SSR primers; 5–7 are InDel primers; 8–27 are CEAP primers; Na: number of observed alleles; Ne: effective number of alleles; Relevant calculation formulas: I (Shannon information index) = ( P i ) ( l n P i ) ; Ho (observed heterozygosity) = i ( P i ) 2 ; He (expected heterozygosity) = i ( P i ) 2 ( 1 P i ) 2 ; Nei’s (Nei’s diversity index) = 1 ( P i 2 ) / N , N is the number of loci of the population. PIC (polymorphism information content) = 1 i = 1 l P i 2 i = 1 l 1 j = i + 1 l 2 P i 2 P j 2 , where Pi and Pj are the population frequency of the ith and jth.
Table 2. Analysis of molecular variance (AMOVA) results for 6 sugar beet varieties populations.
SourcedfSSMSPV%pEst. VarFstNm
Among populations561.69912.3405%<0.0010.215
Within populations258910.9563.73995%<0.0013.739
Total263972.655 100% 3.9540.057 *4.98
Note: Source: variation. df: degrees of freedom; SS: sum of squares; MS: mean squared; Est. var.: estimates of variance; PV%: percentage of variation; Fst: fixation index; Nm: gene flow (Nm) value. * p < 0.001; Nm = (1 − Fst)/4Fst.
Table 3. Sugar beet (Beta vulgaris L.) varieties (n = 132) used in this study.
NumberVariety NameBreeding CompanyNumberVariety NameBreeding Company
1KWS126KWS SAAT SE67Ma1Maribohilleshög ApS
2KWS127KWS SAAT SE68Ma2Maribohilleshög ApS
3KWS128KWS SAAT SE69Ma3Maribohilleshög ApS
4KWS129KWS SAAT SE70Ma4Maribohilleshög ApS
5KWS130KWS SAAT SE71Ma7Maribohilleshög ApS
6KWS131KWS SAAT SE72Ma8Maribohilleshög ApS
7KWS132KWS SAAT SE73Ma9Maribohilleshög ApS
8KWS133KWS SAAT SE74Ma10Maribohilleshög ApS
9KWS134KWS SAAT SE75Ma11Maribohilleshög ApS
10KWS136KWS SAAT SE76Ma12Maribohilleshög ApS
11KWS137KWS SAAT SE77Ma14Maribohilleshög ApS
12KWS138KWS SAAT SE78Ma15Maribohilleshög ApS
13KWS139KWS SAAT SE79Ma16Maribohilleshög ApS
14KWS140KWS SAAT SE80Ma17Maribohilleshög ApS
15KWS141KWS SAAT SE81Ma18Maribohilleshög ApS
16KWS158KWS SAAT SE82Ma19Maribohilleshög ApS
17KWS0023KWS SAAT SE83Ma20Maribohilleshög ApS
18KWS1130KWS SAAT SE84MA22Maribohilleshög ApS
19KWS1131KWS SAAT SE85MA23Maribohilleshög ApS
20KWS2407KWS SAAT SE8623MH1Maribohilleshög ApS
21KWS2408KWS SAAT SE8723MH2Maribohilleshög ApS
22KWS3473KWS SAAT SE8823MH3Maribohilleshög ApS
23KWS3504KWS SAAT SE8923MH4Maribohilleshög ApS
24KWS3505KWS SAAT SE9023MH6Maribohilleshög ApS
25KWS6637KWS SAAT SE9123MH7Maribohilleshög ApS
26KWS6653KWS SAAT SE9223MH8Maribohilleshög ApS
27KWS7748KWS SAAT SE9323MH9Maribohilleshög ApS
28KWS7772KWS SAAT SE9423MH10Maribohilleshög ApS
29KWS8805KWS SAAT SE95ST12528STRUBE
30KWS9147KWS SAAT SE96ST12655STRUBE
31KWS9898KWS SAAT SE97ST12763STRUBE
32KWS9962KWS SAAT SE98ST12764STRUBE
33SX1535SES VanderHave99ST12816STRUBE
34SX1537SES VanderHave100ST12817STRUBE
35SV2427SES VanderHave101ST12846STRUBE
36SV2538SES VanderHave102ST12908STRUBE
37SV2674SES VanderHave103ST12909STRUBE
38SV2675SES VanderHave104ST13103STRUBE
39SV2676SES VanderHave105ST13112STRUBE
40SV2761SES VanderHave106ST13237STRUBE
41SV2762SES VanderHave107ST13527STRUBE
42SV2763SES VanderHave108ST13528STRUBE
43MK4185SES VanderHave109ST13529STRUBE
44MK4205SES VanderHave110ST13790STRUBE
45MK4241SES VanderHave111ST13832STRUBE
46MK4245SES VanderHave112ST13903STRUBE
47MK4256SES VanderHave113ST13915STRUBE
48MK4257SES VanderHave114ST13943STRUBE
49SR23001SES VanderHave115ST15216STRUBE
50SR230010SES VanderHave116ST15217STRUBE
51SR230011SES VanderHave117L2301Lion Seeds Ltd.
52SR230012SES VanderHave118L2302Lion Seeds Ltd.
53SR230013SES VanderHave119L2305Lion Seeds Ltd.
54SR230015SES VanderHave120L2306Lion Seeds Ltd.
55SR230016SES VanderHave121L2307Lion Seeds Ltd.
56SR230017SES VanderHave122LN001Lion Seeds Ltd.
57SR230018SES VanderHave123LN002Lion Seeds Ltd.
58SR230019SES VanderHave124LN003Lion Seeds Ltd.
59SR23002SES VanderHave125Bts1714BETASEED
60SR230020SES VanderHave126Bts1715BETASEED
61SR23004SES VanderHave127Bts1730BETASEED
62SR23005SES VanderHave128Bts3880BETASEED
63SR23006SES VanderHave129Bts5940BETASEED
64SR23007SES VanderHave130Bts6870BETASEED
65SR23008SES VanderHave131Bts6871BETASEED
66SR23009SES VanderHave132Bts7715BETASEED
Table 4. The primers used in the study.
Primer TypePrimer NamePrimer Sequences (5′-3′)Annealing Temperature
SSR27906F GAGCAGCAAACATGATAAGA57 °C
R GAAAACAGTGAGTATGGGTCTA
2305F TACTAAAACCCTACGAACTCCA55 °C
R TACACCTGTGATTGTCAGAAGA
11965F TTGAGTATTTTCGTCGGC57 °C
R CATCTACATCAGTTTTCCCTTC
57236F TTGGAGAGAGAAAAGAGAGAAG57 °C
R ATCCCTTGACAGTAGAACTCC
InDelD17F GATGGGGGAGATCCCAACTouch down
R GCTTGACCCAGTGCCATC
D31F CGCAGAGTGGTGTGTTGGTouch down
R TGGAGAATGGGTGTGCTG
D32F GGGGGAGAGCAGTGGGTATouch down
R AGCAGAGGAGGTGTGTGTGA
CEAPTGAC9GCAGCTGAGAGTTGACGATouch down
TGAC10GCAGCTGAGAGTTGACGTTouch down
TCAC26GCAGCTGAGGTTGACCAGTouch down
TGAC27GCAGCTGAGGTTGACCTCTouch down
TGAC28GCAGCTGAGGTTGACCGATouch down
ACGTG4GCAGTCAGATCACGTGACTouch down
GATAA1GCAGCTGCGTGGATAAATTouch down
GATAA2GCAGCTCGCTGGATAAAGTouch down
TGAC23GCAGCTGAGGTTGACGACTouch down
TGAC19GCAGCTGAGGTTGACTAGTouch down
TGAC18GCAGCTGAGGTTGACACATouch down
TGAC12GCAGCTGAGAGTTGACGGTouch down
TGAC6GCAGCTGAGAGTTGACTTTouch down
TGAC7GCAGCTGAGAGTTGACTGTouch down
TGAC20GCAGCTGAGGTTGACTCATouch down
TGAC21GCAGCTGAGGTTGACTGTTouch down
TGAC22GCAGCTGAGGTTGACTTCTouch down
ACGTG1GCAGTCAGATCACGTGAATouch down
ACGTG3GCAGTCAGATCACGTGAGTouch down
Disclaimer/Publisher’s Note: The statements, opinions and data contained in all publications are solely those of the individual author(s) and contributor(s) and not of MDPI and/or the editor(s). MDPI and/or the editor(s) disclaim responsibility for any injury to people or property resulting from any ideas, methods, instructions or products referred to in the content.

