Abstract
Plant respiratory burst oxidase homologs (Rbohs) are key enzymes that produce reactive oxygen species (ROS), which serve as signaling molecules regulating plant growth and stress responses. In this study, 39 TaRboh genes (TaRboh01–TaRboh39) were identified. These genes were distributed unevenly among the wheat genome’s fourteen chromosomes, with the exception of homoeologous group 2 and 7 and chromosomes 4A, as well as one unidentified linkage group (Un). TaRbohs were classified into ten distinct clades, each sharing similar motif compositions and gene structures. The promoter regions of TaRbohs contained cis-elements related to hormones, growth and development, and stresses. Furthermore, five TaRboh genes (TaRboh26, TaRboh27, TaRboh31, TaRboh32, and TaRboh34) exhibited strong evolutionary conservation. Additionally, a Ka/Ks analysis confirmed that purifying selection was the predominant force driving the evolution of these genes. Expression profiling and qPCR results further indicated differential expression patterns of TaRboh genes between heat and drought stresses. TaRboh11, TaRboh20, TaRboh22, TaRboh24, TaRboh29, and TaRboh34 were significantly upregulated under multiple stress conditions, whereas TaRboh30 was only elevated in response to drought stress. Collectively, our findings provide a systematic analysis of the wheat Rboh gene family and establish a theoretical framework for our future research on the role of Rboh genes in response to heat and drought stress.
1. Introduction
Respiratory burst oxidase homologs (Rbohs) are known as NADPH oxidases. They are pivotal in ROS production, which is the main source of these reactive molecules in plants [1,2]. Plant Rbohs, homologous to the gp91phox catalytic subunit in mammalian phagocytic cells, are plasma membrane proteins featuring six conserved transmembrane helices, two heme groups, a C-terminal domain with FAD and NADPH, and two N-terminal EF-hand domains for calcium binding [3]. These structural features enable Rbohs to catalyze the production of ROS by using NADPH or NADH as electron donors, leading to the extracellular conversion of O2 into superoxide (O2–), which is then converted into hydrogen peroxide (H2O2) by superoxide dismutase (SOD) [3,4]. The ROS generated by Rbohs act as key signaling molecules, regulating plant growth, development, and stress responses, underscoring the central role of Rbohs in plant regulation [2,3].
The first Rboh family gene in plants, OsRbohA, was identified in Oryza sativa L. in 1996 [1]. Subsequently, a large number of Rboh genes have been identified in different plant species. They included 10 in Arabidopsis thaliana (AtRbohA AtRbohJ) [2], 20 in Nicotiana Tabacum (NtabRbohA NtabRbohT) [5], 9 in rice (OsRbohA OsRbohI) [6], 27 in Gossypium barbadense (GbRboh1 GbRboh27) [7], and 15 in Zea mays (ZmRBOH1 ZmRBOH15) [8]. Rboh genes exhibit diverse tissue-specific transcription levels, providing insights into their roles in plant biology [9]. For example, three of those in Arabidopsis, (AtRbohA, AtRbohG, and AtRbohI) were expressed in roots, two (AtRbohH and AtRbohJ) were specifically expressed in pollen, and another two (AtRbohD and AtRbohF) were expressed in all tissues [2]. For those in rice, all but two (OsRbohD and OsRbohI) of the OsRboh genes were expressed in roots, leaves, shoots, and calli [10]. Additionally, plant Rboh genes are involved in various stress responses, including drought and heat. Overexpression of the AtRbohI gene in Arabidopsis enhanced the drought stress response [11]. AtRbohB and AtRbohD mediated signal transduction under heat stress, with AtRbohD also responded to drought stress [12]. OsRbohA participated in complex signal transduction processes and contributed to plant growth and drought resistance [6]. OsRbohB mediated ROS and ABA signaling in response to drought stress [13]. Knocking down ZmRBOHC reduced the response of maize to drought stress [14]. SlRbohB positively regulated the drought tolerance in tomato [15].
Bread wheat (Triticum aestivum L.) is one of the third-largest cereal crops globally [16]. Recognizing and studying the Rboh gene family in wheat is essential to ensuring food security and increasing productivity, since abiotic stresses restrict plant growth and present significant challenges to the world’s food supply. However, current research on the Rboh gene family in wheat either encounters flaws in the identification process [17] or employs improper selection criteria for Rboh genes [18], leading to improper identification of Rboh members. In this study, we used bioinformatics techniques to identify the Rboh gene family in wheat, determine their chromosomal locations, evolutionary relationships, conserved motifs, structures, cis-elements, collinearity, protein interaction networks, and miRNA targets. Additionally, we analyzed the expression profiles of TaRboh genes under different conditions using RNA-Seq data [19] and validated these profiles with quantitative real-time PCR (qRT-PCR) experiments. Overall, our findings will assist in elucidating the molecular mechanisms of TaRboh genes in responses to drought, heat, and combinations of these stress conditions in wheat.
2. Results
2.1. Genome-Wide Identification, Chromosome Distribution, and Physicochemical Properties of Rboh Gene Family Members in Wheat
Using HMMER 3.0 software and conserved domain identification, 39 TaRboh genes encoding putative proteins with conserved NADPH_Ox, Ferric_reduct, FAD_binding_8, and NAD_binding_6 structural domains were identified using a Hidden Markov Model (HMM)-based approach combined with SMART structural domain validation. Among them, TraesCS1B02G295200 and TraesCS1D02G284900 contained three and four EF-hand motifs, respectively; twenty-eight Rboh proteins had two EF-hand motifs, eight Rboh proteins had only one EF-hand motif, and one Rboh protein (TraesCS3B02G212900) lacked an EF-hand motif (Table S1). Based on their genomic localization in wheat and widely accepted standard of gene nomenclature, the 39 TaRboh genes were designated TaRboh01 to TaRboh39. The TaRboh genes were unevenly distributed across chromosomes 1A, 1B, 1D, 3A, 3B, 3D, 4B, 4D, 5A, 5B, 5D, 6A, 6B, and 6D. Furthermore, most TaRboh genes were located in the terminal regions of the chromosomes, with few in the central regions (Figure 1). Analysis of the physicochemical properties of TaRboh proteins (Table S2) revealed that the predicted Rboh proteins comprised between 800 (TaRboh02) and 1223 (TaRboh04) amino acids, with molecular weights ranging from 90.83 kDa (TaRboh02) to 139.42 kDa (TaRboh02). Their pIs varied from 8.88 (TaRboh09) to 9.47 (TaRboh18), indicating that most of the TaRboh proteins were basic. For the instability index (II), only six Rboh proteins (TaRboh06-TaRboh07, TaRboh12, TaRboh36-TaRboh38) were predicted to be stable, with instability index values below 40. The GRAVY value was less than zero, suggesting that these proteins were hydrophilic. Moreover, subcellular localization prediction revealed that all of these TaRboh proteins were localized to the cell membrane (Table S2).
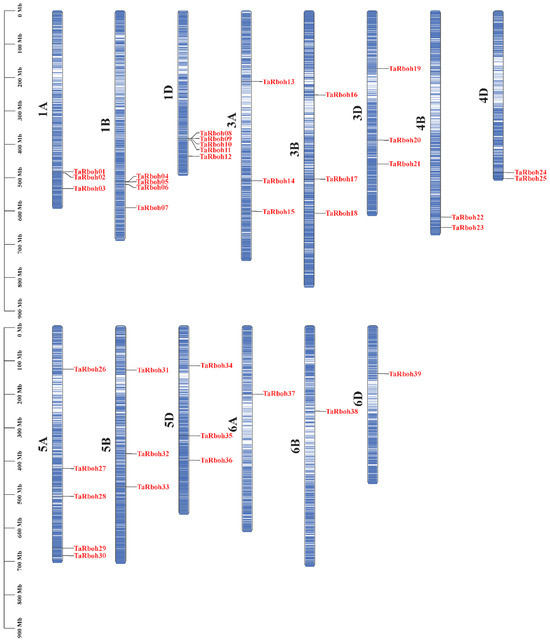
Figure 1.
Locations of 39 TaRboh genes in the wheat genome. The color variation on the chromosomes represents gene density, ranging from low (white) to high (blue).
2.2. Sequence Analysis, Phylogenetic Analysis, and Classification of Rboh Members
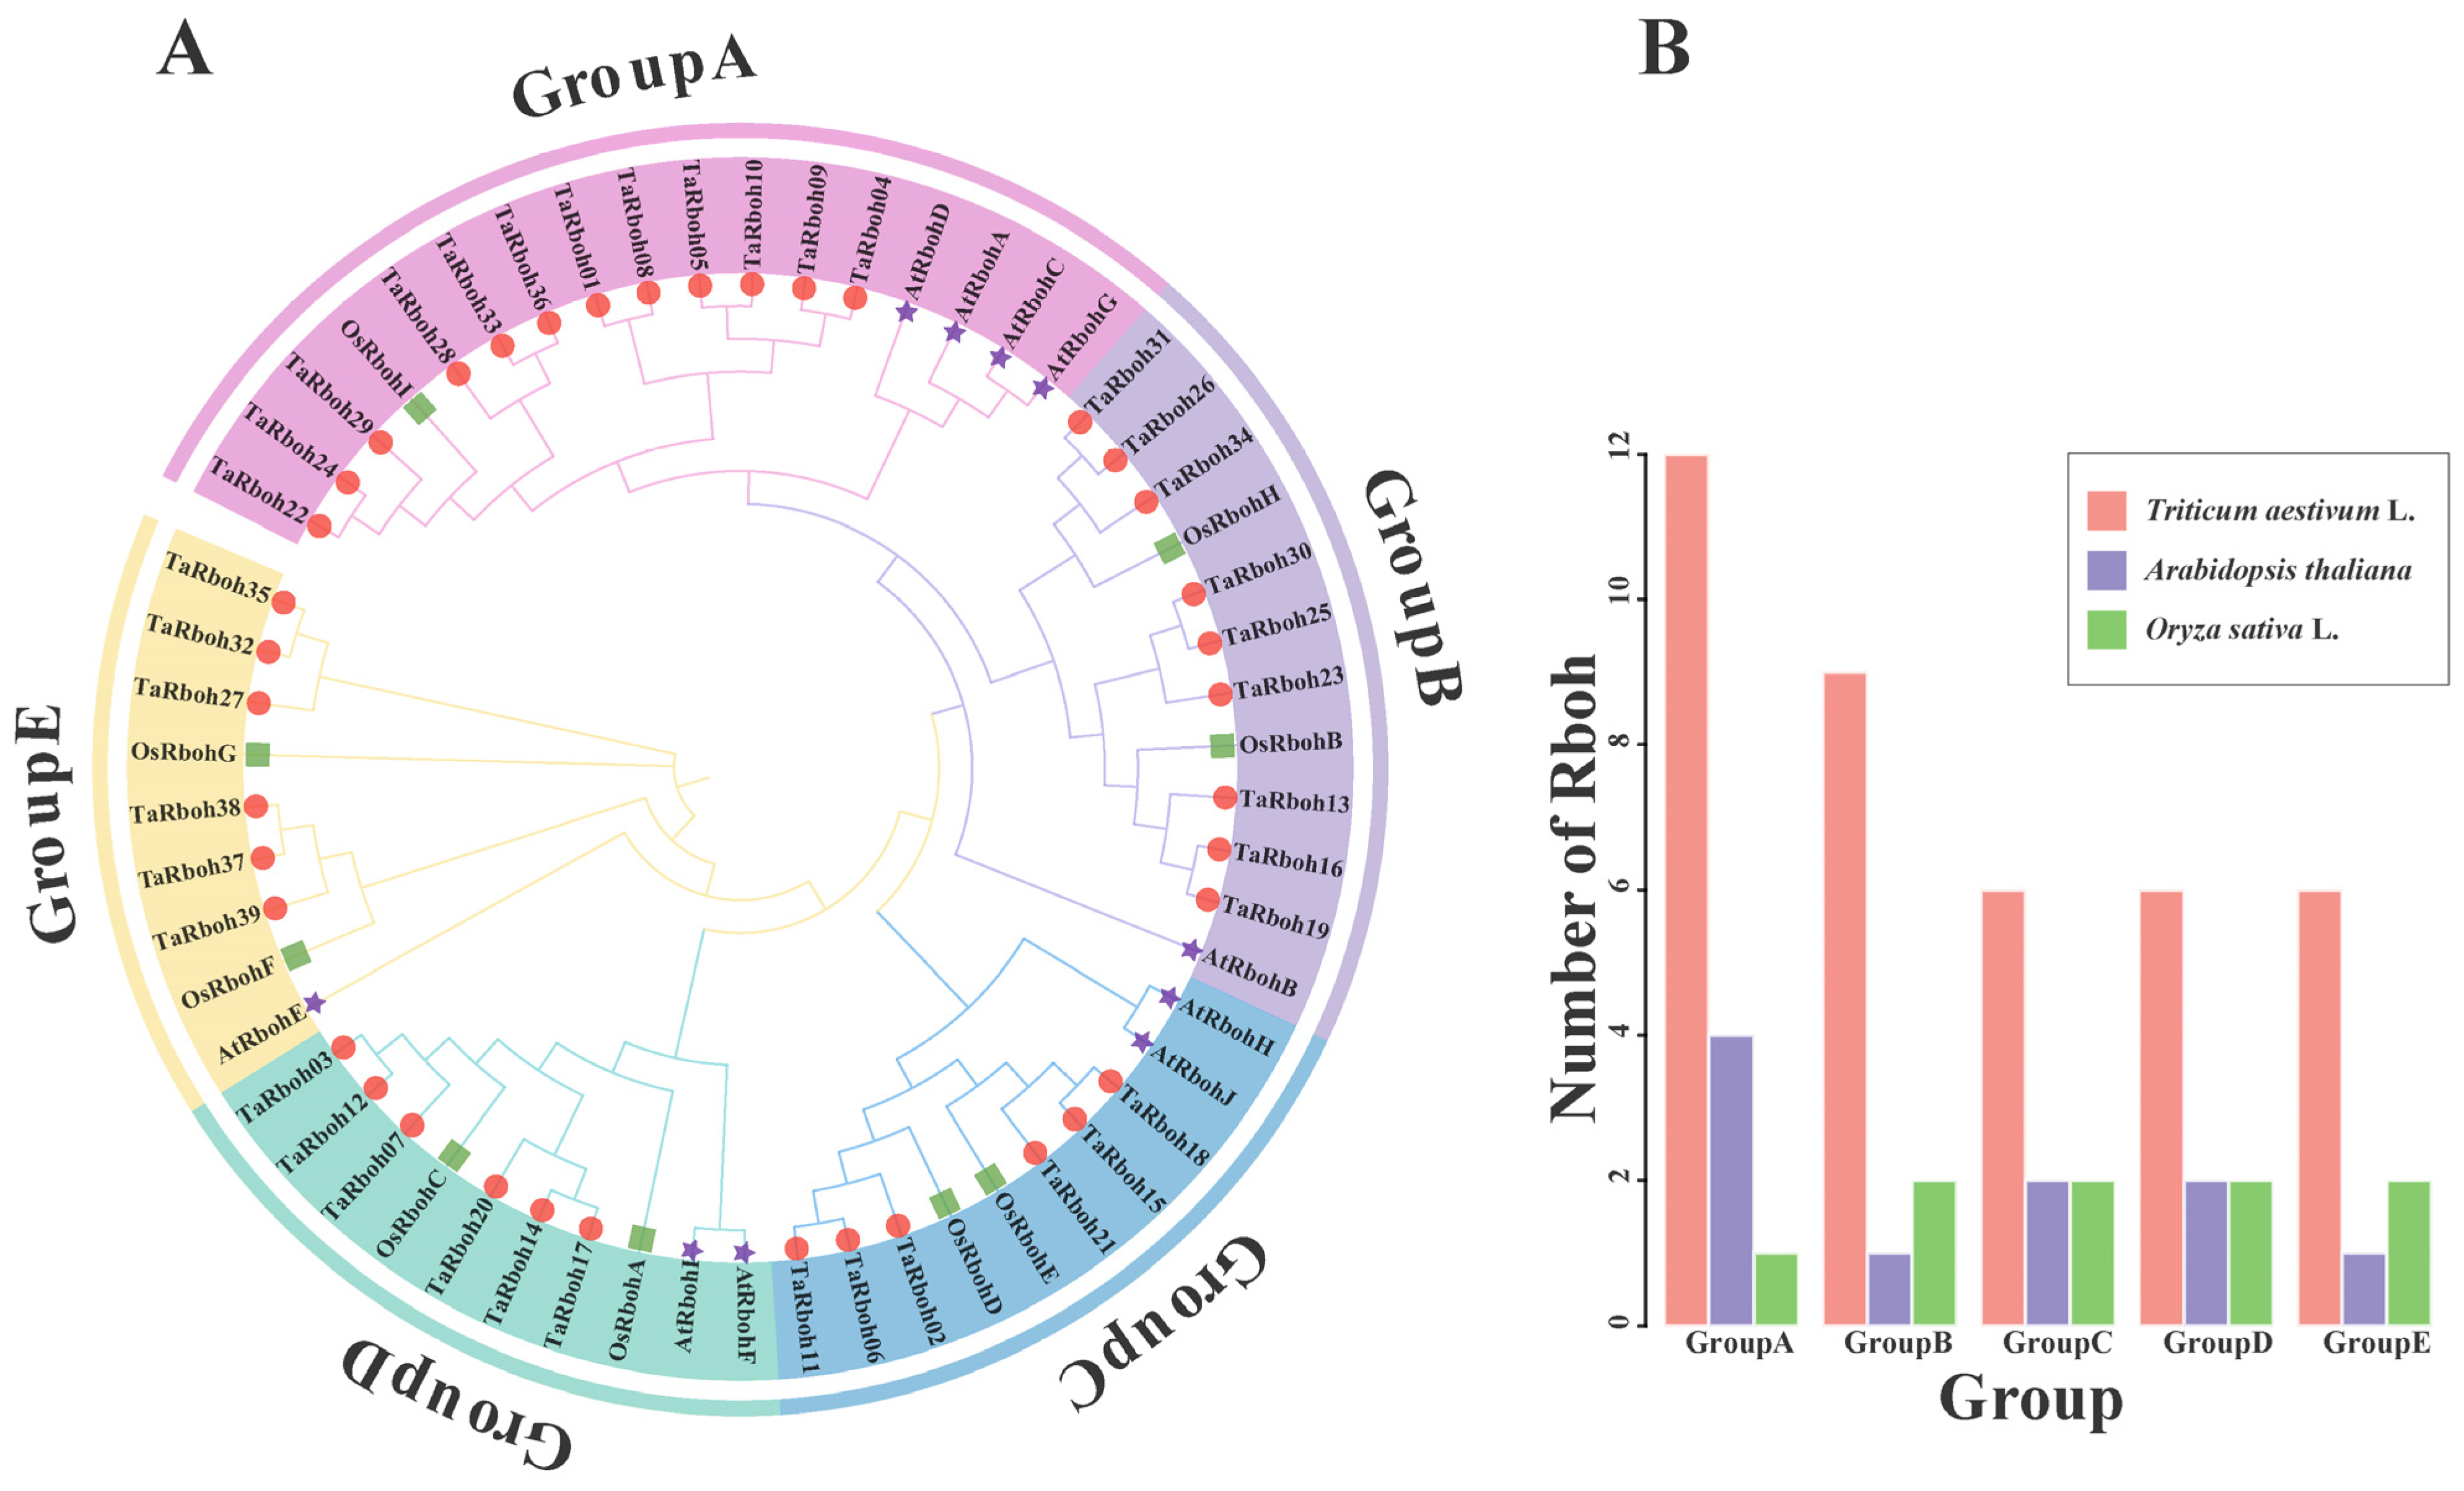
Thirty-nine TaRboh protein sequences from wheat, ten AtRboh protein sequences from Arabidopsis, and nine OsRboh protein sequences from rice were used in a phylogenetic analysis using MEGA 11.0 software to understand the evolutionary relationships of the TaRboh gene family in wheat and other species. As shown in the phylogenetic tree obtained, the TaRbohs were dispersed among the five groups into which the Rbohs were clustered (Figure 2A). Twelve TaRboh proteins were in group A, nine in group B, six in group C, six in group D, and six in group E (Figure 2B). Subsequent investigation showed that the Rboh proteins from rice and wheat were more closely grouped, suggesting a closer genetic relationship between the TaRboh family members between these two species.

Figure 2.
Rboh gene family in wheat, Arabidopsis, and rice. (A) The phylogenetic tree constructed for Rhoh sequences from wheat, Arabidopsis, and rice using MEGA-X based on the neighbor-joining (NJ) method with the p-distance substitution model (gamma = 1) and 1000 bootstrap replicates. The Rboh proteins of wheat are denoted by red circles. The Rboh proteins of rice are denoted by green squares. The Rboh proteins of Arabidopsis are denoted by purple pentagrams. (B) The number of Rboh genes belonging to different groups in wheat, Arabidopsis, and rice, respectively.
2.3. Structure and Conserved Motifs of TaRbohs
To explore the diversity of TaRboh genes, in silico phylogenetic tree construction, gene structure analysis, and motif identification were performed (Figure 3). The 39 TaRboh genes formed 10 groups based on the analysis using MEGA 11.0 software. Groups VI, VII, and X had the most TaRboh gene members (six each), while the other groups contained two or three TaRboh genes each (Figure 3A). Additionally, the gene structure analysis (Figure 3C) revealed that most of the TaRbohs had untranslated regions (UTRs). The exceptions included TaRboh01, 04, 09, 28, and 36. All but three (TaRboh28, 33, and 36) of these TaRbohs possessed introns. TaRboh04 has the highest number of exons (16), while the numbers of exons possessed by other TaRboh genes varied between 1 and 14. As shown in Figure 3B, different groups of TaRboh genes had different motif compositions, but motifs for these genes within the same group are highly preserved. All except Group II genes had 15 motifs. Those in Group II lacked motif 14. According to domain alignment, the NADPH_Ox domain was made up of motifs 13 and 15, the NAD_binding_6 domain was made up of motifs 3, 5, 8, and 9, the Ferric_reduct domain was made up of motifs 2, 7, and 11, and the FAD_binding_8 domain was made up of motifs 1. In general, TaRbohs with the same types and arrangements of motifs were clustered into the same group. Genes on adjacent branches of the phylogenetic tree with similar numbers and arrangements of motifs and gene structures may have similar biological functions.
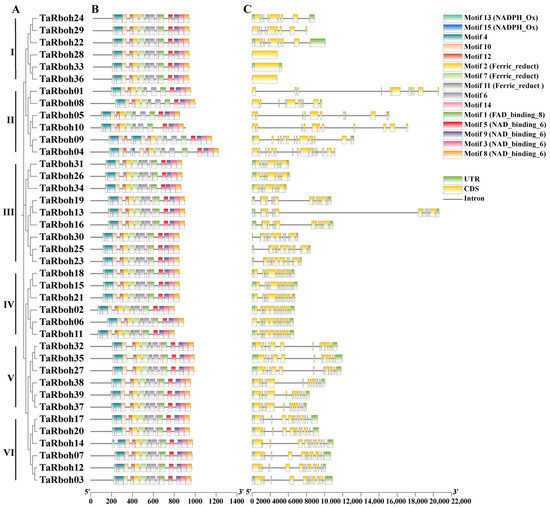
Figure 3.
Evolutionary relationships, conserved motifs, and gene structures of TaRboh genes. (A) Phylogenetic tree of TaRboh genes constructed using MEGA-X with the Maximum Likelihood (ML) method. (B) Conserved motifs in TaRboh proteins, with fifteen distinct motifs identified. (C) Structures of TaRboh genes, where green rectangles represent untranslated regions (UTRs), yellow rectangles denote exons, and short lines indicate introns.
2.4. Cis-Elements in TaRboh Genes
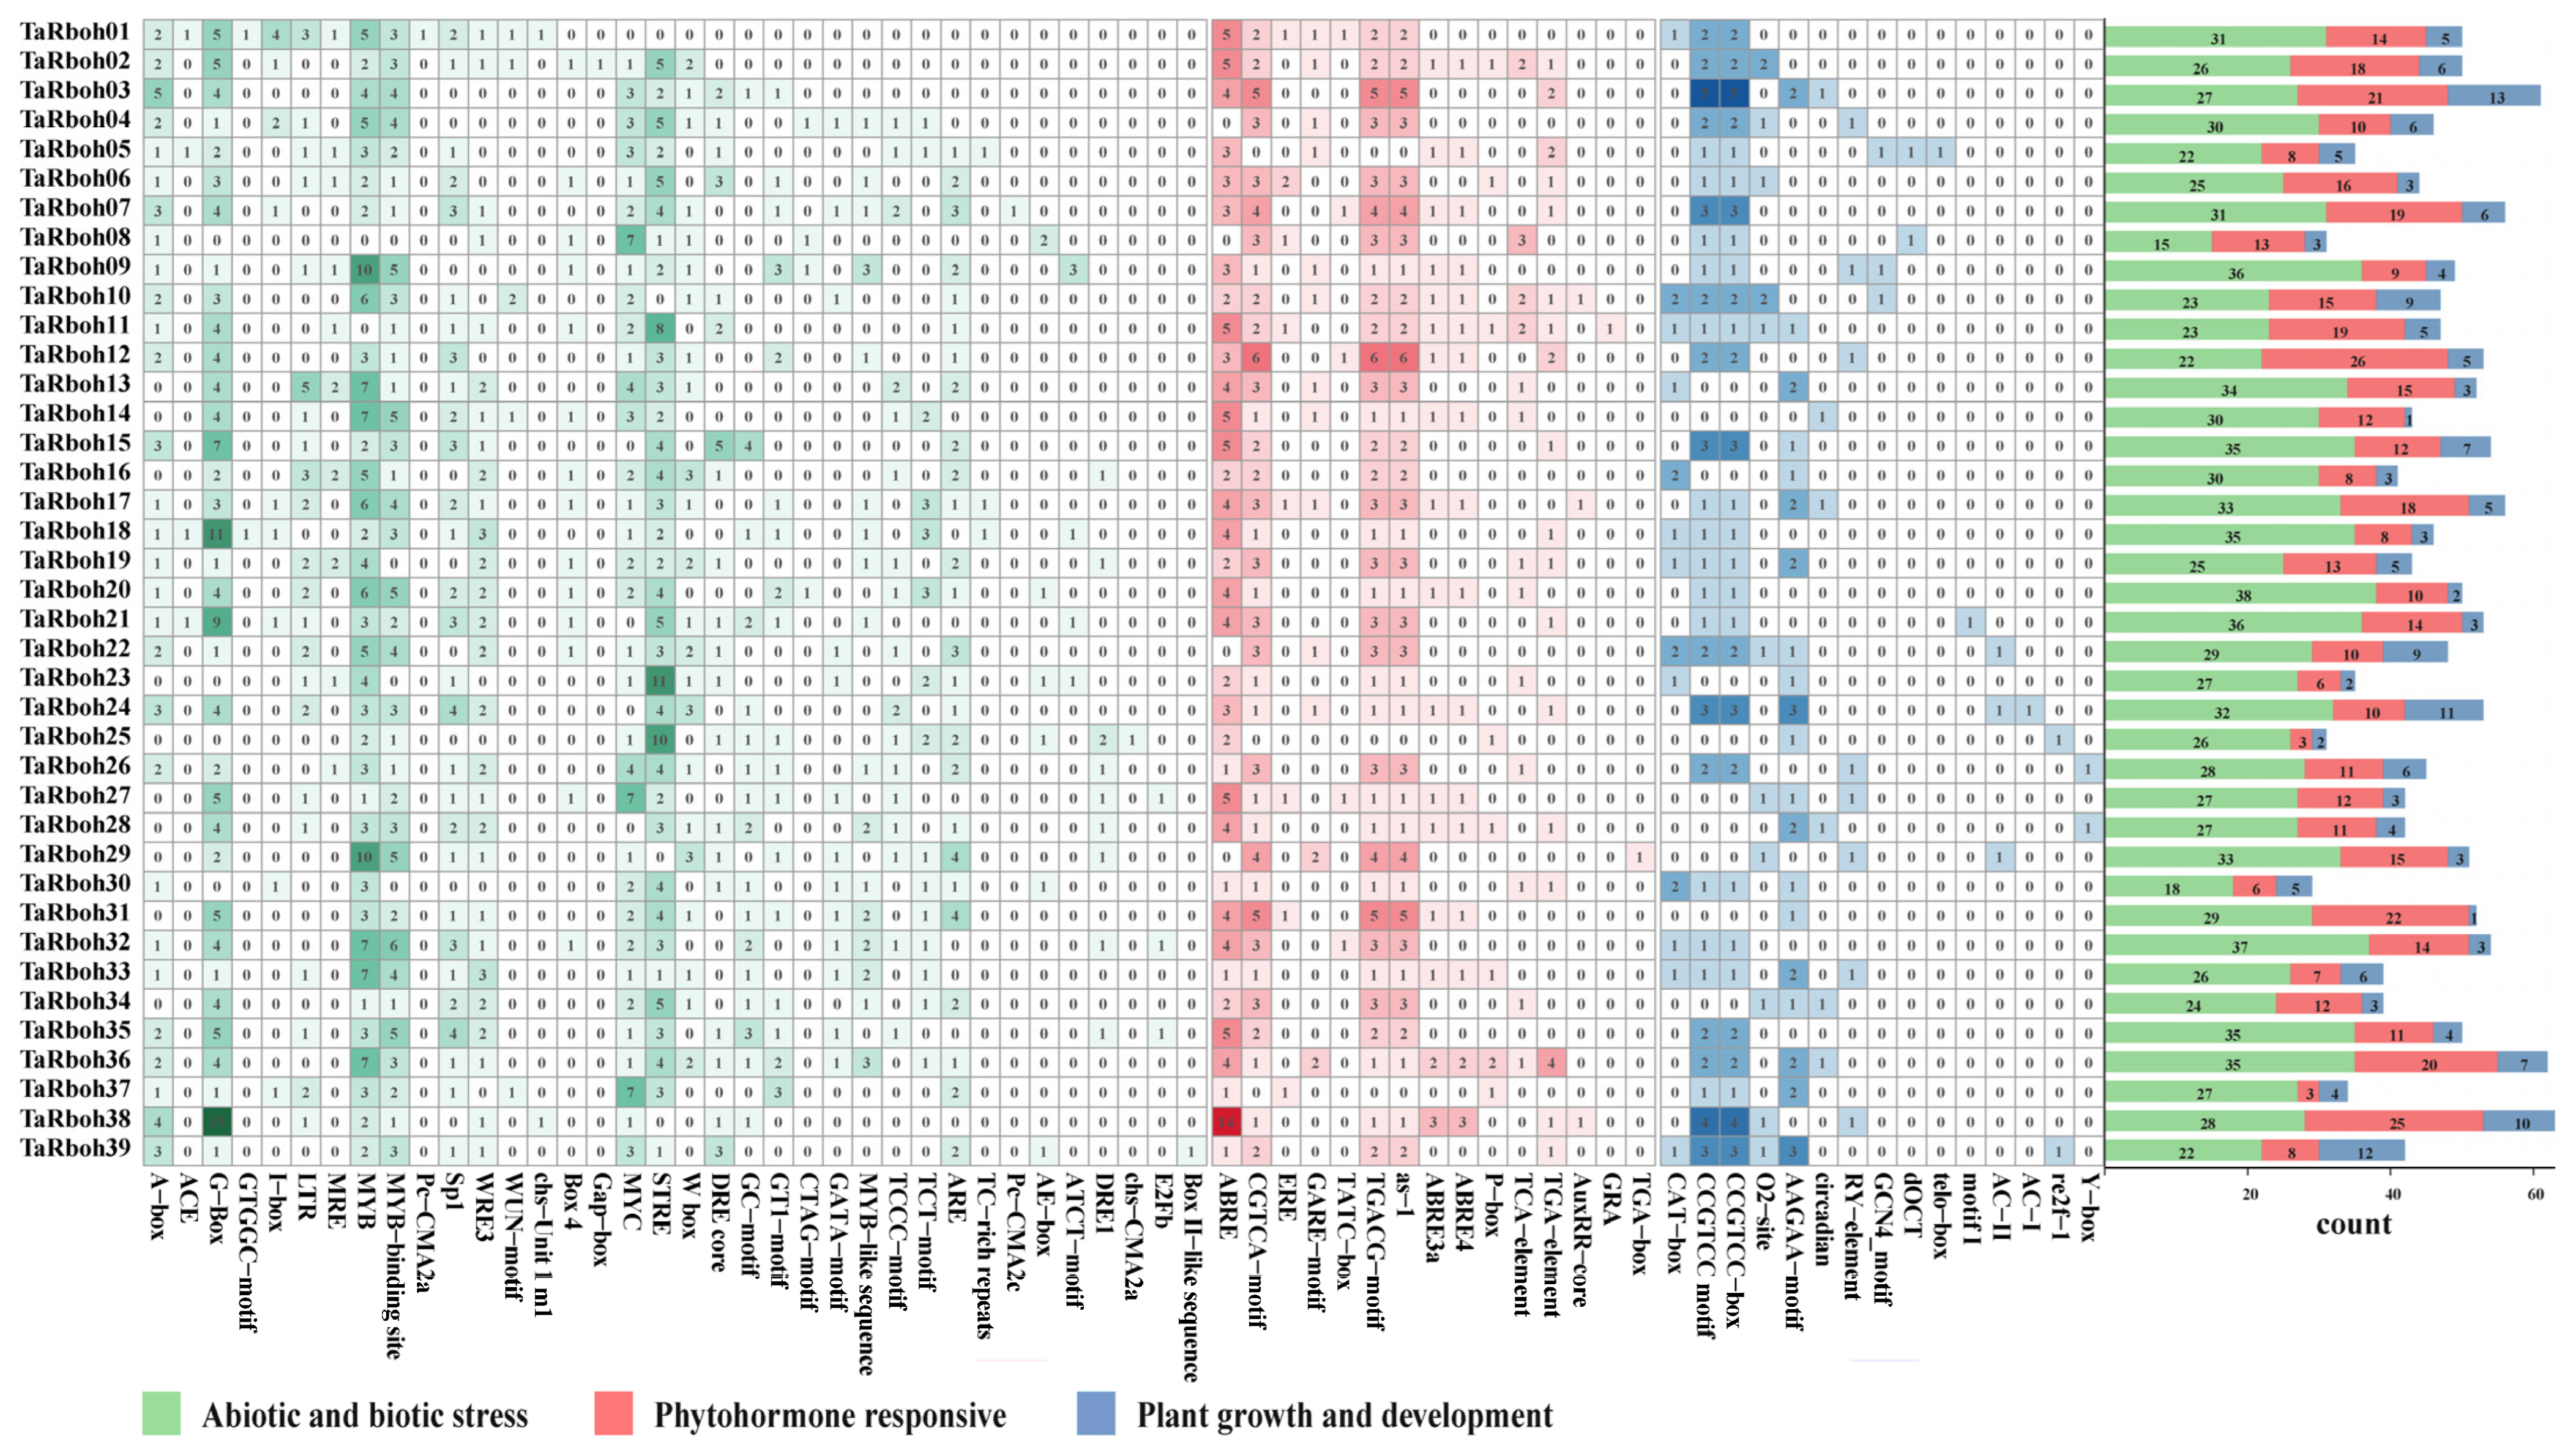
Cis-elements in promoter regions specifically bind to transcription factors, thereby regulating the expression of downstream genes [20]. The cis-elements in the promoters of the TaRboh genes were examined using the PlantCARE website. A total of 3862 cis-elements were found in promoters of the 39 TaRboh genes. They comprised 1192 binding site elements, 197 elements connected to plant growth and development, 504 phytohormone responsive elements, 1117 elements related to abiotic and biotic stressors, and 852 elements without a functional description (Table S3). As shown in Figure 4, the majority of the biotic and abiotic stress elements are linked to wounding (CTAG-motif, TC-rich repeats, WRE3, and WUN-motif), dehydration (DRE/CRT-core and DRE1), elicitor responses (W box), low temperature (LTR), light (A-box, ACE, AE-box, ATCT-motif, Box 4, Box II-like sequence, chs-CMA2a, chs-Unit 1 m1, Gap-box, GATA-motif, G-Box, GT1-motif, GTGGC-motif, I-box, Pc-CMA2a, Pc-CMA2c, Sp1, MRE, TCCC-motif, and TCT-motif), anoxic specific inducibility (GC-motif), anaerobic induction (ARE), replication (E2Fb), stress response (STRE), and drought stress (MYB, MYB-binding site, MYB-like sequence, and MYC). Phytohormone-responsive elements included those responsive to auxin (AuxRR-core, TGA-box, and TGA-element), gibberellin (GARE-motif, P-box, and TATC-box), salicylic acid (as-1 and TCA-element), abscisic acid (ABRE, ABRE3a, and ABRE4), estrogen (ERE), glucocorticoid (GRA), and MeJA (CGTCA-motif and TGACG-motif). Plant growth and development elements are associated with endosperm expression (AAGAA-motif and GCN4_motif), xylem-specific expression (AC-I and AC-II), meristem expression (CAT-box), tissue activation (CCGTCC motif and CCGTCC-box), circadian control (circadian), meristem specific activation (dOCT), root-specific (motif I), zein metabolism (O2-site), cell cycle (re2f-1 and telo-box), seed-specific regulation (RY-element), and DNA regulation (Y-box). Abiotic and biotic stress elements, phytohormone-responsive elements, and plant growth and development elements are the three categories of cis-elements found in the promoters of each TaRboh gene; TaRboh20, TaRboh12, and TaRboh13 had the largest numbers of these elements.
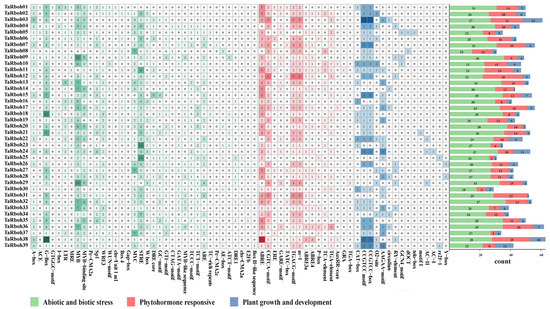
Figure 4.
Distribution of cis-elements in the promoter regions of the TaRboh genes. The color and number of grids represent the quantity of cis-elements in each of the TaRboh genes.
2.5. Collinearity Relationship of the TaRboh Gene Family
Gene tandem repeats and fragment repeats are essential for gene family expansion in plants [21]. Forty-eight pairs of identical TaRboh genes were found using in silico collinearity analysis in wheat; these genes are unevenly distributed on homoeologous group 1, 5, and 6, as well as chromosomes 4B and 4D (Figure 5). Segmental duplications were found in all of the 48 gene pairs using MCScanX. However, tandem duplications were found in none of them. These findings imply that segmental duplications have played a major role in the evolution and diversification of the TaRboh genes. Values of nonsynonymous (Ka) and synonymous (Ks) ratios were computed in order to examine the underlying evolutionary selection pressure on the TaRboh gene family. Ka/Ks ratios for all of the 48 homologous gene pairs were smaller than 1 (Table S4), indicating that strong purifying selection might have been experienced by these genes during the evolutionary process.

Figure 5.
Collinearity analysis of TaRboh genes in wheat. Red lines indicate the segmentally duplicated TaRboh gene pairs in wheat. Gray lines indicate other gene pairs, excluding TaRboh genes. Chromosome lengths (Mb) are marked on the scale bar.
As shown in Figure 6A, estimated divergence times between wheat and the other six species (Brachypodium distachyon, rice, maize, Glycine max, Arabidopsis, and Aegilops tauschii) were 3.54 Mya, 33.0 Mya, 47.0 Mya, 49.1 Mya, 108.0 Mya, and 159.6 Mya, respectively. Based on the phylogenetic tree with wheat as the reference genome, 44 homologous pairs were found between wheat and Aegilops and they included 33 Rboh genes in wheat and 12 genes in Aegilops. From the twelve genes in Aegilops, eleven homologous pairs were identified between Aegilops and Brachypodium and they included six genes in Aegilops and seven in Brachypodium. Furthermore, twelve homologous pairs were identified between the seven genes in Brachypodium and seven genes in rice. Additionally, eleven homologous pairs were identified between seven genes in rice and six genes in maize. Three homologous pairs were identified between two genes in maize and two genes in Glycine. One homologous pair was identified between two genes in Glycine and two genes in Arabidopsis (Figure 6B). Among these, five TaRboh genes (TaRboh26, TaRboh27, TaRboh31, TaRboh32, and TaRboh34) were involved in twenty-four continuous collinear pairs. All of the computed values for these collinear pairs (Table S4) were less than 1.0, consistent with the likelihood that purifying selection is a main drive force during evolution of these genes. Five of these TaRboh genes (TaRboh26, TaRboh27, TaRboh31, TaRboh32, and TaRboh34) also showed strong evolutionary conservation, and they seemed to be important for plant adaptation and evolution.
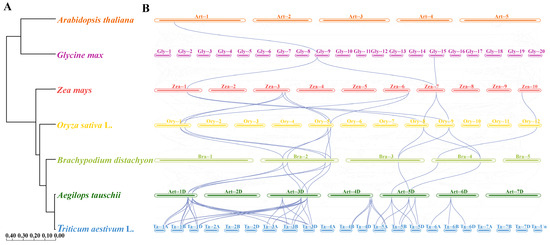
Figure 6.
Synteny analysis of TaRboh genes between wheat and six other plant species (maize, rice, Brachypodium, Glycine, Arabidopsis, and Aegilops) based on the species’ evolutionary tree on the left. (A) Evolutionary relationships among the seven species predicted based on their whole genomes. Node numbers represent the estimated divergence times. (B) Collinearity relationships among the seven plant species based on the TaRboh genes in wheat. Gray lines in the background indicate syntenic blocks between adjacent species, while the blue lines highlight the linked genes identified.
2.6. Protein–Protein Interactions and miRNA Targeting Events in TaRboh Genes
Protein complexes, which include a great deal of protein interaction, are necessary for the majority of life activities in an organism. To comprehend complicated biological processes, it is imperative to identify these interactions [22]. Potential interactions between TaRboh proteins were predicted using the STRING database. While TaRboh19 was found to have no interactions, the 38 TaRboh proteins were found to have 312 interaction pairs altogether. Of the TaRboh proteins, 13 (TaRboh03, TaRboh07, TaRboh12, TaRboh14, TaRboh17, TaRboh20, TaRboh22, TaRboh27, TaRboh32, TaRboh35, TaRboh37, TaRboh38, and TaRboh39) were predicted to be central nodes in the network based on the degree of connectivity within the network. Each of these proteins had 26 connections with other genes (Figure 7A).
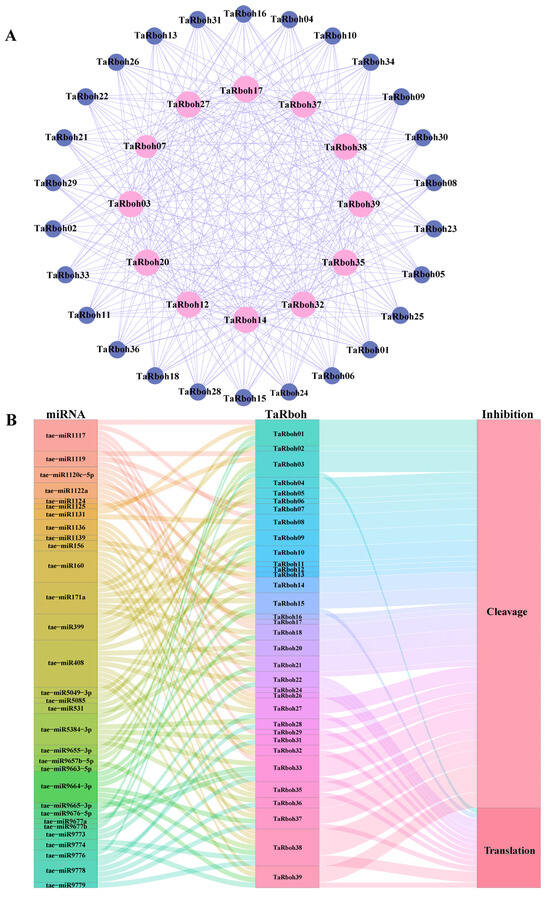
Figure 7.
Protein–protein interaction network and miRNA target analysis of TaRbohs. (A) Red represents 13 TaRboh proteins with a high degree of 26. Blue represents 26 TaRboh proteins with a low degree of 12. (B) Sankey diagram depicting relationships of TaRboh transcripts targeted by miRNAs. The three columns represent miRNA, TaRboh, and the inhibition effect. Different colors are used to distinguish different mirnas, different TaRbohs, and different the inhibition effects.
MicroRNAs (miRNAs) are a class of endogenous, small RNAs with approximately 22 nucleotides in length. Plant miRNAs are important for growth, development, and stress responses. They also take part in post-transcriptional gene regulation [23,24]. The psRNATarget service was utilized to investigate the ways in which miRNAs control TaRboh gene expression. Of the TaRboh genes, 34 were shown to be putative targets of 31 different miRNAs. Tae-miR408 regulated the largest number of TaRboh genes (TaRboh04, TaRboh14, TaRboh20, TaRboh22, TaRboh27, TaRboh35, TaRboh37, TaRboh38, and TaRboh39). Furthermore, TaRboh16 was the primary target (Figure 7B).
2.7. Expression of TaRboh Genes in Different Stress Conditions
Drought and heat stress are the main factors limiting plant growth and reproduction, and they often occur simultaneously [25]. To further investigate the potential role of TaRboh genes, wheat was grown under a variety of stress conditions, including drought stress for one hour (DS-1), drought stress for six hours (DS-1), heat stress for one hour (HS-1), heat stress for six hours (HS-6), combined heat and drought stress for one hour (DHS-1), and combined drought and heat stress for six hours (DHS-6). An analysis of RNA-seq transcriptomic data was performed to evaluate the expression profiles of the TaRboh genes in various stress conditions using the Wheat Expression Browser (expVIP) (www.wheat-expression.com (accessed on 7 December 2023)). This analysis showed the distinct expression of these genes under different stress scenarios (Figure 8A). Compared to those in the controls, three-quarters of the TaRboh genes had higher expression at DS-1 and lower expression at DS-6. Although the expression of 11 TaRboh genes was not significantly altered at HS-1, substantial upregulation for 12 TaRboh genes was detected at DHS-6. Additionally, during drought stress, expressions of some genes (TaRboh14, TaRboh17, and TaRboh20) did not significantly change. However, the expressions of these genes were significantly increased under heat stress and combined heat and drought stress. TaRboh28, TaRboh33, and TaRboh36 showed no significant change under other conditions, but had significantly increased expression under drought stress.
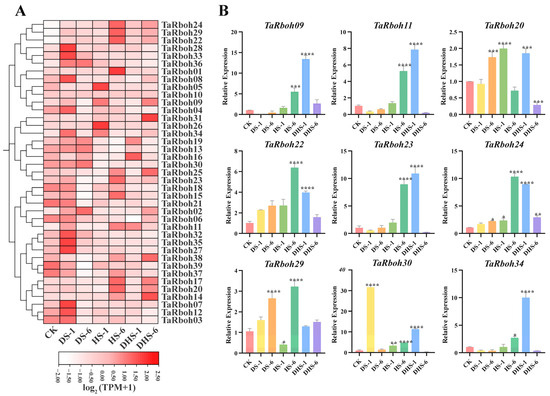
Figure 8.
Expression profiles of TaRboh genes under different stress conditions. (A) Heatmap showing expression of TaRbohs under different treatments. Gene expression is expressed in . Relative expression levels under three different abiotic stress conditions (control (CK), drought stress for 1 h (DS-1), drought stress for 6 h (DS-6), heat stress for 1 h (HS-1), heat stress for 6 h (HS-6), combined drought and heat stress for 1 h (DHS-1), combined drought and heat stress for 6 h (DHS-6)). CK: control. DS-1 (6): drought stress for 1 (6) h; HS-1 (6): heat stress for 1 (6) h; DHS-1 (6): combined drought and heat stress for 1 (6) h. (B) Quantitative expression of nine TaRboh genes in response to abiotic treatments including drought, heat and drought, and heat at 1 h and 6 h following treatments. The error bars indicate the standard deviations and the values in plots corresponding to the mean ± standard deviation (SD) of three independent biological replicates (* p < 0.05; ** p < 0.01; *** p < 0.001; **** p < 0.0001).
To further verify the reliability of the transcriptome data, nine representative members from the thirty-nine TaRboh genes were selected for quantitative real-time PCR (qRT-PCR) experiments. As shown in Figure 8B, nine different gene expression profiles show different degrees of responsiveness to heat, drought, and a combination drought and heat conditions. Among these, six genes (TaRboh09, TaRboh11, TaRboh22, TaRboh24, TaRboh30, and TaRboh34) show expression patterns that align with the RNA-seq findings. Nevertheless, the expression profiles of three genes (TaRboh09, TaRboh23, and TaRboh29) differ from the RNA-seq results. The RNA-seq transcriptome data indicate that TaRboh20 is downregulated at HS-6 compared to the control group, the expression of TaRboh29 at HS-6 is lower than at DHS-6, and TaRboh23 is upregulated at DHS-1 (Figure 8A). In contrast, the qRT-PCR results show that TaRboh20 is upregulated at HS-6, TaRboh23 exhibits a significant increase in expression at DHS-1, and TaRboh29 shows significantly higher expression levels at HS-6 than at DHS-6. These findings suggest that distinct TaRboh genes have distinct patterns of expression in response to heat, drought, and combined heat and drought stress.
3. Discussion
Rboh genes encode Rboh enzymes in plants. These enzymes are essential for generating ROS and controlling plant shape, growth, development, and responses to biotic and abiotic stresses [26]. Rboh genes have been thoroughly investigated in a wide range of plant species. Hu et al. [17] and Sharma et al. have both attempted to identify Rboh family genes in wheat, but their findings are flawed. Hu’s 2018 study reported 46 Rboh genes. However, it did not mandate the presence of all four domains (NADPH_Ox, Ferric_reduct, FAD_binding_8, and NAD_binding_6) for classification as Rboh genes. Furthermore, the wheat genome that was employed in their study is now only marginally relevant due to advances in sequencing technology. Sharma’s recent research in wheat revealed 40 TaRboh genes [18]. With the exception of the extra gene TraesCS1B02G295100 that is included in Sharma’s investigation, all 39 of the TaRboh genes that we found through in silico analysis (Figure 1) are included in his findings. Domain analysis verified the presence of the NADPH_Ox, Ferric_reduct, FAD_binding_8, and NAD_binding_6 domains in the 39 TaRboh proteins that we discovered (Table S1). TraesCS1B02G295100, on the other hand, lacks the NADPH_Ox domain and only has the Ferric_reduct, FAD_binding_8, and NAD_binding_6 domains. The NADPH_Ox domain, located at the EF hand’s N-terminus, is crucial for generating ROS via Ca2+ signaling that is mediated by Rboh proteins [27]. Considering that the NADPH_Ox domain is a crucial component of Rboh genes, TraesCS1B02G295100 most likely functions as a ferric reduction oxidase (FRO) protein as opposed to a Rboh protein [28]. Therefore, we hypothesize that TraesCS1B02G295100 is a FRO gene rather than a TaRboh gene.
Notably, the number of Rboh genes in wheat is significantly higher than those in Arabidopsis (10) [2], rice (9) [6], maize (15) [8], Aquilaria (14) [29], and eggplant (8) [30], yet the number of Rboh genes does not seem to correlate with genome sizes [31]. Additionally, Chromosomes in homoeologous groups have an equal amount of TaRboh genes located in consistent positions on each chromosome. However, the distribution of TaRboh genes is not uniform in homoeologous groups 1 and 4, where certain genes are restricted to specific chromosomes (Figure 1). Whole-genome duplication (WGD) is the most likely explanation for these observations, as it caused the allohexaploid nature (AABBDD) of common wheat. This explains the wheat’s enormous genome size and the increased number of members of the TaRboh gene family, which are frequently seen as three homologous alleles. But as polyploid systems get closer to states that resemble diploid states, gene loss could happen as a result of copy number reduction, pseudogenization, or silencing. Consequently, only particular chromosomes within homologous groups 1 and 4 contain TaRboh homologous genes [32,33,34,35]. Furthermore, collinearity analysis in wheat revealed 48 pairs of identical genes, all of which are segmental duplications (Figure 5). This finding highlights the significance of segmental duplication in the evolution of the TaRboh gene family. Thus, these results suggest that both segmental and whole-genome duplications may play key roles in the evolution and expansion of the TaRboh gene family in wheat.
Rboh protein sequences from wheat, rice, and Arabidopsis were used to create phylogenetic trees. Similarly to those reported earlier [29], the Rboh genes were clustered into five separate groups (Figure 2). Compared with those in Arabidopsis, Rbohs in wheat have closer homologous links with those in rice, indicating that these genes probably share similar structures and functions within the same group of the evolutionary tree. Group D comprises TaRboh03, TaRboh07, TaRboh12, TaRboh14, TaRboh17, and TaRboh20 in wheat, and OsRbohA in rice, which is known for its role in drought resistance [6]. These wheat genes belong to the same group based on phylogenetic, motif, and gene structural analyses (Figure 3). They all have cis-regulatory elements (such as MYB and MYC) that are associated with drought tolerance (Figure 4). Results from the transcriptome analysis indicated that TaRboh03, TaRboh07, TaRboh12, TaRboh14, TaRboh17, and TaRboh20 were related to drought-tolerance. Results from RT-qPCR analysis confirmed that TaRboh20 was upregulated under drought stress (Figure 8). The other five genes also seem to be related to drought stress, although experiments are needed to validate this possibility.
In comparative genomics, homology inference is essential. However, heterozygosity, polyploidy, WGD, and repetitive sequences may limit the effectiveness of approaches based solely on sequence similarity and obscure homologous relationships [36,37]. Compared to other variables, gene content and gene order have been found to be more stable during plant evolution, making collinearity analysis especially valuable for homology inference [38]. It also aids in illuminating ancestral polyploid events [39]. We showed in this study that, although the homologous relationships of several TaRboh genes have gradually diminished, only five TaRboh genes (TaRboh26, TaRboh27, TaRboh31, TaRboh32, and TaRboh34) have maintained homologous relationships throughout evolution (Table S4). This may be attributed to the larger genome of wheat and the increased gene count resulting from WGD, which far exceed those of Arabidopsis, ultimately leading to the loss of most duplicated genes [40]. These findings indicate that TaRboh26, TaRboh27, TaRboh31, TaRboh32, and TaRboh34 are highly conserved throughout evolution and have significant research value. However, further investigation through experiments is needed.
Transcription factors (TFs) and microRNAs (miRNAs) are important regulators of gene expression under stress that lessen the effects of adverse environmental conditions in plants [41]. The position, timing, and degree of gene expression are all determined by cis-elements, which are individual TF-binding sites [42]. MiRNAs attach to target mRNAs at precise locations and cleave them post-transcriptionally to control gene expression and prevent protein translation [43]. As shown in Figure 4, cis-element analyses of TaRboh gene promoters reveal a variety of cis-elements which could be categorized into three functional groups: stress response, hormone response, and developmental regulation. Notably, 61.4% of these elements are associated with biotic and abiotic stress responses. They included DRE core, DRE1, MYB, and MYC elements related to drought stress. Additionally, ABRE, a hormone-responsive element involved in ABA-responsive gene expression, plays a significant role in drought stress response [44]. Therefore, TaRboh genes are likely involved in drought stress responses. Furthermore, we identified 31 distinct miRNAs and predicted interactions between them and the TaRboh genes in wheat (Figure 7B). Tae-miR408 was found to have the most targets among the Rboh genes, and it is known to be involved in regulating heading time, phosphorus deprivation, high salinity, heavy copper stress, and stripe rust stress [45,46,47]. Our results indicate that Tae-miR408 may target TaRboh04, TaRboh14, TaRboh20, TaRboh22, TaRboh27, TaRboh35, TaRboh38, and TaRboh39, which requires experimental validation.
Drought and heat are major abiotic stressors that limit wheat production and often occur together. This multi-stress scenario affects plants in ways that cannot be predicted solely based on the impact of individual stresses [48,49]. Current research indicates that plant Rboh is capable of responding to heat, drought, and combined drought and heat stress. Through the OsRALF45/46-OsMRLK63-OsRbohs signaling circuit, OsMRLK63 (a kinase) controls intracellular ROS levels, hence regulating drought tolerance [50]. The FERONIA Receptor-Like Kinase in tomatoes was used by the BZR1 transcription factor to facilitate ROS signaling from RBOH1 in response to heat stress; the bzr1 mutant downregulated RBOH1 expression, which reduced drought resistance, which could be partially restored by exogenous H2O2 [51]. ERF74 and ERF75 are functionally redundant in Arabidopsis; overexpression of ERF74 increased ROS levels and improved resistance to heat and drought by upregulating RbohD, whereas the erf74 mutant and erf74; erf75 double mutant have decreased stress resistance and RbohD expression [52]. Additionally, hormones such as ABA (abscisic acid) and JA (jasmonic acid) also impact wheat drought resistance [53]. Expression profiling and quantitative data obtained from this study confirmed that TaRboh genes respond to drought, heat, and combined drought and heat stresses to varying degrees. Furthermore, several TaRboh genes that are elevated under single stress (heat or drought) conditions apparently have their increased expression inhibited by the dual stress (heat and drought). For instance, according to transcriptome data and qPCR results, TaRboh22, TaRboh24, and TaRboh29 expression levels were significantly greater at HS-6 than at DHS-1 and DHS-6, and TaRboh30 expression was significantly higher at DS-6 than at DHS-1 and DHS-6 (Figure 8). More experimental research is needed to understand this phenomenon. TaRboh22, a homologue of AtRbohD, was likely involved in responses to various abiotic stresses including drought, heat, and their combination. TaRboh30, with high sequence similarity to OsRbohA, also responds to drought stress. We found it interesting that under different stress circumstances, duplicated genes show comparable expression patterns. Examples of genes that exhibit functional redundancy among these duplicated genes include TaRboh22, TaRboh24, and TaRboh29. They all exhibited increased expression in response to heat, drought, and combined stress. The most notable expression increase occurred at HS-6. In summary, distinct TaRbohs expression patterns were noted. A possible explanation for the discrepancies between the qRT-PCR and RNA-seq results for the three TaRboh genes (TaRboh09, TaRboh23, and TaRboh29) is that we performed the treatment when the wheat reached the three-leaf stage, whereas the reference literature for RNA-seq [19] did not specify the exact timing of the treatment. In the subsequent in-depth study of the functions of these three TaRboh genes (TaRboh09, TaRboh23, and TaRboh29), we will conduct expression analysis on materials at different growth stages and under different stress treatments. The variables impacting the uneven expression patterns of TaRboh genes, such as the location, timing, and length of stress treatment, may be further analyzed by more research. Furthermore, a thorough investigation of the possible mechanisms behind the effects of heat and drought on wheat development is warranted.
4. Materials and Methods
4.1. Plant Materials and Stress Treatments
Wheat seeds (Triticum aestivum L. cv. Fielder) [54] were germinated on moist filter paper at 4 °C for 5 days, followed by 5 days at 12 °C. The seedlings were then transferred to a greenhouse with the setting of light 16 h/22 °C and dark 8 h/16 °C. The plants were grown until the three-leaf stage for stress treatments. The plants were subjected to PEG-induced dehydration mimicking drought stress (25% PEG6000 solutions), heat stress (37 °C incubator), and combined PEG-induced dehydration mimicking drought and heat stress (37 °C incubator and 25% PEG6000 solutions). Samples were collected at 0, 1, and 6 h post-treatment and were used to determine the expression levels of nine selected TaRboh genes under different conditions and time points.
4.2. Bioinfomatics Identification of TaRboh Family Genes in Triticum Aestivum L.
To identify Rboh genes in wheat, a sequence alignment was performed using HMMER 3.0 software (E-value 1.0 × 10⁻¹⁵). The Hidden Markov Model (HMM) profile of the respiratory burst NADPH oxidase domain (PF08414; PF01794; PF08022; PF08030) was queried from the Pfam database (available online: pfam-legacy.xfam.org/ (accessed on 7 Decmeber 2023)). Wheat gene sequences, protein sequences, cDNA files, and gene annotation files were obtained from the Ensembl Plants database (https://plants.ensembl.org/index.html, accessed on 14 November 2023). Protein sequences of candidate Rbohs were further screened using SMART (http://smart.embl-heidelberg.de/, accessed on 7 Decmeber 2023) for domain prediction. Only those sequences containing the NADPH_Ox, Ferric_reduct, FAD_binding_8, and NAD_binding_6 domains were considered to be Rboh genes. Chromosomal localization and visualization of TaRbohs were performed using TBtools V2.136 software [55]. Additionally, the number of amino acids, molecular weight, theoretical pI, instability index, aliphatic index, and grand average of hydropathicity of the TaRboh gene family were obtained from the ExPASy website (http://web.expasy.org/protparam/, accessed on 7 Decmeber 2023) [56]. In silico Subcellular localization was predicted using the Plant-mPLoc website (version 2.0) [57] (http://www.csbio.sjtu.edu.cn/bioinf/plant-multi/, accessed on 7 Decmeber 2023).
4.3. Multiple Alignments and Phylogenetic Tree Analysis
Protein sequences of TaRbohs were aligned using the Clustal X 2.1 tool [58], and the alignments were edited using the ESPrit 2.2-ENDscript 1.0 tool [59]. Arabidopsis and rice sequence data used in this study were obtained from the National Center for Biotechnology Information (NCBI) (http://www.ncbi.nlm.nih.gov). A phylogenetic tree was constructed using the MEGA 11.0 software with the neighbor-joining method, and reliability was confirmed using 1000 replicates of the bootstrap analysis [60]. Additionally, iTOL 6.9 (https://itol.embl.de) [61] was used to visualize the phylogenetic tree.
4.4. Conserved Motif and Gene Structure Analysis of TaRbohs
The MEME server v 5.5.5 (http://meme-suite.org/tools/meme, accessed on 7 Decmeber 2023) [62] and the Gene Structure Display Server (GSDS) website (http://gsds.gao-lab.org/) were used for the analysis of conserved motifs and gene structure of TaRbohs, respectively. For the MEME analysis, the maximum number of motifs was set to 15, with all other parameters set to default.
4.5. Cis-Elements Analysis of TaRboh Genes
To analyze the cis-elements of TaRboh genes, 1.5 kb upstream regions from the transcription start sites of each TaRboh gene were extracted from the wheat gene files. Cis-elements were predicted using PlantCARE website (http://bioinformatics.psb.ugent.be/webtools/plantcare/html/, accessed on 7 Decmeber 2023) [63], and results were visualized using R language.
4.6. Gene Duplication and Collinerity Analysis
Gene duplication events within the wheat genome were analyzed using the Multiple Collinearity Scan toolbox (MCScanX) program [64] with a BLASTp search (e-value < 10−5). Apart from wheat, we have chosen three monocots (Brachypodium, rice, and maize) and three dicots (Glycine, Arabidopsis, and Aegilops) to examine the evolutionary traits of Rboh genes in seven different species. Evolutionary relationships among wheat, Aegilops, Brachypodium, rice, maize, Arabidopsis, and Glycine were investigated using the TimeTree website [65]. Using the wheat genome as the reference, TBtools V2.136 software was employed to identify collinear gene pairs among these species. Gene duplication within species and interspecies gene collinearity relationships were visualized using TBtools V2.136 software. The non-synonymous (Ka) and synonymous (Ks) substitution rates for gene pairs were calculated with KaKs_Calculator 2.0 software [66]. Positive selection is indicated by a Ka/Ks ratio greater than 1, negative selection is shown by a Ka/Ks ratio less than 1, and neutral selection is indicated by a Ka/Ks ratio equal to 1. Divergence times of collinear gene pairs were estimated using the formula Mya, with set to .
4.7. Prediction of Protein–Protein Interactions Network and MicroRNA Targets
The STRING database (version 12.0) [67] (http://string-db.org/, accessed on 26 July 2023) was used to analyze protein–protein interactions among all TaRboh proteins with medium confidence (0.4). The interaction network was then visualized and enhanced using Cytoscape software (version 3.10.1) (http://www.cytoscape.org/) [68]. To predict potential miRNA binding sites for TaRboh genes, TaRboh cDNA sequences were submitted to the psRNATarget website with published miRNAs in wheat using default settings [69].
4.8. Expression Analysis of TaRboh Genes
RNA-seq data for wheat TaRboh genes under different stress conditions (drought, heat, and combined drought and heat) were obtained from the expVIP database [19]. The raw data were processed using transformation and visualized using the ‘HeatMap’ function in TBtools V2.136 software.
4.9. RNA Isolation and Quantitative Real-Time PCR (qRT-PCR)
Total RNA was extracted from plants subjected to drought, heat, and combined drought and heat stress at 1 h and 6 h using the Spin Column Plant Total RNA Purification Kit from Sangon Biotech. The extracted RNA was qualitatively assessed using electrophoresis and a NanoDrop 1000. First-strand cDNA synthesis was performed using NovoScript® Plus All-in-One 1st Strand cDNA Synthesis SuperMix (gDNA Purge). Quantitative real-time PCR (qRT-PCR) was conducted using Hieff® qPCR SYBR Green Master Mix (No Rox), with TaRP15 as the internal reference gene. Nine representative TaRboh genes that strongly responded to heat and drought were validated using qRT-PCR investigation. The primers used for qRT-PCR are listed in Table S5.
4.10. Statistical Analysis
The relative expression levels were calculated from triplicate biological and technical measurements using the method, where . The information was displayed as mean standard error (S.E.). Statistical comparisons were conducted using one-way ANOVA, with differences considered significant at . GraphPad Prism v9.5.0 was employed to visualize the obtained results.
5. Conclusions
Using bioinformatics analysis, 39 TaRboh genes were found in this study based on the most recent wheat genome assembly. The results from phylogenetic study show that TaRbohs were closely related to OsRbohs. TaRbohs were divided into ten groups based on their phylogenetic relationships, structures, and motifs. According to a collinearity analysis, TaRbohs had severe purifying selection during evolution, which led to the loss of certain wheat genes, in contrast to Arabidopsis. An investigation of protein–protein interactions revealed connections between the TaRboh proteins. According to miRNA target predictions, TaRboh gene regulation might be influenced by a number of miRNAs. Furthermore, TaRboh promoter predictions suggested that TaRbohs are important in plant growth and development, responses to biotic and abiotic stressors, and phytohormone signaling. As shown in the expression analysis, TaRbohs responded to heat, drought, and a combination heat and drought conditions, and these results were confirmed in the qPCR analysis. Results presented in this study form a solid foundation for future research into TaRboh-related stress resistance mechanisms in wheat.
Supplementary Materials
The following supporting information can be downloaded at: https://www.mdpi.com/article/10.3390/plants13233377/s1, Table S1: Domains of TaRboh proteins predicted by SMART analysis. Table S2: Physicochemical properties and subcellular localization predictions of TaRboh proteins. Table S3: Function and classification of cis-elements in TaRboh genes. Table S4: Homologous pairs and Ka/Ks value from collinearity analysis. Table S5: The primers of TaRbohs and refrerence gene for the qRT-PCR analysis.
Author Contributions
Conceptualization, X.G. and Y.L.; methodology, M.C.; validation, M.C. and Y.Z.; investigation, X.Z. and H.Y.; visualization, Y.Y. and Z.L.; resources, W.X.; writing—original draft, M.C.; writing—review and editing, Y.Z., S.L., and Y.L.; funding acquisition, X.G., S.L., Y.L., and W.X. All authors have read and agreed to the published version of the manuscript.
Funding
This work was supported by the National Natural Science Foundation of China (32372124, 32300456, 82304652), the China Postdoctoral Science Foundation (2022M721101, 2021M701160, 2023M731065), the Hunan Provincial Department of Science and Technology (2023JJ40132, 2022JJ40051, 2023JJ40199), the Changsha Natural Science Foundation (kq2202149), and the Natural Science Foundation of Chongqing, China (CSTB2023NSCQ-MSX0542, CSTB2023NSCQ-MSX1031, CSTB2022NSCQ-MSX0517, CSTB2022NSCQ-MSX1138).
Data Availability Statement
Data are contained within the article and Supplementary Materials.
Conflicts of Interest
The authors declare no conflicts of interest.
References
- Torres, M.A.; Dangl, J.L. Functions of the Respiratory Burst Oxidase in Biotic Interactions, Abiotic Stress and Development. Curr. Opin. Plant Biol. 2005, 8, 397–403. [Google Scholar] [CrossRef] [PubMed]
- Sagi, M.; Fluhr, R. Production of Reactive Oxygen Species by Plant NADPH Oxidases. Plant Physiol. 2006, 141, 336–340. [Google Scholar] [CrossRef] [PubMed]
- Marino, D.; Dunand, C.; Puppo, A.; Pauly, N. A Burst of Plant NADPH Oxidases. Trends Plant Sci. 2012, 17, 9–15. [Google Scholar] [CrossRef] [PubMed]
- Suzuki, N.; Koussevitzky, S.; Mittler, R.; Miller, G. ROS and Redox Signalling in the Response of Plants to Abiotic Stress. Plant Cell Environ. 2012, 35, 259–270. [Google Scholar] [CrossRef]
- Yu, S.; Kakar, K.U.; Yang, Z.; Nawaz, Z.; Lin, S.; Guo, Y.; Ren, X.-L.; Baloch, A.A.; Han, D. Systematic Study of the Stress-Responsive Rboh Gene Family in Nicotiana Tabacum: Genome-Wide Identification, Evolution and Role in Disease Resistance. Genomics 2020, 112, 1404–1418. [Google Scholar] [CrossRef]
- Wang, G.-F.; Li, W.-Q.; Li, W.-Y.; Wu, G.-L.; Zhou, C.-Y.; Chen, K.-M. Characterization of Rice NADPH Oxidase Genes and Their Expression under Various Environmental Conditions. Int. J. Mol. Sci. 2013, 14, 9440–9458. [Google Scholar] [CrossRef]
- Chang, Y.; Li, B.; Shi, Q.; Geng, R.; Geng, S.; Liu, J.; Zhang, Y.; Cai, Y. Comprehensive Analysis of Respiratory Burst Oxidase Homologs (Rboh) Gene Family and Function of GbRboh5/18 on Verticillium Wilt Resistance in Gossypium Barbadense. Front. Genet. 2020, 11, 788. [Google Scholar] [CrossRef]
- Zhang, H.; Wang, X.; Yan, A.; Deng, J.; Xie, Y.; Liu, S.; Liu, D.; He, L.; Weng, J.; Xu, J. Evolutionary Analysis of Respiratory Burst Oxidase Homolog (RBOH) Genes in Plants and Characterization of ZmRBOHs. Int. J. Mol. Sci. 2023, 24, 3858. [Google Scholar] [CrossRef]
- Chapman, J.M.; Muhlemann, J.K.; Gayomba, S.R.; Muday, G.K. RBOH-Dependent ROS Synthesis and ROS Scavenging by Plant Specialized Metabolites To Modulate Plant Development and Stress Responses. Chem. Res. Toxicol. 2019, 32, 370–396. [Google Scholar] [CrossRef]
- Wong, H.L.; Pinontoan, R.; Hayashi, K.; Tabata, R.; Yaeno, T.; Hasegawa, K.; Kojima, C.; Yoshioka, H.; Iba, K.; Kawasaki, T.; et al. Regulation of Rice NADPH Oxidase by Binding of Rac GTPase to Its N-Terminal Extension. Plant Cell 2008, 19, 4022–4034. [Google Scholar] [CrossRef]
- He, H.; Yan, J.; Yu, X.; Liang, Y.; Fang, L.; Scheller, H.V.; Zhang, A. The NADPH-Oxidase AtRbohI Plays a Positive Role in Drought-Stress Response in Arabidopsis Thaliana. Biochem. Biophys. Res. Commun. 2017, 491, 834–839. [Google Scholar] [CrossRef] [PubMed]
- Rivas, F.J.M.; Fernie, A.R.; Aarabi, F. Roles and Regulation of the RBOHD Enzyme in Initiating ROS-Mediated Systemic Signaling during Biotic and Abiotic Stress. Plant Stress 2024, 11, 100327. [Google Scholar] [CrossRef]
- Shi, Y.; Chang, Y.-L.; Wu, H.-T.; Shalmani, A.; Liu, W.-T.; Li, W.-Q.; Xu, J.-W.; Chen, K.-M. OsRbohB-Mediated ROS Production Plays a Crucial Role in Drought Stress Tolerance of Rice. Plant Cell Rep. 2020, 39, 1767–1784. [Google Scholar] [CrossRef] [PubMed]
- Gao, H.; Cui, J.; Liu, S.; Wang, S.; Lian, Y.; Bai, Y.; Zhu, T.; Wu, H.; Wang, Y.; Yang, S.; et al. Natural Variations of ZmSRO1d Modulate the Trade-off between Drought Resistance and Yield by Affecting ZmRBOHC-Mediated Stomatal ROS Production in Maize. Mol. Plant 2022, 15, 1558–1574. [Google Scholar] [CrossRef] [PubMed]
- Li, X.; Zhang, H.; Tian, L.; Huang, L.; Liu, S.; Li, D.; Song, F. Tomato SlRbohB, a Member of the NADPH Oxidase Family, Is Required for Disease Resistance Against Botrytis Cinerea and Tolerance to Drought Stress. Front. Plant Sci. 2015, 6, 463. [Google Scholar] [CrossRef]
- Guo, S.; Song, J.; Zhang, B.; Jiang, H.; Ma, R.; Yu, M. Genome-Wide Identification and Expression Analysis of Beta-Galactosidase Family Members During Fruit Softening of Peach [Prunus persica (L.) Batsch]. Postharvest Biol. Technol. 2018, 136, 111–123. [Google Scholar] [CrossRef]
- Hu, C.-H.; Wei, X.-Y.; Yuan, B.; Yao, L.-B.; Ma, T.-T.; Zhang, P.-P.; Wang, X.; Wang, P.-Q.; Liu, W.-T.; Li, W.-Q.; et al. Genome-Wide Identification and Functional Analysis of NADPH Oxidase Family Genes in Wheat During Development and Environmental Stress Responses. Front. Plant Sci. 2018, 9, 906. [Google Scholar] [CrossRef]
- Sharma, Y.; Ishu; Shumayla; Dixit, S.; Singh, K.; Upadhyay, S.K. Decoding the Features and Potential Roles of Respiratory Burst Oxidase Homologs in Bread Wheat. Curr. Plant Biol. 2024, 37, 100315. [Google Scholar] [CrossRef]
- Liu, Z.; Xin, M.; Qin, J.; Peng, H.; Ni, Z.; Yao, Y.; Sun, Q. Temporal Transcriptome Profiling Reveals Expression Partitioning of Homeologous Genes Contributing to Heat and Drought Acclimation in Wheat (Triticum aestivum L.). BMC Plant Biol. 2015, 15, 152. [Google Scholar] [CrossRef]
- Priest, H.D.; Filichkin, S.A.; Mockler, T.C. Cis-Regulatory Elements in Plant Cell Signaling. Curr. Opin. Plant Biol. 2009, 12, 643–649. [Google Scholar] [CrossRef]
- Leister, D. Tandem and Segmental Gene Duplication and Recombination in the Evolution of Plant Disease Resistance Genes. Trends Genet. 2004, 20, 116–122. [Google Scholar] [CrossRef] [PubMed]
- De Las Rivas, J.; Fontanillo, C. Protein-Protein Interaction Networks: Unraveling the Wiring of Molecular Machines within the Cell. Brief. Funct. Genom. 2012, 11, 489–496. [Google Scholar] [CrossRef] [PubMed]
- Bartel, D.P. MicroRNAs. Cell 2004, 116, 281–297. [Google Scholar] [CrossRef] [PubMed]
- Chen, X. Small RNAs and Their Roles in Plant Development. Annu. Rev. Cell Dev. Biol. 2009, 25, 21–44. [Google Scholar] [CrossRef] [PubMed]
- Sato, H.; Mizoi, J.; Shinozaki, K.; Yamaguchi-Shinozaki, K. Complex Plant Responses to Drought and Heat Stress Under Climate Change. Plant J. 2024, 117, 1873–1892. [Google Scholar] [CrossRef]
- Kimura, S.; Hunter, K.; Vaahtera, L.; Tran, H.C.; Citterico, M.; Vaattovaara, A.; Rokka, A.; Stolze, S.C.; Harzen, A.; Meißner, L.; et al. CRK2 and C-Terminal Phosphorylation of NADPH Oxidase RBOHD Regulate Reactive Oxygen Species Production in Arabidopsis. Plant Cell 2020, 32, 1063–1080. [Google Scholar] [CrossRef]
- Torres, M.A.; Onouchi, H.; Hamada, S.; Machida, C.; Hammond-Kosack, K.E.; Jones, J.D. Six Arabidopsis Thaliana Homologues of the Human Respiratory Burst Oxidase (Gp91phox). Plant J. 1998, 14, 365–370. [Google Scholar] [CrossRef]
- Chang, Y.-L.; Li, W.-Y.; Miao, H.; Yang, S.-Q.; Li, R.; Wang, X.; Li, W.-Q.; Chen, K.-M. Comprehensive Genomic Analysis and Expression Profiling of the NOX Gene Families Under Abiotic Stresses and Hormones in Plants. Genome Biol. Evol. 2016, 8, 791–810. [Google Scholar] [CrossRef]
- Begum, K.; Das, A.; Ahmed, R.; Akhtar, S.; Kulkarni, R.; Banu, S. Genome-Wide Analysis of Respiratory Burst Oxidase Homolog (Rboh) Genes in Aquilaria Species and Its Association with Agarwood Formation. Front. Plant Sci. 2024, 14, 1326080. [Google Scholar] [CrossRef]
- Du, L.; Jiang, Z.; Zhou, Y.; Shen, L.; He, J.; Xia, X.; Zhang, L.; Yang, X. Genome-Wide Identification and Expression Analysis of Respiratory Burst Oxidase Homolog (RBOH) Gene Family in Eggplant (Solanum melongena L.) under Abiotic and Biotic Stress. Genes 2023, 14, 1665. [Google Scholar] [CrossRef]
- Cheng, C.; Che, Q.; Su, S.; Liu, Y.; Wang, Y.; Xu, X. Genome-Wide Identification and Characterization of Respiratory Burst Oxidase Homolog Genes in Six Rosaceae Species and an Analysis of Their Effects on Adventitious Rooting in Apple. PLoS ONE 2020, 15, e0239705. [Google Scholar] [CrossRef] [PubMed]
- Li, T.; Kong, C.; Deng, P.; Li, C.; Zhao, G.; Li, H.; Gao, L.; Cui, D.; Jia, J. Intra-Varietal Diversity and Its Contribution to Wheat Evolution, Domestication, and Improvement in Wheat. Int. J. Mol. Sci. 2023, 24, 10217. [Google Scholar] [CrossRef] [PubMed]
- Zimin, A.V.; Puiu, D.; Hall, R.; Kingan, S.; Clavijo, B.J.; Salzberg, S.L. The First Near-Complete Assembly of the Hexaploid Bread Wheat Genome, Triticum aestivum. GigaScience 2017, 6, gix097. [Google Scholar] [CrossRef]
- Bottley, A.; Xia, G.M.; Koebner, R.M.D. Homoeologous Gene Silencing in Hexaploid Wheat. Plant J. 2006, 47, 897–906. [Google Scholar] [CrossRef] [PubMed]
- Juery, C.; Concia, L.; De Oliveira, R.; Papon, N.; Ramírez-González, R.; Benhamed, M.; Uauy, C.; Choulet, F.; Paux, E. New Insights into Homoeologous Copy Number Variations in the Hexaploid Wheat Genome. Plant Genome 2021, 14, e20069. [Google Scholar] [CrossRef] [PubMed]
- Fleury, D.; Baumann, U.; Langridge, P. Plant Genome Sequencing. In Plant Biotechnology and Agriculture; Elsevier: Amsterdam, The Netherlands, 2012; pp. 83–97. ISBN 978-0-12-381466-1. [Google Scholar]
- Jung, S.; Jiwan, D.; Cho, I.; Lee, T.; Abbott, A.; Sosinski, B.; Main, D. Synteny of Prunus and Other Model Plant Species. BMC Genom. 2009, 10, 76. [Google Scholar] [CrossRef]
- Bennetzen, J.L. Comparative Sequence Analysis of Plant Nuclear Genomes: Microcolinearity and Its Many Exceptions. Plant Cell 2000, 12, 1021–1029. [Google Scholar] [CrossRef]
- Proost, S.; Fostier, J.; De Witte, D.; Dhoedt, B.; Demeester, P.; Van De Peer, Y.; Vandepoele, K. I-ADHoRe 3.0—Fast and Sensitive Detection of Genomic Homology in Extremely Large Data Sets. Nucleic Acids Res. 2012, 40, e11. [Google Scholar] [CrossRef]
- Panchy, N.; Lehti-Shiu, M.; Shiu, S.-H. Evolution of Gene Duplication in Plants. Plant Physiol. 2016, 171, 2294–2316. [Google Scholar] [CrossRef]
- Rao, S.; Balyan, S.; Jha, S.; Bansal, C.; Das, J.R.; Gupta, A.; Mathur, S. Orchestration of MicroRNAs and Transcription Factors in the Regulation of Plant Abiotic Stress Response. In Plant Stress Biology; Giri, B., Sharma, M.P., Eds.; Springer: Singapore, 2020; pp. 251–277. ISBN 9789811593796. [Google Scholar]
- Vandepoele, K.; Quimbaya, M.; Casneuf, T.; De Veylder, L.; Van De Peer, Y. Unraveling Transcriptional Control in Arabidopsis Using Cis-Regulatory Elements and Coexpression Networks. Plant Physiol. 2009, 150, 535–546. [Google Scholar] [CrossRef]
- Chen, K.; Rajewsky, N. The Evolution of Gene Regulation by Transcription Factors and microRNAs. Nat. Rev. Genet. 2007, 8, 93–103. [Google Scholar] [CrossRef] [PubMed]
- Fujita, Y.; Fujita, M.; Satoh, R.; Maruyama, K.; Parvez, M.M.; Seki, M.; Hiratsu, K.; Ohme-Takagi, M.; Shinozaki, K.; Yamaguchi-Shinozaki, K. AREB1 Is a Transcription Activator of Novel ABRE-Dependent ABA Signaling That Enhances Drought Stress Tolerance in Arabidopsis. Plant Cell 2005, 17, 3470–3488. [Google Scholar] [CrossRef] [PubMed]
- Zhao, X.Y.; Hong, P.; Wu, J.Y.; Chen, X.B.; Ye, X.G.; Pan, Y.Y.; Wang, J.; Zhang, X.S. The Tae-miR408-Mediated Control of TaTOC1 Genes Transcription Is Required for the Regulation of Heading Time in Wheat. Plant Physiol. 2016, 170, 1578–1594. [Google Scholar] [CrossRef] [PubMed]
- Bai, Q.; Wang, X.; Chen, X.; Shi, G.; Liu, Z.; Guo, C.; Xiao, K. Wheat miRNA TaemiR408 Acts as an Essential Mediator in Plant Tolerance to Pi Deprivation and Salt Stress via Modulating Stress-Associated Physiological Processes. Front. Plant Sci. 2018, 9, 499. [Google Scholar] [CrossRef] [PubMed]
- Feng, H.; Zhang, Q.; Wang, Q.; Wang, X.; Liu, J.; Li, M.; Huang, L.; Kang, Z. Target of Tae-miR408, a Chemocyanin-like Protein Gene (TaCLP1), Plays Positive Roles in Wheat Response to High-Salinity, Heavy Cupric Stress and Stripe Rust. Plant Mol. Biol. 2013, 83, 433–443. [Google Scholar] [CrossRef]
- Li, L.; Mao, X.; Wang, J.; Chang, X.; Reynolds, M.; Jing, R. Genetic Dissection of Drought and Heat-responsive Agronomic Traits in Wheat. Plant Cell Environ. 2019, 42, 2540–2553. [Google Scholar] [CrossRef]
- Suzuki, N.; Rivero, R.M.; Shulaev, V.; Blumwald, E.; Mittler, R. Abiotic and Biotic Stress Combinations. New Phytol. 2014, 203, 32–43. [Google Scholar] [CrossRef]
- Jing, X.-Q.; Shi, P.-T.; Zhang, R.; Zhou, M.-R.; Shalmani, A.; Wang, G.-F.; Liu, W.-T.; Li, W.-Q.; Chen, K.-M. Rice Kinase OsMRLK63 Contributes to Drought Tolerance by Regulating Reactive Oxygen Species Production. Plant Physiol. 2024, 194, 2679–2696. [Google Scholar] [CrossRef]
- Yin, Y.; Qin, K.; Song, X.; Zhang, Q.; Zhou, Y.; Xia, X.; Yu, J. BZR1 Transcription Factor Regulates Heat Stress Tolerance Through FERONIA Receptor-Like Kinase-Mediated Reactive Oxygen Species Signaling in Tomato. Plant Cell Physiol. 2018, 59, 2239–2254. [Google Scholar] [CrossRef]
- Yao, Y.; He, R.J.; Xie, Q.L.; Zhao, X.H.; Deng, X.M.; He, J.B.; Song, L.; He, J.; Marchant, A.; Chen, X.; et al. ETHYLENE RESPONSE FACTOR 74 ( ERF74 ) Plays an Essential Role in Controlling a Respiratory Burst Oxidase Homolog D (RbohD)-dependent Mechanism in Response to Different Stresses in Arabidopsis. New Phytol. 2017, 213, 1667–1681. [Google Scholar] [CrossRef]
- Wang, X.; Li, Q.; Xie, J.; Huang, M.; Cai, J.; Zhou, Q.; Dai, T.; Jiang, D. Abscisic Acid and Jasmonic Acid Are Involved in Drought Priming-Induced Tolerance to Drought in Wheat. Crop J. 2021, 9, 120–132. [Google Scholar] [CrossRef]
- Li, Y.; Li, Y.; Zou, X.; Jiang, S.; Cao, M.; Chen, F.; Yin, Y.; Xiao, W.; Liu, S.; Guo, X. Bioinformatic Identification and Expression Analyses of the MAPK–MAP4K Gene Family Reveal a Putative Functional MAP4K10-MAP3K7/8-MAP2K1/11-MAPK3/6 Cascade in Wheat (Triticum aestivum L.). Plants 2024, 13, 941. [Google Scholar] [CrossRef] [PubMed]
- Chen, C.; Chen, H.; Zhang, Y.; Thomas, H.R.; Frank, M.H.; He, Y.; Xia, R. TBtools: An Integrative Toolkit Developed for Interactive Analyses of Big Biological Data. Mol. Plant 2020, 13, 1194–1202. [Google Scholar] [CrossRef] [PubMed]
- Artimo, P.; Jonnalagedda, M.; Arnold, K.; Baratin, D.; Csardi, G.; De Castro, E.; Duvaud, S.; Flegel, V.; Fortier, A.; Gasteiger, E.; et al. ExPASy: SIB Bioinformatics Resource Portal. Nucleic Acids Res. 2012, 40, W597–W603. [Google Scholar] [CrossRef]
- Chou, K.-C.; Shen, H.-B. Plant-mPLoc: A Top-Down Strategy to Augment the Power for Predicting Plant Protein Subcellular Localization. PLoS ONE 2010, 5, e11335. [Google Scholar] [CrossRef]
- Thompson, J.D.; Gibson, T.J.; Higgins, D.G. Multiple Sequence Alignment Using ClustalW and ClustalX. Curr. Protoc. Bioinform. 2003, 002. [Google Scholar] [CrossRef]
- Robert, X.; Gouet, P. Deciphering Key Features in Protein Structures with the New ENDscript Server. Nucleic Acids Res. 2014, 42, W320–W324. [Google Scholar] [CrossRef]
- Kumar, S.; Stecher, G.; Tamura, K. MEGA7: Molecular Evolutionary Genetics Analysis Version 7.0 for Bigger Datasets. Mol. Biol. Evol. 2016, 33, 1870–1874. [Google Scholar] [CrossRef]
- Ciccarelli, F.D.; Doerks, T.; Von Mering, C.; Creevey, C.J.; Snel, B.; Bork, P. Toward Automatic Reconstruction of a Highly Resolved Tree of Life. Science 2006, 311, 1283–1287. [Google Scholar] [CrossRef]
- Bailey, T.L.; Williams, N.; Misleh, C.; Li, W.W. MEME: Discovering and Analyzing DNA and Protein Sequence Motifs. Nucleic Acids Res. 2006, 34, W369–W373. [Google Scholar] [CrossRef]
- Lescot, M. PlantCARE, a Database of Plant Cis-Acting Regulatory Elements and a Portal to Tools for in Silico Analysis of Promoter Sequences. Nucleic Acids Res. 2002, 30, 325–327. [Google Scholar] [CrossRef] [PubMed]
- Wang, Y.; Tang, H.; DeBarry, J.D.; Tan, X.; Li, J.; Wang, X.; Lee, T.-h.; Jin, H.; Marler, B.; Guo, H.; et al. MCScanX: A Toolkit for Detection and Evolutionary Analysis of Gene Synteny and Collinearity. Nucleic Acids Res. 2012, 40, e49. [Google Scholar] [CrossRef] [PubMed]
- Kumar, S.; Suleski, M.; Craig, J.M.; Kasprowicz, A.E.; Sanderford, M.; Li, M.; Stecher, G.; Hedges, S.B. TimeTree 5: An Expanded Resource for Species Divergence Times. Mol. Biol. Evol. 2022, 39, msac174. [Google Scholar] [CrossRef] [PubMed]
- Wang, D.; Zhang, Y.; Zhang, Z.; Zhu, J.; Yu, J. KaKs_Calculator 2.0: A Toolkit Incorporating Gamma-Series Methods and Sliding Window Strategies. Genom. Proteom. Bioinform. 2010, 8, 77–80. [Google Scholar] [CrossRef] [PubMed]
- Szklarczyk, D.; Gable, A.L.; Nastou, K.C.; Lyon, D.; Kirsch, R.; Pyysalo, S.; Doncheva, N.T.; Legeay, M.; Fang, T.; Bork, P.; et al. The STRING Database in 2021: Customizable Protein–Protein Networks, and Functional Characterization of User-Uploaded Gene/Measurement Sets. Nucleic Acids Res. 2021, 49, D605–D612. [Google Scholar] [CrossRef]
- Shannon, P.; Markiel, A.; Ozier, O.; Baliga, N.S.; Wang, J.T.; Ramage, D.; Amin, N.; Schwikowski, B.; Ideker, T. Cytoscape: A Software Environment for Integrated Models of Biomolecular Interaction Networks. Genome Res. 2003, 13, 2498–2504. [Google Scholar] [CrossRef]
- Dai, X.; Zhuang, Z.; Zhao, P.X. psRNATarget: A Plant Small RNA Target Analysis Server (2017 Release). Nucleic Acids Res. 2018, 46, W49–W54. [Google Scholar] [CrossRef]


Disclaimer/Publisher’s Note: The statements, opinions and data contained in all publications are solely those of the individual author(s) and contributor(s) and not of MDPI and/or the editor(s). MDPI and/or the editor(s) disclaim responsibility for any injury to people or property resulting from any ideas, methods, instructions or products referred to in the content. |
© 2024 by the authors. Licensee MDPI, Basel, Switzerland. This article is an open access article distributed under the terms and conditions of the Creative Commons Attribution (CC BY) license (https://creativecommons.org/licenses/by/4.0/).