Article

Photosynthetic Responses of Racomitrium japonicum L. to Strontium Stress Evaluated through Chlorophyll a Fluorescence OJIP Transient Analysis

1
School of Life Science and Engineering, Southwest University of Science and Technology, Mianyang 621010, China
2
College of Biological Engineering, Jingchu University of Technology, Jingmen 448000, China
3
Ecological Protection and Development Research Institute of Aba Tibetan and Qiang Autonomous Prefecture, Aba 623000, China
4
Administration Bureau of Jiuzhaigou National Nature Reserve, Jiuzhaigou 623402, China
5
Engineering Research Center of Biomass Materials, Ministry of Education, Southwest University of Science and Technology, Mianyang 621010, China
*
Authors to whom correspondence should be addressed.
These authors contributed equally to this work.
Plants 2024, 13(5), 591; https://doi.org/10.3390/plants13050591
Submission received: 1 January 2024 / Revised: 8 February 2024 / Accepted: 19 February 2024 / Published: 22 February 2024

Abstract

:
Nuclides pollution and its biological effects are of great concern, especially for bryophytes during their terrestrial adaptation. Understanding PSII activity and electron transport response is vital for comprehending moss abiotic stress reactions. However, little is known about the photosynthetic performance of moss under nuclide treatment. Therefore, this study aimed to evaluate the chlorophyll fluorescence of Racomitrium japonicum L. The moss was subjected to Sr2+ solutions at concentrations of 5, 50, and 500 mg/L to evaluate chlorophyll a fluorescence using the OJIP test. Moderate and high Sr2+ stress led to inner cell membrane dissolution and reduced chlorophyll content, indicating impaired light energy absorption. At 5 mg/L Sr2+, fluorescence kinetics showed increased light energy capture, energy dissipation, and total photosynthetic driving force, thus stimulating transient photosynthetic activity of PSII and improving PSI reduction. Linear electron transfer and PSII stability significantly decreased under moderate and high Sr2+ stress, indicating potential photosynthetic center damage. Cyclic electron transfer (CEF) alleviated photosynthetic stress at 5 mg/L Sr2+. Thus, low Sr2+ levels stimulated CEF, adjusting energy flux and partitioning to protect the photosynthetic apparatus. Nevertheless, significant damage occurred due to inefficient protection under high Sr2+ stress.

1. Introduction

Environmental factors such as light, water, and heavy metals play a crucial role in influencing plant growth. Stress can arise from either the absence or excess of these factors [1,2]. Among the cellular functions, chloroplast photosynthetic activity is the most sensitive function. Therefore, investigating plant photosynthesis under stressful conditions is an important research avenue [3,4]. Recently, it has been observed that when plants grow in soils with excessive metal ion content, they experience a significant inhibition of O2 evolution, CO2 fixation, and phosphorylation capabilities [5].
High temperatures affect photosynthetic membranes, leading to grana stacking loss owing to the dissociation of the peripheral antenna complex of photosystem II (PSII) from its core complex. This results in reduced energy connectivity within the unit and destabilization of the PSII structure, posing a threat to overall PSII photosynthetic activity [4,6,7]. In addition to temperature and pressure, the deactivation of photoreaction centers is associated with environmental metal ion toxicity. Studies on the photosynthetic performance of Chlorella pyrenoidosa have shown that high copper (Cu) concentrations significantly inhibit photosynthesis and respiration. The absorption flux (ABS/RC) at each PSII reaction center increases with increasing Cu concentration. In contrast, the electron transport flux (ET0/RC) decreases. The decline in efficiency, with which a trapped exciton can move an electron into the electron transport chain further than QA0), the maximal quantum yield of primary photochemistry (ϕP0), and the quantum yield of electron transport (ϕE0) were also observed [8]. These findings highlight the significant impact of abiotic environmental factors on electron transport during photosynthesis and various enzyme systems [9]. Similar to heavy metal pressure, radioactive strontium (90 Sr) is released into the environment through reactions such as nuclear fission [10,11], causing environmental pollution after settling in the form of atmospheric, water, and soil cycles [12]. According to a survey, compared with the strontium concentration in nature (160 mg/g), the soil Sr reached 247 mg kg to form a stable pollution [13,14]. The content of strontium in the soil is therefore typically higher than that of Ni, Cu, or Zn [15], and a large amount of Sr accumulation has been observed in some plants exposed to water culture, such as cabbage, lettuce, etc. [16]. Accumulation of millimolar amounts of stable Sr induces chemotoxic effects and damage in several plants; it affects plant’s development, photosynthesis, metabolism, and genetics, especially photosynthetic factors, which are very sensitive to environmental changes, so environmental pollutant strontium (Sr) also influences photosynthetic responses [12,17,18].
Among the earliest plant types, Bryophytes exhibit more sensitivity and resilience in their response to environmental changes and survival under adverse conditions [19]. Hence, exploring the photosynthetic response of bryophytes to Sr is highly significant as a fluorescent probe for environmental changes.
Over the past two decades, in vivo fast chlorophyll a fluorescence rise kinetics (OJIP) and JIP test analysis have been extensively employed to monitor alterations in the photosynthetic apparatus under different stress conditions. This technique is susceptible to environmental changes, offering nondestructive, precise, and rapid characteristics [20,21,22]. It is a potent tool effectively employed to assess photosynthesis in various plants via non-invasive methods [23]. Photosynthetic materials containing oxygen exhibit a fluorescence uptick within the 1st second of illumination after each stress treatment, followed by a distinctive fluorescence increase in the shape of the OJIP curve [24]. The rapid chlorophyll fluorescence rise kinetics typically exhibits a sequence of phases from the initial (FO) to the maximal (FM) fluorescence value, labeled step O (20 µs), J (≈2 ms), I (≈30 ms), and P (≈300 ms) [25]. These stages align with the redox states of photosystems PSII and PSI, reflecting the efficiency of electron transfer through the system to the terminal electron acceptor on the PSI acceptor side [26].
Besides the basic OJIP steps, additional phases may emerge under specific conditions, such as the L-step (reflecting the energetic connectivity of the PSII units), K-step (associated with the inactivation of the oxygen-evolving complex, OEC), or H- and G-steps observed in corals and foraminifers [22,27]. However, the positions of these steps are not permanently fixed in the typical curve. They might shift toward shorter or longer times in response to different stress conditions [28]. Several researchers have consistently highlighted that measuring OJIP transients serves as a sensitive and reliable method for detecting and quantifying environmental changes in PSII and PSI of plants [29,30]. We performed a widely used chlorophyll a (Chl a) fluorescence kinetic analysis on dark-adapted leaf samples in numerous data comparisons. Various parameters were calculated to characterize the steady state of the photosynthetic apparatus, thereby validating the reliability of the fluorescence analysis [31]. For example, alterations in OJIP transients induced by high temperatures have been employed to assess heat tolerance in common bean cultivars, apple leaves, and peels [32,33]. Furthermore, the diverse effects of chromate on the photosynthetic organs of Spirulina can also be evaluated by OJIP transients [34]. However, in bryophytes, it is unclear whether the OJIP transient can be used as a stress indicator and how photosynthetic physiological responses change under nuclide stress. Therefore, this study aimed to evaluate the chlorophyll a fluorescence of R. japonicum L.

2. Results

2.1. Effects of Sr2+ on Cell and Chlorophyll a Contents in R. japonicum

The moss phenotypes exhibited variability after treatment with three strontium concentrations. To investigate these effects at the cellular level, we employed frozen section technology to observe moss stem tips using a 20× optical fluorescence microscope. Figure 1 illustrates the progressive deterioration of moss cell lumens with increasing strontium concentration. At 500 mg/L strontium, considerable damage occurred, characterized by blurred cell borders and abnormal inclusions. Conversely, a concentration of 5 mg/L Sr2+ resulted in minimal damage, with no observed broken cells, which was not significantly different from that of the control. Therefore, high Sr concentrations are believed to cause plant cell damage. Photosynthesis—a susceptible physiological process in plants—responds to environmental stresses, such as light, temperature, and water. To further investigate the photosynthetic performance of plants in response to injury, we measured changes in chlorophyll content. Table 1 shows that the chlorophyll a content initially increased and then declined with increasing concentrations, signifying the inhibition of chlorophyll a and b synthesis under medium-to-high strontium concentrations. At a Sr2+ concentration of 5 mg/L, the chlorophyll a content increased by 6.9%, which was not significantly different from that of the control. However, at 50 and 500 mg/L, a significant decrease of approximately 30% was observed. Among cellular functions, chloroplast photosynthetic activity stands out as highly sensitive, with chlorophyll a playing a significant role in absorbing and capturing light energy within chloroplasts, which is crucial for photosynthesis. Therefore, we can conclude that strontium does affect the photosynthetic performance of mosses.

2.2. Effects of Sr2+ on Chl a Fluorescence Rise Kinetics in R. japonicum

2.2.1. Raw Fluorescence Rise Kinetic OJIP Curves and Relative Variable Fluorescence Vt
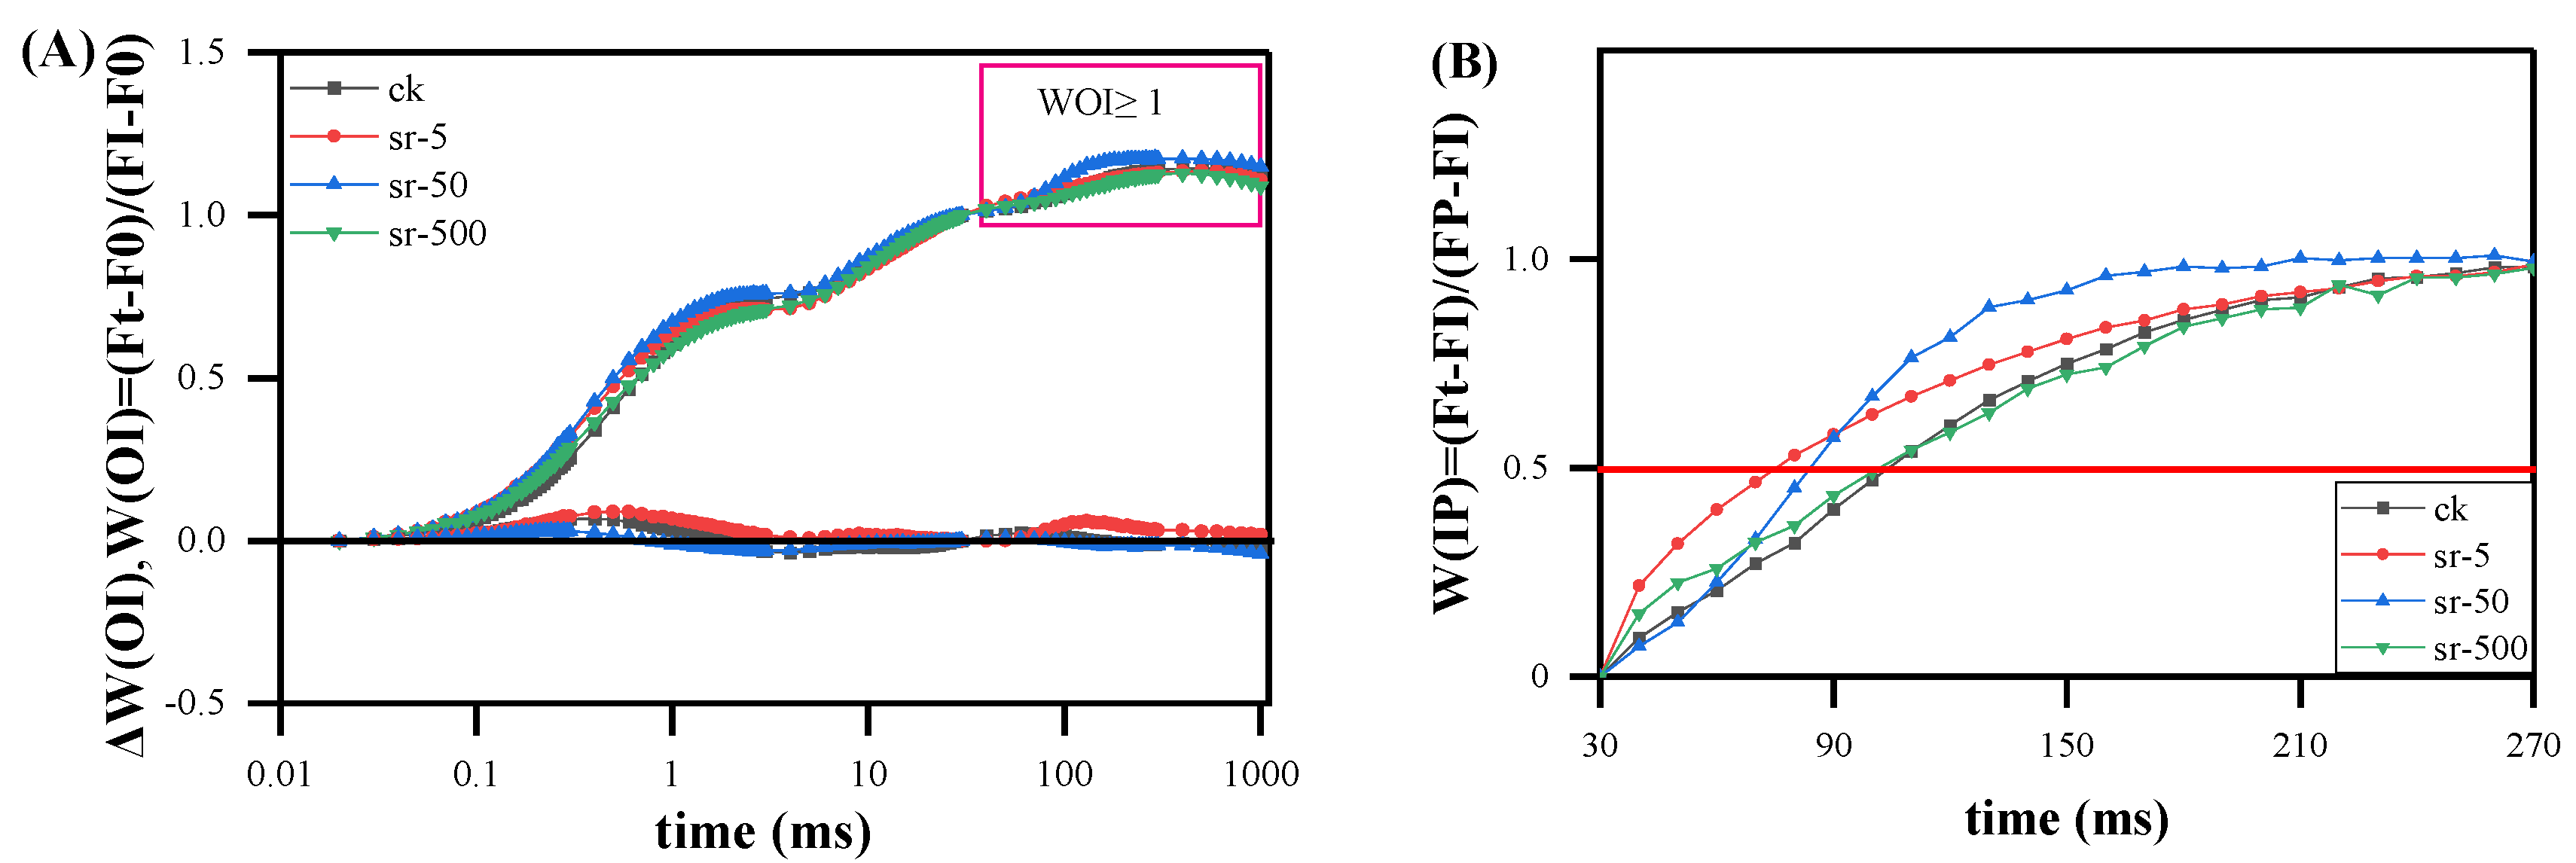
The rapid chlorophyll a fluorescence rise kinetic OJIP and JIP test analysis, based on the “Theory of Energy Fluxes in Biomembranes”, have proven to be a potent and widely utilized tool for investigating plant growth status. Its nondestructive, accurate, and rapid characteristics, and its sensitivity to environmental changes such as high temperature, drought, heavy metals, and salt stress make it highly effective [35]. Figure 2A depicts the fluorescence rise kinetic OJIP curves of R. japonicum treated with 5, 50, and 500 mg/L or 0 mg/L (control) of strontium. Different Sr2+ treatments exhibited varying impacts on the fluorescence increase kinetics of the OJIP curve compared with the control. The J-step level increased with the 5 mg/L Sr2+ solution, indicating increased sensitivity. With the concentration increasing from 0 to 500 mg/L, the J-step gradually approached FP, leading to the disappearance of the IP phase of the OJIP curve. The fluorescence rise in moss maintained a complete OJIP multiphase transient curve during the 500 mg/L treatment, suggesting that strontium treatment at this stage did not completely inhibit photosynthetic activity. Additionally, a significant increase was observed in the FO value (20 μs), affecting the FM value with the Sr2+ levels rising, leading to a noticeable decrease in the FO/FM. The change in FO value is related to the modification of the structure and order of the light-harvesting complexes during solar energy absorption. A decline in FO suggests a gradual degradation of antenna pigments, leading to reduced absorption of light energy from the environment. The kinetics of fluorescence increase in the leaves were suggested to differ significantly from those of the control group at low and medium Sr2+ levels. However, with the increase in treatment concentration, the characteristics of the fluorescence rise kinetics in the OJIP curves post-strontium treatment varied with different concentrations, indicating that nuclides change in fluorescence rise kinetics.
To further investigate the effect of strontium stress on the fluorescence rise kinetic OJIP curves, we double-normalized the fluorescence curves between FO (20 μs) and FM, and the curves were presented as relative variable fluorescence Vt = (FtFO)/(FMFO) and ΔVt = Vt (treatment) − Vt (control) at logarithmic time scale to show invisible features of Chl a fluorescence rise kinetic OJIP curve (Figure 2B). The Vt and ∆Vt results showed the emergence of two distinct phases in the fluorescence rising kinetic curve: the L-step and the K-step. The primary alteration in the fluorescence increase kinetics of R. japonicum was the appearance of positive K and I peaks, dependent on Sr2+ concentration. The fluorescence rise kinetic OJIP of the moss underwent a gradual transformation into an OKJIP pattern, introducing a new intermediate “K” step at approximately 300 µS. Along with the induction of the K-step, a sharp decrease occurred in the variable chlorophyll fluorescence intensity and p-value under 500 mg/L strontium stress. This suggests the possibility of an I-step (reflecting the energetic connectivity of PSII units), a K-step (related to the inactivation of the OEC), or H-steps and G-steps in corals and foraminifers [35]. There was a clear correlation between the fluorescence intensity of OJIP, changes in fluorescence kinetics, and variations in strontium concentration.

2.2.2. The L-Band

To reveal more details within the fluorescence rise kinetic curves and assess events in the OK, OJ, OI, and IP phases, we conducted additional normalizations and corresponding curve subtractions using the principle of differential kinetics. In Figure 3A, fluorescence rise kinetic curves from various treatments have been double-normalized by O (20 μs) and K-steps (300 μs) to reveal a weak L-band over the exponential period of 0–300 μs. By employing the kinetics WOK = (FtFO)/(FKFO), we extracted the unique fluorescence characteristics of the L-band, hidden between O and K, which was obtained at approximately 150 μs after data processing. The L-band serves as an indicator of the energetic connectivity or grouping of PSII units and is more prominent when the connectivity or grouping probability is lower [35]. It was observed that the 500 mg/L Sr2+ treatment increased the L-band. In contrast, the other three concentrations exhibited a slight increase in the L-band. Across the four concentration treatments, the L-band indicators positively correlated with concentration, revealing a significant concentration-dependent decline in energy connectivity based on the positive L-band. Additionally, the L-band can be quantified further through the relative fluorescence of FJFO, denoted as ΔWL = (F150µsFO)/(FJFO) [36]. ΔWL values showed differences after the three different strontium concentration treatments, with overlapping ∆WL curves for low and moderate Sr2+ levels but a significant increase in the L-band with higher Sr2+ levels. Thus, moss exhibited reduced PSII energy connectivity at strontium concentrations exceeding 500 mg/L. Lower connectivity leads to decreased excitation energy utilization and diminished PSII unit stability.

2.2.3. The K-Band

In Figure 2B, the presence of K-step has been identified. To assess the effects of various treatments on the K-step, Chl a fluorescence rise kinetics were normalized by O-step (20 μs) and J-step (2 ms), presented as WOJ = (FtFO)/(FJFO) and ΔWOJ = WOJ (treatment) − WOJ (control) in the linear time scale from 0–2 ms (Figure 4A). Under normal conditions, the K phase did not appear. While the four peaks were not consistently well separated, a distinct representation of ΔWOJ was executed to confirm that the K- and J-steps represent distinct phenomena and elucidate differences in the K phase among treated concentrations (Figure 4B). ΔWOJ curves indicated that the three strontium concentrations induced the occurrence of the K-bands, with a more pronounced positive K-band evident in the different kinetic ∆WOJ with increasing concentrations. In particular, under the 50 mg/L strontium treatment, the intensity of the change in the K phase was more active and evident than that of the 5500 mg/L strontium treatment. We hypothesize that plants were more responsive to this concentration, experiencing enhanced damage, resulting in a very high Chl a fluorescence intensity, mirroring the trend observed in Figure 2B. Furthermore, upon scrutinizing the variations in phases, we observed that the positions of the phases are not consistently fixed and they may shift to shorter or longer times under varying stress conditions. The duration of the K phase was prolonged, reaching the K phase at about 400 μs instead of 300 μs. An increase in the K-step suggests the inactivation of OEC centers at the PSII donor side, amplifying the inhibition of linear electron transfer as the accumulation of electrons in the P680+ center increases. This implies that strontium treatment likely induced oxidative damage in R. japonicum. Regarding the reduction in the K phase following the 500 mg/L strontium concentration, it could be inferred that, besides severely impaired linear electron transport, oxidative damage in moss might have inhibited the water cleavage system, intensifying PSI damage and consequently diminishing the photosynthetic response of R. japonicum.

2.2.4. The IP Phase

Fluorescence kinetic curves were normalized between the O-step and I-step (30 ms) using WOI = (FtFO)/(FIFO) and ΔWOI = WOI (treatment) − WOI (control) on a logarithmic time scale (Figure 5A). ΔWOI was employed to show the effects of the four concentrations on the J-step, aligning with the findings of ΔVt. The maximum amplitude of the fluorescence rise (WOI ≥ 1) for each WOI curve in the linear time range of 0.02–300 ms reflects the size of the pool of the end electron acceptors at the PSI acceptor side [37]. Comparatively, concerning the control (0 mg/L), moss amplitude was slightly reduced at high concentrations (500 mg/L), and the WOI amplitude showed no significant increase between the 5 and 50 mg/L Sr2+ treatments. The amplitude strength was linked to the inhibition of pool size, and none of the three concentrations resulted in significant changes in the WOI amplitude. Moreover, the J and K phases are not consistently synchronous; they manifest as two independent steps in the increase in the kinetics of chlorophyll fluorescence. Strontium treatment may not significantly excite the J phase. Moreover, the electron pool size is independently regulated regardless of the change in its reduction rate. The change in the reduction rate of the electron acceptor pool at the end of the PSI acceptor side after different sample treatments can be explored using another fluorescence increase kinetically normalized to WIP (normalized with I- and P-steps). In Figure 5B, the IP phase illustrated for WOI ≥ 1 plotted on a linear time scale from 30 ms to 270 ms was calculated as WIP = (FtFI)/(FPFI). WIP represents the reduction rate of the end electron acceptor in PSI, with a lower (or higher) conductivity generally mirrored in a larger (or lower) half-life. Therefore, the time point at WIP = 0.5 (the half-time of the rising curves) can be employed to reflect the reduction rate of the PSI end electron acceptor pool [38]. The half-rise-time values of the treated moss samples surpassed those of the control (approximately 100 ms), while those of the 500 mg/L strontium-treated samples (approximately 90 ms) were lower than those of 50 mg/L (approximately 75 ms) and 5 mg/L (approximately 60 ms). This suggests that the Sr concentration treatment increased the reduction rates of the end electron acceptors on PSI, with low Sr2+ levels of terminal electron acceptors at the highest reduction rate on PSI, followed by middle concentrations, and the lowest reduction rate at high Sr2+ levels. The low and middle concentrations of strontium were more sensitive to the stimulation of the photosynthetic system of moss, intensifying the PSI reaction center activity. Consequently, this acceleration of electron reduction ensured the fluidity of the linear electron transfer pathway, thereby promoting moss activity to some extent.

2.3. The Energy Fluxes in R. japonicum

Different concentrations of strontium can be effectively assessed for their impact on energy fluxes using the energy flow model of the cell, employing the energy pipeline models of the photosynthetic apparatus [39,40,41]. This dynamic model shows the fluctuation in the value of each energy flux over time. Each energy flux value, influenced by different concentrations of Sr treatment—or different environmental conditions in general—is expressed by the appropriately adjusted width of the corresponding arrow. Figure 6 presents the pipeline models for mosses treated with 5, 50, and 500 mg/L Sr solutions. The pipeline model has two types of expressions: one refers to the reaction center in the membrane, dealing with the specific energy fluxes (per reaction center, RC), while the other concerns the excited cross-section of a leaf, focusing on phenomenological energy fluxes (per excited cross-section, here taken as CSM) [42]. In this experiment, we chose the latter expression to ensure a more uniform energy transfer. In the leaf model, active reaction centers per cross-section (RC/CSM) are indicated by small empty circles, while inactivated ones are represented by solid black circles. The darkness of the leaf area, indicating chlorophyll density, provides additional visualization of the ABS/CSM flux. The leaf model demonstrated that applying different Sr concentrations resulted in (Figure 6a–c): (a) A 5% decrease in ABS/RC at 5 and 500 mg/L, with an increase of 13.5% at 50 mg/L. ABS captures solar energy through the antenna, and excited chlorophyll molecules are reduced at both extreme concentrations (5 and 500 mg/L). (b) A slight (<10%) decrease in TR0/CSM at both 5 and 500 mg/L, while there was a 13% increase at 50 mg/L, indicating that trapped energy is conducted to the reaction center TR, and the rate of reduction involved in QA subsequently increases through the medium electron transfer complex. (c) A more pronounced decrease (>10%) in the ET0/CSM; in the case of the 5 and 500 mg/L Sr2+ treatments, the decrease in the ET0/CSM was only 3% and 0.6%, respectively. A strontium concentration of 50 mg/L stimulated the electron reduction rate, but electron transfer (ET) decreased substantially. (d) A substantial (>10%) increase in DI0/CSM; the decrease was reduced to 7% and 12% at low and high Sr2+ levels, respectively. Electrons are partly used for CO2 fixation in the photosystem, consuming a certain amount of energy. Conversely, with the transfer of electrons, most energy that cannot be used is dissipated through heat and fluorescence. Moreover, the ability to dissipate is enhanced with a substantial increase in the DIO ratio at 50 mg/L. Figure 6 illustrates the effect of strontium on the distribution and transfer of light energy, especially the 50 mg/L strontium concentration treatment absorbed, transferred, and transmitted a large amount of energy, much of which was dissipated. Combined with the previous fluorescence performance at low and high concentrations, moss must have experienced damage to energy transfer while affecting electron transfer under the stress treatment at high concentrations.

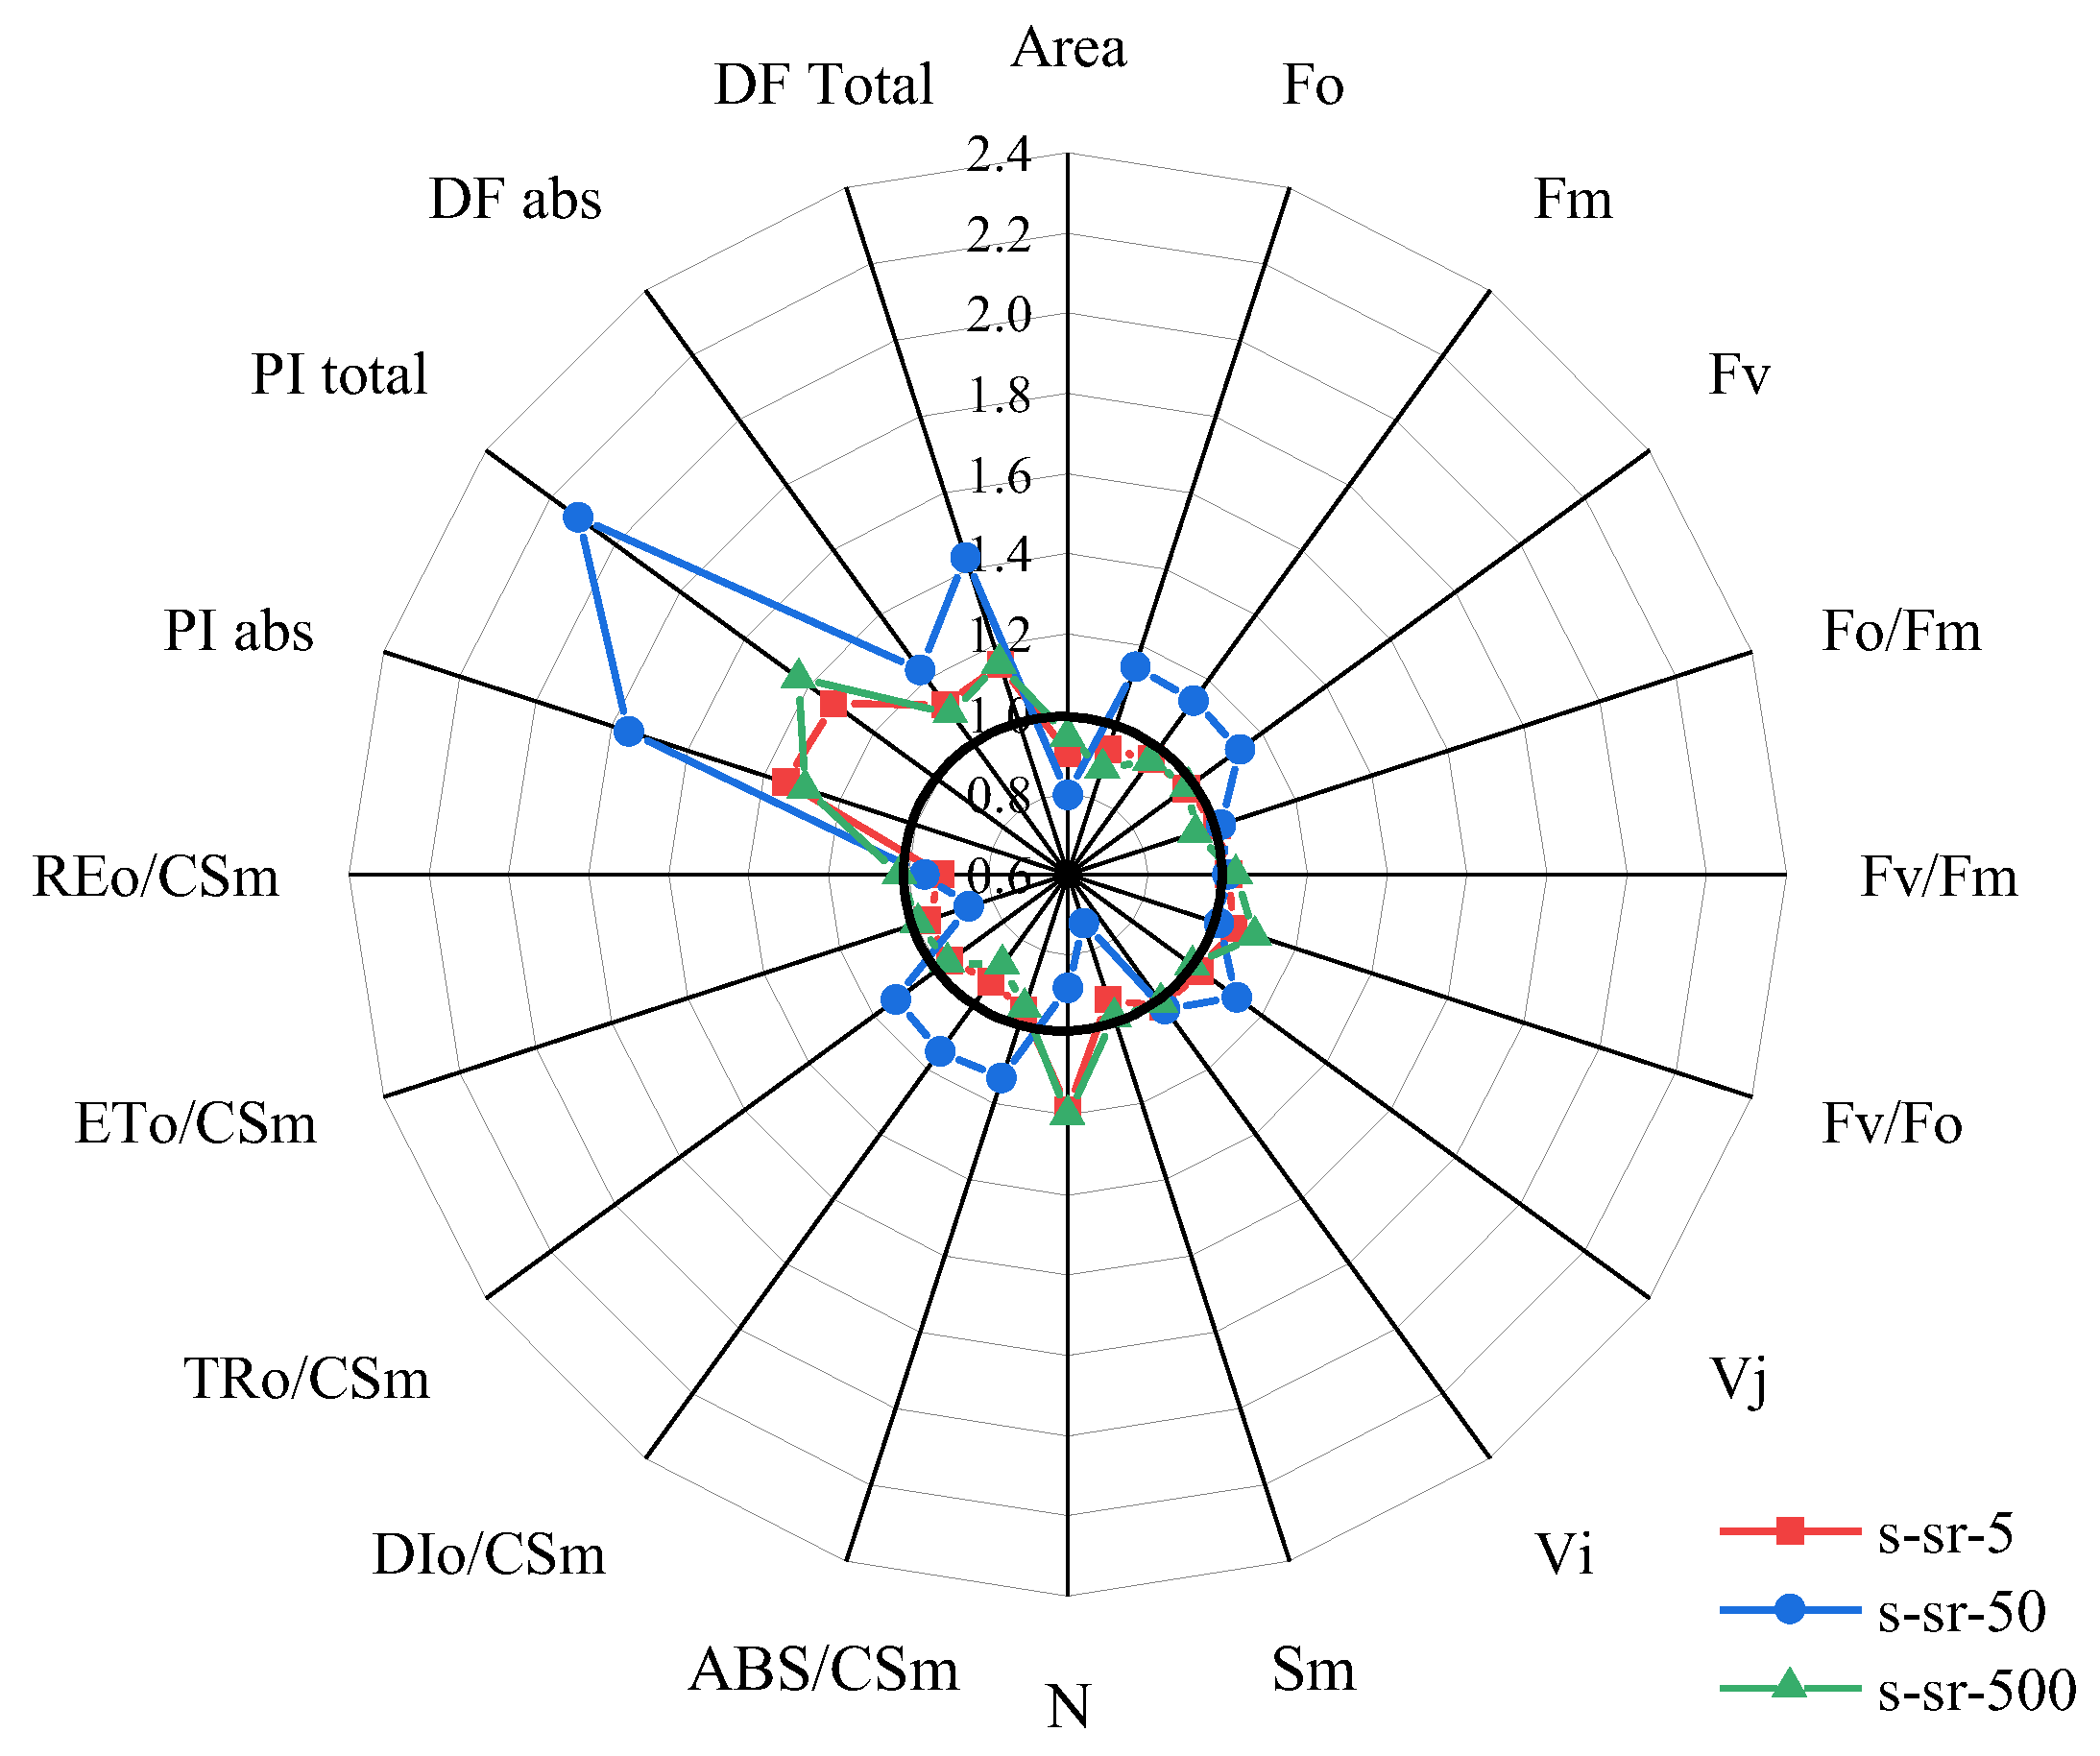
2.4. JIP-Test Analysis in R. japonicum

Both OEC impairment and a contrast in photosynthetic fluxes characterize the sensitivity of photosynthetic fluorescence to 50 mg/L strontium treatment. To further assess the effect of different strontium concentrations on photosynthesis, we assessed several JIP test parameters that quantify the conformation, structure, and function of the photosynthetic apparatus [43]. In Figure 7, moss treated with a 500 mg/L Sr2+ solution showed a slight decrease in FO, FM, FJ, and FI compared to the control, with FO significantly reduced by 12%. While these four parameters exhibited a significant increase, the 50 mg/L treatment demonstrated a more pronounced effect. The corresponding ratios FO/FM, FV/FM, and FV/FO displayed a decreasing trend at high concentrations and an increase at low and medium concentrations, but with no significant effect observed for the different concentration treatments. This suggests a reduction in both variable and actual fluorescence following high-concentration treatment, leading to changes in the maximum quantum yield of primary photochemistry and impairment of PSII activity. Moreover, the 50 mg/L concentration stimulated the reaction efficiency of PSII, resulting in a significant increase in the overall photosynthetic activity with ABS/CSM, TR0/CSM, and DI0/CSM increasing by approximately 15%, aligning with the findings in Figure 6. Plants exhibited sensitivity and were more active in capturing and absorbing fluorescence after the intermediate Sr2+ concentration treatment. In addition to the thermal dissipation, which consumes part of the absorbed and trapped large amounts of electrons, the reduction in transferred electrons (ET0/CSM) also contributed to a weakening of the PSII linear electron transfer rate. The increase in photosystem activity and the substantial absorption of light energy must be consumed through other electron transfer pathways, affecting performance indices (PI) and DF. Regarding energy conservation efficiency, the performance index (PI) of PSII exhibited a substantial increase at different strontium concentrations, susceptible at 50 mg/L, where PIABS and PItotal increased by 29% and 43%, respectively. As an indicator of the activity of each intercellular function, moss PI values significantly rose with strontium treatment at every concentration. This suggests that strontium treatment stimulated photosynthesis, with the intensity of the total photosynthetic drive, the driving force of absorbed light (DFABS), and the overall driving force between photosystems (DFtotal) increasing by 10% and 16% at 50 mg/L compared to the control, surpassing the increments observed in the other two treatments. At 500 mg/L, Sr treatment stimulated PSII energy conservation efficiency, exhibiting a pronounced increase in overall PSII photosynthetic activity. Analyzing all the performance indicators in Figure 7, the Sr concentration level correlated with photosynthetic activity. It caused damage to the assembled structure of PSII pigments while stimulating concurrently photosynthetic activity. The somewhat positive impact on PSII activity, Chl concentration, and the assembled structure of PSII pigments at an Sr2+ concentration of 50 mg/L was particularly noteworthy. However, the adverse effect observed on linear electron transfer, impeding electron transfer from PSI to PSII, suggests the existence of an alternative electron transfer pathway for electrons accumulated through antenna pigment absorption.

2.5. Photosynthetic Electron Transport in R. japonicum

Under normal circumstances, electron transfer in plants typically follows a linear pattern. However, exposure to stress prompts the involvement of cyclic electrons in the transfer process [44]. To assess the sensitivity of photosynthetic activity to 50 mg/L Sr treatment, we calculated the cycle electrons of the PSI reaction center using a Dual-PAM 100 measuring system (Heinz Walz, Effeltrich, Germany) by subtracting ETRII120s from ETRI120s. As shown in Figure 8A, with increased concentration intensity, ETRI–ETRII rapidly increased in the first 10 s and stabilized after 1 min. The initial increase in ETRI–ETRII was primarily attributed to Sr2+ concentration stimulation, while the subsequent stable state resulted from the regulation of electron transport pathways. The same trend applied to the CEF capacity, calculated as Y (I)–Y (II). Compared with the control group, an increase in concentration to 50 and 500 mg/L led to a significant decrease in CEF. However, the time to reach equilibrium shortened, and excitation occurred at low levels (Figure 8B). These findings suggest that cyclic electron transfer accelerates with middle-to-high Sr2+ levels, and the electron pool size and translocation ability can be stimulated at lower levels. Integrating the observations from each phase of Chl a fluorescence rise kinetics and JIP-test analysis, we found that the electron transfer of the photosystem was under a certain pressure in the presence of middle and high Sr2+ concentrations in moss. The capacity of PSI to receive electrons decreases and the electron transfer rate slows, significantly impeding the normal linear electron transfer. This pressure tended to induce cyclic electrons in the middle- and high-concentration solutions, exhibiting a transient increase before stabilizing. Further in-depth studies are required to elucidate the specific response mechanism for the excitation of cyclic electrons in mosses.

3. Discussion

3.1. Chl a Fluorescence Rise Kinetic Response of Moss under Sr2+ Stress

Photosynthesis is responsive to alterations in the plant environment [45,46]. Plants exhibit a stress response to nucleophiles similar to that of most heavy metals [47,48]. However, there is limited understanding of the response of chlorophyll fluorescence in mosses to nuclide treatment. Chl a fluorescence rise kinetics and the JIP test are susceptible and informative tools extensively utilized to monitor changes in the photosynthetic apparatus under various stress conditions [37]. Our experiments revealed that strontium significantly affected the photosynthetic fluorescence of moss. All OJIP phases exhibited variability, with increasing strontium concentrations progressively inhibiting chlorophyll fluorescence and a more pronounced K-step (OKJIP) [49]. The K-step is associated with the activity of the OEC on the donor side of PSII. Extensive studies have established that the K-peak occurs due to the disruption of the oxidation system, leading to a significant reduction in the continuous electron supply from the OEC to the RC and PSII receptors. During linear electron transfer from QA to QB, the reoxidation of QA to QA prompts a short-lived rise in the reduced Pheo-/QA-concentration, resulting in a transient increase in the activity of the reaction center, resulting in a K-peak maximum [50,51]. The mosses exhibited a K-peak, reaching their maximum value after a strontium concentration of 50 mg/L, representing an approximately 20% increase compared to treatments with low and high concentrations, positively stimulating their PSII activity. The dip observed after the K-step could be attributed to the deficiency of electrons from the donor side. PSII RCs are reopened by electron transfer from QA to QB, eventually accumulating P680+ centers with a low fluorescence yield [52]. While each plant may perceive environmental factors such as light, heat, and water differently, the simultaneous occurrence of the L-band and K-band, causing a rapid rise in fluorescence in moss leaves under strontium-stressed conditions, holds a better predictive value for plants that have experienced oxidative damage [35,53]. We observed that the elevated strontium concentration leads to the appearance of L-band and K-band, which appear with a certain delay (Figure 2 and Figure 3). We presumed that strontium exerts pressure on the moss during this delay period. Further investigations are required to explore the pressure range induced by different metals. Besides photoactivity, the L-band indicators are associated with photosynthesis and energy dynamics. At medium-to-high concentrations, the L-band indicators rise, resulting in poor utilization of energy connectivity in photosynthesis, significantly affecting the energy synergy between PSII units [22].

3.2. Photosynthetic Organ Response of Mosses under Sr2+ Stress

In addition to the observed K-steps and L-steps, ABS/CSM and TR0/CSM further demonstrate that strontium significantly affects PSII RCs. When the moss was exposed to a concentration of 50 mg/L Sr2+, the activity of PSII reaction centers behaved differently from other concentrations; not only did it elevate the specific rate of exciton capture by RCs, but the transient boost in photosynthetic activity following strontium stimulation also accelerated energy dissipation in the unit reaction center (DI0/CSM). This process helped in consuming the excess accumulation of electrons in the reaction center, achieving a photoprotective effect. At this point, the energy captured per reaction center for QA reduction (TR0/CSM) increased. In contrast, linear electron transfer (ET0/CSM) was hindered. However, no irreversible impairment of photosynthetic activity was observed, even at a concentration of 500 mg/L Sr2+. Hence, there appears to be an alternative transfer pathway for significant amounts of reduced electrons, ensuring the continued activity of the photosystem reaction center. Furthermore, a concentration of 50 mg/L acted as a turning point, leading to an exceptionally active behavior in the photosynthetic performance index PIABS, with the same trend observed in the total photosynthetic driving force (DF). This aligns with findings by Strasser et al., who argue that PIABS serves as a sensitive criterion for identifying different stress sensitivities, surpassing the sensitivity of conventional FV/FM [22]. Based on the previous analysis, we hypothesize that the significant increase in the overall photosynthetic activity of PSII (PIABS) is attributed to the stimulation of RCs (RC/CS) by strontium.

3.3. Electron Transport Response of Moss under Sr2+ Stress

Contrary to a study on temperature stress by Havaux, where temperature-induced heat affected the photosystem, stimulating PSII but inhibiting PSII activity in pea leaves [54], our investigation revealed that at a Sr2+ concentration of 50 mg/L, the rising IP phase and the time of WIP (t = 0.5) were significantly shorter. This indicates an increase in the pool size and an acceleration in the reduction rate of terminal electron acceptors in PSI. Compared to low and middle Sr2+ levels, the reduction rate on the PSI receptor side decreased at 500 mg/L Sr2+. The maximal amplitude of WOI ≥ 1 reflects the size of the pool of the end electron acceptors at the PSI acceptor side, while the WIP represents the reduction rate of the end electron acceptor in PSI [37,38]. This suggests that high concentrations of Sr mainly inhibit PSII electron flow beyond QA. Through the analysis of each OJIP phase, it is clear that the linear electron transfer pathway is inhibited, and the IP phase corresponds to the reduction of PC+ and P700+ [55,56]. To ensure an increased rate of electron reduction on the PSI receptor side at 50 mg/L, the accumulated electrons could only pass through cyclic or pseudo-cyclic electron transfer pathways. Under the same conditions, our moss electron response test indicated that higher concentrations more readily excited the size and capacity of the electron transfer cycle. This is consistent with the results of Xia and Ren’s study in moss [57,58]. Further studies are required to determine the specific response of different concentrations to the cyclic electron transfer pathway.

4. Materials and Methods

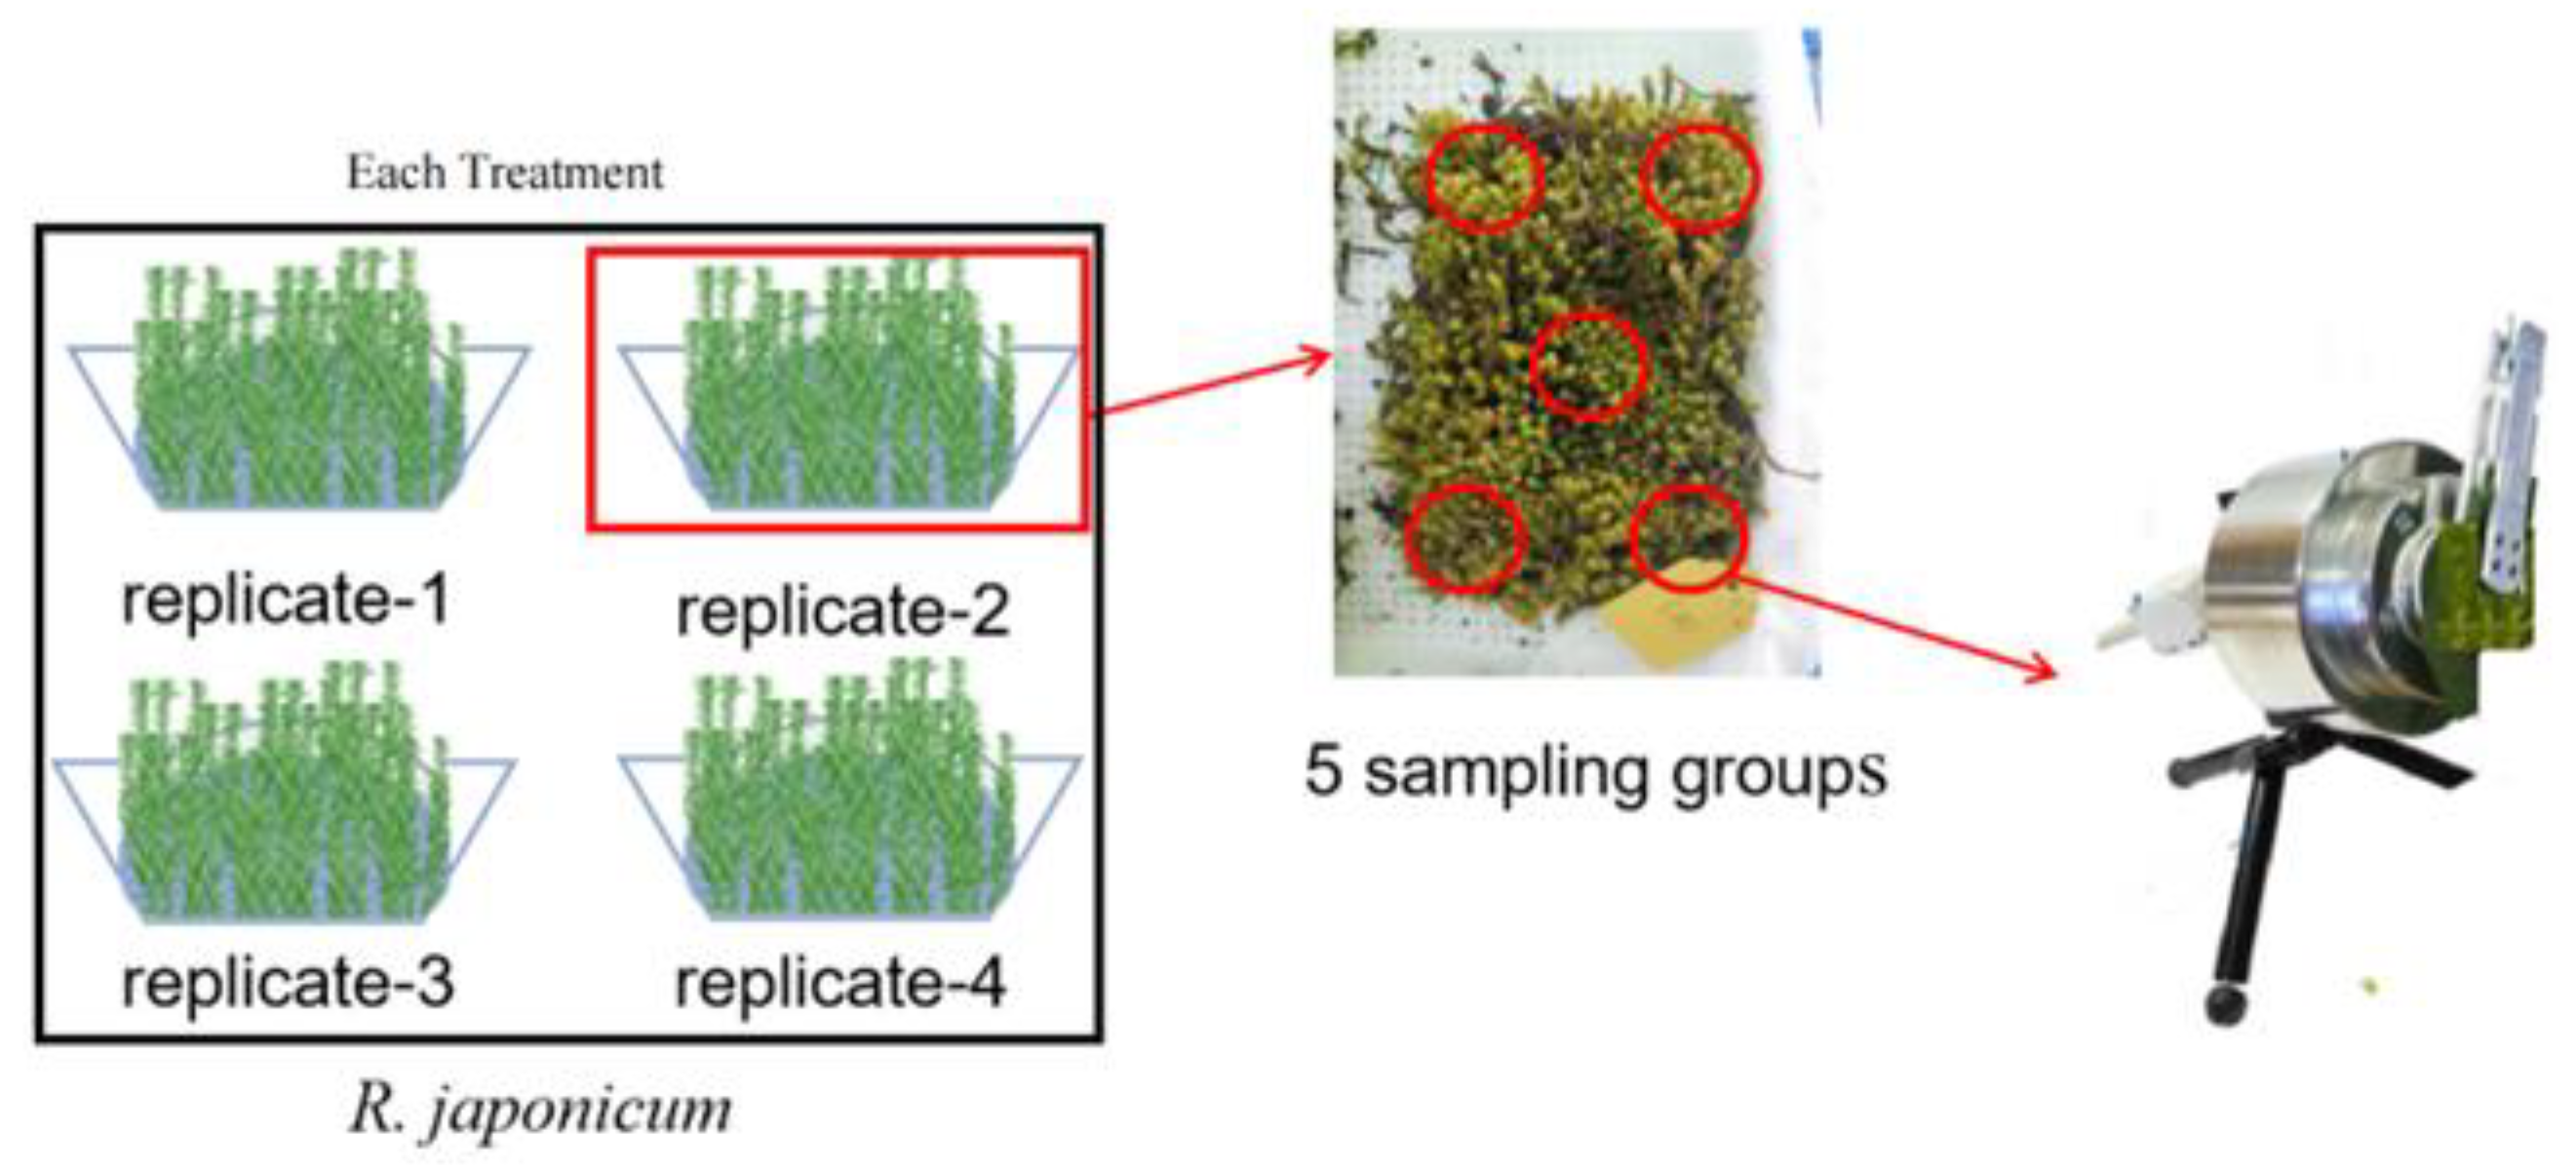
4.1. Plant Materials and Treatments

In this study, we used the moss R. japonicum collected from Zhangjiajie Forest Park, Hunan Province, China. After thoroughly rinsing with deionized water, the moss was subjected to experiments to remove gravel and weeds. Subsequently, R. japonicum was cultivated in a greenhouse with moderate relative humidity (70–80%), day/night temperatures (23/17 °C), and 30% full sunlight for 2 days before undergoing 88Sr2+ treatment. Treatment solutions of Sr2+ were prepared using 88SrCl2·6H2O. In this study, there were four treatments including control (0 mg/L Sr2+), Sr-5 (5 mg/L Sr2+), Sr-50 (50 mg/L Sr2+), and Sr-500 (500 mg/L Sr2+). Each treatment includes four replications with 10 g of moss per replicate tray. Plants were treated in a plastic tray for 7 days, with daily 2-h soaking at noon. All three treatments and the controls (no treatment) were arranged in a completely randomized design, with each treatment using five samples from each of the four trays for that treatment. After 7 days of greenhouse cultivation, we measured the cell structure, chlorophyll content, Chl a fluorescence rise kinetic curve, and chlorophyll fluorescence parameters of the plants. The data obtained during the determination of Chl a fluorescence rise kinetic curve were the average value of 20 measurements, because the instant light exposure of each measurement produces high quantum strong light stimulation, causing temporary damage to plants. Each sample was about 0.5 g, a total of 20 samples, and JIP tests were conducted successively to improve the reliability of the data.

4.2. Cell Structure Observation and Chlorophyll Content Determination

One week after Sr2+ treatment, the plants were surface-rinsed with deionized water. Subsequently, the same parts, approximately 3 cm in length after removing the rhizoids, were cut and positioned in an embedding box under the fixation of tweezers. SAKURA4583 embedding solution was added to the box, ensuring complete solidification of the plants in the freezer at −40 °C. The embedded block was then sliced to a thickness of 5 μm using a frozen slicer and affixed onto a slide. The structure and morphology of the cells were observed using a 20× fluorescence optical microscope. Fresh leaves (0.3 g) were finely ground, and chlorophyll content was measured. Chlorophyll content determination was conducted through spectrophotometry in the dark, as described by Gitelson [59]. The physiological index was repeated three times, and the average value was calculated.

4.3. Chl a Fluorescence Kinetic Measurement and JIP Test

The setup diagram for chlorophyll fluorescence kinetic measurement was shown in Figure 9. Chl a fluorescence rise kinetic OJIP curves were determined using 1 s pulses of continuous red light (3000 μmol (photons) m−2 s−1) with MPEA fluorometer (Hansatech Instruments Ltd., King’s Lynn, UK) as described by Strasser and Govindjee [24]. Fluorescence data were recorded with a variable sampling rate, ranging from 0.01 to 0.3 ms, with data recorded every 10 μs. The article referred to several fundamental sets of data: FO (the fluorescence intensity at 20 μs), FL (the fluorescence intensity at 150 μs), FK (the fluorescence intensity at 300 μs), FJ (the fluorescence intensity at 2 ms), FI (the fluorescence intensity at 30 ms), and the maximal fluorescence intensity FM is equal to FP.
Chlorophyll fluorescence values in the OJIP part were computed through double normalization within distinct time intervals of the transient—OP, OK, OJ, OI, and IP: Vt, representing relative variable fluorescence at time t, was calculated using the formula Vt = (FtFO)/(FMFO); WOK, indicating the ratio of variable fluorescence FtFO to the amplitude FKFO, served to clarify L-band; WOJ, calculated by WOJ = (FtFO)/(FJFO), was employed to show K-band; WOI, determined through the formula WOI = (FtFO)/(FIFO), was commonly utilized to show J-step; WIP, with formula WIP = (FtFI)/(FPFI), was associated with electron flow through PSI and inactive ferredoxin-NADP+-reductase (FNR) at the acceptor side of PSI [56,60].
The data were analyzed according to the JIP test [22,25]. The JIP test establishes the maximal (subscript “o”) energy fluxes in the energy cascade for the following events: absorption (ABS), trapping (TR0), electron transport (ET0), dissipation (DI0), reduction of end acceptors of PSI (RE0), and excited leaf cross-section (CS).
The maximum quantum yield of PSII primary photochemistry, Po, is expressed as TR0/ABS = 1 − (FO/FM). The probability that an electron progresses beyond QA is defined as Eo = ET0/TR0 = (1 − VJ). The quantum yield for the reduction of the end electron acceptors at the PSI acceptor side (Ro) is given as Ro = (1 − VI)/(1 − VJ). To convey the overall photosynthetic activity of PSII, two indices were introduced: the performance index on an absorption basis, PI (PIABS/PITOTAL) and DF (DFABS/DFtotal).
P I A B S = R C A B S × φ P 0 1 φ P 0 × ψ E 0 1 ψ E 0
P I t o t a l = P I A B S × δ R 0 1 δ R 0
D F A B S = log ( P I A B S )
D F t o t a l = log ( P I t o t a l )
The photosynthetic electron transfer rate was computed using the following equation: ETRI = PPFD × Y (I) × 0. 84 × 0.5; ETRII = PPFD × Y (II) × 0.84 × 0.5, where ETRI and ETRII represent the electron transfer rates through PSI and PSII, respectively, ETRI–ETRII represents the cyclic electron transfer (CEF) rates, and PPFD represents the photosynthetic effective radiation intensity.

4.4. Data Analysis

One-way analysis of variance (ANOVA) was carried out and means were separated with Duncan’s LSD at 95% using SPSS Statistics 26.0. All figures were generated using the OriginLab software (version 9.0).

Author Contributions

Conceptualization, H.R., Y.L. and K.C.; methodology, Y.T. and P.R.; software, P.R. and H.T.; validation, Y.L. and Y.T.; formal analysis, H.R.; investigation, Y.L. and K.C.; resources, Q.C. and P.K.; data curation, P.R. and R.H.; writing—original draft preparation, H.R. and Y.L.; writing—review and editing, K.C., R.H. and Y.T.; visualization, P.R. and H.T.; supervision, K.C.; project administration, Y.T. and W.Z.; funding acquisition, H.T. and K.C. All authors have read and agreed to the published version of the manuscript.

Funding

This research was funded by the Sichuan province transfer payment application project (R22ZYZF0001); Jingmen key science and technology plan projects (2023YFZD014); Innovation and entrepreneurship project of the college student in Sichuan Province (S202310619050).

Data Availability Statement

Data available on request from the corresponding author. The data are not publicly available due to privacy.

Conflicts of Interest

The authors declare no conflicts of interest.

References

  1. Baker, N.R.; Long, S.P. Photosynthesis in contrasting environments. Photosynth. Contrasting Environ. 1986, 7, 1. [Google Scholar]
  2. Baker, N.R.; Bowyer, J.R. Photoinhibition of photosynthesis: From molecular mechanisms to the field. BIOS Sci. 1994, 124, 156. [Google Scholar]
  3. Harborne, J.B. Physiological processes in plant ecology: Towards a synthesis of atriplex. Phytochemistry 1981, 20, 2449. [Google Scholar] [CrossRef]
  4. Yordanov, I.; Dilova, S.; Petkova, R.; Pangelova, T.; Zuss, K.H. Mechanisms of the temperature damage and acclimation of the photosynthetic apparatus. Photobiochem. Photobiophys. 1986, 12, 147–155. [Google Scholar]
  5. Xia, H.; Cheng, X.; Zheng, L.; Ren, H.; Li, W.; Lei, Y.; Plenković-Moraj, A.; Chen, K. Sex-Specific Physiological Responses of Populus cathayana to Uranium Stress. Forests 2022, 13, 1123. [Google Scholar] [CrossRef]
  6. Armond, P.A.; Björkman, O.; Staehelin, L.A. Dissociation of supramolecular complexes in chloroplast membranes A manifestation of heat damage to the photosynthetic apparatus. Biochim. Biophys. Acta (BBA)-Biomembr. 1980, 601, 433–442. [Google Scholar] [CrossRef]
  7. Gounaris, K.; Brain, A.; Quinn, P.; Williams, W. Structural reorganisation of chloroplast thylakoid membranes in response to heat-stress. Biochim. Biophys. Acta (BBA)-Bioenerg. 1984, 766, 198–208. [Google Scholar] [CrossRef]
  8. Jianrong, X.; Qiran, T. Early stage toxicity of excess copper to photosystem II of Chlorella pyrenoidosa–OJIP chlorophyll a fluorescence analysis. J. Environ. Sci. 2009, 21, 1569–1574. [Google Scholar]
  9. Jiang, Y.; Huang, R.; Jiang, L.; Chen, K.; Zhu, W. Alleviation of Cadmium Toxicity to Medicago Truncatula by AMF Involves the Changes of Cd Speciation in Rhizosphere Soil and Subcellular Distribution. Phyton 2021, 90, 403. [Google Scholar] [CrossRef]
  10. Dushenkov, S. Trends in phytoremediation of radionuclides. Plant Soil 2003, 249, 167–175. [Google Scholar] [CrossRef]
  11. Entry, J.A.; Vance, N.C.; Hamilton, M.A.; Zabowski, D.; Watrud, L.S.; Adriano, D.C. Phytoremediation of soil contaminated with low concentration of radionuclides. Water Air Soil Pollut. 1996, 664, 299–306. [Google Scholar] [CrossRef]
  12. Burger, A.; Lichtscheidl, I. Strontium in the environment: Review about reactions of plants towards stable and radioactive strontium isotopes. Sci. Total Environ. 2019, 653, 1458–1512. [Google Scholar] [CrossRef]
  13. Crompton, T.R. Determination of Metals in Natural Waters, Sediments and Soils; Metals in Natural Water Samples; Elsevier: Amsterdam, The Netherlands, 2015; pp. 1–8. [Google Scholar]
  14. Sripathy, L.; Rao, P.; Kumar, N.M.A.; Yashwanth, S.; Sharada, K.R. Heavy metal contamination of soil due to vehicular traffic: A case study across nelamangala-dabaspet segment of national highway no. 4. Rasayan J. Chem. 2015, 8, 232–236. [Google Scholar]
  15. Bonari, G.; Monaci, F.; Nannoni, F.; Angiolini, C.; Protano, G. Trace Element Uptake and Accumulation in the Medicinal Herb Hypericum perforatum L. Across Different Geolithological Settings. Biol. Trace Elem. Res. 2019, 189, 267–276. [Google Scholar] [CrossRef]
  16. Zhang, W.; Kang, Z.; Wang, Q.; Qiu, N.; Zhou, F. The biological effects of strontium (88Sr) on Chinese cabbage. Plant Soil Environ. 2020, 66, 149–154. [Google Scholar] [CrossRef]
  17. Burger, A.; Lichtscheidl, I. Stable and radioactive cesium: A review about distribution in the environment, uptake and translocation in plants, plant reactions and plants’ potential for bioremediation. Sci. Total Environ. 2018, 618, 1459–1485. [Google Scholar] [CrossRef] [PubMed]
  18. Wang, D.; Zhang, X.; Luo, X.; Tang, Y. Phytoextraction Ability of Amaranthus mangostanus L. from Contaminated Soils with Cs or Sr. J. Bioremediation Biodegrad. 2015, 6, 277. [Google Scholar]
  19. Yang, Y.; Cheng, Z.; Luo, Y.; Li, X.; Lei, Y.; Plenković-Moraj, A.; Chen, K. Preparation and characterization of Racomitrium japonicum moss biochar and its adsorption of Sr (II). BioResources 2022, 17, 3965. [Google Scholar] [CrossRef]
  20. Straaer, B. Measuring fast fluorescence transients to address environmental questions: The JIP-test. Photosynth. Light Biosph. 1995, 94, 977–980. [Google Scholar]
  21. Strasser, R.J.; Srivastava, A.; Tsimilli-Michael, M. The fluorescence transient as a tool to characterize and screen photosynthetic samples. Probing Photosynth. Mech. Regul. Adapt. 2000, 25, 445–483. [Google Scholar]
  22. Strasser, R.J.; Tsimilli-Michael, M.; Srivastava, A. Analysis of the chlorophyll a fluorescence transient. In Chlorophyll a Fluorescence; Springer: Berlin/Heidelberg, Germany, 2004; pp. 321–362. [Google Scholar]
  23. Strauss, A.; Krüger, G.; Strasser, R.; Van Heerden, P. Ranking of dark chilling tolerance in soybean genotypes probed by the chlorophyll a fluorescence transient OJIP. Environ. Exp. Bot. 2006, 56, 147–157. [Google Scholar] [CrossRef]
  24. Strasser, R.J. The Fo and the OJIP fluorescence rise in higher plants and algae. In Regulation of Chloroplast Biogenesis; Springer: Berlin/Heidelberg, Germany, 1992; pp. 423–426. [Google Scholar]
  25. Stirbet, A. On the relation between the Kautsky effect (chlorophyll a fluorescence induction) and photosystem II: Basics and applications of the OJIP fluorescence transient. J. Photochem. Photobiol. B Biol. 2011, 104, 236–257. [Google Scholar] [CrossRef]
  26. Zushi, K.; Kajiwara, S.; Matsuzoe, N. Chlorophyll a fluorescence OJIP transient as a tool to characterize and evaluate response to heat and chilling stress in tomato leaf and fruit. Sci. Hortic. 2012, 148, 39–46. [Google Scholar] [CrossRef]
  27. Tsimilli-Michael, M.; Pêcheux, M.; Strasser, R.J. Light and heat stress adaptation of the symbionts of temperate and coral reef foraminifers probed in hospite by the chlorophyll a fluorescence kinetics. Z. Naturforschung C 1999, 54, 671–680. [Google Scholar] [CrossRef]
  28. Stirbet, A. Chlorophyll a fluorescence induction: A personal perspective of the thermal phase, the J–I–P rise. Photosynth. Res. 2012, 113, 15–61. [Google Scholar] [CrossRef] [PubMed]
  29. Chen, L.-S.; Li, P.; Cheng, L. Comparison of thermotolerance of sun-exposed peel and shaded peel of ‘Fuji’ apple. Environ. Exp. Bot. 2009, 66, 110–116. [Google Scholar] [CrossRef]
  30. Stefanov, D.; Petkova, V.; Denev, I.D. Screening for heat tolerance in common bean (Phaseolus vulgaris L.) lines and cultivars using JIP-test. Sci. Hortic. 2011, 128, 1–6. [Google Scholar] [CrossRef]
  31. Lazár, D. Parameters of photosynthetic energy partitioning. J. Plant Physiol. 2015, 175, 131–147. [Google Scholar] [CrossRef]
  32. Chen, L.-S.; Li, P.; Cheng, L. Effects of high temperature coupled with high light on the balance between photooxidation and photoprotection in the sun-exposed peel of apple. Planta 2008, 228, 745–756. [Google Scholar] [CrossRef] [PubMed]
  33. Chen, L.-S.; Cheng, L. Photosystem 2 is more tolerant to high temperature in apple (Malus domestica Borkh.) leaves than in fruit peel. Photosynthetica 2009, 47, 112–120. [Google Scholar] [CrossRef]
  34. Appenroth, K.-J.; Stöckel, J.; Srivastava, A.; Strasser, R. Multiple effects of chromate on the photosynthetic apparatus of Spirodela polyrhiza as probed by OJIP chlorophyll a fluorescence measurements. Environ. Pollut. 2001, 115, 49–64. [Google Scholar] [CrossRef] [PubMed]
  35. Chen, S.; Yang, J.; Zhang, M.; Strasser, R.J.; Qiang, S. Classification and characteristics of heat tolerance in Ageratina adenophora populations using fast chlorophyll a fluorescence rise OJIP. Environ. Exp. Bot. 2016, 122, 126–140. [Google Scholar] [CrossRef]
  36. Guo, Y.; Lu, Y.; Goltsev, V.; Strasser, R.J.; Kalaji, H.M.; Wang, H.; Wang, X.; Chen, S.; Qiang, S. Comparative effect of tenuazonic acid, diuron, bentazone, dibromothymoquinone and methyl viologen on the kinetics of Chl a fluorescence rise OJIP and the MR820 signal. Plant Physiol. Biochem. 2020, 156, 39–48. [Google Scholar] [CrossRef]
  37. Oukarroum, A.; Schansker, G.; Strasser, R.J. Drought stress effects on photosystem I content and photosystem II thermotolerance analyzed using Chl a fluorescence kinetics in barley varieties differing in their drought tolerance. Physiol. Plant. 2009, 137, 188–199. [Google Scholar] [CrossRef] [PubMed]
  38. Yusuf, M.A.; Kumar, D.; Rajwanshi, R.; Strasser, R.J.; Tsimilli-Michael, M.; Sarin, N.B. Overexpression of γ-tocopherol methyl transferase gene in transgenic Brassica juncea plants alleviates abiotic stress: Physiological and chlorophyll a fluorescence measurements. Biochim. Biophys. Acta (BBA)-Bioenerg. 2010, 1797, 1428–1438. [Google Scholar] [CrossRef]
  39. Strasser, R.J. Energy pipeline model of the photosynthetic apparatus. In Progress in Photosynthesis Research; Springer: Dordrecht, The Netherlands, 1987; pp. 717–720. [Google Scholar]
  40. Strasser, R.; Eggenberg, P.; Strasser, B. How to work without stress but with fluorescence. Bull. Soc. R. Sci. Liege 1996, 65, 330–349. [Google Scholar]
  41. Krüger, G.H.; Tsimilli-Michael, M.; Strasser, R.J. Light stress provokes plastic and elastic modifications in structure and function of photosystem II in camellia leaves. Physiol. Plant. 1997, 101, 265–277. [Google Scholar] [CrossRef]
  42. Tsimilli-Michael, M.; Eggenberg, P.; Biro, B.; Köves-Pechy, K.; Vörös, I.; Strasser, R. Synergistic and antagonistic effects of arbuscular mycorrhizal fungi and Azospirillum and Rhizobium nitrogen-fixers on the photosynthetic activity of alfalfa, probed by the polyphasic chlorophyll a fluorescence transient OJIP. Appl. Soil Ecol. 2000, 15, 169–182. [Google Scholar] [CrossRef]
  43. Guo, Y.; Zhang, Y.; Lu, Y.; Shi, J.; Chen, S.; Strasser, R.; Qiang, S.; Hu, Z. Special issue in honour of Prof. Reto J. Strasser-Effect of AtLFNR1 deficiency on chlorophyll a fluorescence rise kinetics OJIP of Arabidopsis. Photosynthetica 2020, 58, 206–213. [Google Scholar] [CrossRef]
  44. Lei, Y.-B.; Xia, H.-X.; Chen, K.; Plenković-Moraj, A.; Huang, W.; Sun, G. Photosynthetic regulation in response to fluctuating light conditions under temperature stress in three mosses with different light requirements. Plant Sci. 2021, 311, 111020. [Google Scholar] [CrossRef]
  45. Sung, D.-Y.; Kaplan, F.; Lee, K.-J.; Guy, C.L. Acquired tolerance to temperature extremes. Trends Plant Sci. 2003, 8, 179–187. [Google Scholar] [CrossRef]
  46. Liu, X.; Huang, B. Photosynthetic acclimation to high temperatures associated with heat tolerance in creeping bentgrass. J. Plant Physiol. 2008, 165, 1947–1953. [Google Scholar] [CrossRef]
  47. Schröder, W.P.; Arellano, J.B.; Bittner, T.; Baron, M.; Eckert, H.-J.; Renger, G. Flash-induced absorption spectroscopy studies of copper interaction with photosystem II in higher plants. J. Biol. Chem. 1994, 269, 32865–32870. [Google Scholar] [CrossRef]
  48. Yruela, I.; Gatzen, G.; Picorel, R.; Holzwarth, A.R. Cu (II)-inhibitory effect on photosystem II from higher plants. A picosecond time-resolved fluorescence study. Biochemistry 1996, 35, 9469–9474. [Google Scholar] [CrossRef] [PubMed]
  49. Srivastava, A.; Guissé, B.; Greppin, H.; Strasser, R.J. Regulation of antenna structure and electron transport in photosystem II of Pisum sativum under elevated temperature probed by the fast polyphasic chlorophyll a fluorescence transient: OKJIP. Biochim. Biophys. Acta (BBA)-Bioenerg. 1997, 1320, 95–106. [Google Scholar] [CrossRef]
  50. Strasser, B.J. Donor side capacity of photosystem II probed by chlorophyll a fluorescence transients. Photosynth. Res. 1997, 52, 147–155. [Google Scholar] [CrossRef]
  51. Küpper, H.; Benedikty, Z.; Morina, F.; Andresen, E.; Mishra, A.; Trtílek, M. Analysis of OJIP chlorophyll fluorescence kinetics and QA reoxidation kinetics by direct fast imaging. Plant Physiol. 2019, 179, 369–381. [Google Scholar] [CrossRef] [PubMed]
  52. Tóth, S.Z.; Schansker, G.; Garab, G.; Strasser, R.J. Photosynthetic electron transport activity in heat-treated barley leaves: The role of internal alternative electron donors to photosystem II. Biochim. Biophys. Acta (BBA)-Bioenerg. 2007, 1767, 295–305. [Google Scholar] [CrossRef]
  53. Briantais, J.-M.; Dacosta, J.; Goulas, Y.; Ducruet, J.-M.; Moya, I. Heat stress induces in leaves an increase of the minimum level of chlorophyll fluorescence, Fo: A time-resolved analysis. Photosynth. Res. 1996, 48, 189–196. [Google Scholar] [CrossRef] [PubMed]
  54. Havaux, M.; Greppin, H.; Strasser, R.J. Functioning of photosystems I and II in pea leaves exposed to heat stress in the presence or absence of light. Planta 1991, 186, 88–98. [Google Scholar] [CrossRef]
  55. Schansker, G.; Srivastava, A.; Strasser, R.J. Characterization of the 820-nm transmission signal paralleling the chlorophyll a fluorescence rise (OJIP) in pea leaves. Funct. Plant Biol. 2003, 30, 785–796. [Google Scholar] [CrossRef] [PubMed]
  56. Schansker, G.; Tóth, S.Z.; Strasser, R.J. Methylviologen and dibromothymoquinone treatments of pea leaves reveal the role of photosystem I in the Chl a fluorescence rise OJIP. Biochim. Biophys. Acta (BBA)-Bioenerg. 2005, 1706, 250–261. [Google Scholar] [CrossRef] [PubMed]
  57. Xia, H.; Chen, K.; Liu, L.; Plenkovic-Moraj, A.; Sun, G.; Lei, Y. Photosynthetic regulation in fluctuating light under combined stresses of high temperature and dehydration in three contrasting mosses. Plant Sci. 2022, 323, 111379. [Google Scholar] [CrossRef] [PubMed]
  58. Ren, H.; Huang, R.; Li, Y.; Li, W.; Zheng, L.; Lei, Y.; Chen, K. Photosynthetic regulation in response to strontium stress in moss Racomitrium japonicum L. Environ. Sci. Pollut. Res. 2022, 30, 20923–20933. [Google Scholar] [CrossRef]
  59. Gitelson, A.A.; Gritz, Y.; Merzlyak, M.N. Relationships between leaf chlorophyll content and spectral reflectance and algorithms for non-destructive chlorophyll assessment in higher plant leaves. J. Plant Physiol. 2003, 160, 271–282. [Google Scholar] [CrossRef]
  60. Dimitrova, S.; Paunov, M.; Pavlova, B.; Dankov, K.; Kouzmanova, M.; Velikova, V.; Tsonev, T.; Kalaji, H.; Goltsev, V. Photosynthetic efficiency of two Platanus orientalis L. ecotypes exposed to moderately high temperature–JIP-test analysis. Photosynthetica 2020, 58, 657–670. [Google Scholar] [CrossRef]
Figure 1. Cell morphology in R. japonicum measured at different strontium concentrations (0, 5, 50, 500 mg/L).
Plants 13 00591 g001
Figure 2. Chl a fluorescence rise kinetics of R. japonicum at different strontium concentrations (0, 5, 50, 500 mg/L). (A) shows it is normalized by FO and FM as Vt = (FtFO)/(FMFO) and ΔVt = Vt (treatment) − Vt (control) in a logarithmic time scale. (B) shows the original kinetics. Each value of point in curve represents the average of 20 measurements.
Plants 13 00591 g002
Figure 3. Fluorescence rise kinetics normalized by FO and FK as WOK = (FtFO)/(FKFO), (A) and the value of ΔWL as ΔWL = (F150µsFO)/(FJFO), (B) in a linear time scale from 0 to 300 μs of R. japonicum at different strontium concentrations (0, 5, 50, 500 mg/L). Each curve represents the average of 20 measurements.
Plants 13 00591 g003
Figure 4. Fluorescence rise kinetics normalized by FO and FJ as WOJ = (FtFO)/(FJFO), (A) and the difference kinetics ΔWOJ = WOJ (treatment) − WOJ (control), (B) in a linear time scale from 0 to 2 ms of R. japonicum at different strontium concentrations (0, 5, 50, 500 mg/L). Each curve represents the average of 20 measurements.
Plants 13 00591 g004
Figure 5. Fluorescence rise kinetics normalized by FO and FI as WOI = (FtFO)/(FIFO), the difference kinetics ΔWOI = WOI (treatment) − WOI (control) (A) and normalized by FI and FP (FM) as WIP = (FtFI)/(FPFI); in a logarithmic time scale of R. japonicum at different strontium concentrations (0, 5, 50, 500 mg/L). WIP = 0.5 is the half-time of the rising curves (B). Each curve represents the average of 20 measurements.
Plants 13 00591 g005
Figure 6. Comparison of PSII behavior at various strontium concentrations. The PSII behavior illustrates the phenomenological energy fluxes (per excited cross-section, denoted as CSM) in the leaf model (ac). The width of each arrow corresponds to the value of the representative energy flux, with reaction centers per cross-section (RC/CSM) represented by small circles. The white circles represent active reaction centers per cross-section (RC/CSM), while the black cir-cles represent inactivated ones.The darkness of the leaf area, indicating chlorophyll density, provides additional visualization of the ABS/CSM flux.
Plants 13 00591 g006
Figure 7. Spider plot presenting several JIP-test parameters quantifying PSII structure and function of the photosynthetic apparatus in R. japonicum at 5, 50, 500 mg/L strontium concentrations. Each parameter is expressed as a fraction relative to 0 mg/L values.
Plants 13 00591 g007
Figure 8. The rate (ETRI–ETRII) (A) and size (YCEF) of electron transfer, (B) in R. japonicum at 0, 5, 50, 500 mg/L strontium concentration. Data are the mean ± SD (n = 4).
Plants 13 00591 g008
Figure 9. Setup diagram for chlorophyll fluorescence kinetic measurement.
Plants 13 00591 g009
Table 1. Chlorophyll content in R. japonicum measured at varying strontium concentrations.
Treatment
(Sr2+ mg/L)
Chl
(mg/g)
Chl a
(mg/g)
Chl b
(mg/g)
0101.00 ± 1.06 a69.68 ± 0.96 a31.33 ± 0.10 a
5106.51 ± 0.35 a74.50 ± 0.23 a32.01 ± 0.13 a
5067.50 ± 2.47 b46.35 ± 2.12 b21.15 ± 0.35 b
50066.10 ± 3.57 b47.07 ± 2.97 b19.03 ± 0.62 b
Note: Significant differences denoted by letters (a and b) at p < 0.05 exist between Sr treatment group in moss (LSD test). Data are the mean ± SD (n = 4).
Disclaimer/Publisher’s Note: The statements, opinions and data contained in all publications are solely those of the individual author(s) and contributor(s) and not of MDPI and/or the editor(s). MDPI and/or the editor(s) disclaim responsibility for any injury to people or property resulting from any ideas, methods, instructions or products referred to in the content.

