

Low Diversity and High Genetic Structure for Platonia insignis Mart., an Endangered Fruit Tree Species
 , , , , , , , , , and
Abstract
:1. Introduction
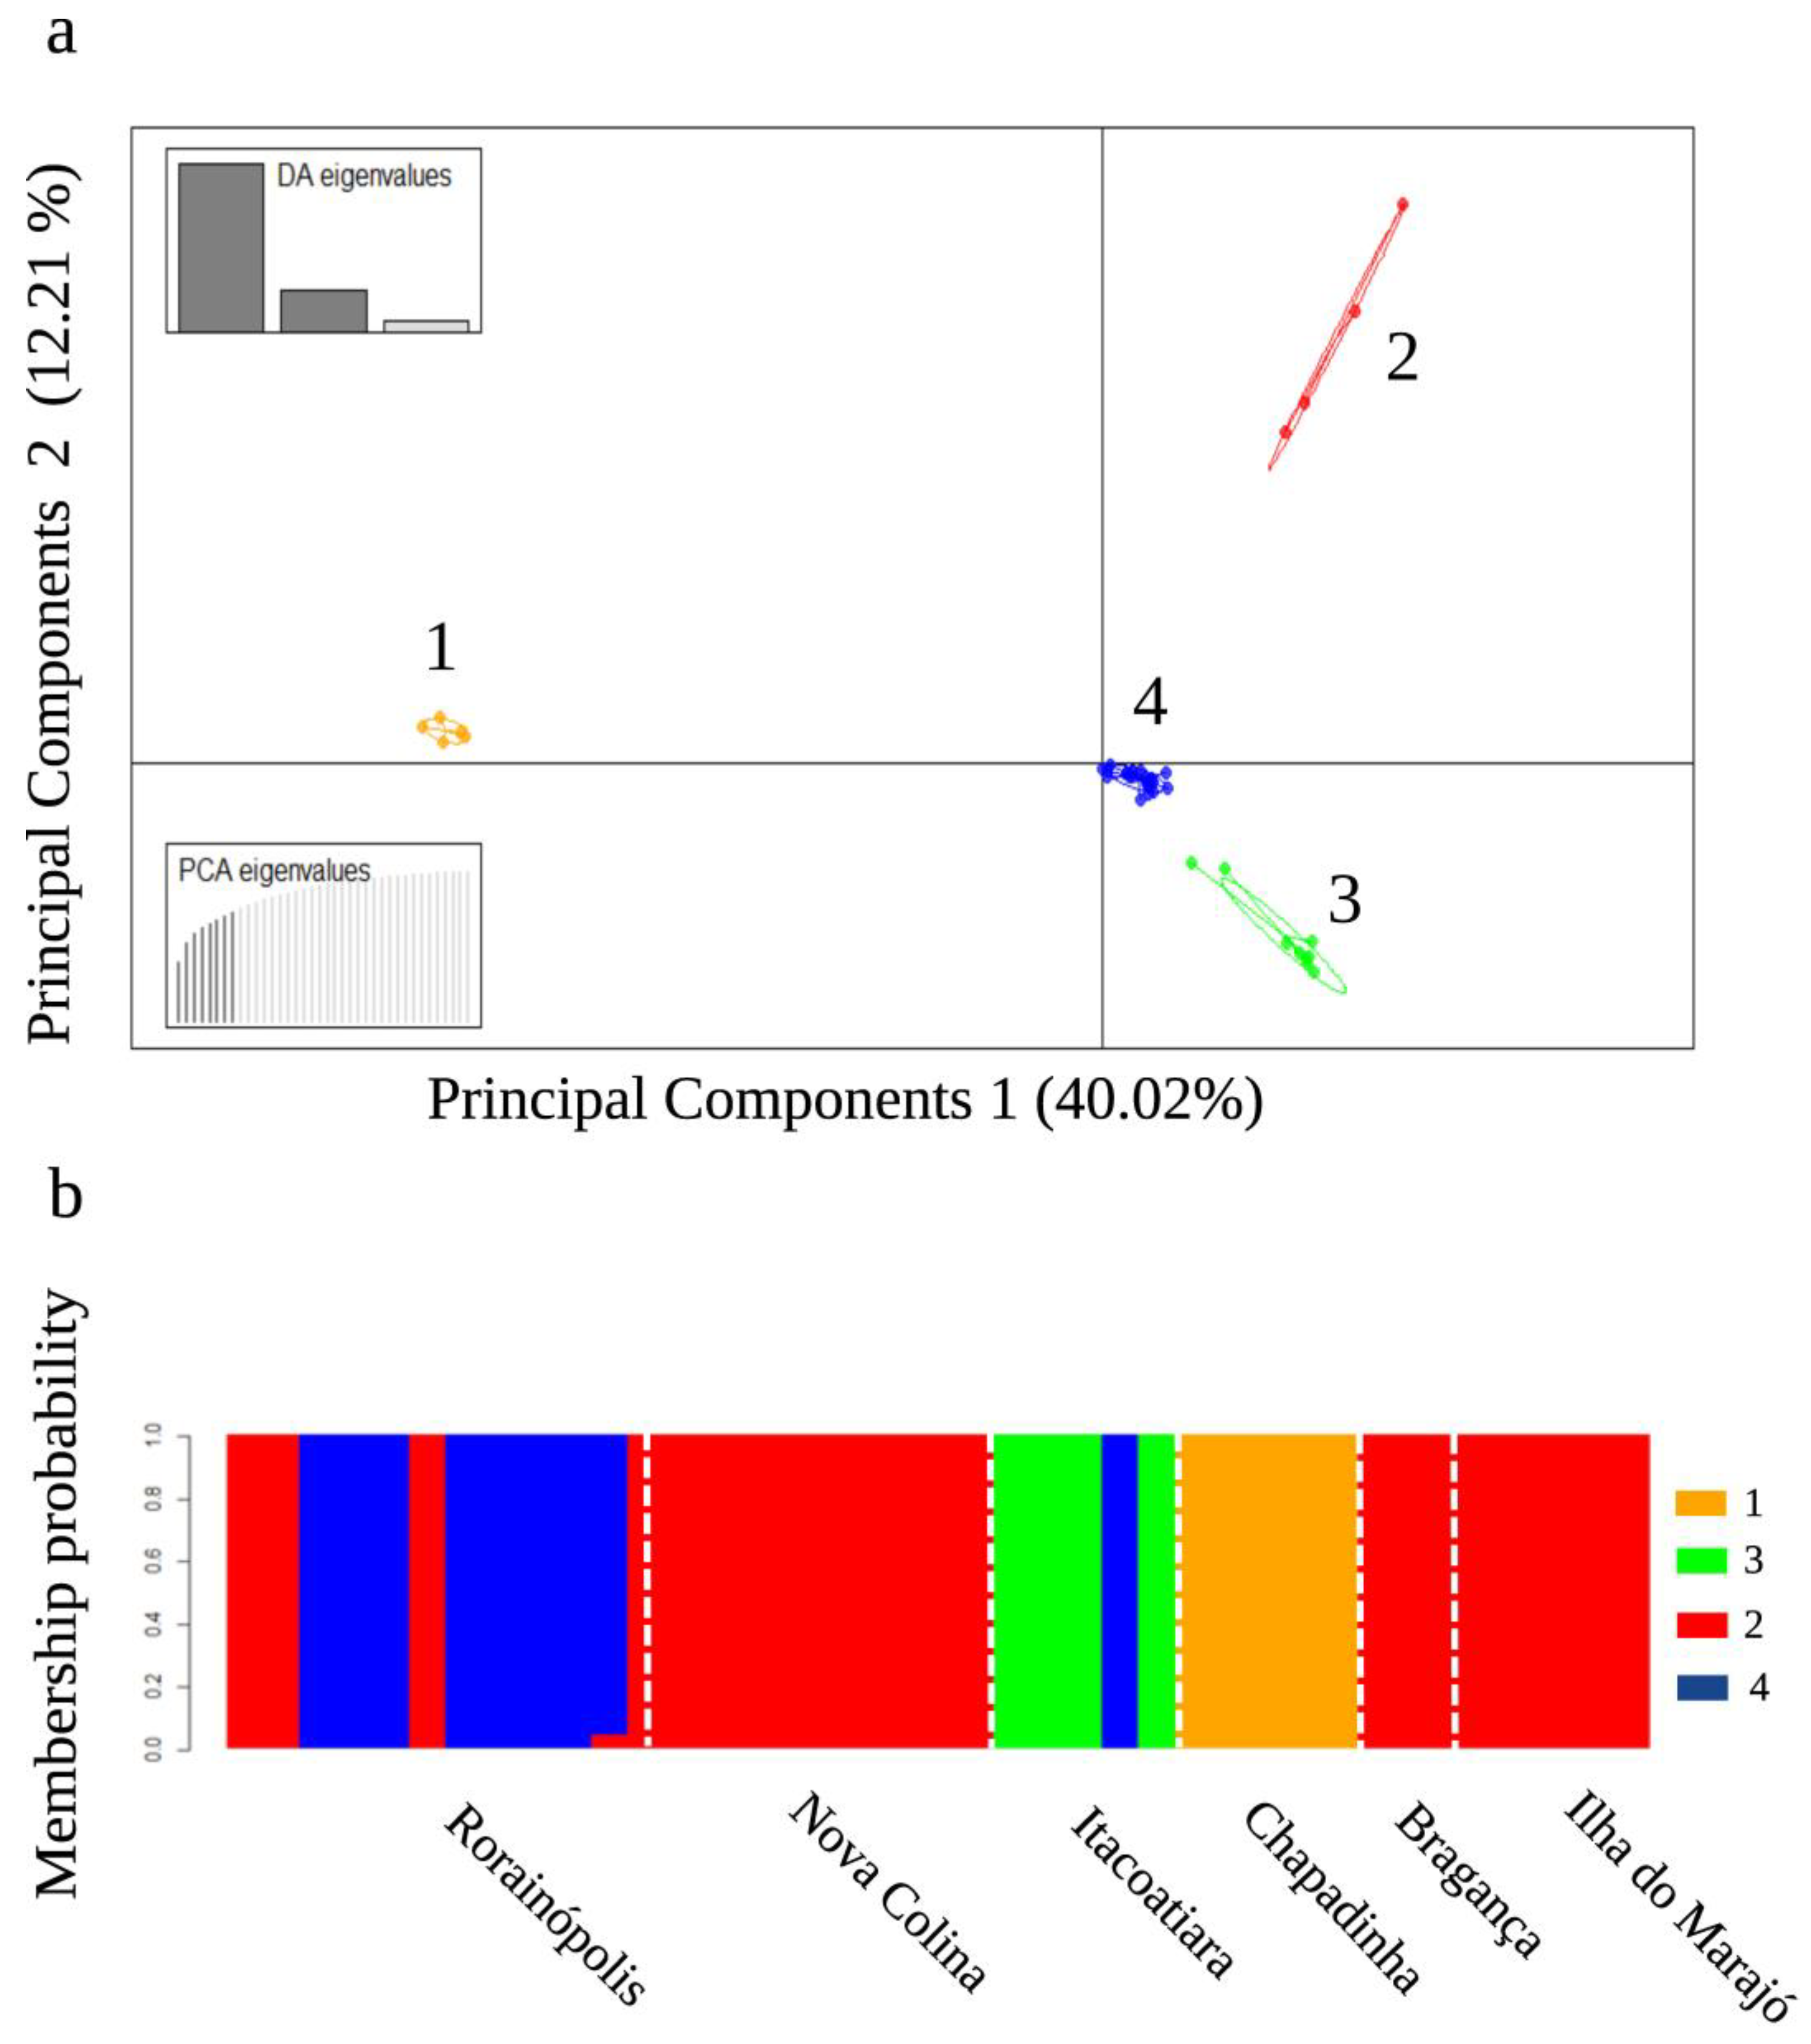
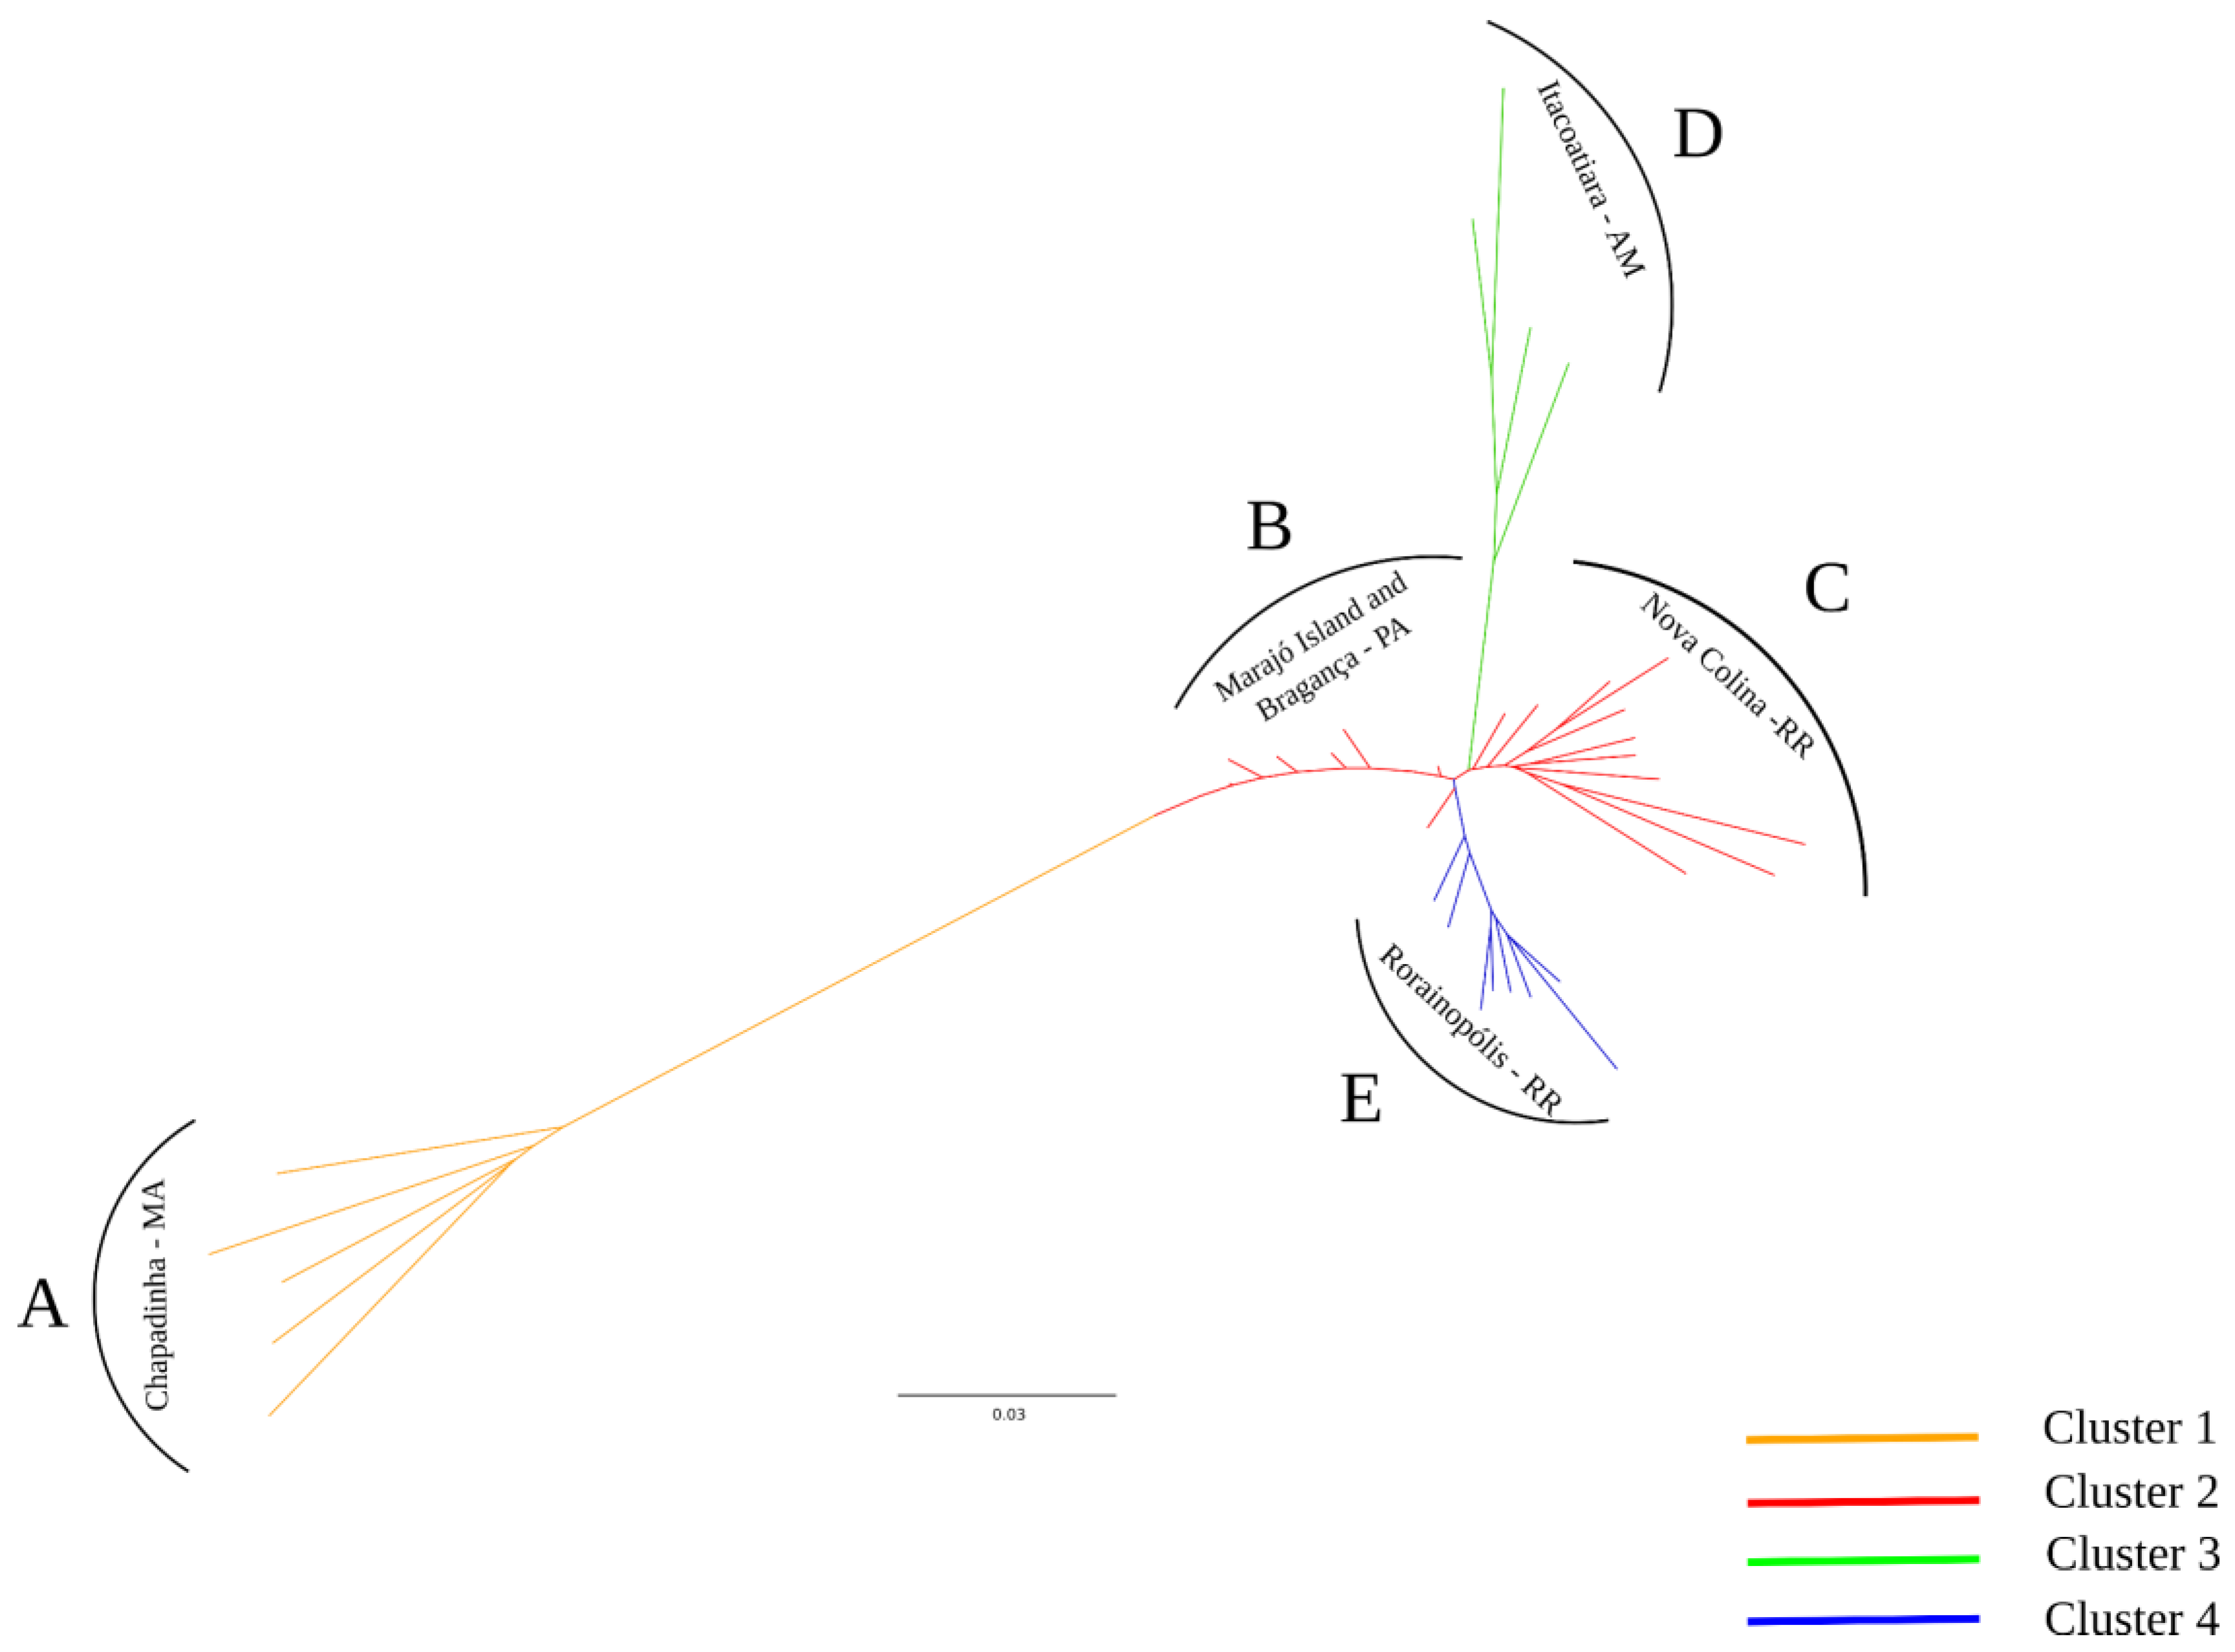
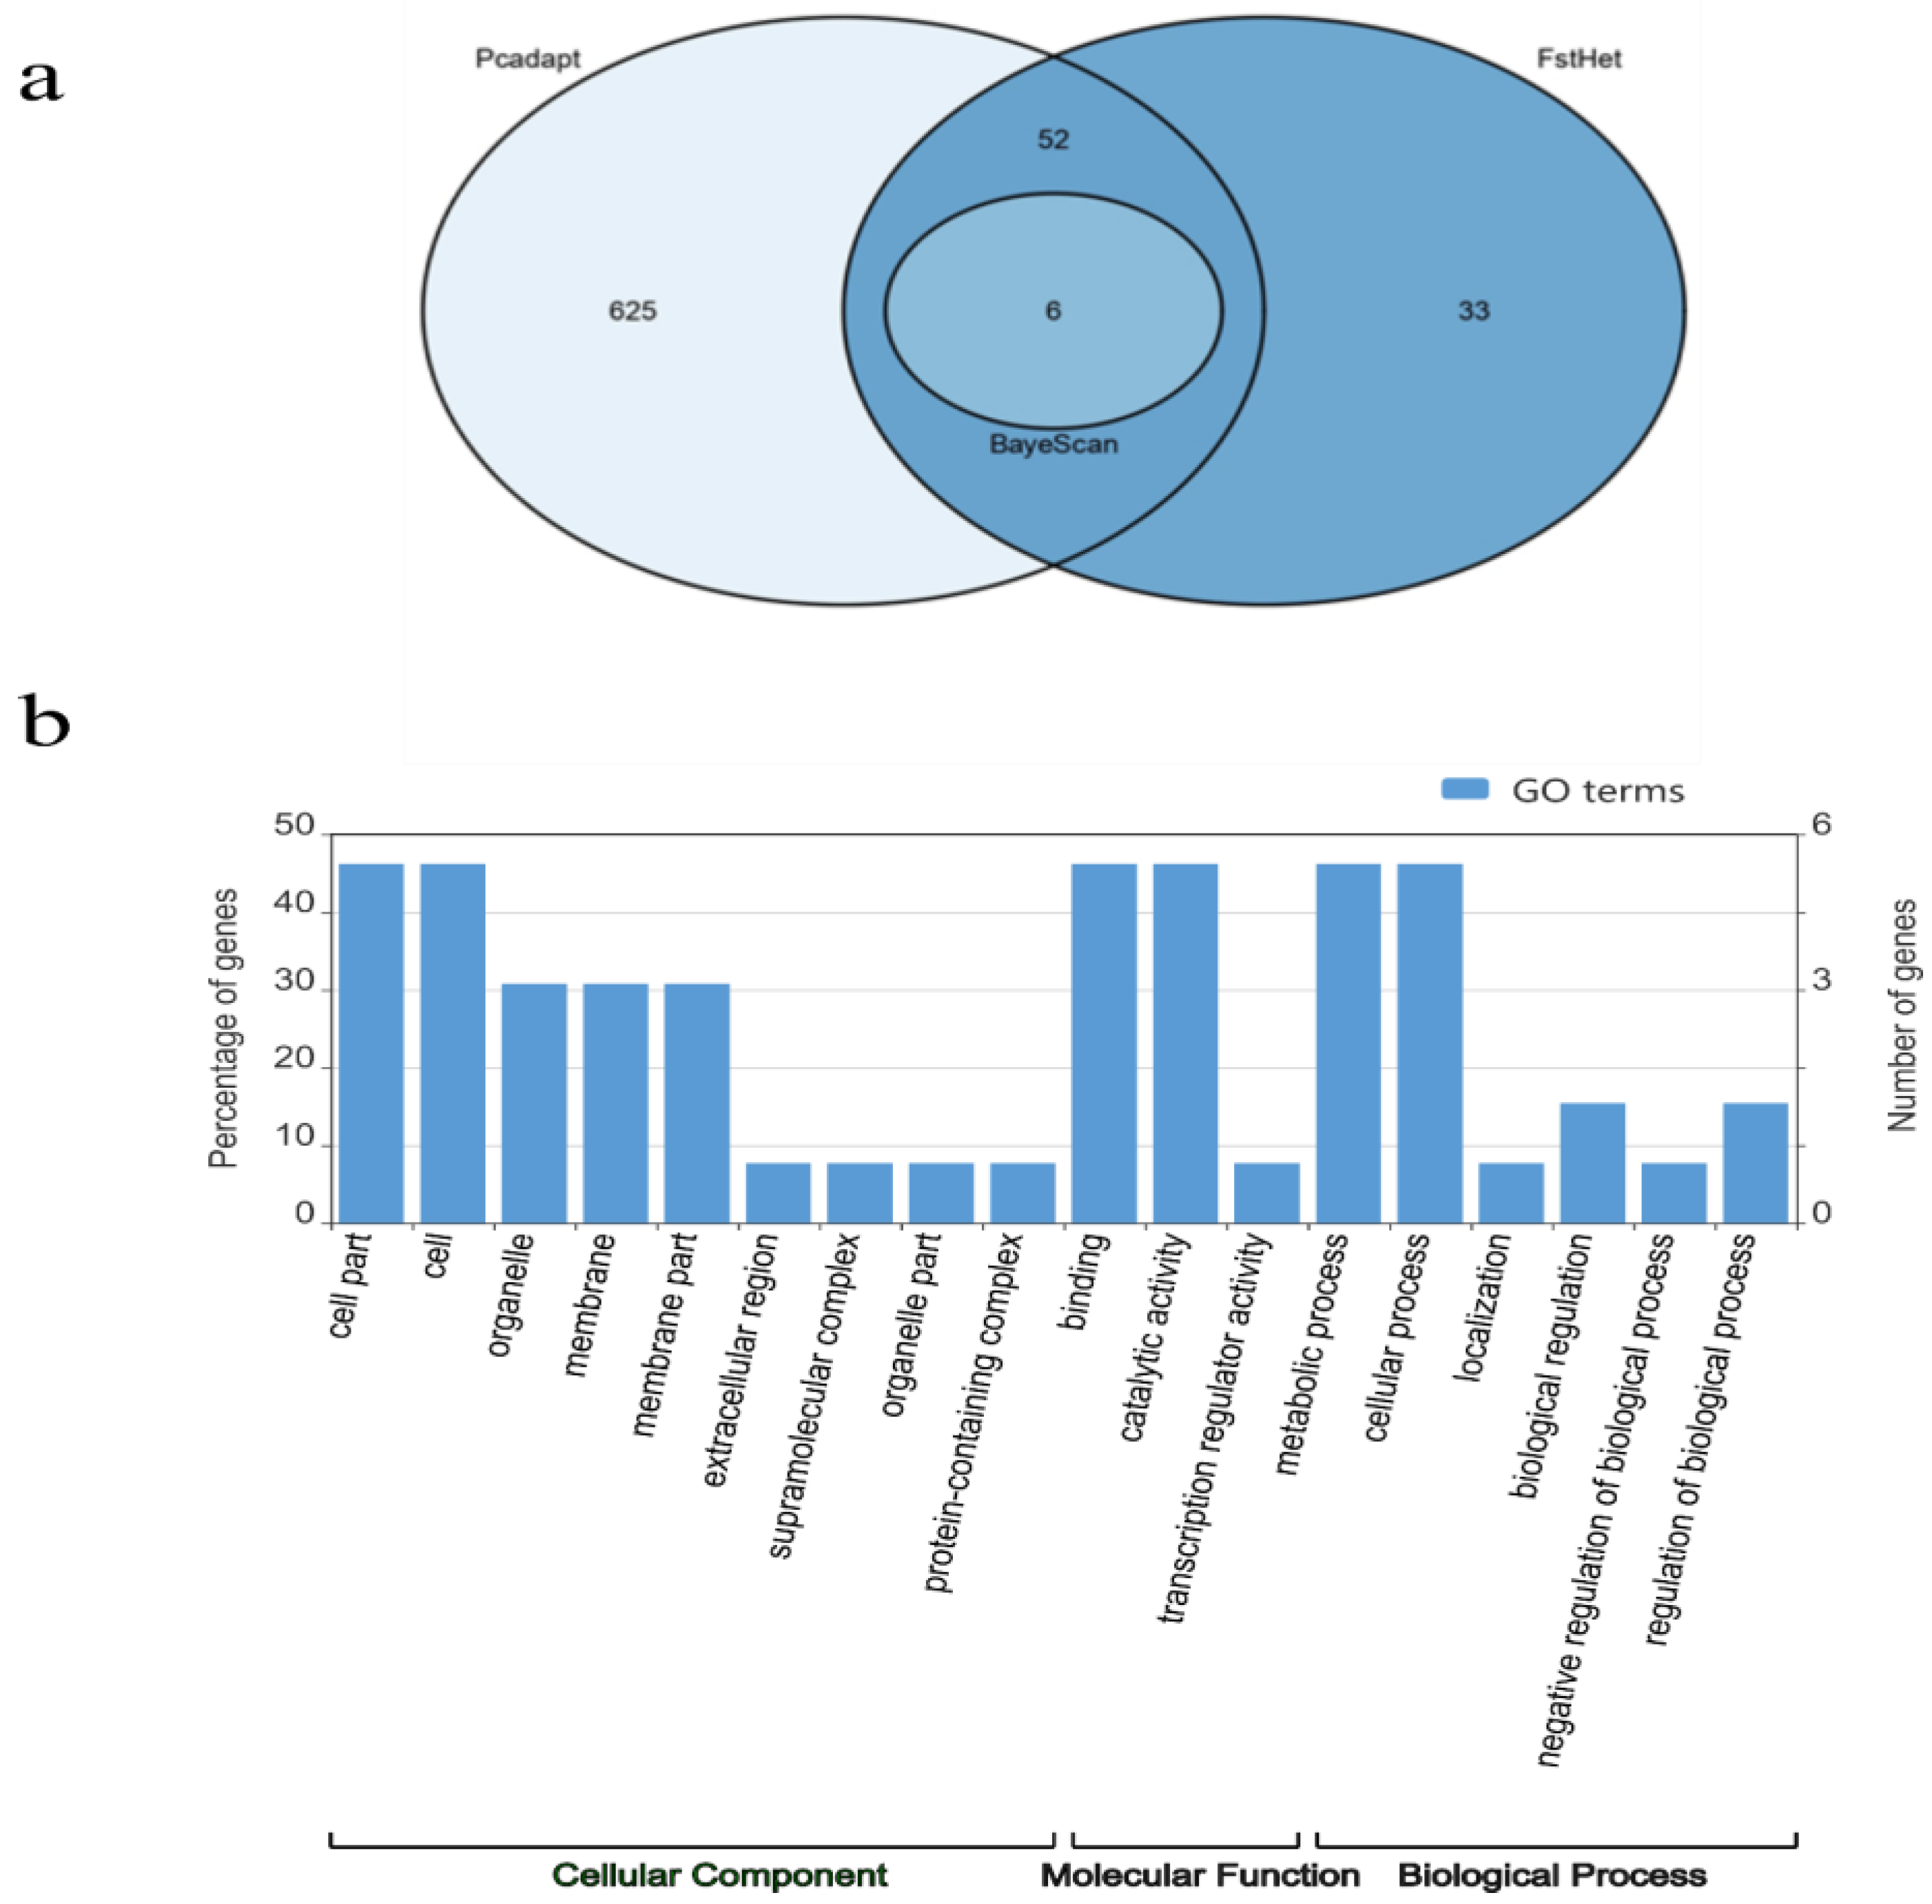
2. Results
2.1. Genetic Diversity and Population Structure of Bacurizeiro
2.2. Outlier Loci Analysis
3. Discussion
3.1. Genetic Diversity and Structure among the Bacurizeiro Sampled Locations
3.2. Outlier Loci
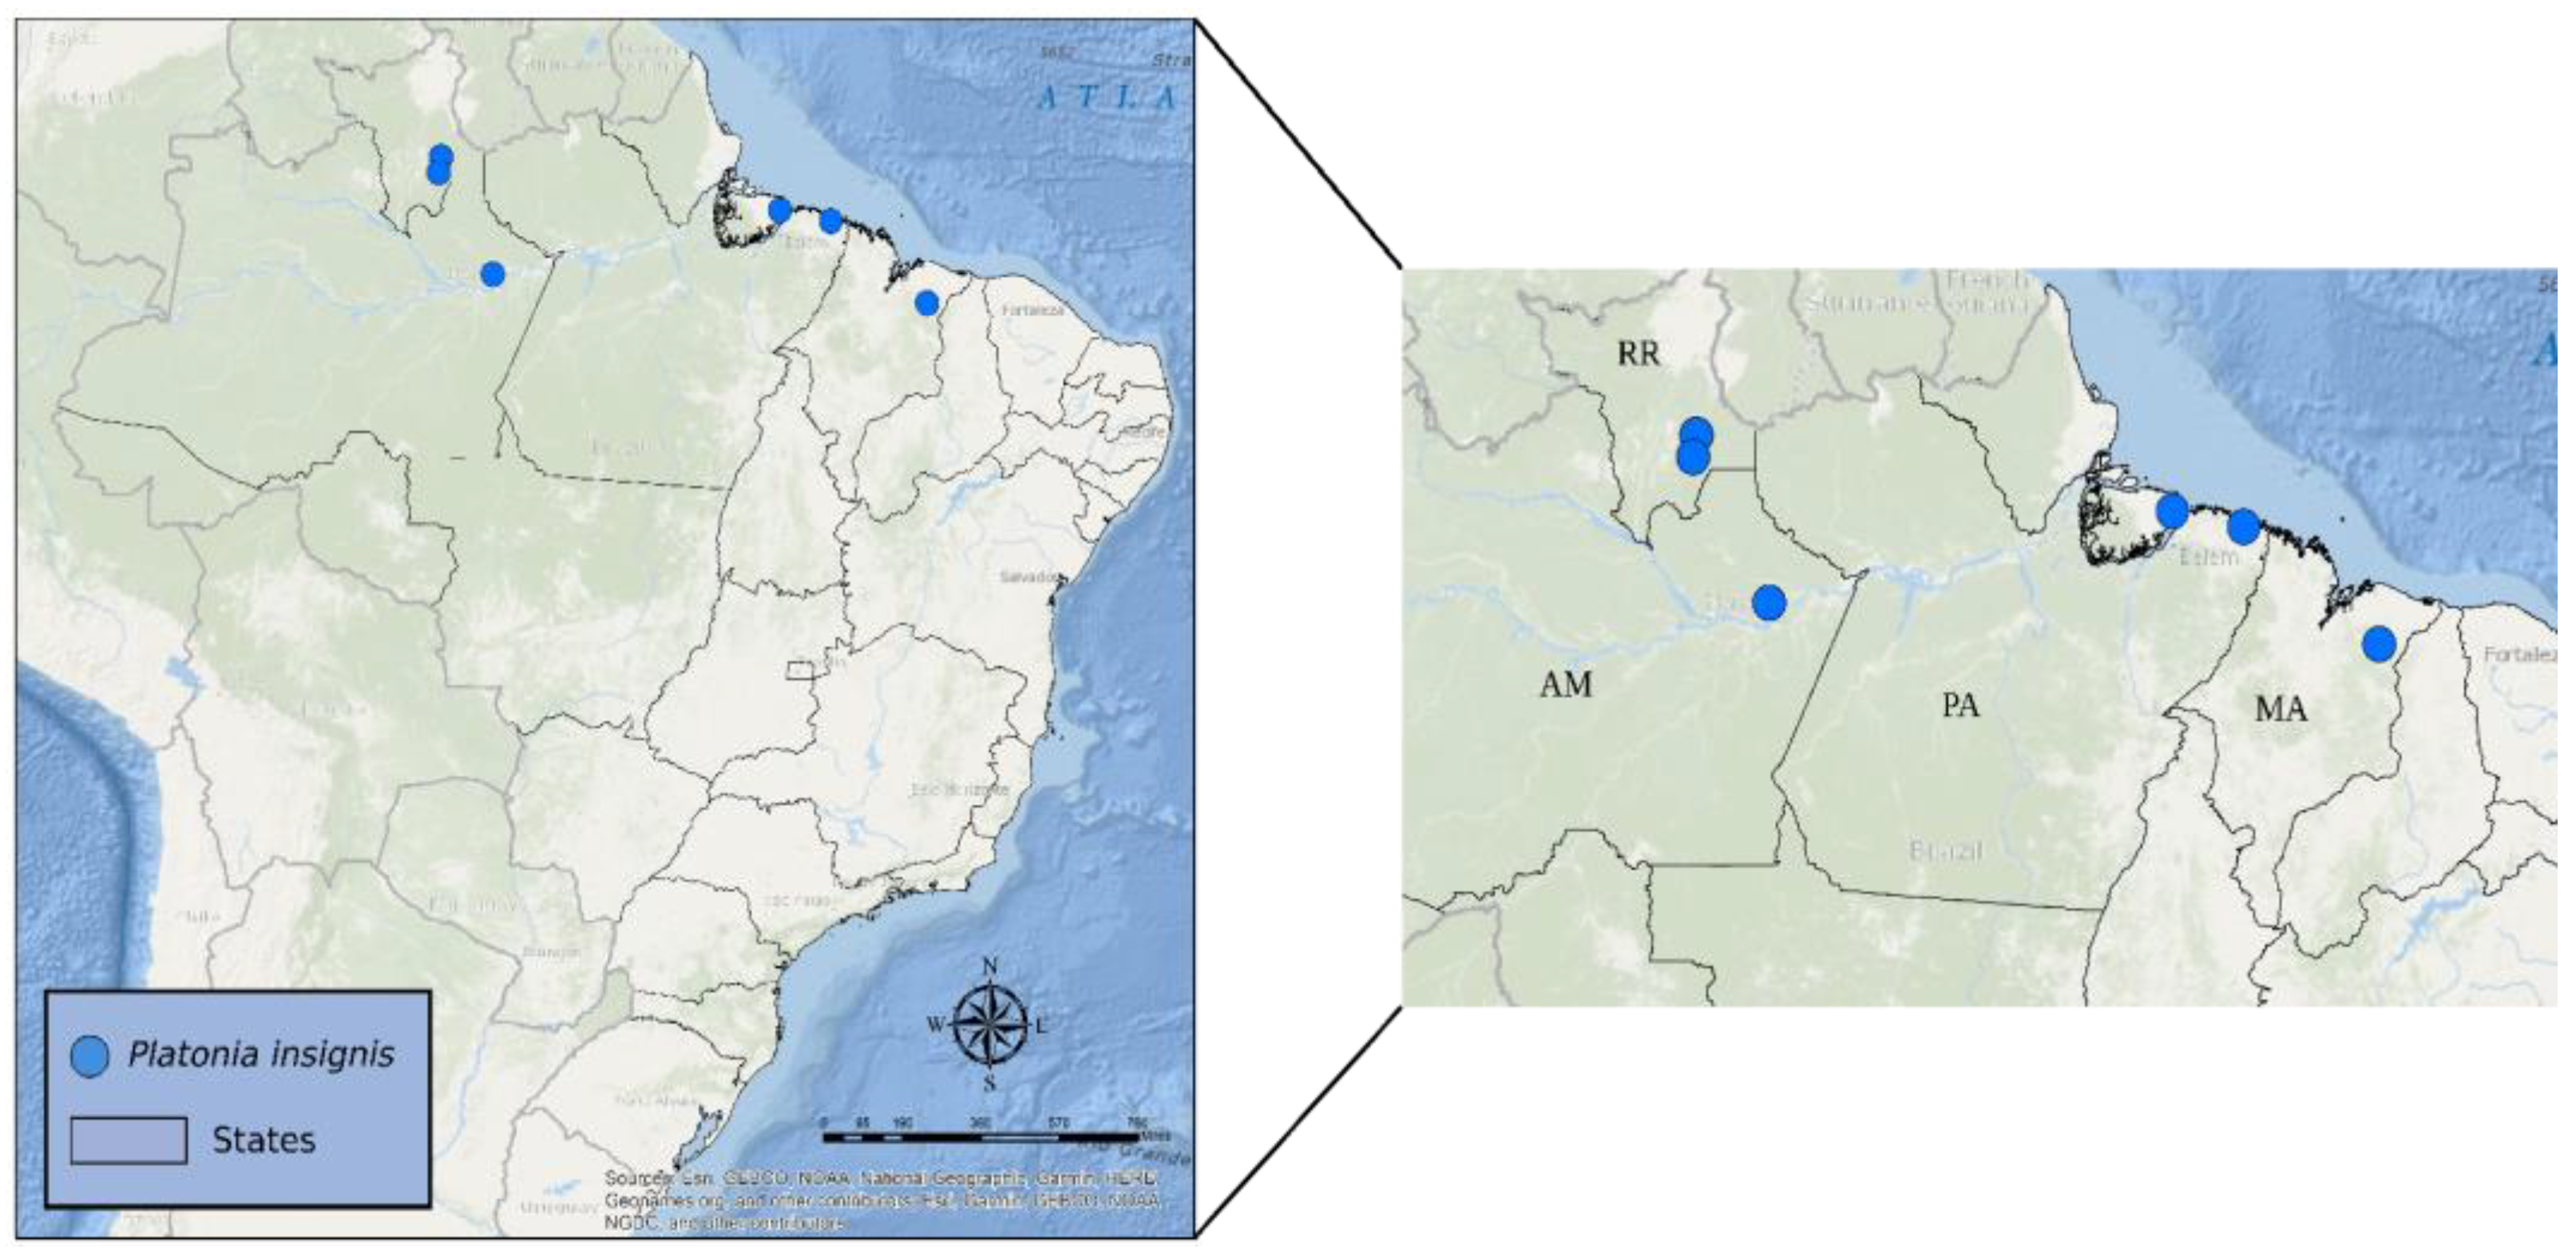
4. Materials and Methods
4.1. Sampling, DNA Extraction and Quantification
4.2. Assembly of the Genomic Library and SNP Identification
4.3. Identification of Outlier Loci
4.4. Statistical Analyses
5. Conclusions
Supplementary Materials
Author Contributions
Funding
Data Availability Statement
Acknowledgments
Conflicts of Interest
References
- Souza, I.D.B.; Souza, V.A.B.; Lima, P.S.C. Molecular characterization of Platonia insignis Mart. (“Bacurizeiro”) using inter simple sequence repeat (ISSR) markers. Mol. Biol. Rep. 2013, 40, 3835–3845. [Google Scholar] [CrossRef]
- Clement, C.R.; Venturieri, G.A. Bacuri and cupuaçu. In Fruits of Tropical and Subtropical Origin: Composition, Properties and Uses; Nagy, S., Shaw, P.E., Wardowsky, W., Eds.; Florida Science Source Inc.: Lake Alfred, Florida, FL, USA, 1990; pp. 178–192. [Google Scholar]
- Rufino, M.S.M.; Alves, R.E.; Brito, E.S.; Pérez-Jiménez, J.; Saura-Calixto, F.; Mancini-Filho, J. Bioactive compounds and antioxidant capacities of 18 non-traditional tropical fruits from Brazil. Food Chem. 2010, 121, 996–1002. [Google Scholar] [CrossRef]
- Araújo, N.M.P.; Arruda, H.S.; Marques, D.R.P.; Oliveira, W.Q.; Pereira, G.A.; Pastore, G.M. Functional and nutritional properties of selected Amazon fruits: A review. Food Res. Int. 2021, 147, 110520. [Google Scholar] [CrossRef]
- Clement, C.R. 1492 and the loss of Amazonian crop genetic resources. II. Crop biogeography at contact. Econ. Bot. 1999, 53, 203–216. [Google Scholar] [CrossRef]
- Cronquist, A. An Integrated System of Classification of Flowering Plants; Columbia University Press: New York, NY, USA, 1981; pp. 248–250. Available online: https://www.jstor.org/stable/2806386 (accessed on 12 November 2023).
- Cavalcante, P.B. Frutas Comestíveis da Amazônia, 6th ed.; CNPq/Museu Paraense Emílio Goeldi: Belém, Brazil, 1996; 279p. Available online: https://repositorio.museu-goeldi.br/handle/mgoeldi/896 (accessed on 7 July 2023).
- Carvalho, J.E.U.; Nascimento, W.M.O. Bacuri: Platonia insignis. Embrapa Amazônia Oriental-Fôlder/Folheto/Cartilha (INFOTECA-E); Embrapa Eastern Amazonia: Belém, Brazil, 2017; Available online: https://www.embrapa.br/en/busca-de-publicacoes/-/publicacao/1096245/bacuri-platonia-insignis (accessed on 23 January 2023).
- Aniceto, A.; Porte, A.; Montenegro, J.; Cadena, R.S.; Teodoro, A.J. A review of the fruit nutritional and biological activities of three Amazonian species: Bacuri (Platonia insignis), murici (Byrsonima spp.), and taperebá (Spondias mombin). Fruits 2017, 72, 317–326. [Google Scholar] [CrossRef]
- Shanley, P.; Clement, C.R.; Carvalho, J.E.U.; Homma, A.K.O.; Menezes, A.J.E.A. Amazonian fruits: How farmers nurture nutritional diversity on farm and in the forest. In Tropical Fruit Tree Diversity: Good Practices for in situ and on-Farm Conservation; Sthapit, B., Lamers, H.A.H., Rao, V.R., Bailey, A., Eds.; EarthScan/Routledge & Bioversity International: Abingdon, UK, 2016; pp. 147–160. Available online: https://repositorio.inpa.gov.br/handle/1/33985 (accessed on 25 January 2023).
- Souza, V.A.B.; Vasconcelos, L.F.L.; Araújo, E.C.E. Recursos Genéticos do Bacurizeiro na Região Meio Norte do Brasil. In Bacurizeiro: Agrobiodiversidade; IICA: São Luís, Brazil, 2007; pp. 65–101. [Google Scholar]
- Silva Junior, J.F.; Souza, F.V.D.; Pádua, J.G. A Arca de Noé Das Frutas Nativas Brasileiras; Embrapa: Brasília, DF, Brazil, 2021; Available online: https://ainfo.cnptia.embrapa.br/digital/bitstream/item/227633/1/A-arca-de-Noe-das-frutas-nativas-brasileiras-versao-10.pdf (accessed on 29 June 2023).
- Souza, I.G.; Souza, V.A.B.; Damasceno, K.J.; Costa Lima, P.S. Multivariate analysis of ‘bacuri’ reproductive and vegetative morphology. Comun. Sci. 2016, 7, 232–240. [Google Scholar] [CrossRef]
- Poland, J.A.; Brown, P.J.; Sorrells, M.E.; Jannink, J.L. Development of high-density genetic maps for barley and wheat using a novel two-enzyme genotyping-by-sequencing approach. PLoS ONE 2012, 7, e32253. [Google Scholar] [CrossRef] [PubMed]
- Davey, J.W.; Blaxter, M.L. RADSeq: Next-generation location genetics. Brief Funct. Genomics 2010, 9, 416–423. [Google Scholar] [CrossRef] [PubMed]
- Willing, E.M.; Dreyer, C.; Van Oosterhout, C. Estimates of genetic differentiation measured by F ST do not necessarily require large sample sizes when using many SNP markers. PLoS ONE 2012, 7, e42649. [Google Scholar] [CrossRef] [PubMed]
- Hohenlohe, P.A.; Bassham, S.; Etter, P.D.; Stiffler, N.; Johnson, E.A.; Cresko, W.A. Population genomics of parallel adaptation in threespine stickleback using sequenced RAD tags. PLoS Genet. 2010, 6, e1000862. [Google Scholar] [CrossRef] [PubMed]
- Davey, J.W.; Hohenlohe, P.A.; Etter, P.D.; Boone, J.Q.; Catchen, J.M.; Blaxter, M.L. Genome-wide genetic marker discovery and genotyping using next-generation sequencing. Nat. Rev. Genet. 2011, 12, 499–510. [Google Scholar] [CrossRef] [PubMed]
- Kohn, M.H.; Murphy, W.J.; Ostrander, E.A.; Wayne, R.K. Genomics and conservation genetics. Trends Ecol. Evol. 2006, 21, 629–637. [Google Scholar] [CrossRef] [PubMed]
- Pontes, L.C.G.; Moura, E.F.; Moura, M.F.; Rodrigues, S.D.M.; Oliveira, M.D.S.P.D.; Carvalho, J.E.U.D.; Therrier, J. Molecular characterization of progenies of bacurizeiro (Platonia insignis) from Marajó Island, northeastern Amazon. Acta Amazon. 2017, 47, 293–300. [Google Scholar] [CrossRef]
- Santos, E.M.; Monteiro Neto, C.A.S.; Nascimento, C.A.J.; Muniz, F.H.; Barros, J.R.S. Genetic and population diversity of bacuri (Platonia insignis Mart.) in Chapada Limpa Extractive Reserve, Maranhão State, Brazil. Afr. J. Biotechnol. 2017, 16, 2317–2325. [Google Scholar] [CrossRef]
- Pena, D.N.; Moura, E.F.; Rodrigues, S.M.; Oliveira, M.S.P.; Sanches, J.P.; Moura, M.F. Molecular characterization of a germplasm bank of Platonia insignis Mart.: A fruit tree. Genet. Resour. Crop Evol. 2020, 67, 411–420. [Google Scholar] [CrossRef]
- Paraense, L.C.R.; Pena, D.N.; Darnet, S.H.; Rodrigues, S.M.; Menezes, I.C.; Moura, E.F. First genomic microsatellite markers developed for Platonia insignis (Clusiaceae), a Brazilian fruit tree. Mol. Biol. Rep. 2020, 47, 2985–2989. [Google Scholar] [CrossRef]
- Nascimento, W.F.; Dequigiovanni, G.; Ramos, S.L.F.; Bertocco, C.G.; Veasey, E.A. Nuclear and chloroplast microsatellites reveal high genetic diversity and structure in Platonia insignis Mart., an endangered species native to the Brazilian Amazon. Acta Bot. Brasilica 2021, 35, 423–444. [Google Scholar] [CrossRef]
- Saraiva, R.C.; Albuquerque, P.C.; Girnos, E.C. Floral and vegetative morphometrics of three Platonia insignis Mart. (Clusiaceae) populations, a native tree from the Brazilian Amazon. Plant Biosyst. Int. J. Dealing Asp. Plant Biol. 2014, 148, 666–674. [Google Scholar] [CrossRef]
- Neves, E.J.; Martins, E.G.; Reissmann, C.B. Deposição de serrapilheira e de nutrientes de duas espécies da Amazônia. Bol. Pesqui. Flor. 2001, 43, 47–60. Available online: https://ainfo.cnptia.embrapa.br/digital/bitstream/CNPF-2009-09/30232/1/neves.pdf (accessed on 14 July 2023).
- Brito, F.A.; Zucchi, M.I.; Pinheiro, J.B.; Arrigoni-Blank, M.F.; Dequigiovanni, G.; Grando, C.; Batista, C.E.; Alves-Pereira, A.; Blank, A.F. Low diversity in the native populations of Croton tetradenius Baill. when using SNP markers: A future crop with an insecticidal activity. Genet. Resour. Crop Evol. 2021, 68, 3145–3159. [Google Scholar] [CrossRef]
- Warschefsky, E.J.; von Wettberg, E.J.B. Population genomic analysis of mango (Mangifera indica) suggests a complex history of domestication. New Phytol. 2019, 222, 2023–2037. [Google Scholar] [CrossRef]
- Homma, A.K.O.; Carvalho, J.E.U.; Menezes, A.J.E.A. Bacuri: Fruta amazônica em ascensão. Ciênc. Hoje 2010, 46, 40–45. Available online: https://ainfo.cnptia.embrapa.br/digital/bitstream/item/25022/1/homma-bacuri.pdf (accessed on 12 November 2023).
- Maués, M.M.; Venturieri, G.C. PolIination ecology of Platonia insignis Mart. (Clusiaceae), a fruit tree from Eastern Amazon region. Acta Hortic. 1997, 437, 255–259. [Google Scholar] [CrossRef]
- Morelli, F.; Setzer, A.; Jesus, S.C. Focos de queimadas nas unidades de conservação e terras indígenas do pantanal 2000–2008. Geografia 2009, 34, 681–695. Available online: https://www.geopantanal.cnptia.embrapa.br/publicacoes/2geo/Cap-5.pdf (accessed on 11 August 2023).
- Homma, A.K.O.; Menezes, A.J.E.A.; Carvalho, J.E.U.; Matos, G.B. Manejo e plantio de bacurizeiros (Platonia insignis Mart.): A experiência no manejo e domesticação de um recurso da biodiversidade amazônica. Inclusão Social 2018, 12, 48–57. Available online: https://revista.ibict.br/inclusao/article/view/4392 (accessed on 20 August 2023).
- Souza, I.G.B. Caracterização Morfológica e Molecular do Bacurizeiro (Platonia insignis Mart.). Master’s Thesis, Federal University of Piauí, Teresina, Brazil, 2011. [Google Scholar]
- Barrett, S.C.; Ness, R.W.; Vallejo-Marín, M. Evolutionary pathways to self-fertilization in a tristylous plant species. New Phytol. 2009, 183, 546–556. [Google Scholar] [CrossRef] [PubMed]
- Azambuja, A. Interações Entre Platonia insignis (Clusiaceae) e a Avifauna Visitante Floral no Cerrado do Maranhão. Master’s Thesis, State University of Campinas, Campinas, Brazil, 2008. [Google Scholar]
- Homma, A.K.O.; Carvalho, J.E.U.; Matos, G.B.; Menezes, A.J.E.A. Manejando a planta e o homem: Os bacurizeiros do nordeste paraense e da Ilha de Marajó. Amazônia Ci. Desenv. 2007, 2, 119–135. Available online: https://ainfo.cnptia.embrapa.br/digital/bitstream/item/30437/1/ManejandoPlantaHomem.pdf (accessed on 20 July 2023).
- Di Sacco, A.; Hardwick, K.A.; Blakesley, D.; Brancalion, P.H.; Breman, E.; Rebola, L.C.; Chomba, S.; Dixon, K.; Elliott, S.; Ruyonga, G.; et al. Ten golden rules for reforestation to optimize carbon sequestration, biodiversity recovery and livelihood benefits. Glob. Chang. Biol. 2021, 27, 1328–1348. [Google Scholar] [CrossRef] [PubMed]
- Alves-Pereira, A.; Zucchi, M.I.; Clement, C.R.; Viana, J.P.G.; Pinheiro, J.B.; Veasey, E.A.; de Souza, A.P. Selective signatures and high genome-wide diversity in traditional Brazilian manioc (Manihot esculenta Crantz) varieties. Sci. Rep. 2022, 12, 1268. [Google Scholar] [CrossRef] [PubMed]
- Li, W.; Pang, S.; Lu, Z.; Jin, B. Function and mechanism of WRKY transcription factors in abiotic stress responses of plants. Plants 2020, 9, 1515. [Google Scholar] [CrossRef]
- Castelán-Muñoz, N.; Herrera, J.; Cajero-Sánchez, W.; Arrizubieta, M.; Trejo, C.; García-Ponce, B.; Garay-Arroyo, A. MADS-box genes are key components of genetic regulatory networks involved in abiotic stress and plastic developmental responses in plants. Front. Plant Sci. 2019, 10, 853. [Google Scholar] [CrossRef] [PubMed]
- Zhang, H.; Zhu, J.; Gong, Z.; Zhu, J.K. Abiotic stress responses in plants. Nat. Rev. Genet. 2022, 23, 104–119. [Google Scholar] [CrossRef]
- Clark, G.; Tripathy, M.K.; Roux, S.J. Growth regulation by apyrases: Insights from altering their expression level in different organisms. Plant Physiol. 2023, 194, 1323–1335. [Google Scholar] [CrossRef]
- Clark, G.; Brown, K.A.; Tripathy, M.K.; Roux, S.J. Recent advances clarifying the structure and function of plant apyrases (Nucleoside triphosphate diphosphohydrolases). Int. J. Mol. Sci. 2021, 22, 3283. [Google Scholar] [CrossRef] [PubMed]
- Veerappa, R.; Slocum, R.D.; Siegenthaler, A.; Wang, J.; Clark, G.; Roux, S.J. Ectopic expression of a pea apyrase enhances root system architecture and drought survival in Arabidopsis and soybean. Plant Cell Environ. 2019, 42, 337–353. [Google Scholar] [CrossRef]
- Nadarajah, K.K. ROS homeostasis in abiotic stress tolerance in plants. Int. J. Mol. Sci. 2020, 21, 5208. [Google Scholar] [CrossRef] [PubMed]
- Inglis, P.W.; Pappas, M.C.R.; Resende, L.V.; Grattapaglia, D. Fast and inexpensive protocols for consistent extraction of high-quality DNA and RNA from challenging plant and fungal samples for high-throughput SNP genotyping and sequencing applications. PLoS ONE 2018, 13, e0206085. [Google Scholar] [CrossRef]
- Catchen, J.M.; Amores, A.; Hohenlohe, P.; Cresko, W.; Postlethwait, J.H. Stacks: Building and genotyping loci de novo from short-read sequences. G3 Genes Genom. Genet. 2011, 1, 171–182. [Google Scholar] [CrossRef]
- Luu, K.; Bazin, E.; Blum, M.G. pcadapt: An R package to perform genome scans for selection based on principal component analysis. Mol. Ecol. Resour. 2017, 17, 67–77. [Google Scholar] [CrossRef]
- Flanagan, S.P.; Jones, A.G. Constraints on the FST–heterozygosity outlier approach. J. Hered. 2017, 108, 561–573. [Google Scholar] [CrossRef]
- Foll, M.; Beaumont, M.A.; Gaggiotti, O. An approximate Bayesian computation approach to overcome biases that arise when using amplified fragment length polymorphism markers to study location structure. Genetics 2008, 179, 927–939. [Google Scholar] [CrossRef]
- Cockerham, C.C.; Weir, B.S. Estimation of gene flow from F-statistics. Evolution 1993, 47, 855–863. [Google Scholar] [CrossRef]
- R Development Core Team. R: A Language and Environment for Statistical Computing; R Foundation for Statistical Computing: Vienna, Austria, 2020; Available online: http://www.R-project.org/ (accessed on 10 July 2023).
- Luikart, G.; England, P.R.; Tallmon, D.; Jordan, S.; Taberlet, P. The power and promise of population genomics: From genotyping to genome typing. Nat. Rev. Genet. 2003, 4, 981–994. [Google Scholar] [CrossRef]
- Götz, S.; García-Gómez, J.M.; Terol, J.; Williams, T.D.; Nagaraj, S.H.; Nueda, M.J.; Robles, M.; Talón, M.; Dopazo, J.; Conesa, A. High-throughput functional annotation and data mining with the Blast2GO suite. Nucleic Acids Res. 2008, 36, 3420–3435. [Google Scholar] [CrossRef]
- Jombart, T. adegenet: A R package for the multivariate analysis of genetic markers. Bioinformatics 2008, 24, 1403–1405. [Google Scholar] [CrossRef] [PubMed]
- Nei, M. Genetic distance between populations. Am. Nat. 1972, 106, 283–292. [Google Scholar] [CrossRef]
- Paradis, E.; Schliep, K. ape 5.0: An environment for modern phylogenetics and evolutionary analyses in R. Bioinformatics 2019, 35, 526–528. [Google Scholar] [CrossRef] [PubMed]
- Kamvar, Z.N.; Tabima, J.F.; Grunwald, N.J. Poppr: An R package for genetic analysis of populations with clonal, partially clonal, and/or sexual reproduction. PeerJ 2014, 2, e281. [Google Scholar] [CrossRef] [PubMed]
- Wei, T.; Simko, V.R. Visualization of a Correlation Matrix (Version 0.84). 2017. Available online: https://github.com/taiyun/corrplot (accessed on 10 July 2022).
- Wright, S. The interpretation of population structure by F-statistics with special regard to systems of mating. Evolution 1965, 19, 395. [Google Scholar] [CrossRef]
- Goudet, J.; Jombart, T. hierfstat: Estimation and Tests of Hierarchical F-Statistics. R Package Version 0.5-7. 2020. Available online: https://CRAN.R-project.org/package=hierfstat (accessed on 10 July 2022).
- Kamvar, Z.N.; Brooks, J.C.; Grünwald, N.J. Novel R tools for analysis of genome-wide population genetic data with emphasis on clonality. Front. Genet. 2015, 6, 208. [Google Scholar] [CrossRef] [PubMed]
- Chessel, D.; Dufour, A.; Thioulouse, J. The ade4 Package—I: One-Table Methods. R News 2004, 4, 5–10. Available online: https://cran.r-project.org/doc/Rnews/ (accessed on 22 December 2020).
- Dray, S.; Dufour, A. The ade4 Package: Implementing the duality diagram for ecologists. J. Stat. Softw. 2007, 22, 1–20. [Google Scholar] [CrossRef]
- Dray, S.; Dufour, A.; Chessel, D. The ade4 Package—II: Two-Table and K-Table Methods. R News 2007, 7, 47–52. Available online: https://cran.r-project.org/doc/Rnews/ (accessed on 22 December 2020).
- Bougeard, S.; Dray, S. Supervised multiblock analysis in R with the ade4 package. J. Stat. Softw. 2018, 86, 1–7. [Google Scholar] [CrossRef]
- Thioulouse, J.; Dray, S.; Dufour, A.B.; Siberchicot, A.; Jombart, O.T.; Pavoine, S. Multivariate Analysis of Ecological Data with ade4; Springer: New York, NY, USA, 2018. [Google Scholar] [CrossRef]
- Padgham, M.; Sumner, M.D. geodist: Fast, Dependency-Free Geodesic Distance Calculations. R Package Version 0.0.6. 2020. Available online: https://CRAN.R-project.org/package=geodist (accessed on 10 April 2021).
- Embrapa—Empresa Brasileira de Pesquisa Agropecuária. 2019. Available online: http://www.embrapa.br. (accessed on 24 January 2019).


| Source of Variation | DF | Sum of Square | Coefficient of Variation | Variation Percentage (%) | F Statistics |
|---|---|---|---|---|---|
| Among locations | 3 | 15,987.13 | 478.761 | 68.34 | FST = 0.68 * |
| Within locations | 33 | 7317.50 | 221.742 | 31.65 | |
| Among DAPC groups | 3 | 3373.08 | 126.89 | 59.79 | FST = 0.59 * |
| Within DAPC groups | 35 | 2986.95 | 85.341 | 40.21 |
| Sampled Locations | RO | NC | IT | BR | IM | CH |
|---|---|---|---|---|---|---|
| RO | 57.3 | 471.3 | 1537.3 | 1335.1 | 1967.1 | |
| NC | 0.28 | 425.0 | 1538.3 | 1336.7 | 1960.8 | |
| IT | 0.33 | 0.29 | 1330.6 | 1142.3 | 1693.7 | |
| BR | 0.71 | 0.69 | 0.48 | 202.4 | 478.6 | |
| IM | 0.69 | 0.68 | 0.55 | 0.16 | 665.4 | |
| CH | 0.62 | 0.60 | 0.55 | 0.04 | 0.11 |
| Group | N 1 | A | HO | HE | f |
|---|---|---|---|---|---|
| 1 | 5 | 2981 | 0.2078 | 0.1746 | −0.1904 |
| 2 | 21 | 2764 | 0.0561 | 0.0983 | 0.4295 |
| 3 | 4 | 2339 | 0.0562 | 0.0832 | 0.3242 |
| 4 | 9 | 2184 | 0.0461 | 0.0435 | −0.0585 |
| Mean | 2567 | 0.0915 | 0.0999 | 0.1262 | |
| Locations 2/Amazon biome | |||||
| RO | 12 | 2310 | 0.0493 | 0.0665 | 0.2589 |
| NC | 9 | 2326 | 0.0563 | 0.0752 | 0.2512 |
| IT | 5 | 2566 | 0.0519 | 0.1262 | 0.5885 |
| BR | 3 | 609 | 0.0572 | 0.0424 | −0.3500 |
| IM | 5 | 676 | 0.0644 | 0.0649 | 0.0071 |
| Mean | 1697.4 | 0.0558 | 0.0750 | 0.1511 | |
| Cerrado biome | |||||
| CH | 5 | 2981 | 0.2078 | 0.1746 | 0.1904 |
| Location | Municipality/ State | Number of Individuals | Biome | Latitude | Longitude |
|---|---|---|---|---|---|
| IT | Itacoatiara/AM | 5 | Amazon | 02°47′47.0″ S | 58°34′15.1″ W |
| BR | Bragança/PA | 3 | Amazon | 01°03′27.5″ S | 46°44′9.91″ W |
| IM | Ilha do Marajó/PA | 5 | Amazon | 00°41′37.0″ S | 48°31′07.0″ W |
| RO | Rorainópolis/RR | 12 | Amazon | 01°03′14.7″ N | 60°23′10.4″ W |
| NC | Nova Colina/RR | 9 | Amazon | 00°32′29.9″ N | 60°27′50.5″ W |
| CH | Chapadinha/MA | 5 | Cerrado | 03°44′30.0″ S | 43°21′37.0″ W |
| Total | 39 |
Disclaimer/Publisher’s Note: The statements, opinions and data contained in all publications are solely those of the individual author(s) and contributor(s) and not of MDPI and/or the editor(s). MDPI and/or the editor(s) disclaim responsibility for any injury to people or property resulting from any ideas, methods, instructions or products referred to in the content. |
© 2024 by the authors. Licensee MDPI, Basel, Switzerland. This article is an open access article distributed under the terms and conditions of the Creative Commons Attribution (CC BY) license (https://creativecommons.org/licenses/by/4.0/).
Share and Cite
Garcia, C.B.; Silva, A.V.d.; Carvalho, I.A.S.d.; Nascimento, W.F.d.; Ramos, S.L.F.; Rodrigues, D.P.; Zucchi, M.I.; Costa, F.M.; Alves-Pereira, A.; Batista, C.E.d.A.; et al. Low Diversity and High Genetic Structure for Platonia insignis Mart., an Endangered Fruit Tree Species. Plants 2024, 13, 1033. https://doi.org/10.3390/plants13071033
Garcia CB, Silva AVd, Carvalho IASd, Nascimento WFd, Ramos SLF, Rodrigues DP, Zucchi MI, Costa FM, Alves-Pereira A, Batista CEdA, et al. Low Diversity and High Genetic Structure for Platonia insignis Mart., an Endangered Fruit Tree Species. Plants. 2024; 13(7):1033. https://doi.org/10.3390/plants13071033
Chicago/Turabian StyleGarcia, Caroline Bertocco, Allison Vieira da Silva, Igor Araújo Santos de Carvalho, Wellington Ferreira do Nascimento, Santiago Linorio Ferreyra Ramos, Doriane Picanço Rodrigues, Maria Imaculada Zucchi, Flaviane Malaquias Costa, Alessandro Alves-Pereira, Carlos Eduardo de Araújo Batista, and et al. 2024. "Low Diversity and High Genetic Structure for Platonia insignis Mart., an Endangered Fruit Tree Species" Plants 13, no. 7: 1033. https://doi.org/10.3390/plants13071033
APA StyleGarcia, C. B., Silva, A. V. d., Carvalho, I. A. S. d., Nascimento, W. F. d., Ramos, S. L. F., Rodrigues, D. P., Zucchi, M. I., Costa, F. M., Alves-Pereira, A., Batista, C. E. d. A., Amaral, D. D., & Veasey, E. A. (2024). Low Diversity and High Genetic Structure for Platonia insignis Mart., an Endangered Fruit Tree Species. Plants, 13(7), 1033. https://doi.org/10.3390/plants13071033