
Variation in Water-Holding Capacity in Sphagnum Species Depends on Both Plant and Colony Structure

 , and
, and 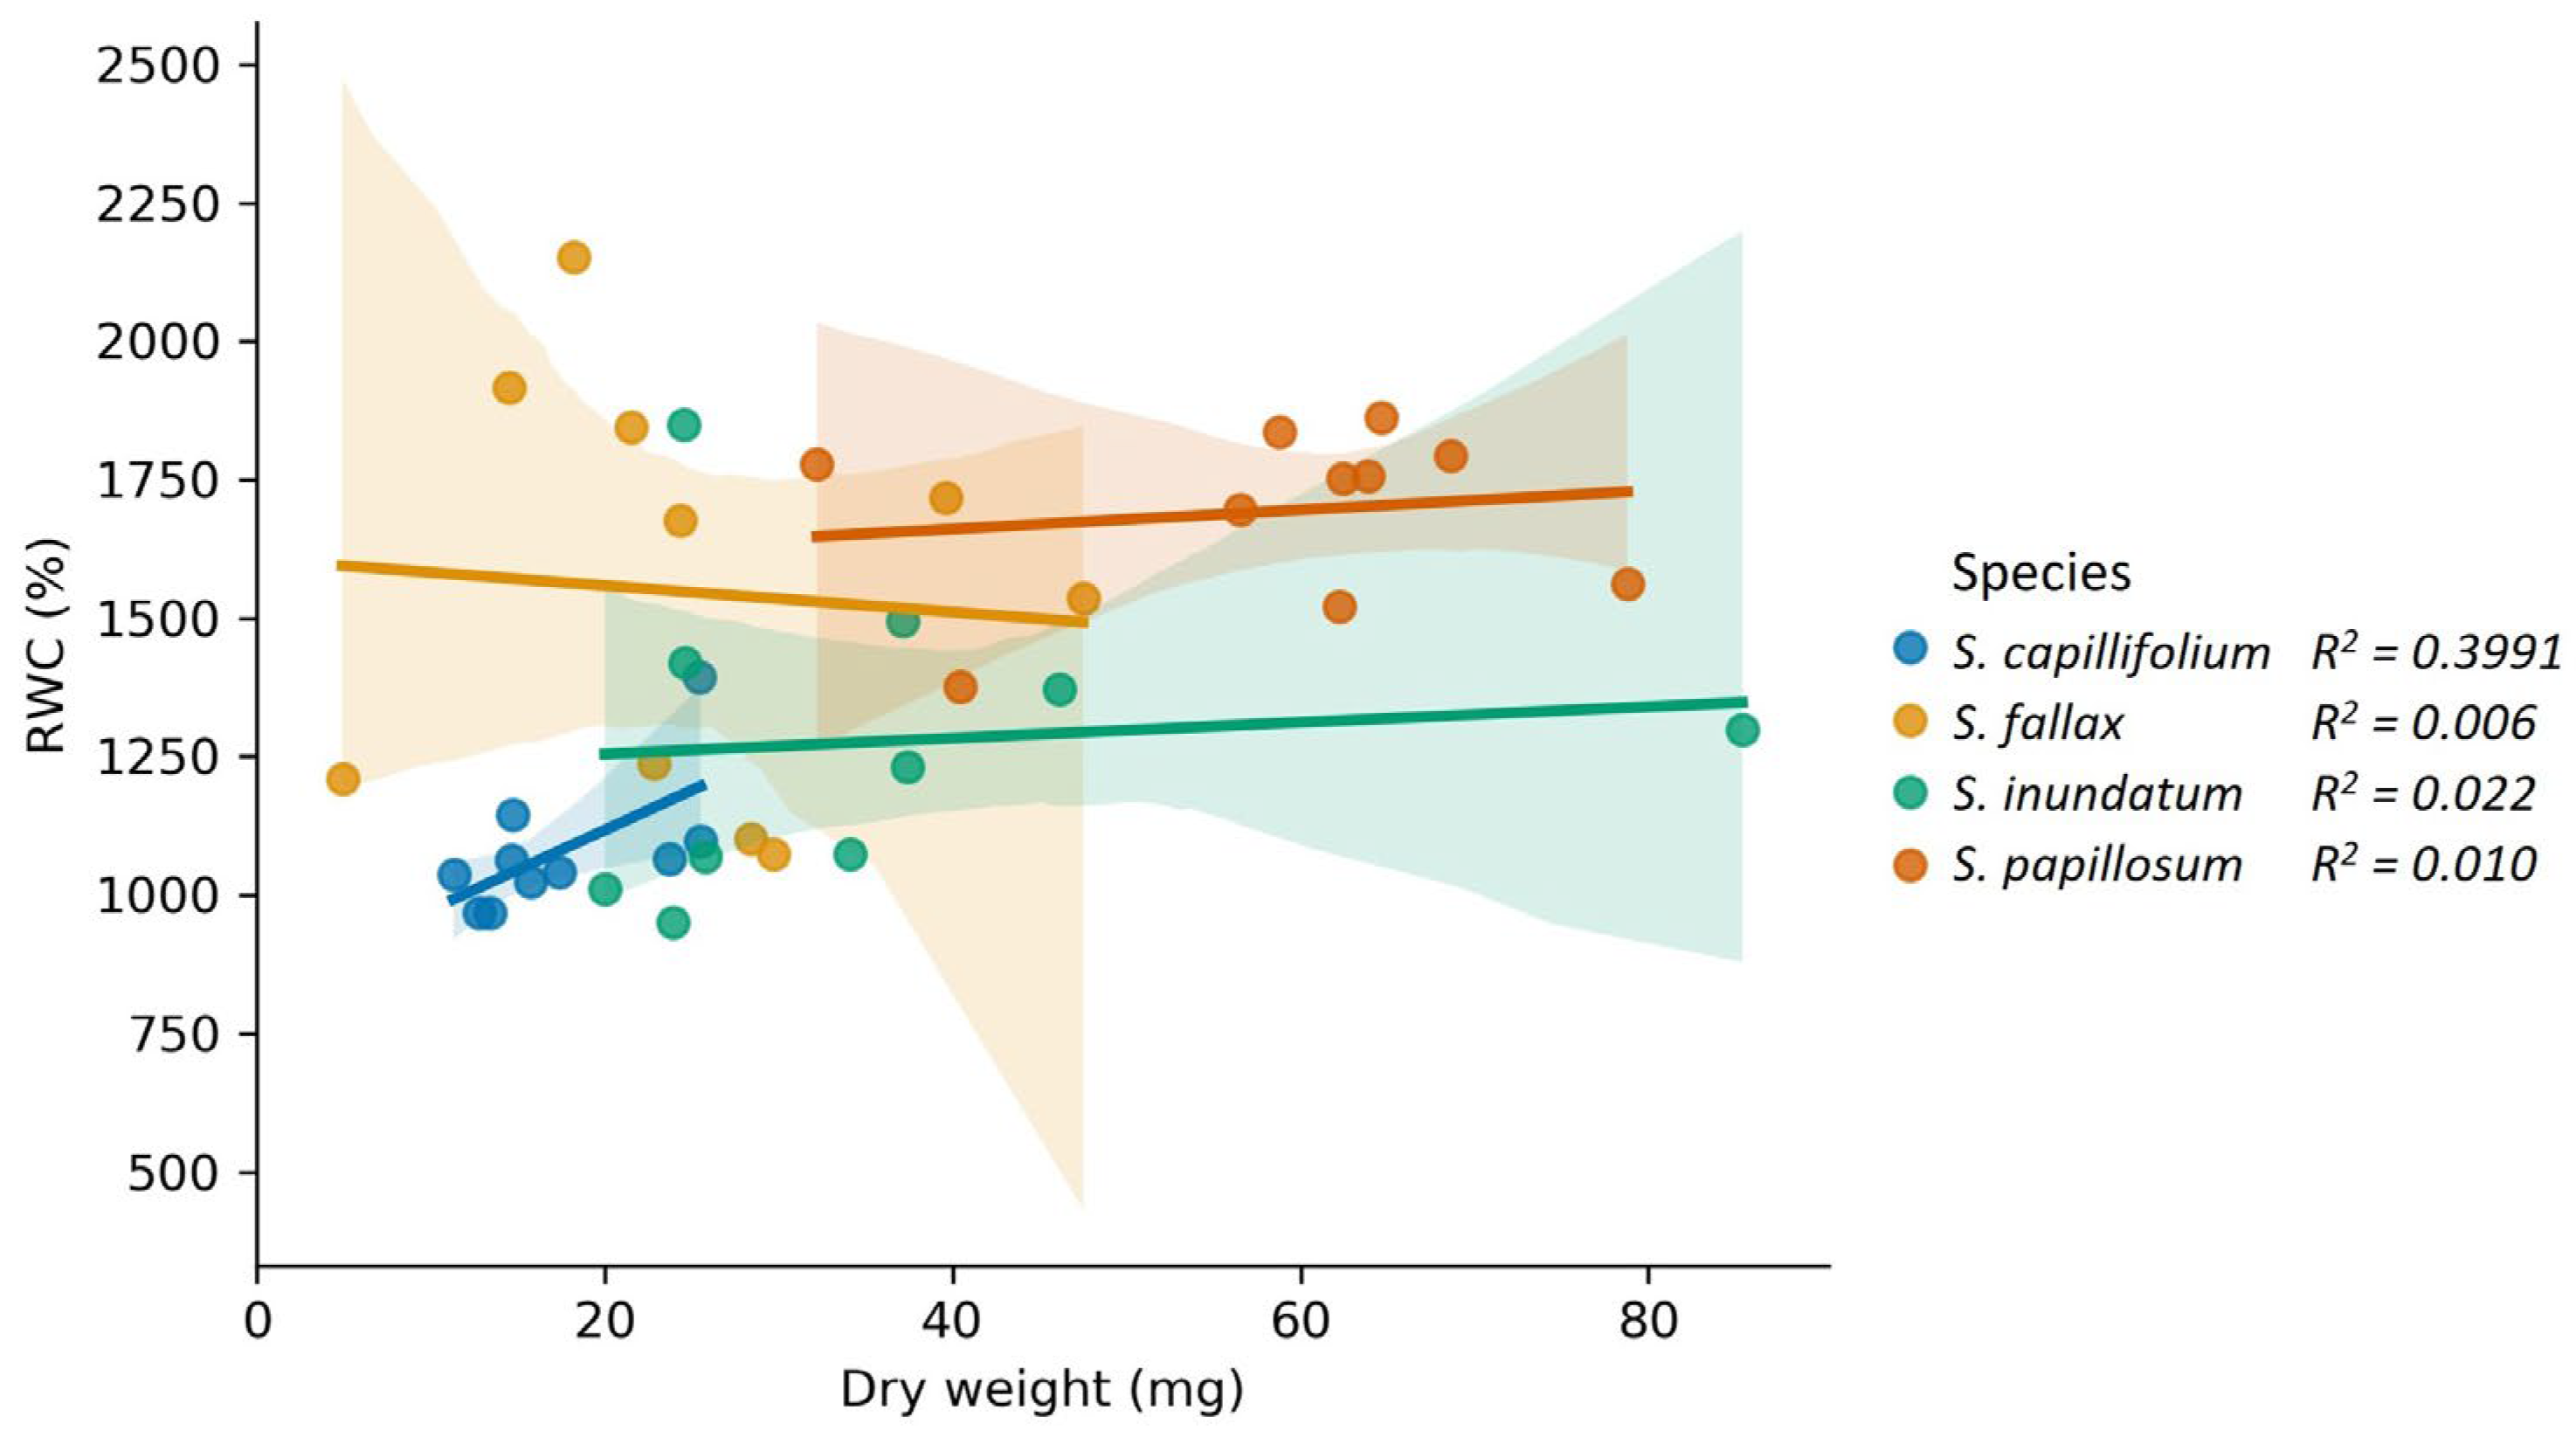
Abstract
1. Introduction
2. Results
2.1. Sphagnum Water Content Is Not Correlated with Plant Dry Weight
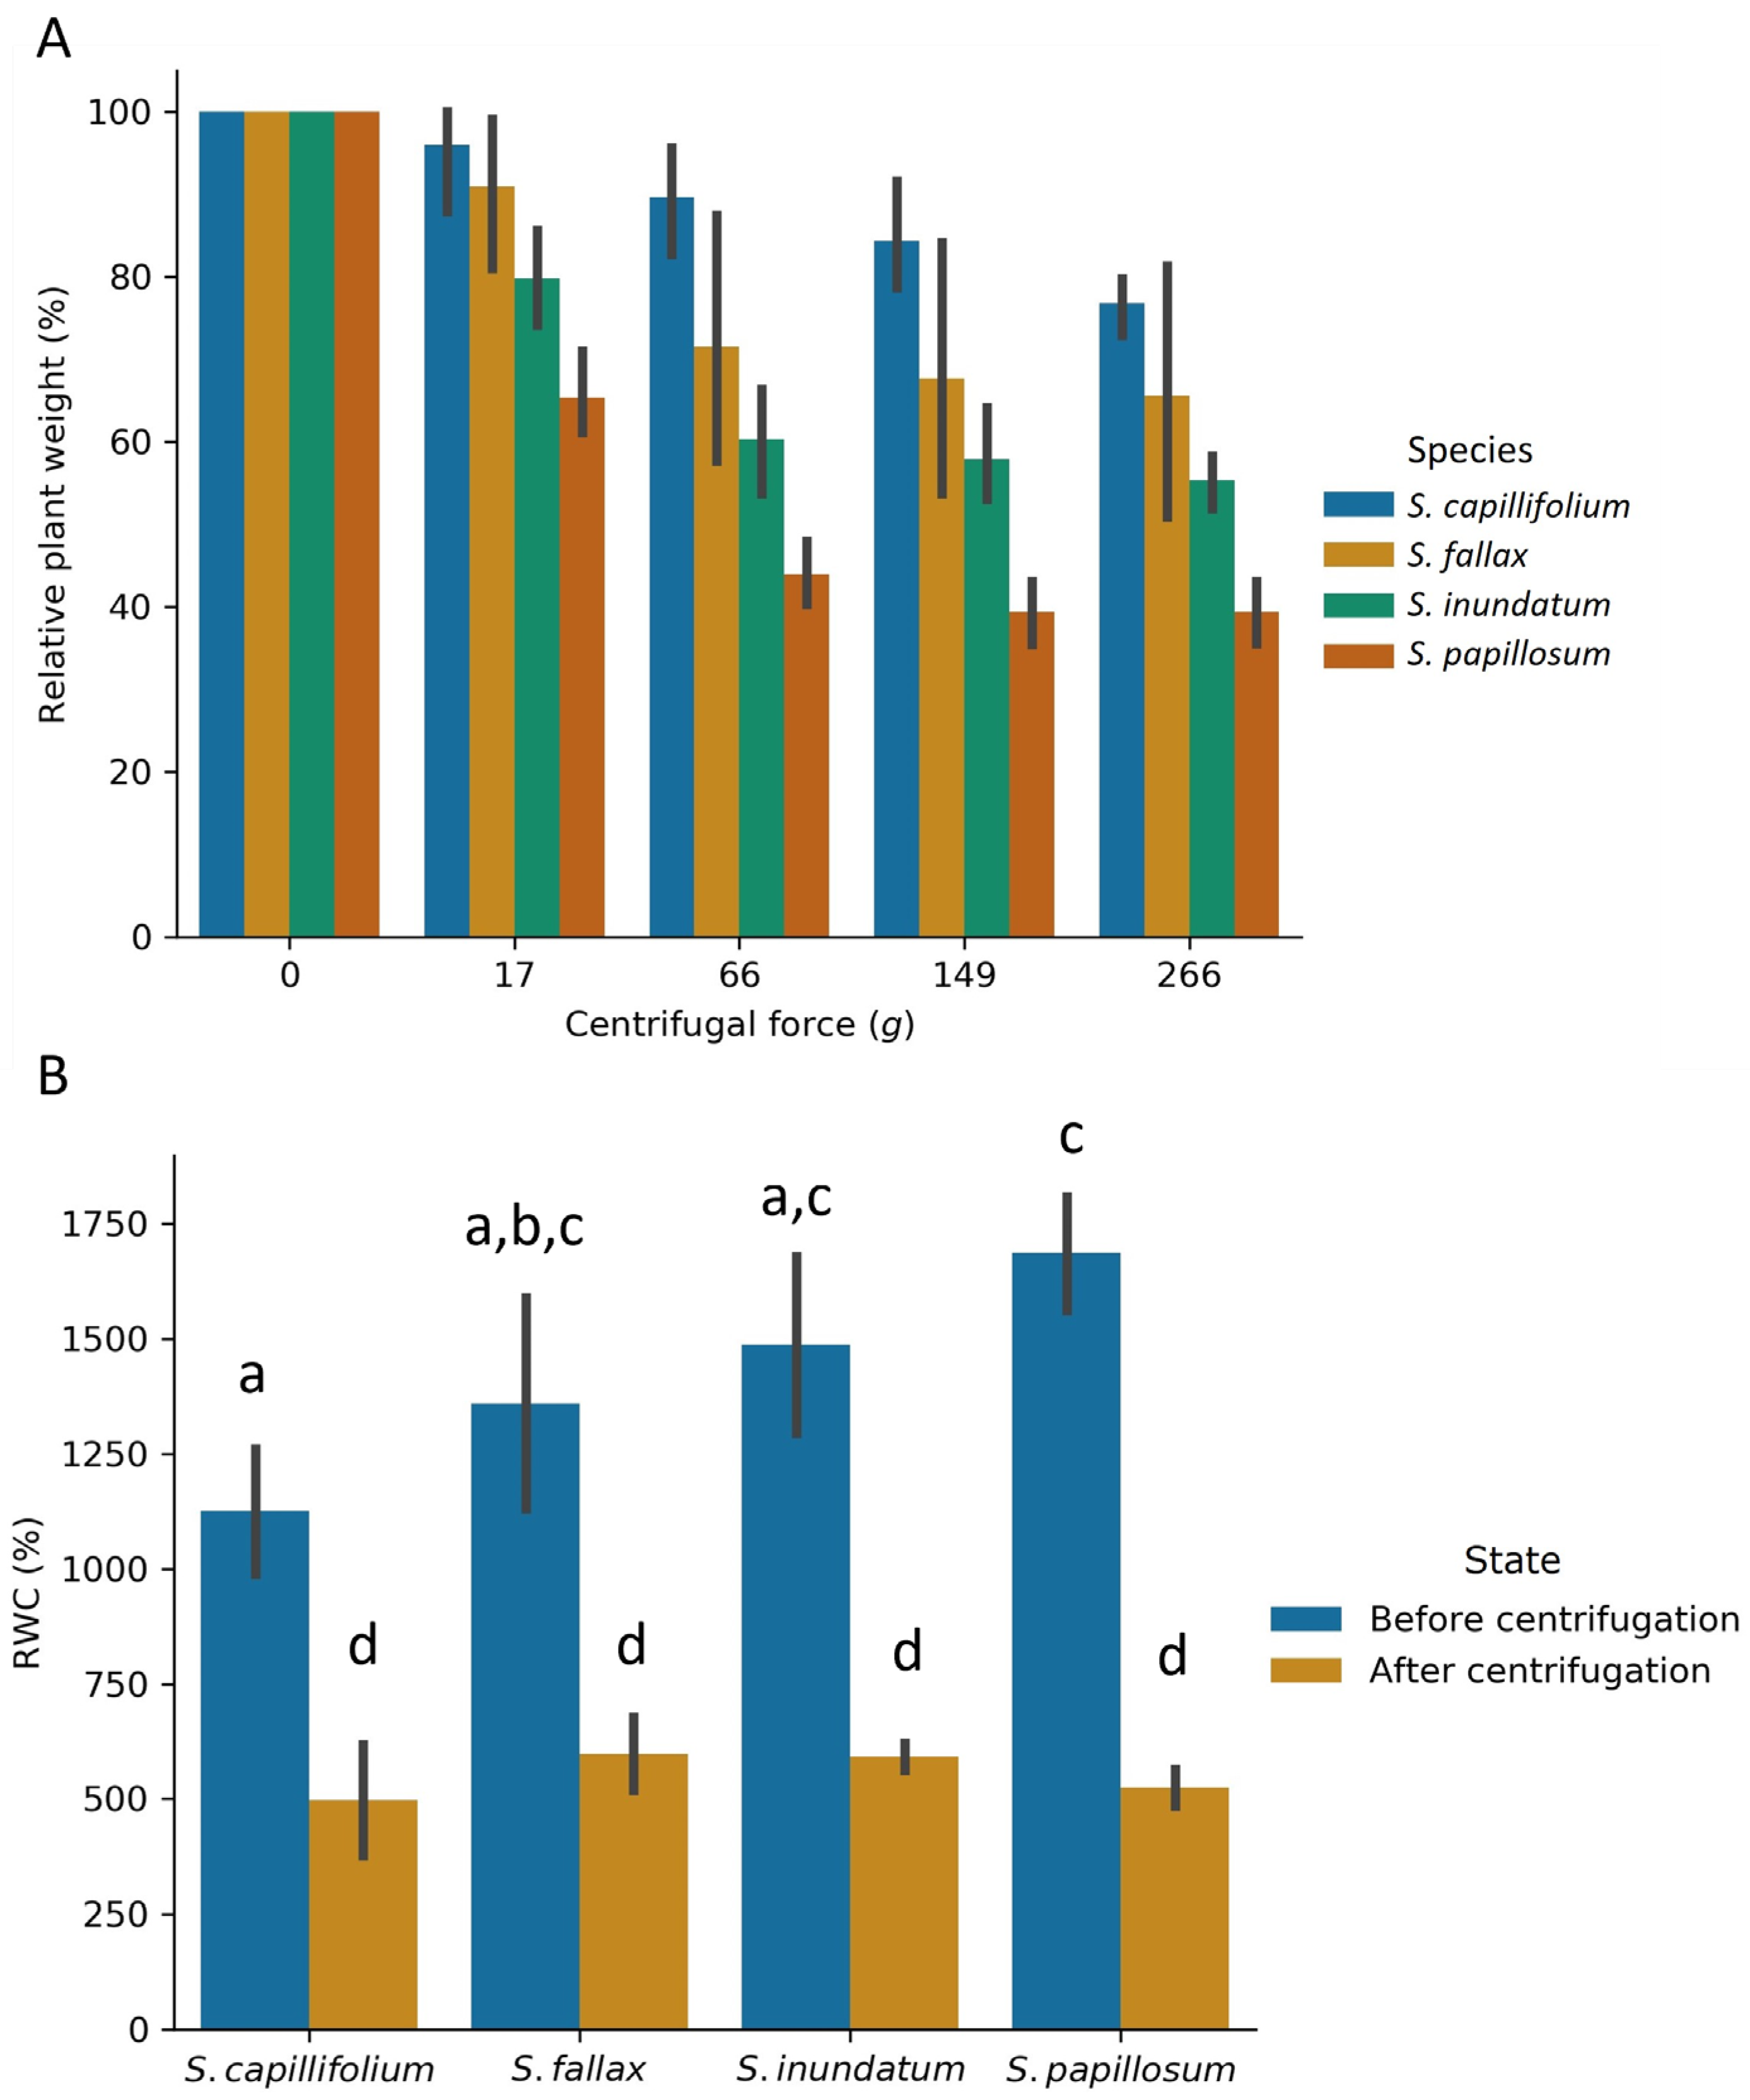
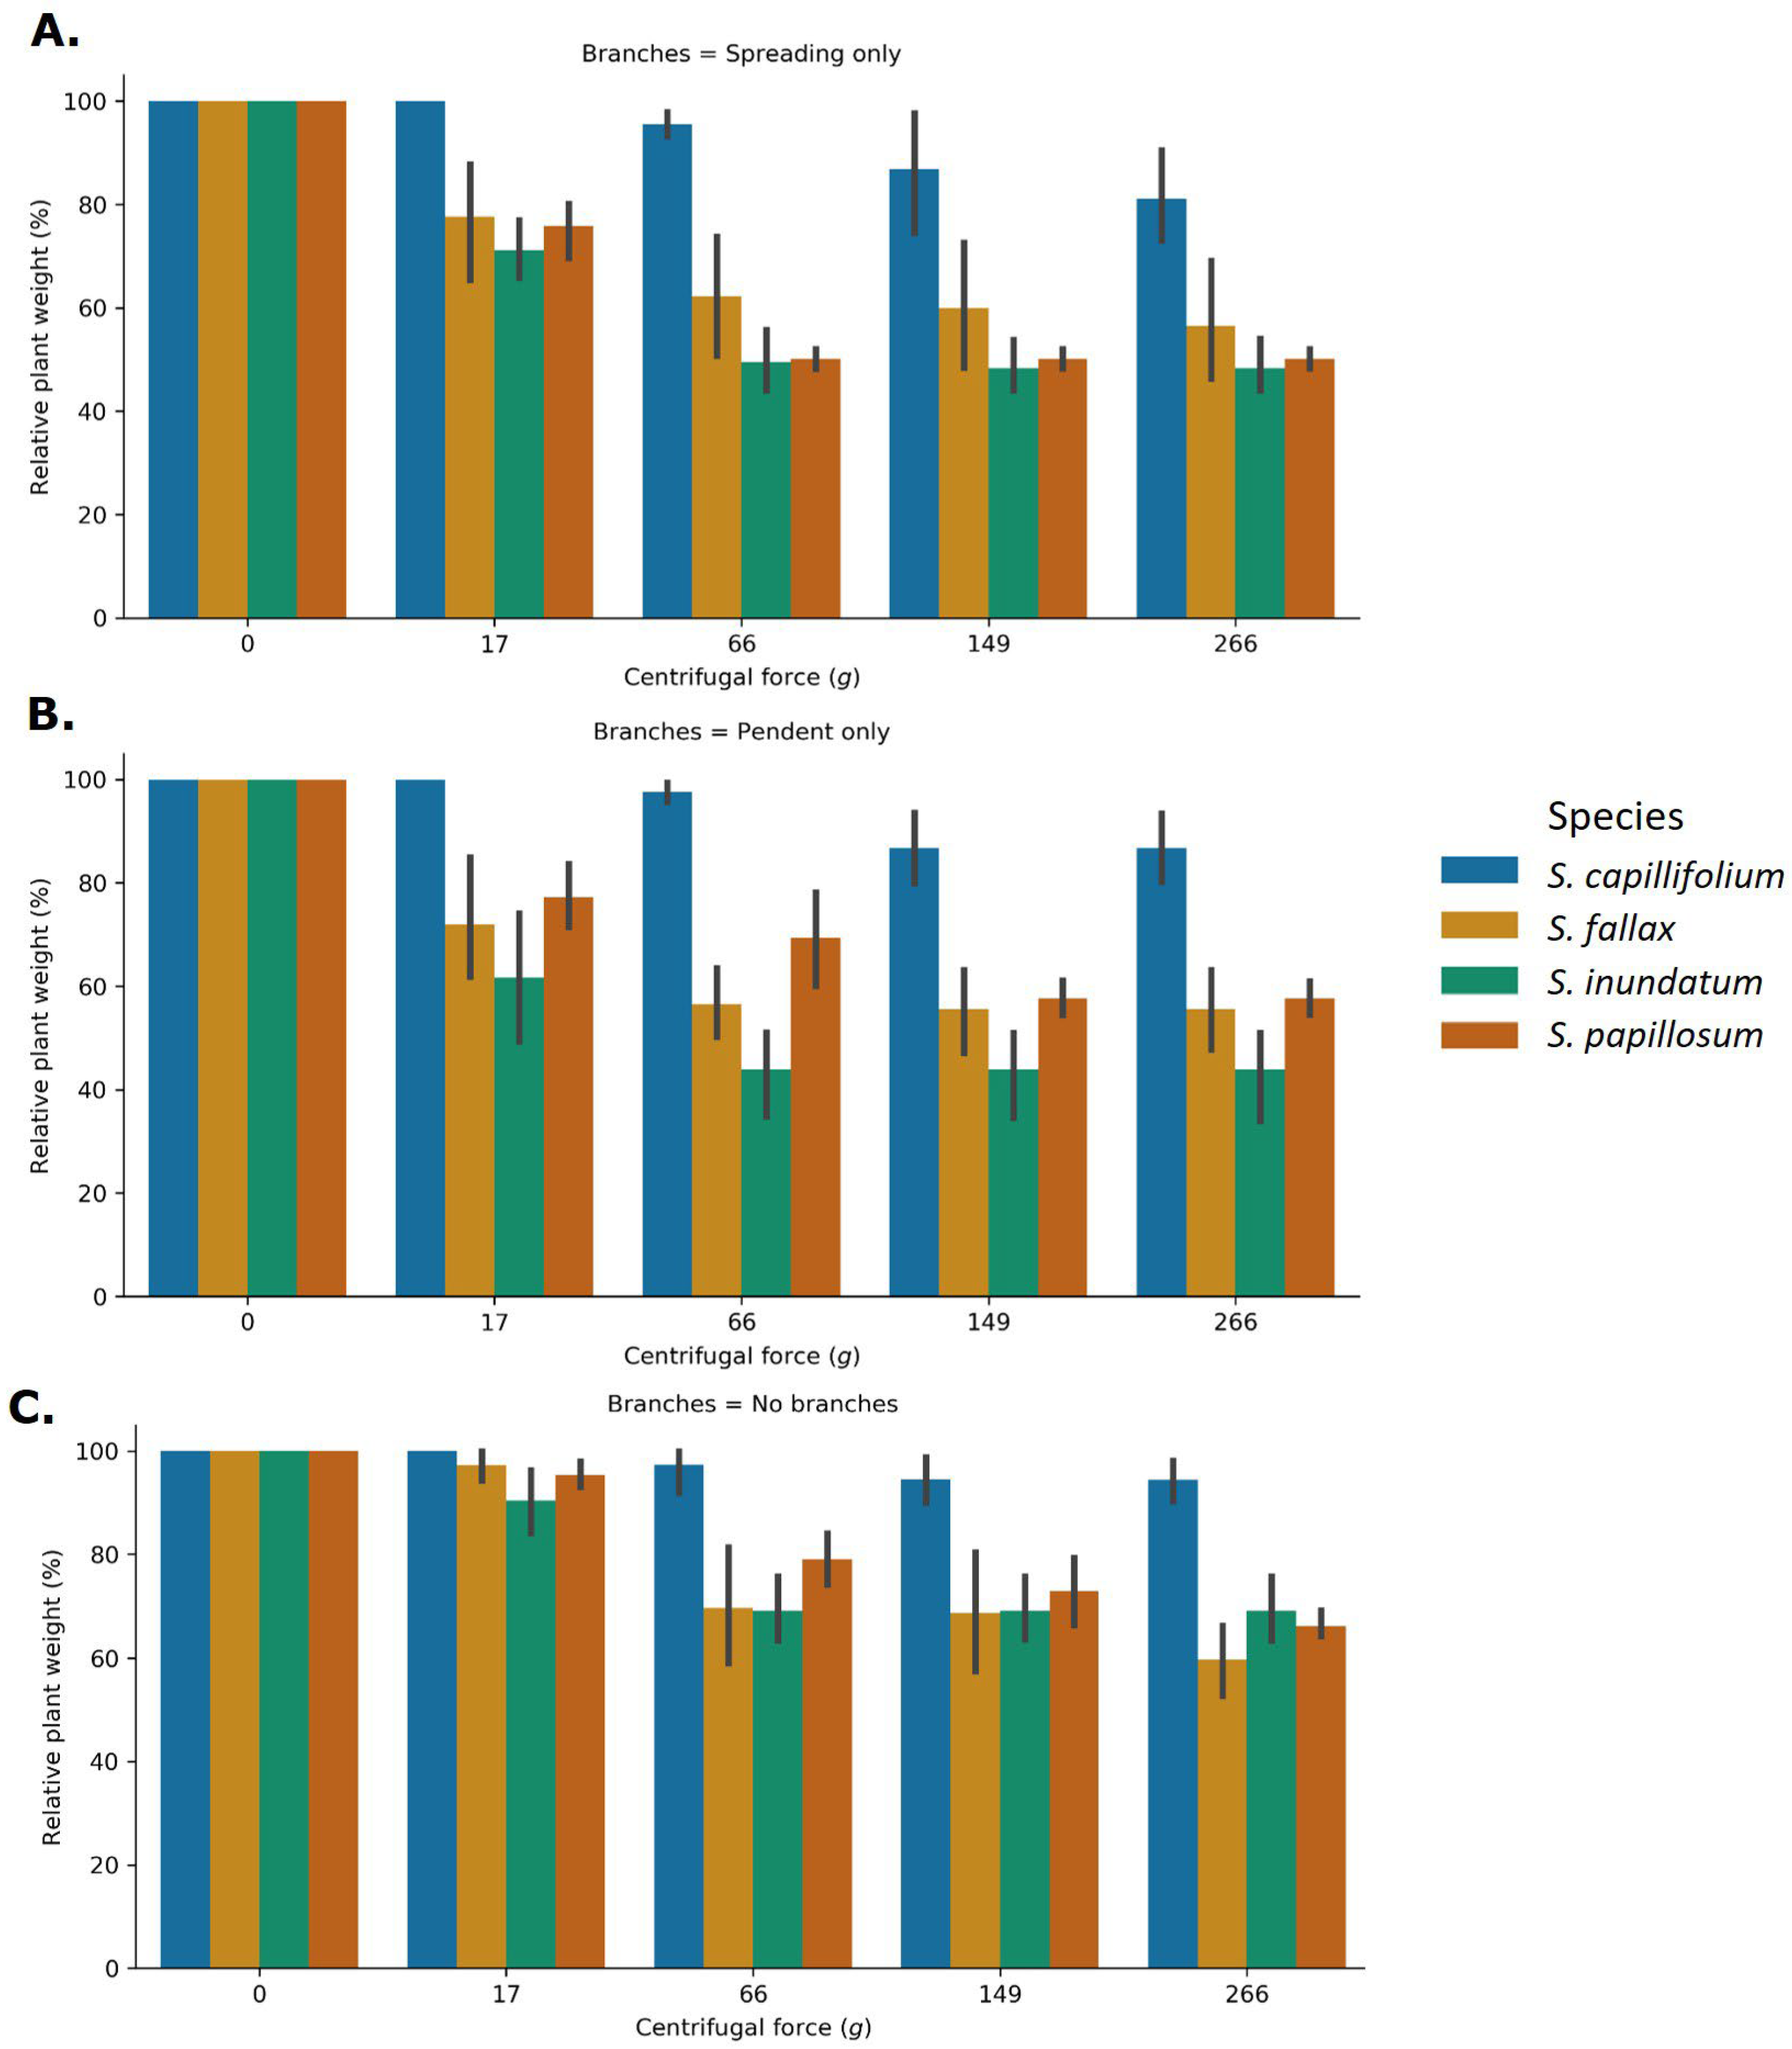
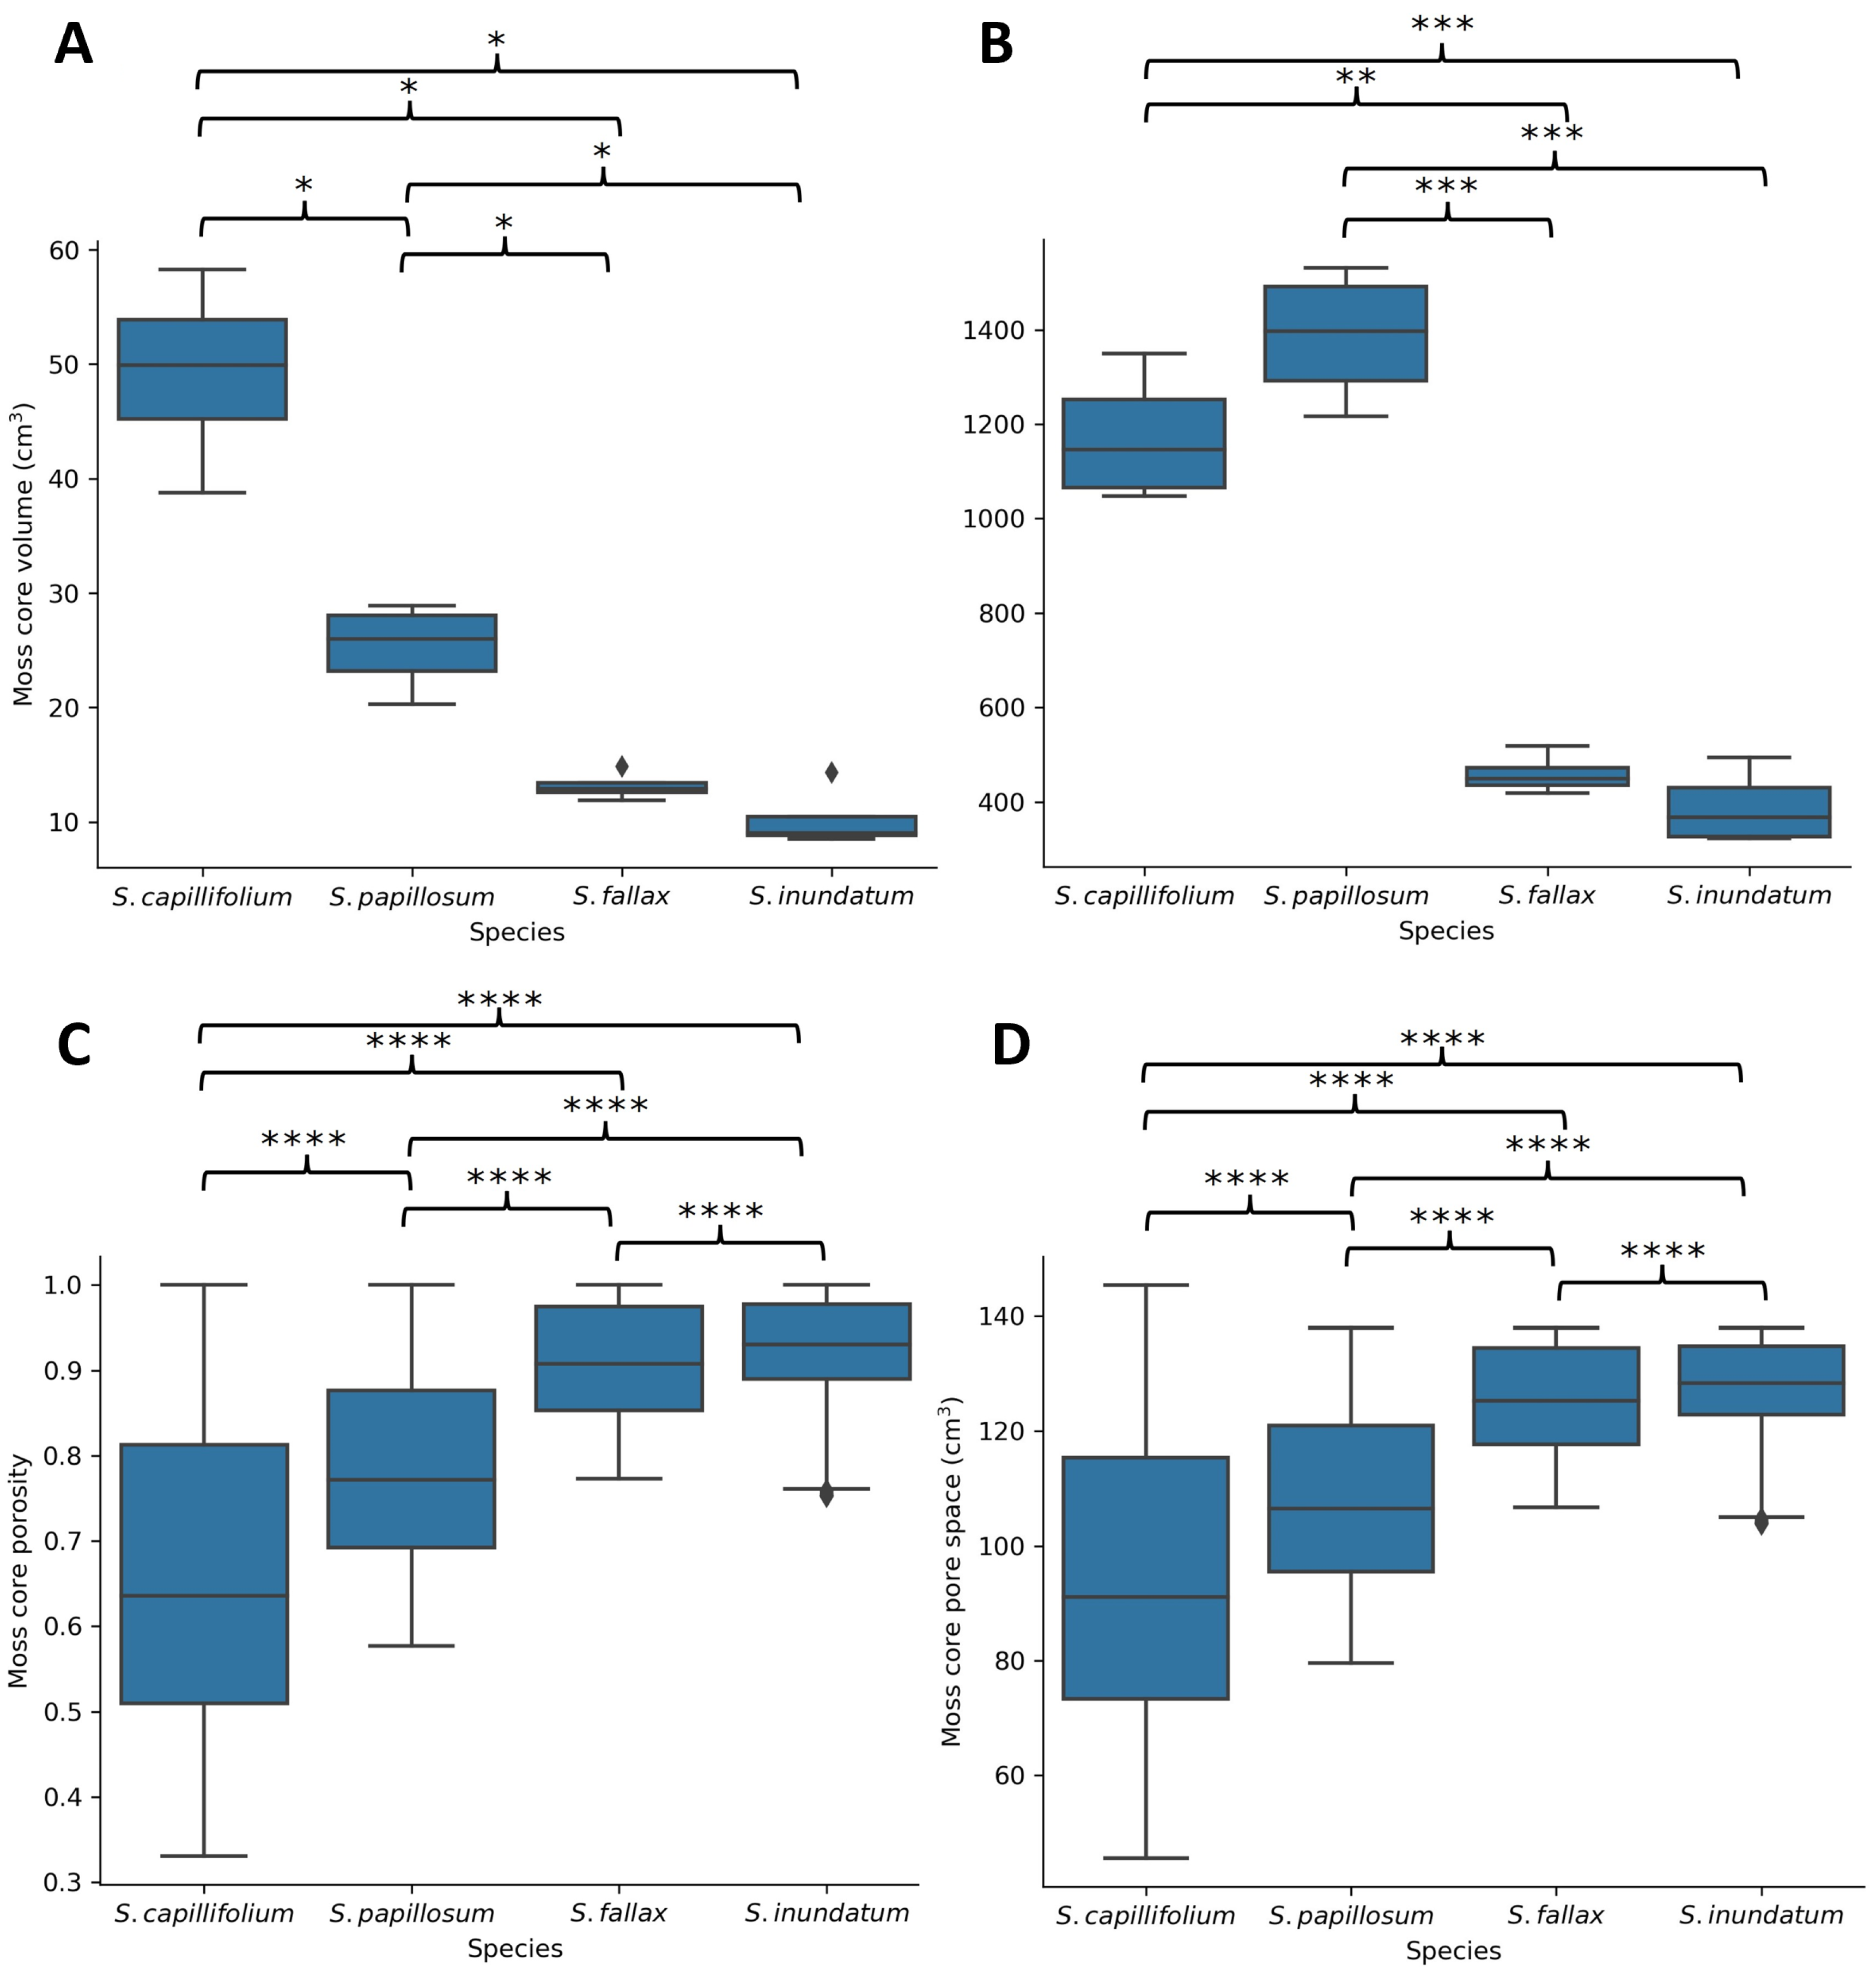
2.2. The Role of Plant Architecture in Water Storage
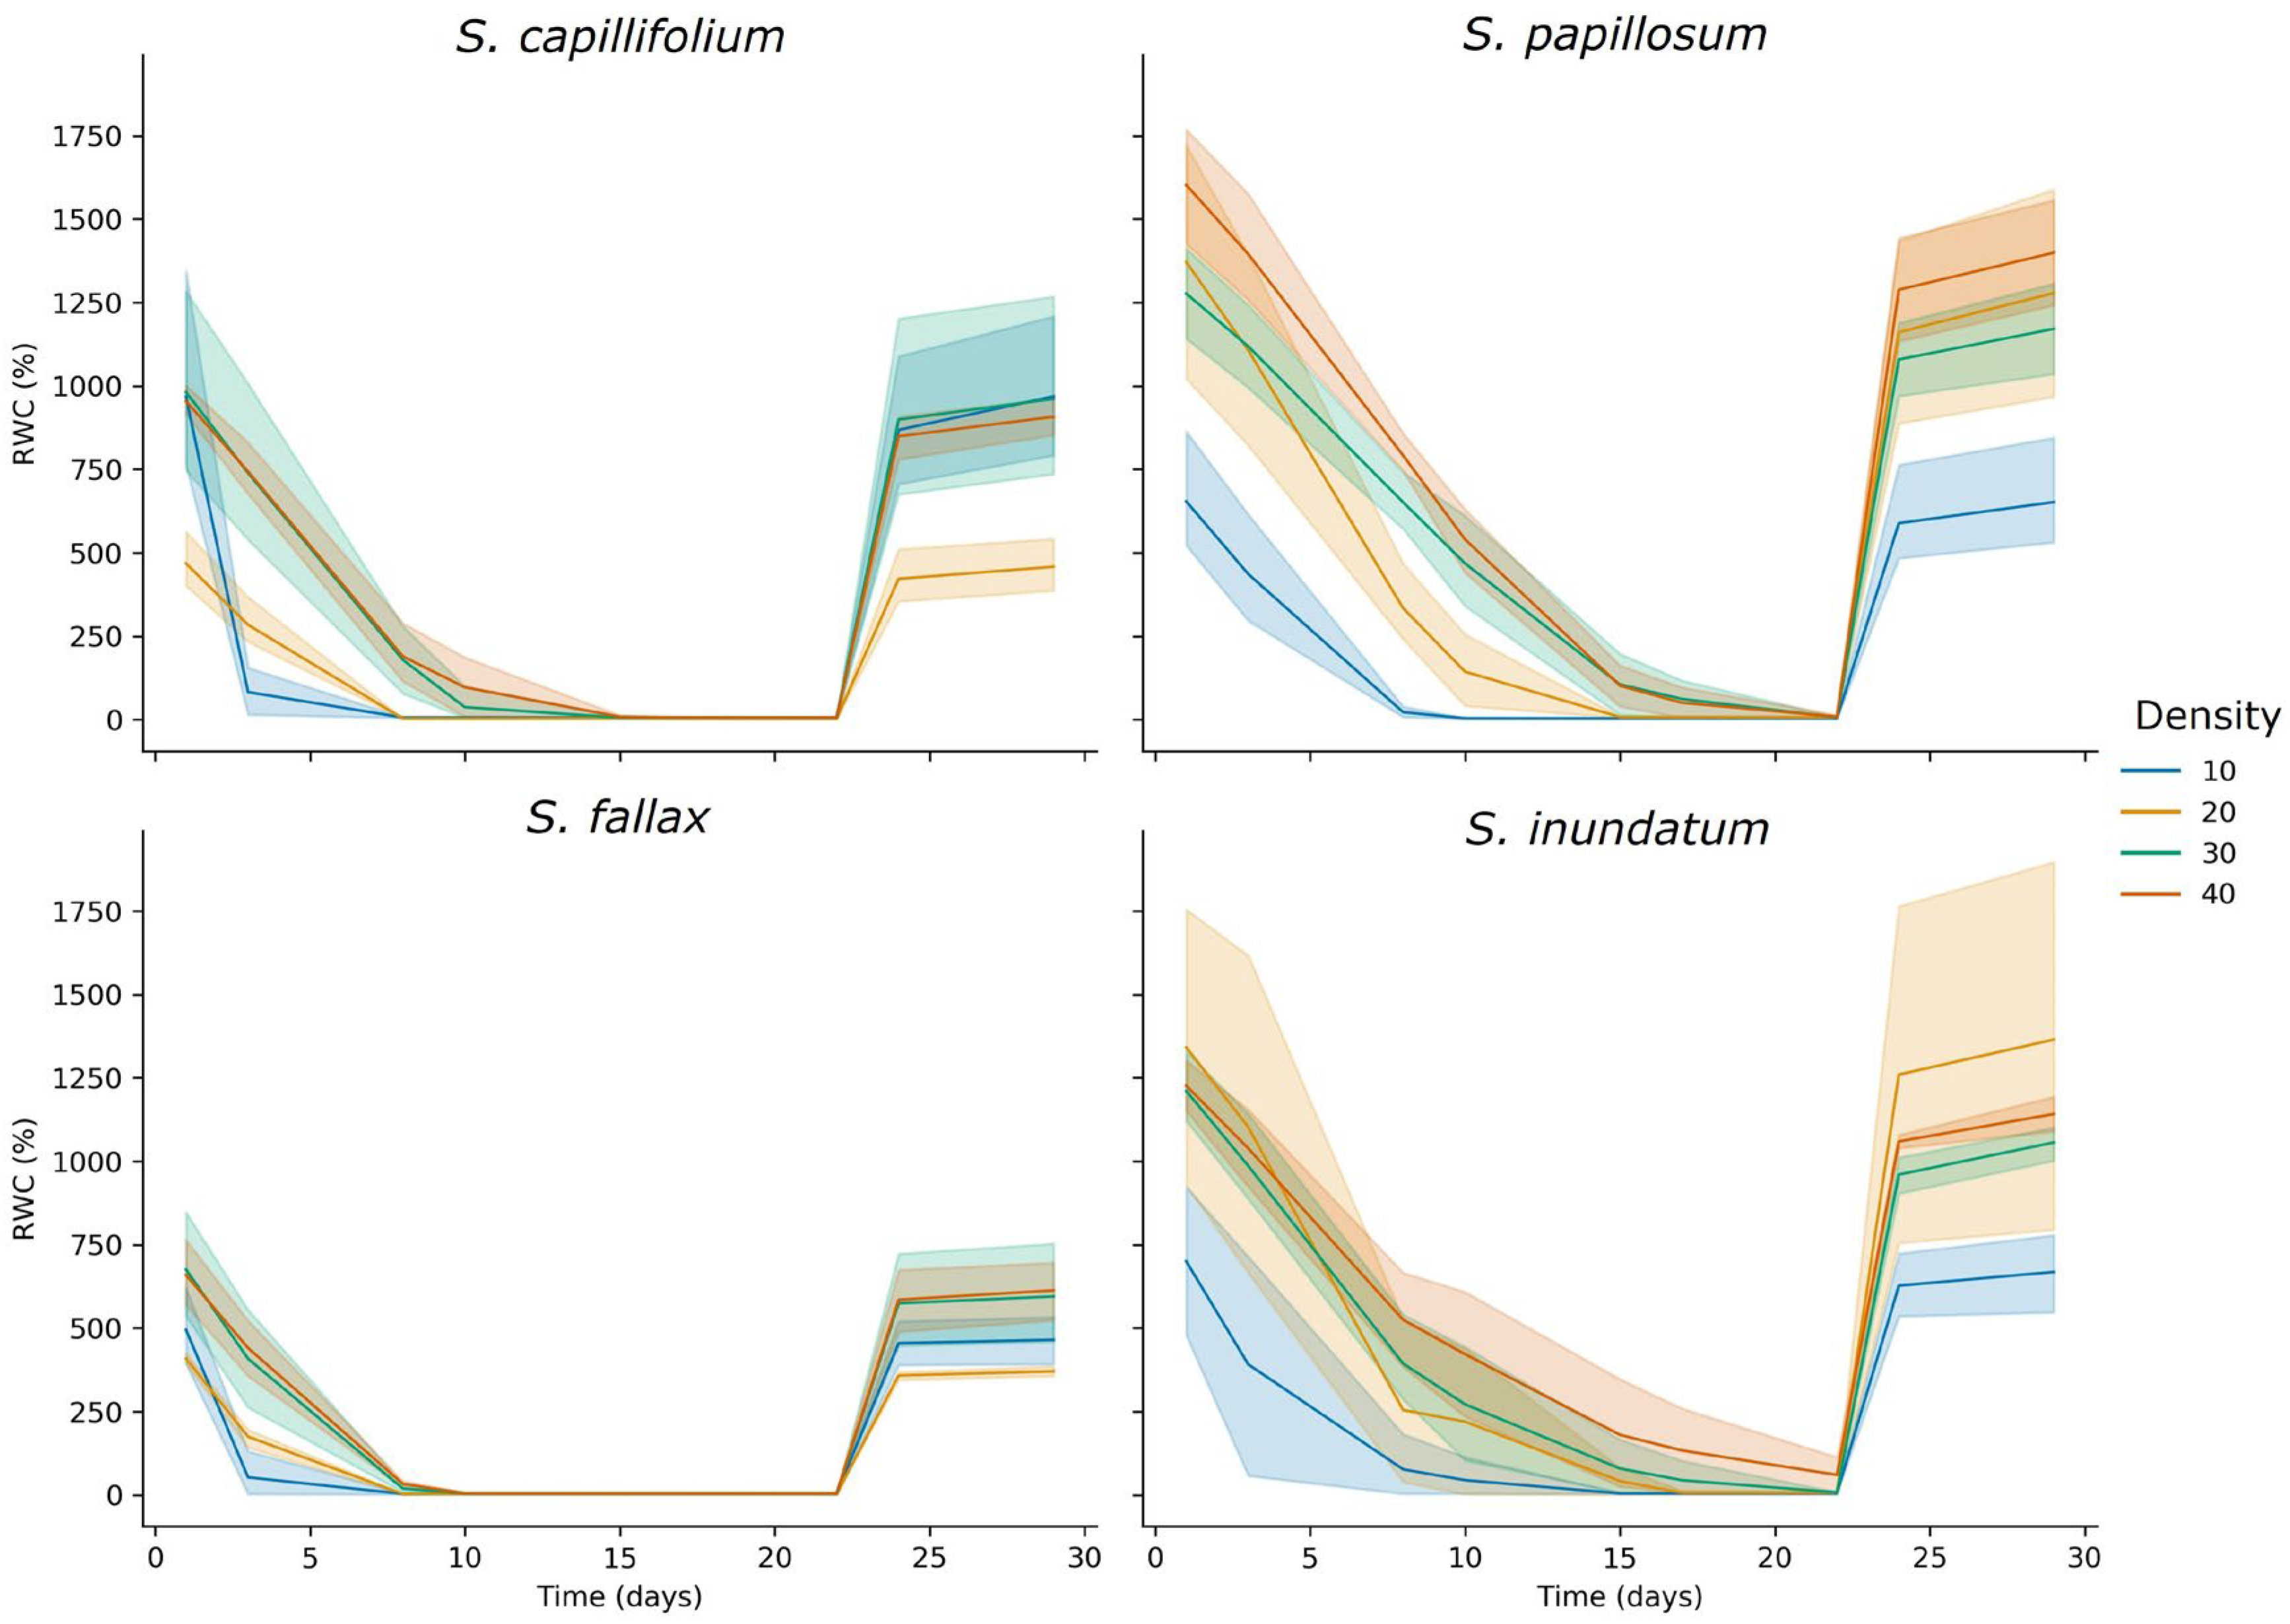
2.3. The Effect of Colony Density on Water Storage
3. Discussion
3.1. The Role of Colony Density
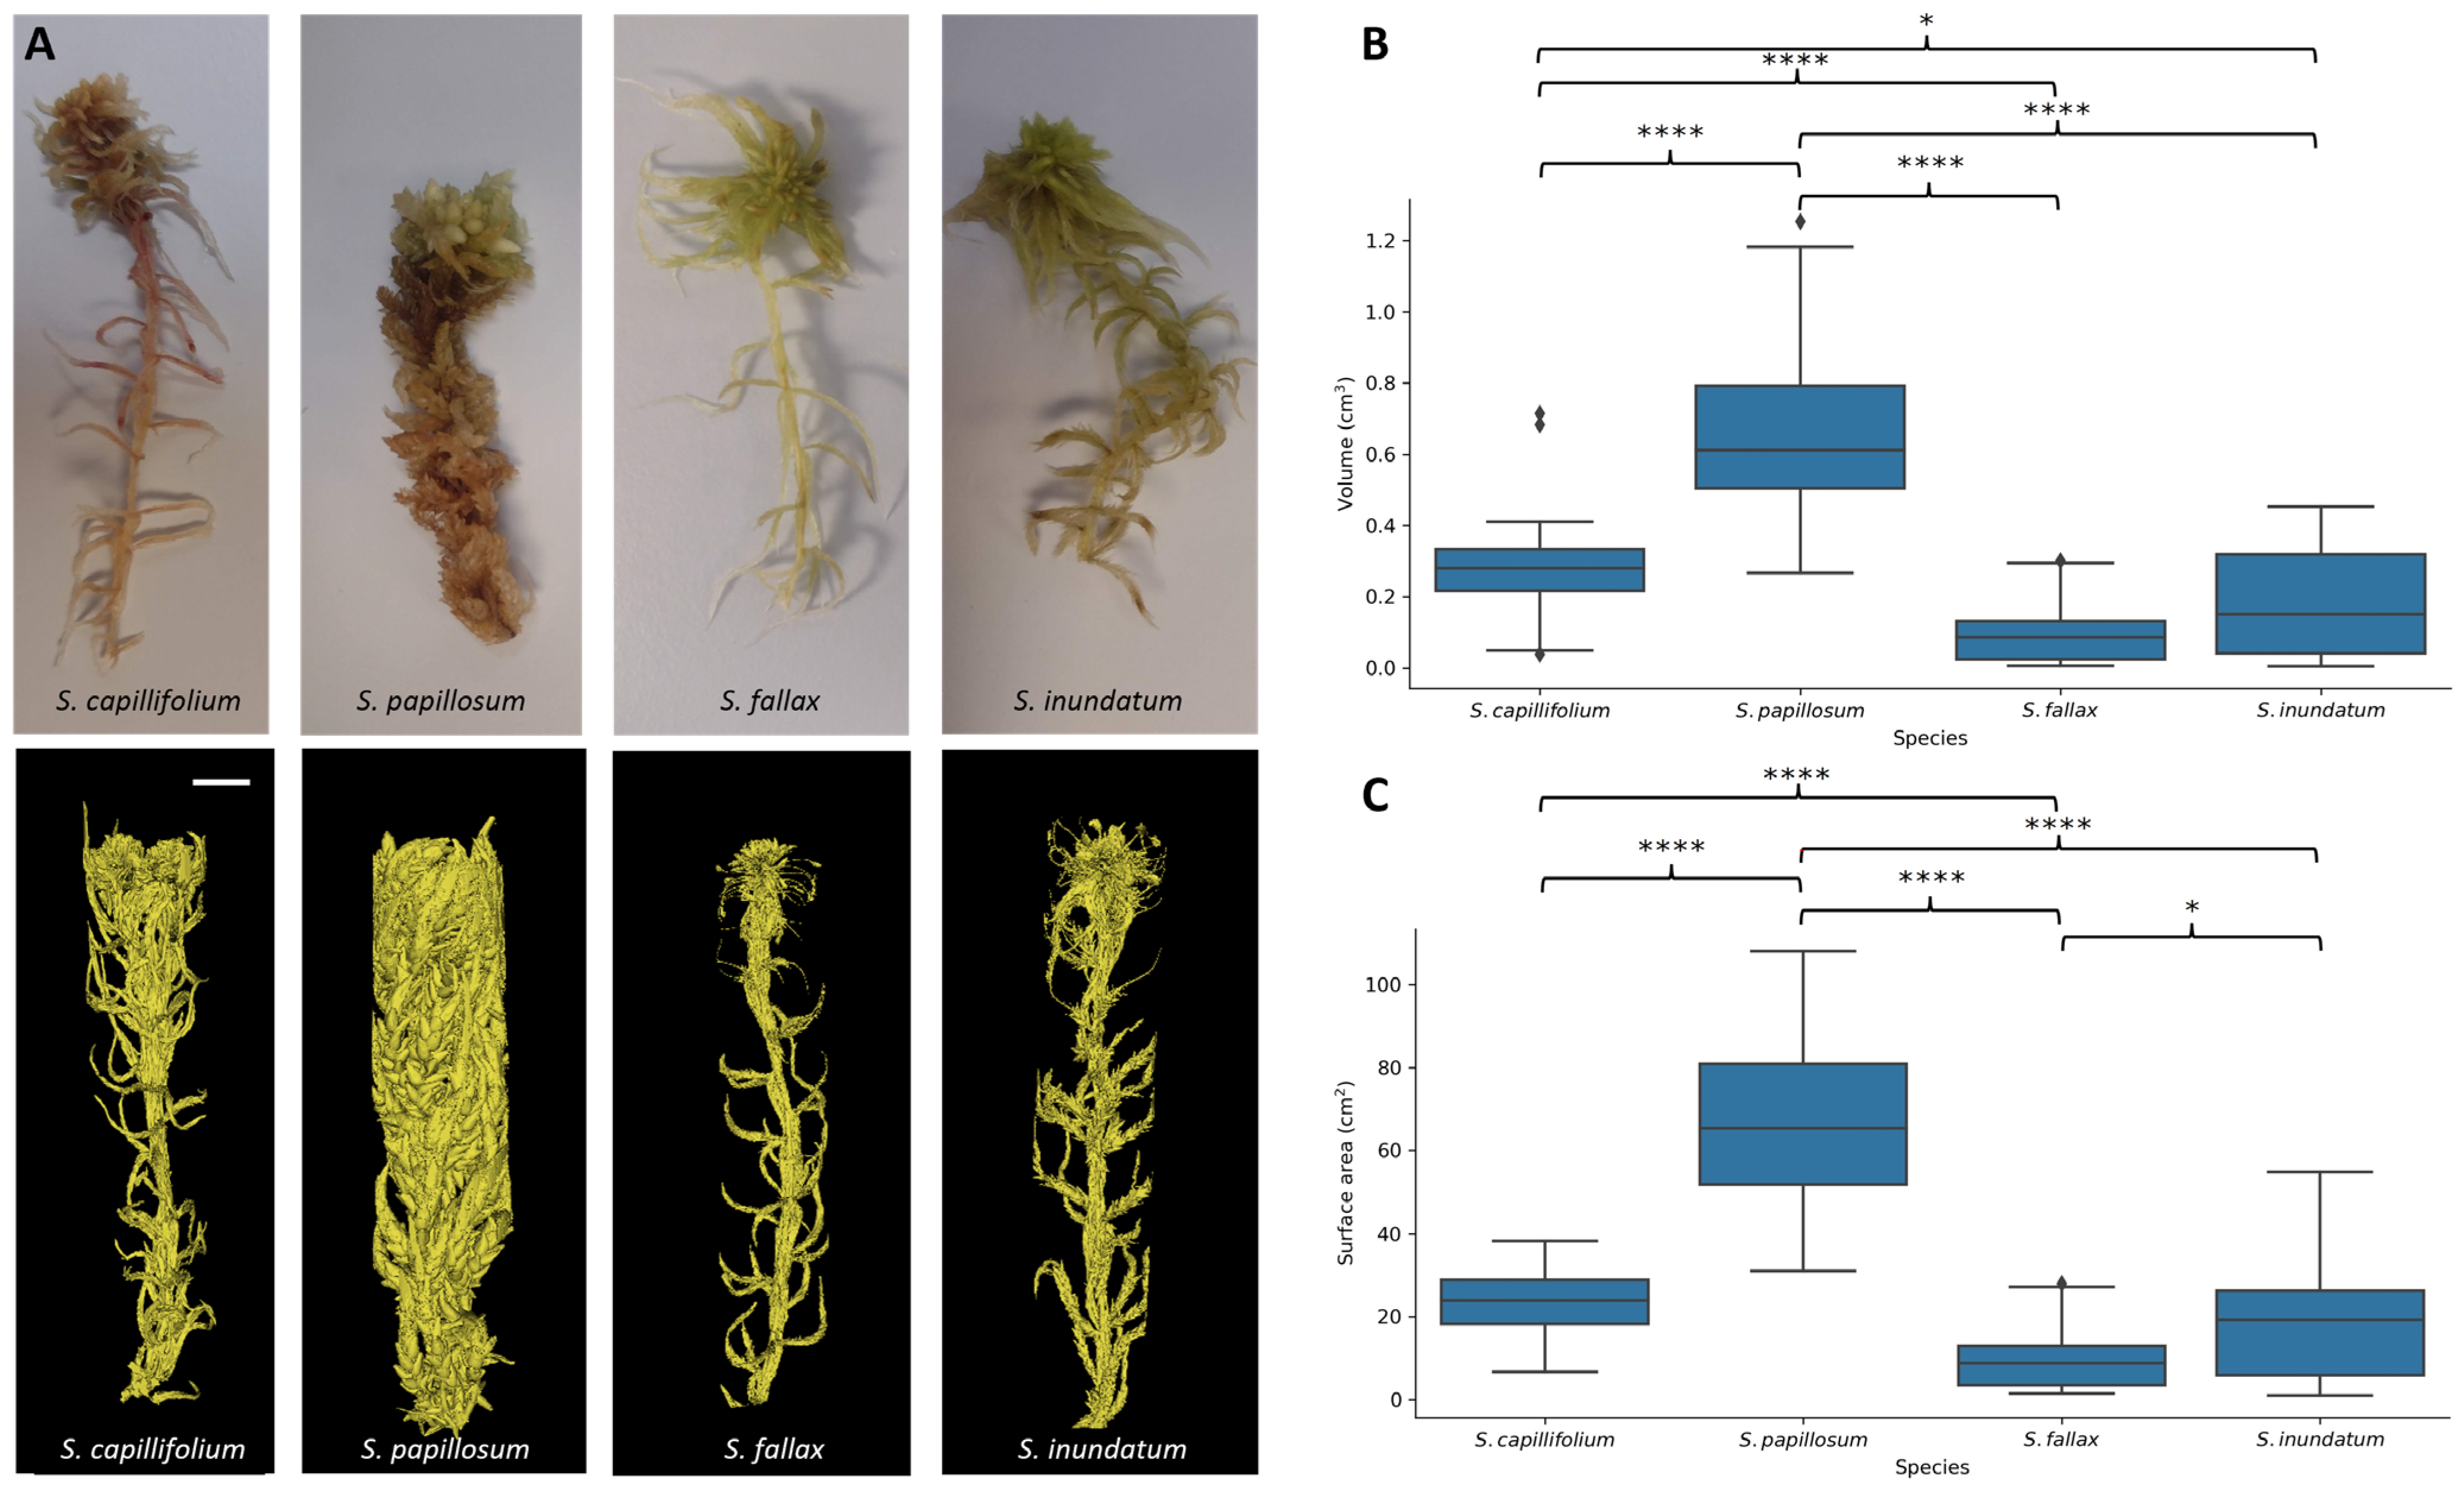
3.2. The Role of Plant Morphology
4. Materials and Methods
4.1. Plant Material
4.2. Water Removal by Centrifugation
4.3. Micro Computed Tomography (µCT) Scanning and Image Analysis
4.4. Colony Density Experiments
4.5. Statistical Analysis
Supplementary Materials
Author Contributions
Funding
Data Availability Statement
Acknowledgments
Conflicts of Interest
References
- Loisel, J.; Gallego-Sala, A.V.; Amesbury, M.J.; Magnan, G.; Anshari, G.; Beilman, D.W.; Benavides, J.C.; Blewett, J.; Camill, P.; Charman, D.J.; et al. Expet assessment of future vulnerability of the global peatland carbon sink. Nat. Clim. Change 2021, 11, 70–77. [Google Scholar] [CrossRef]
- Yu, Z.; Loisel, J.; Brosseau, D.P.; Beilman, D.W.; Hunt, S.J. Global peatland dynamics since the Last Glacial Maximum. Geophys. Res. Lett. 2010, 37, 1–5. [Google Scholar] [CrossRef]
- Leifeld, J.; Menichetti, L. The underappreciated potential of peatlands in global climate change mitigation strategies. Nat. Commun. 2018, 9, 1071. [Google Scholar] [CrossRef]
- Warren, M.; Frolking, S.; Dai, Z.; Kurnianto, S. Impacts of land use, restoration, and climate change on tropical peat carbon stocks in the twenty-first century: Implications for climate mitigation. Mitig. Adapt. Strateg. Glob. Chang. 2017, 22, 1041–1061. [Google Scholar] [CrossRef] [PubMed]
- Nibau, C.; van de Koot, W.; Spiliotis, D.; Williams, K.; Kramaric, T.; Beckmann, M.; Mur, L.; Hiwatashi, Y.; Doonan, J.H. Molecular and physiological responses to desiccation indicate the abscisic acid pathway is conserved in the peatmoss, Sphagnum. J. Exp. Bot. 2022, 73, 4576–4591. [Google Scholar] [CrossRef] [PubMed]
- Winnicka, K.; Melosik, I. Genetic and expression differences between putative ecotypes of Sphagnum denticulatum Brid. (Sphagnaceae: Bryophyta) subjected to drought stress and rehydration. Perspect. Plant Ecol. Evol. Syst. 2019, 37, 39–52. [Google Scholar] [CrossRef]
- Oliver, M.J.; Hudgeons, J.; Dowd, S.E.; Payton, P.R. A combined subtractive suppression hybridization and expression profiling strategy to identify novel desiccation response transcripts from Tortula ruralis gametophytes. Physiol. Plant. 2009, 136, 437–460. [Google Scholar] [CrossRef] [PubMed]
- Oliver, M.J.; Tuba, Z.; Mishler, B.D. The evolution of vegetative desiccation tolerance in land plants. Plant Ecol. 2000, 151, 85–100. [Google Scholar] [CrossRef]
- Bengtsson, F.; Granath, G.; Cronberg, N.; Rydin, H. Mechanisms behind species-specific water economy responses to water level drawdown in peat mosses. Ann. Bot. 2020, 126, 219–230. [Google Scholar] [CrossRef]
- Clymo, R.S.; Hayward, P.M. The Ecology of Sphagnum; Springer: Dordrecht, The Netherlands, 1982; pp. 229–289. [Google Scholar] [CrossRef]
- Elumeeva, T.G.; Soudzilovskaia, N.A.; During, H.J.; Cornelissen, J.H.C. The importance of colony structure versus shoot morphology for the water balance of 22 subarctic bryophyte species. J. Veg. Sci. 2011, 22, 152–164. [Google Scholar] [CrossRef]
- Hájek, T.; Vicherová. Desiccation tolerance of Sphagnum revisited: A puzzle resolved. Plant Biol. 2014, 16, 665–773. [Google Scholar] [CrossRef] [PubMed]
- Ligrone, R.; Duckett, J.G. Development of the leafy shoot in Sphagnum (Bryophyta) involves the activity of both apical and subapical meristems. New Phytol. 1998, 140, 581–595. [Google Scholar] [CrossRef] [PubMed]
- McCarter, C.P.R.; Price, J.S. Ecohydrology of Sphagnum moss hummocks: Mechanisms of capitula water supply and simulated effects of evaporation. Ecohydrology 2014, 7, 33–44. [Google Scholar] [CrossRef]
- Hájek, T.; Beckett, R.P. Effect of water content components on desiccation and recovery in Sphagnum mosses. Ann. Bot. 2008, 101, 165–173. [Google Scholar] [CrossRef] [PubMed]
- van Breemen, N. How Sphagnum bogs down other plants. Trends Ecol. Evol. 1995, 10, 270–275. [Google Scholar] [CrossRef]
- Lorch, W. Das mechanische System der Blätter, insbesondere der Stämmchenblätter von Sphagnum. Flora Oder Allg. Bot. Ztg. 1906, 97, 96–106. [Google Scholar] [CrossRef]
- Rice, S.K. The cost of capillary integration for bryophyte canopy water and carbon dynamics. Lindbergia 2012, 35, 53–62. [Google Scholar]
- Silvola, J.; Aaltonen, H. Water content and photosynthesis in the peat mosses Sphagnum fuscum and S. angustifolium. Ann. Bot. Fenn. 1984, 21, 1–6. [Google Scholar]
- Stenøien, H.; Bakken, S.; Flatberg, K.I. Phenotypic variation in the Sphagnum recurvum complex: A cultivation experiment. J. Bryol. 1997, 19, 731–750. [Google Scholar] [CrossRef]
- Rydin, H.; Clymo, R.S. Transport of carbon and phosphorus compounds about Sphagnum. Proc. R. Soc. London. B Biol. Sci. 1989, 237, 63–84. [Google Scholar] [CrossRef]
- Bengtsson, F.; Granath, G.; Rydin, H. Photosynthesis, growth, and decay traits in Sphagnum—A multispecies comparison. Ecol. Evol. 2016, 6, 3325–3341. [Google Scholar] [CrossRef] [PubMed]
- Cruz de Carvalho, R.; Maurício, A.; Pereira, M.F.; Marques da Silva, J.; Branquinho, C. All for One: The Role of Colony Morphology in Bryophyte Desiccation Tolerance. Front. Plant Sci. 2019, 10, 1360. [Google Scholar] [CrossRef] [PubMed]
- van de Koot, W.Q.M.; van Vliet, L.J.J.; Chen, W.; Doonan, J.H.; Nibau, C. Development of an image analysis pipeline to estimate Sphagnum colony density in the field. Plants 2021, 10, 840. [Google Scholar] [CrossRef] [PubMed]
- Mulligan, R.C.; Gignac, L.D. Bryophyte community structure in a boreal poor fen: Reciprocal transplants. Can. J. Bot. Rev. Can. Bot. 2001, 79, 404–411. [Google Scholar] [CrossRef]
- Price, J.S.; Whittington, P.N. Water flow in Sphagnum hummocks: Mesocosm measurements and modelling. J. Hydrol. 2010, 381, 333–340. [Google Scholar] [CrossRef]
- Weber, T.K.D.; Iden, S.C.; Durner, W. Unsaturated hydraulic properties of Sphagnum moss and peat reveal trimodal pore-size distributions. Water Resour. Res. 2017, 53, 415–434. [Google Scholar] [CrossRef]
- Johnson, M.G.; Granath, G.; Tahvanainen, T.; Pouliot, R.; Stenien, H.K.; Rochefort, L.; Rydin, H.; Shaw, A.J. Evolution of niche preference in Sphagnum peat mosses. Evolution 2015, 69, 90–103. [Google Scholar] [CrossRef] [PubMed]
- Schipperges, B.; Rydin, H. Response of photosynthesis of Sphagnum species from contrasting microhabitats to tissue water content and repeated desiccation. New Phytol. 1998, 140, 677–684. [Google Scholar] [CrossRef]
- Piatkowski, B.T.; Shaw, A.J. Functional trait evolution in Sphagnum peat mosses and its relationship to niche construction. New Phytol. 2019, 223, 939–949. [Google Scholar] [CrossRef]
- Kremer, C.L.; Drinnan, A.N. Secondary walls in hyaline cells of Sphagnum. Aust. J. Bot. 2004, 52, 243–256. [Google Scholar] [CrossRef]
- Gong, J.; Roulet, N.; Frolking, S.; Peltola, H.; Laine, A.M.; Kokkonen, N.; Tuittila, E.S. Modelling the habitat preference of two key Sphagnum species in a poor fen as controlled by capitulum water content. Biogeosciences 2020, 17, 5693–5719. [Google Scholar] [CrossRef]
- Fedorov, A.; Beichel, R.; Kalpathy-Cramer, J.; Finet, J.; Fillion-Robin, J.C.; Pujol, S.; Bauer, C.; Jennings, D.; Fennessy, F.; Sonka, M.; et al. 3D Slicer as an image computing platform for the Quantitative Imaging Network. Magn. Reson. Imaging 2012, 30, 1323–1341. [Google Scholar] [CrossRef] [PubMed]
- RStudioTeam. RStudio: Integrated Development for R. RStudio; PBC: Boston, MA, USA, 2020. [Google Scholar]
- Fox, J.; Weisberg, S. An R Companion to Applied Regression, 3rd ed.; Sage Publications: Thousand Oaks, CA, USA, 2019. [Google Scholar]
- Kassambara, A. ggpubr Package, R Documentation; R Core Team: Vienna, Austria, 2016. [Google Scholar]
- Waskom, M.; Gelbart, M.; Botvinnik, O.; Ostblom, J.; Hobson, P.; Lukauskas, S.; Gemperline, D.C.; Augspurger, T.; Halchenko, Y.; Warmenhoven, J.; et al. Seaborn; Version v0.11.1; December 2020; Zenodo: Meyrin, Switzerland, 2020; Available online: https://zenodo.org/records/4379347 (accessed on 1 October 2022).
- Hunter, J.D. Matplotlib: A 2D graphics environment. Comput. Sci. Eng. 2007, 9, 90–95. [Google Scholar] [CrossRef]


Disclaimer/Publisher’s Note: The statements, opinions and data contained in all publications are solely those of the individual author(s) and contributor(s) and not of MDPI and/or the editor(s). MDPI and/or the editor(s) disclaim responsibility for any injury to people or property resulting from any ideas, methods, instructions or products referred to in the content. |
© 2024 by the authors. Licensee MDPI, Basel, Switzerland. This article is an open access article distributed under the terms and conditions of the Creative Commons Attribution (CC BY) license (https://creativecommons.org/licenses/by/4.0/).
Share and Cite
van de Koot, W.Q.M.; Msonda, J.; Olver, O.P.; Doonan, J.H.; Nibau, C. Variation in Water-Holding Capacity in Sphagnum Species Depends on Both Plant and Colony Structure. Plants 2024, 13, 1061. https://doi.org/10.3390/plants13081061
van de Koot WQM, Msonda J, Olver OP, Doonan JH, Nibau C. Variation in Water-Holding Capacity in Sphagnum Species Depends on Both Plant and Colony Structure. Plants. 2024; 13(8):1061. https://doi.org/10.3390/plants13081061
Chicago/Turabian Stylevan de Koot, Willem Q. M., James Msonda, Olga P. Olver, John H. Doonan, and Candida Nibau. 2024. "Variation in Water-Holding Capacity in Sphagnum Species Depends on Both Plant and Colony Structure" Plants 13, no. 8: 1061. https://doi.org/10.3390/plants13081061
APA Stylevan de Koot, W. Q. M., Msonda, J., Olver, O. P., Doonan, J. H., & Nibau, C. (2024). Variation in Water-Holding Capacity in Sphagnum Species Depends on Both Plant and Colony Structure. Plants, 13(8), 1061. https://doi.org/10.3390/plants13081061