

Improving Tuber Yield of Tiger Nut (Cyperus esculentus L.) through Nitrogen Fertilization in Sandy Farmland

 ,
,  ,
,
Abstract
1. Introduction
2. Materials and Methods
2.1. Site Description
2.2. Experimental Design
2.3. Sampling and Measurement
2.3.1. Canopy Apparent Photosynthesis Rate
2.3.2. Leaf Functional Traits
2.3.3. Tuber Expansion
2.3.4. Nitrogen Content
2.3.5. Yield and Yield Components
2.4. Indicator Calculation
2.4.1. Nitrogen Utilization
2.4.2. Tuber Expansion Characteristics
2.5. Statistical Analysis
3. Results
3.1. Yield and Composition of Tiger Nut
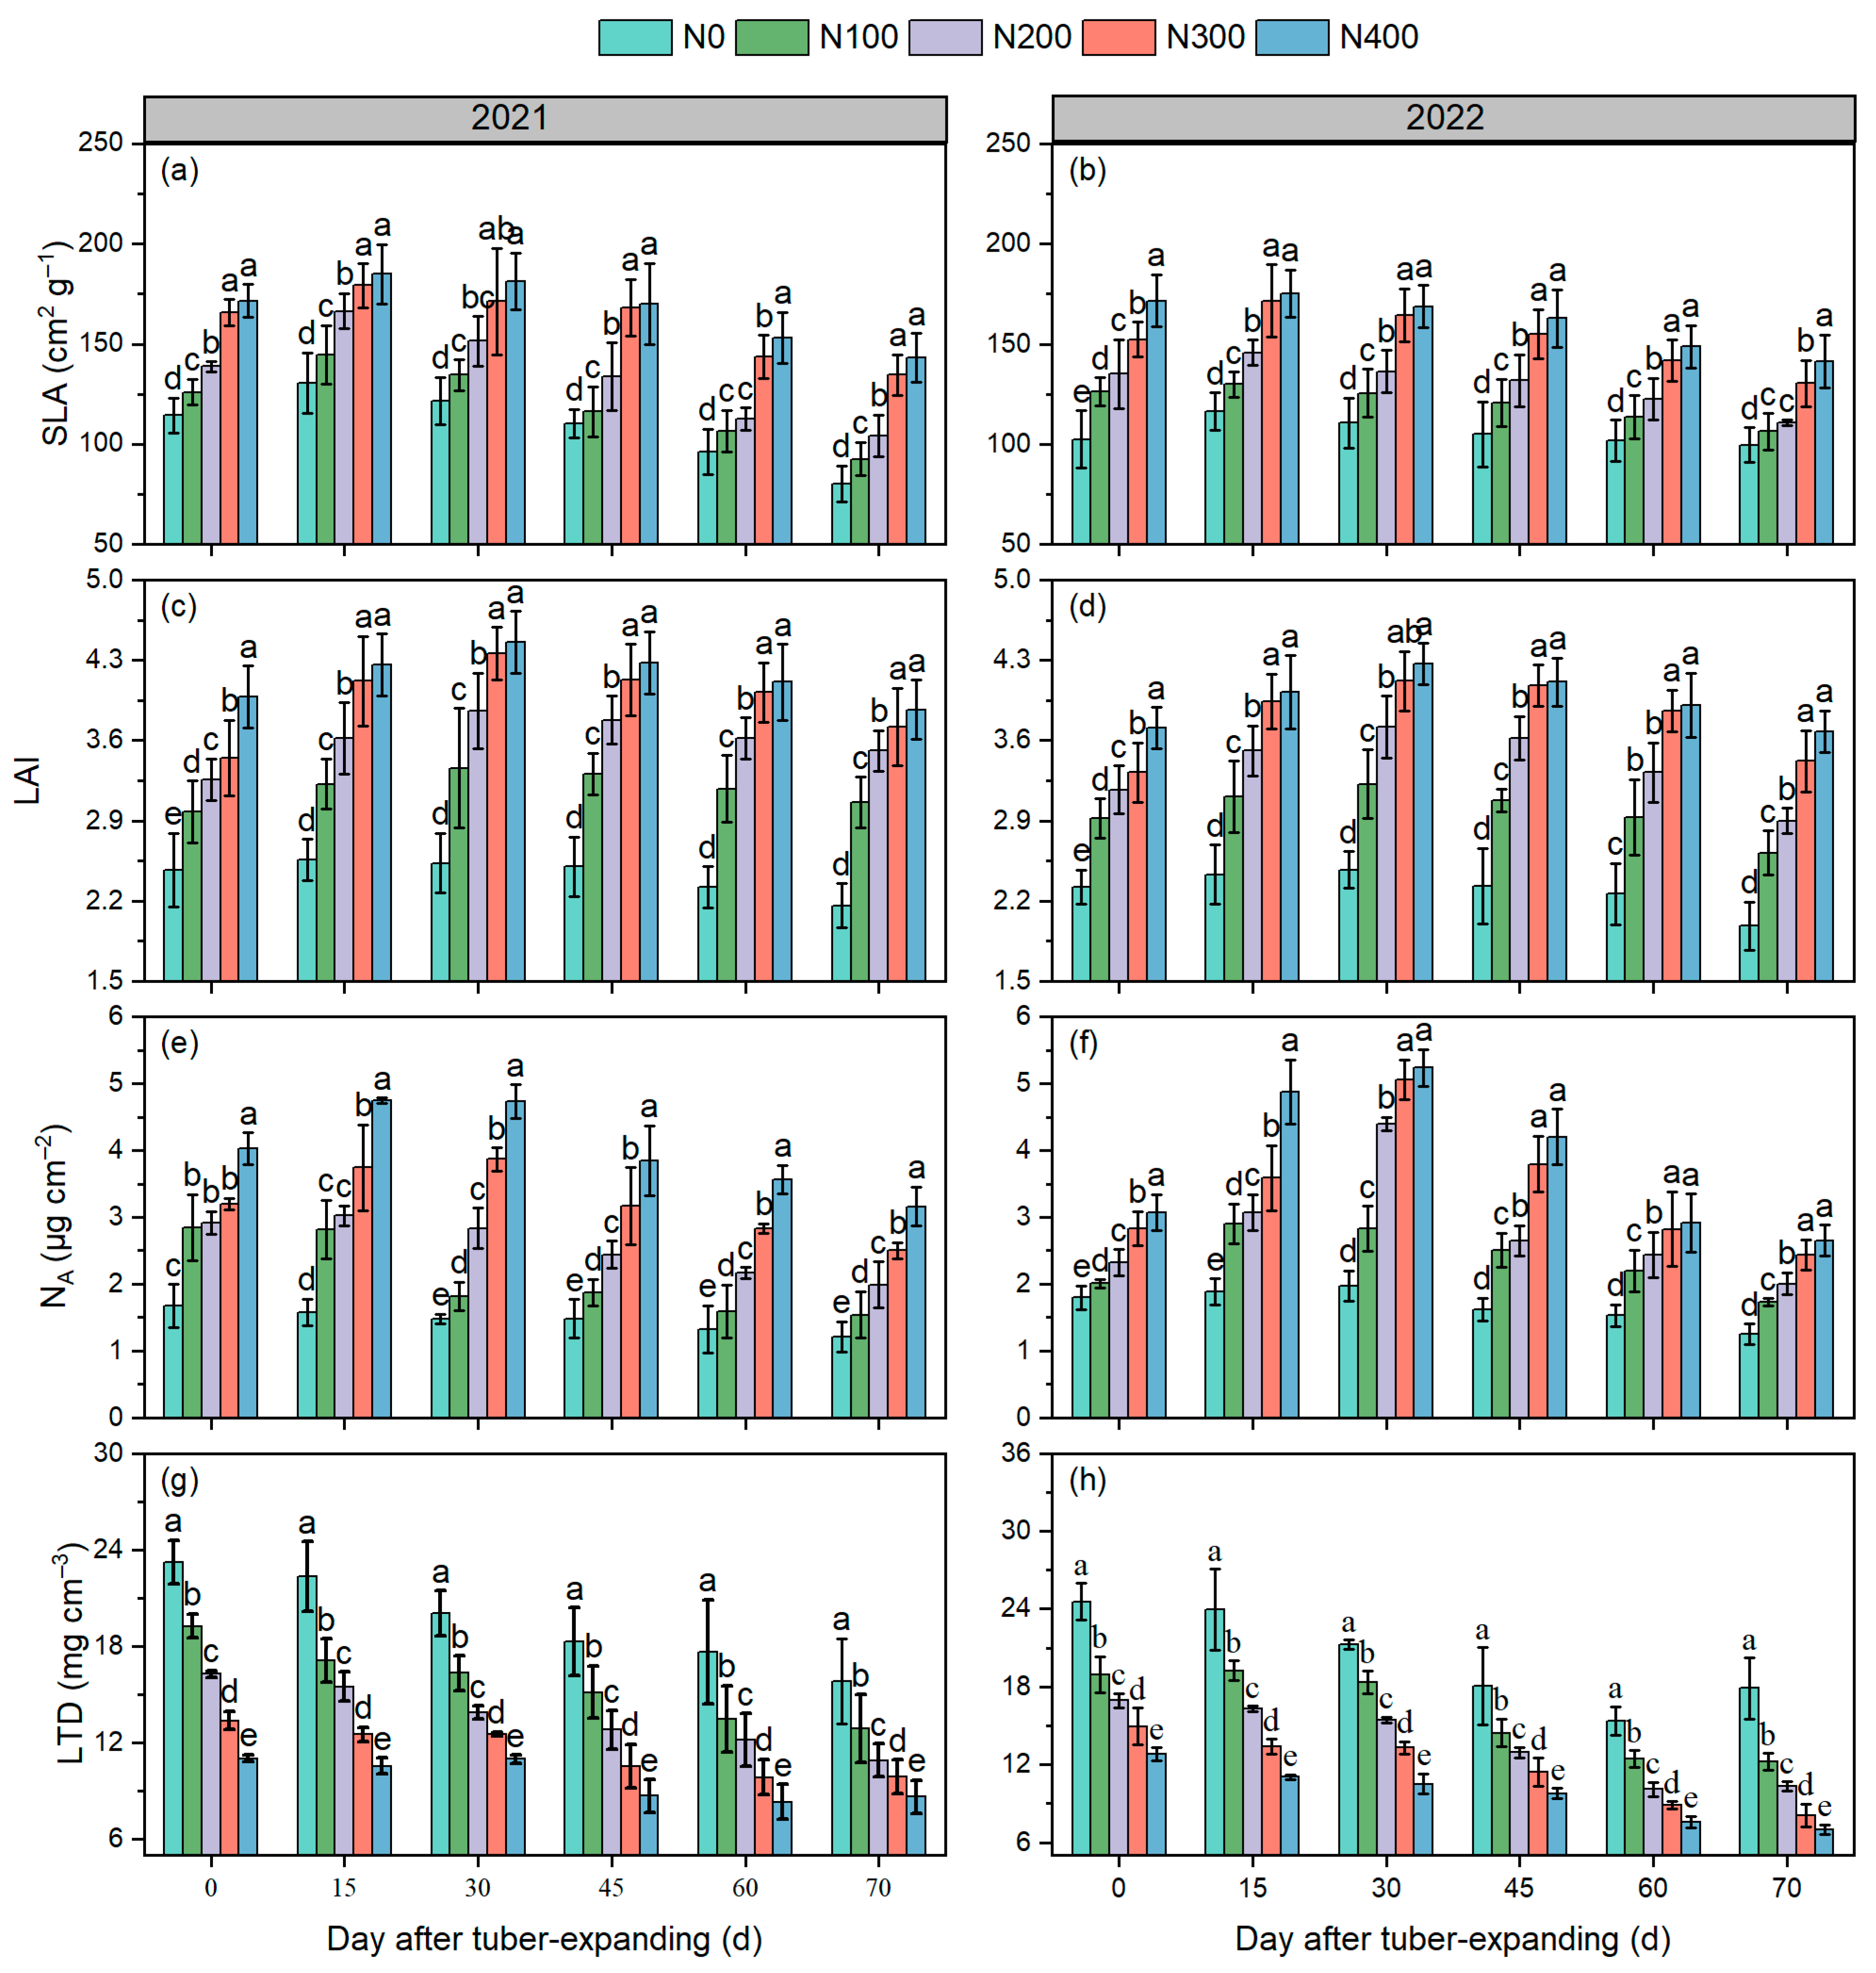
3.2. Leaf Functional Traits
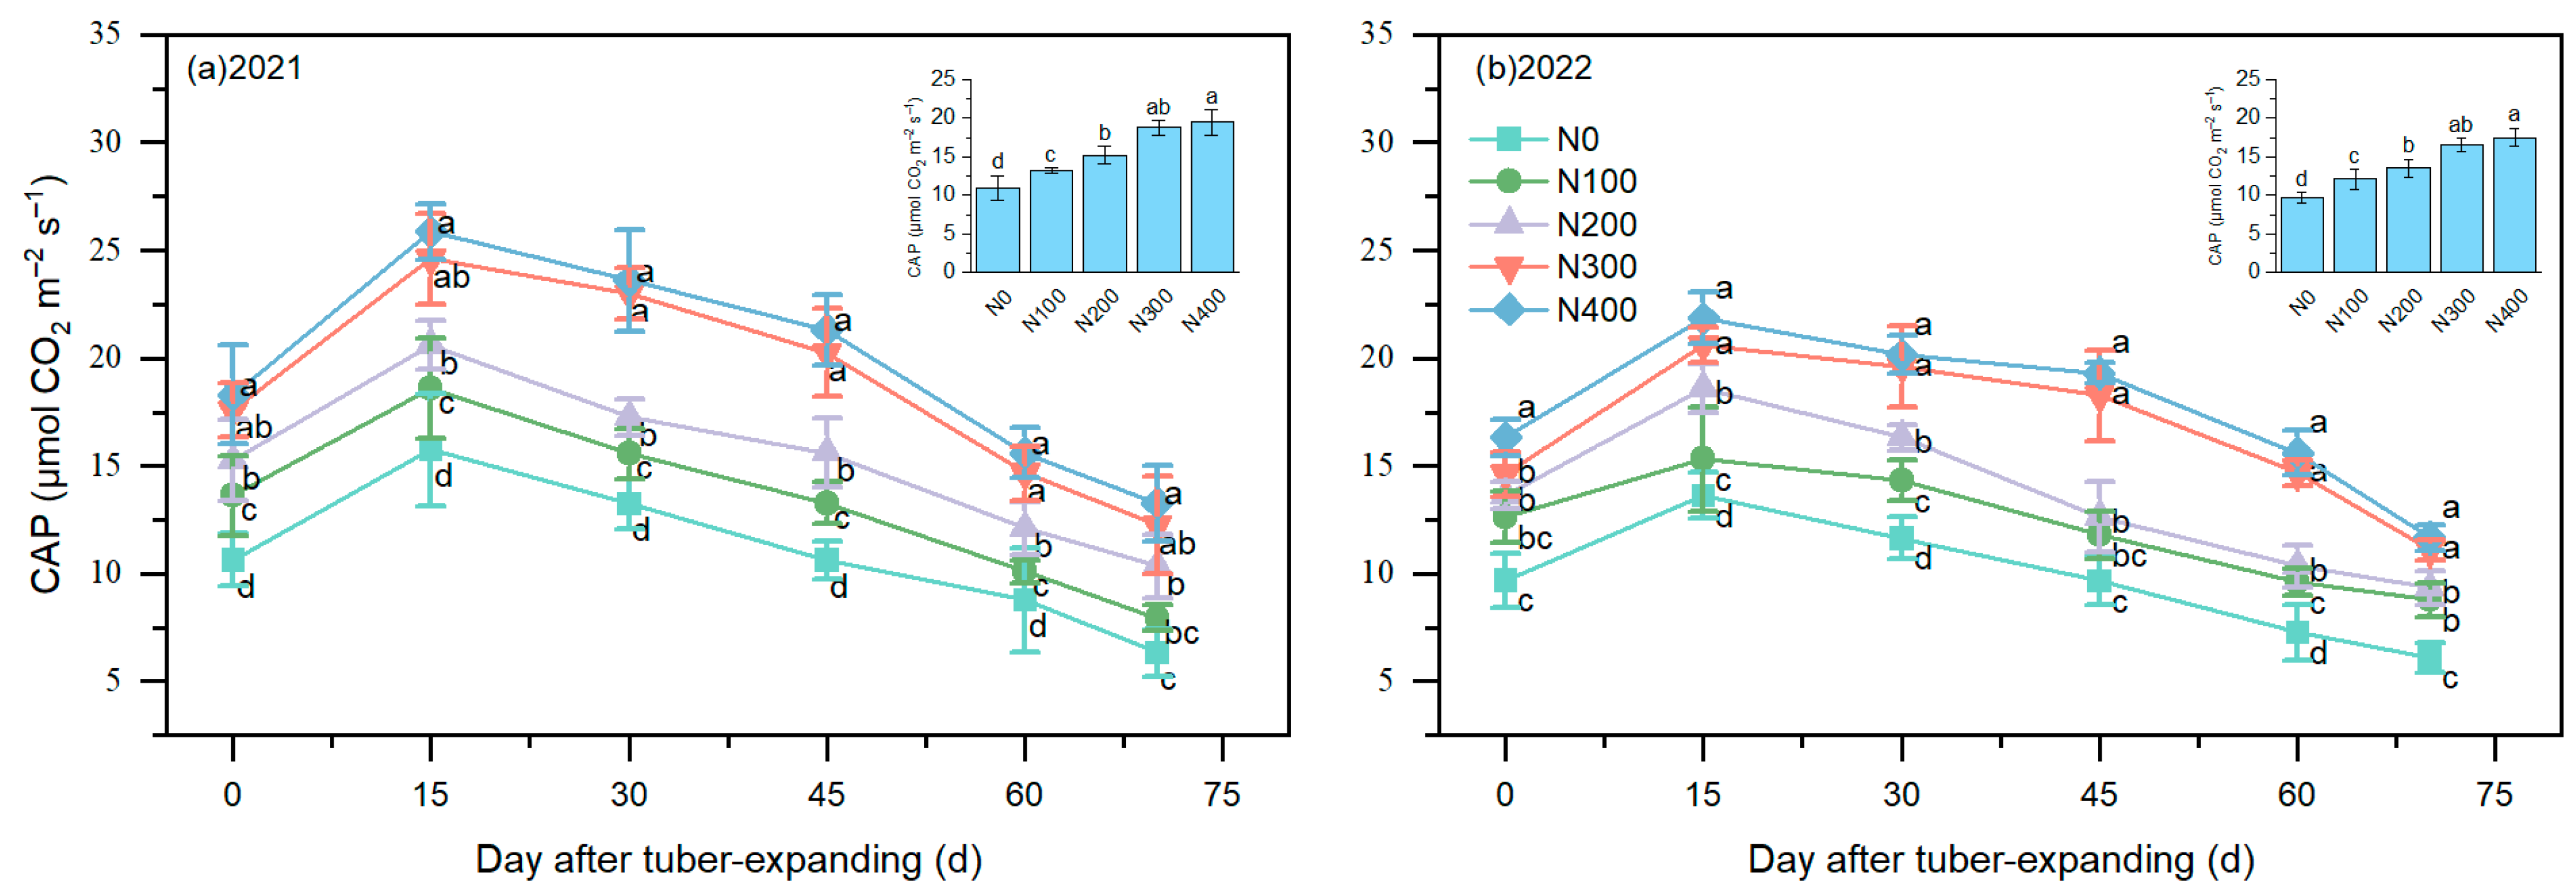
3.3. Canopy Apparent Photosynthesis Rate
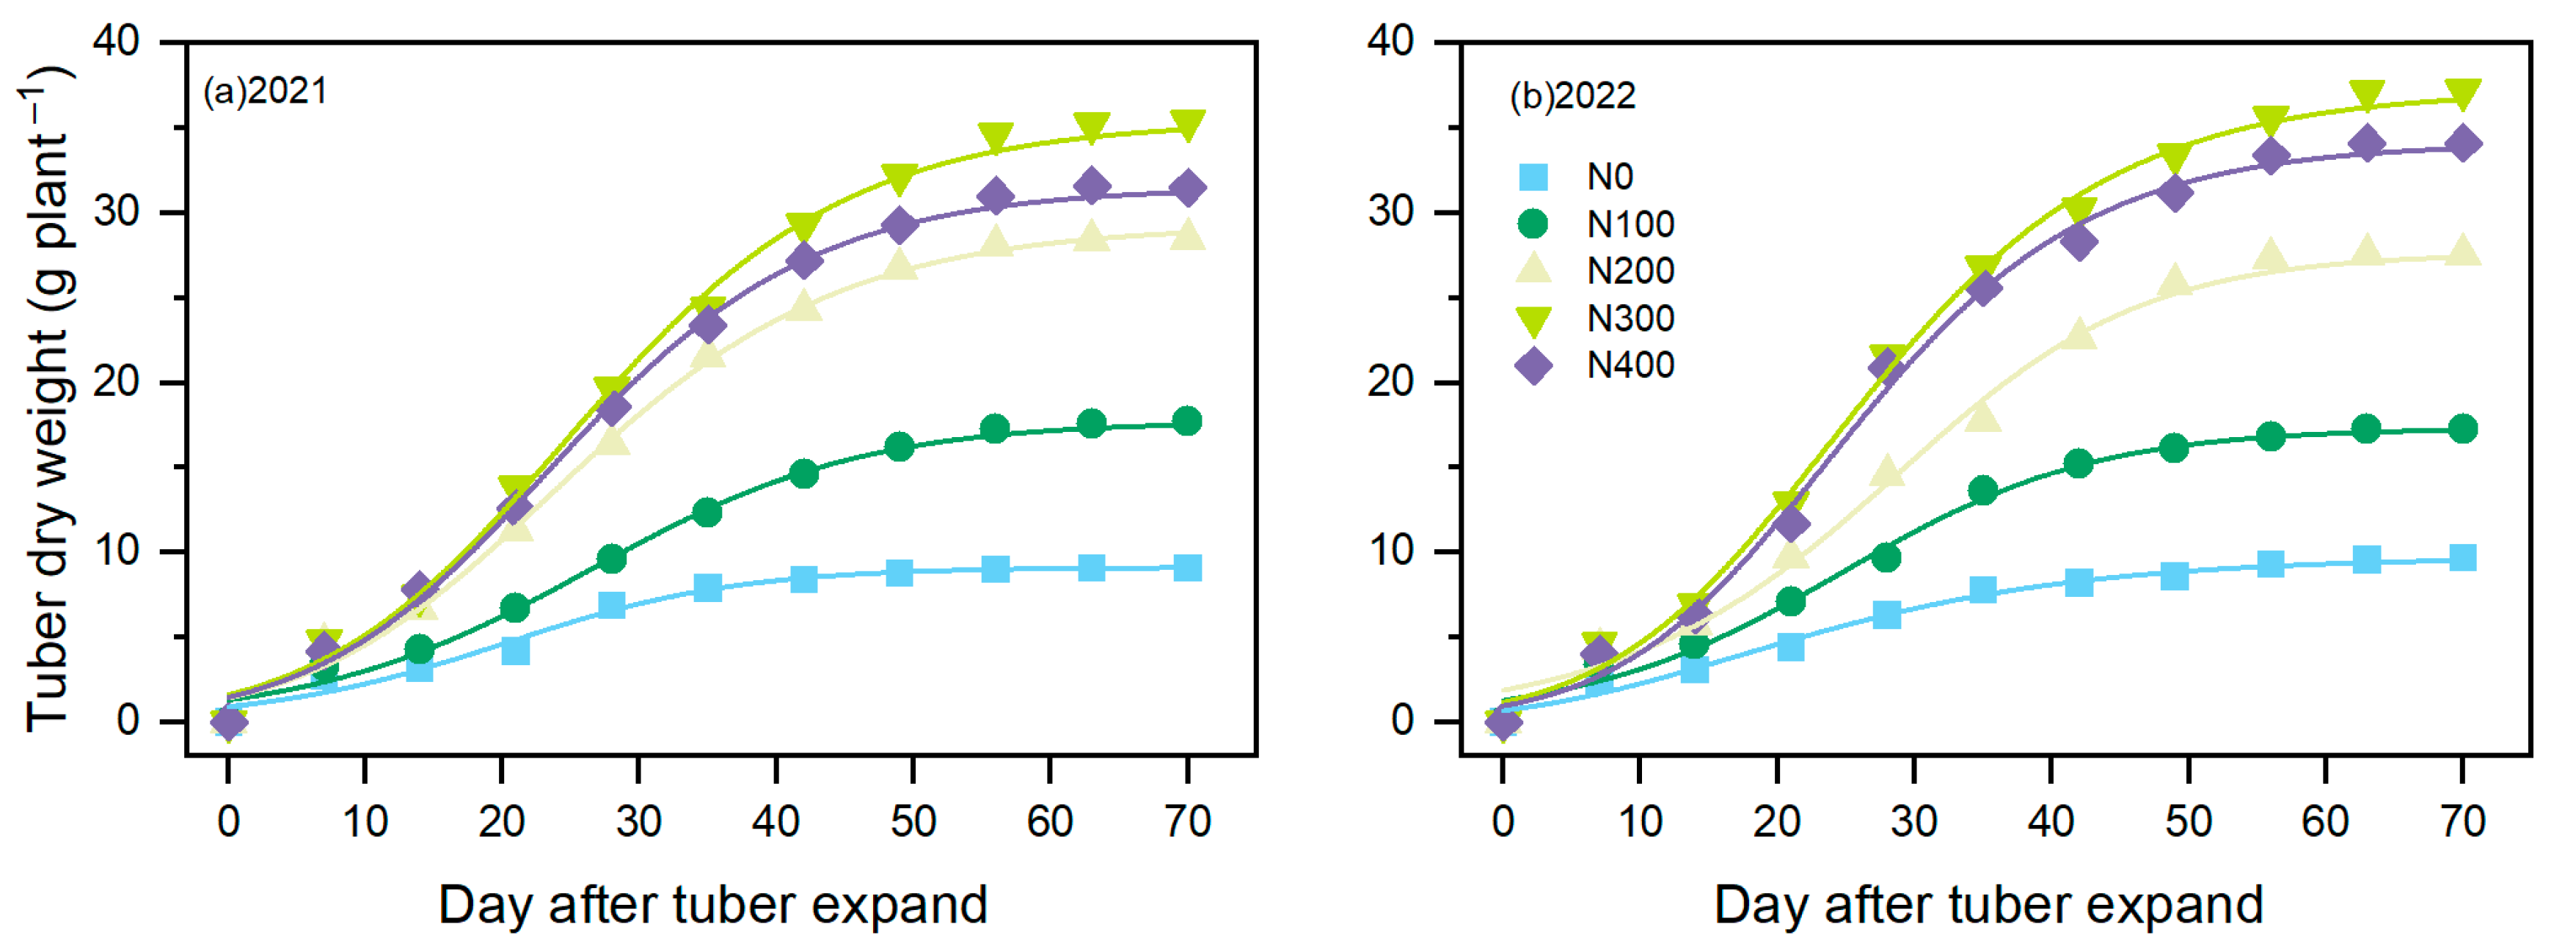
3.4. Tuber Expansion Characteristics
3.5. Nitrogen Use Efficiency
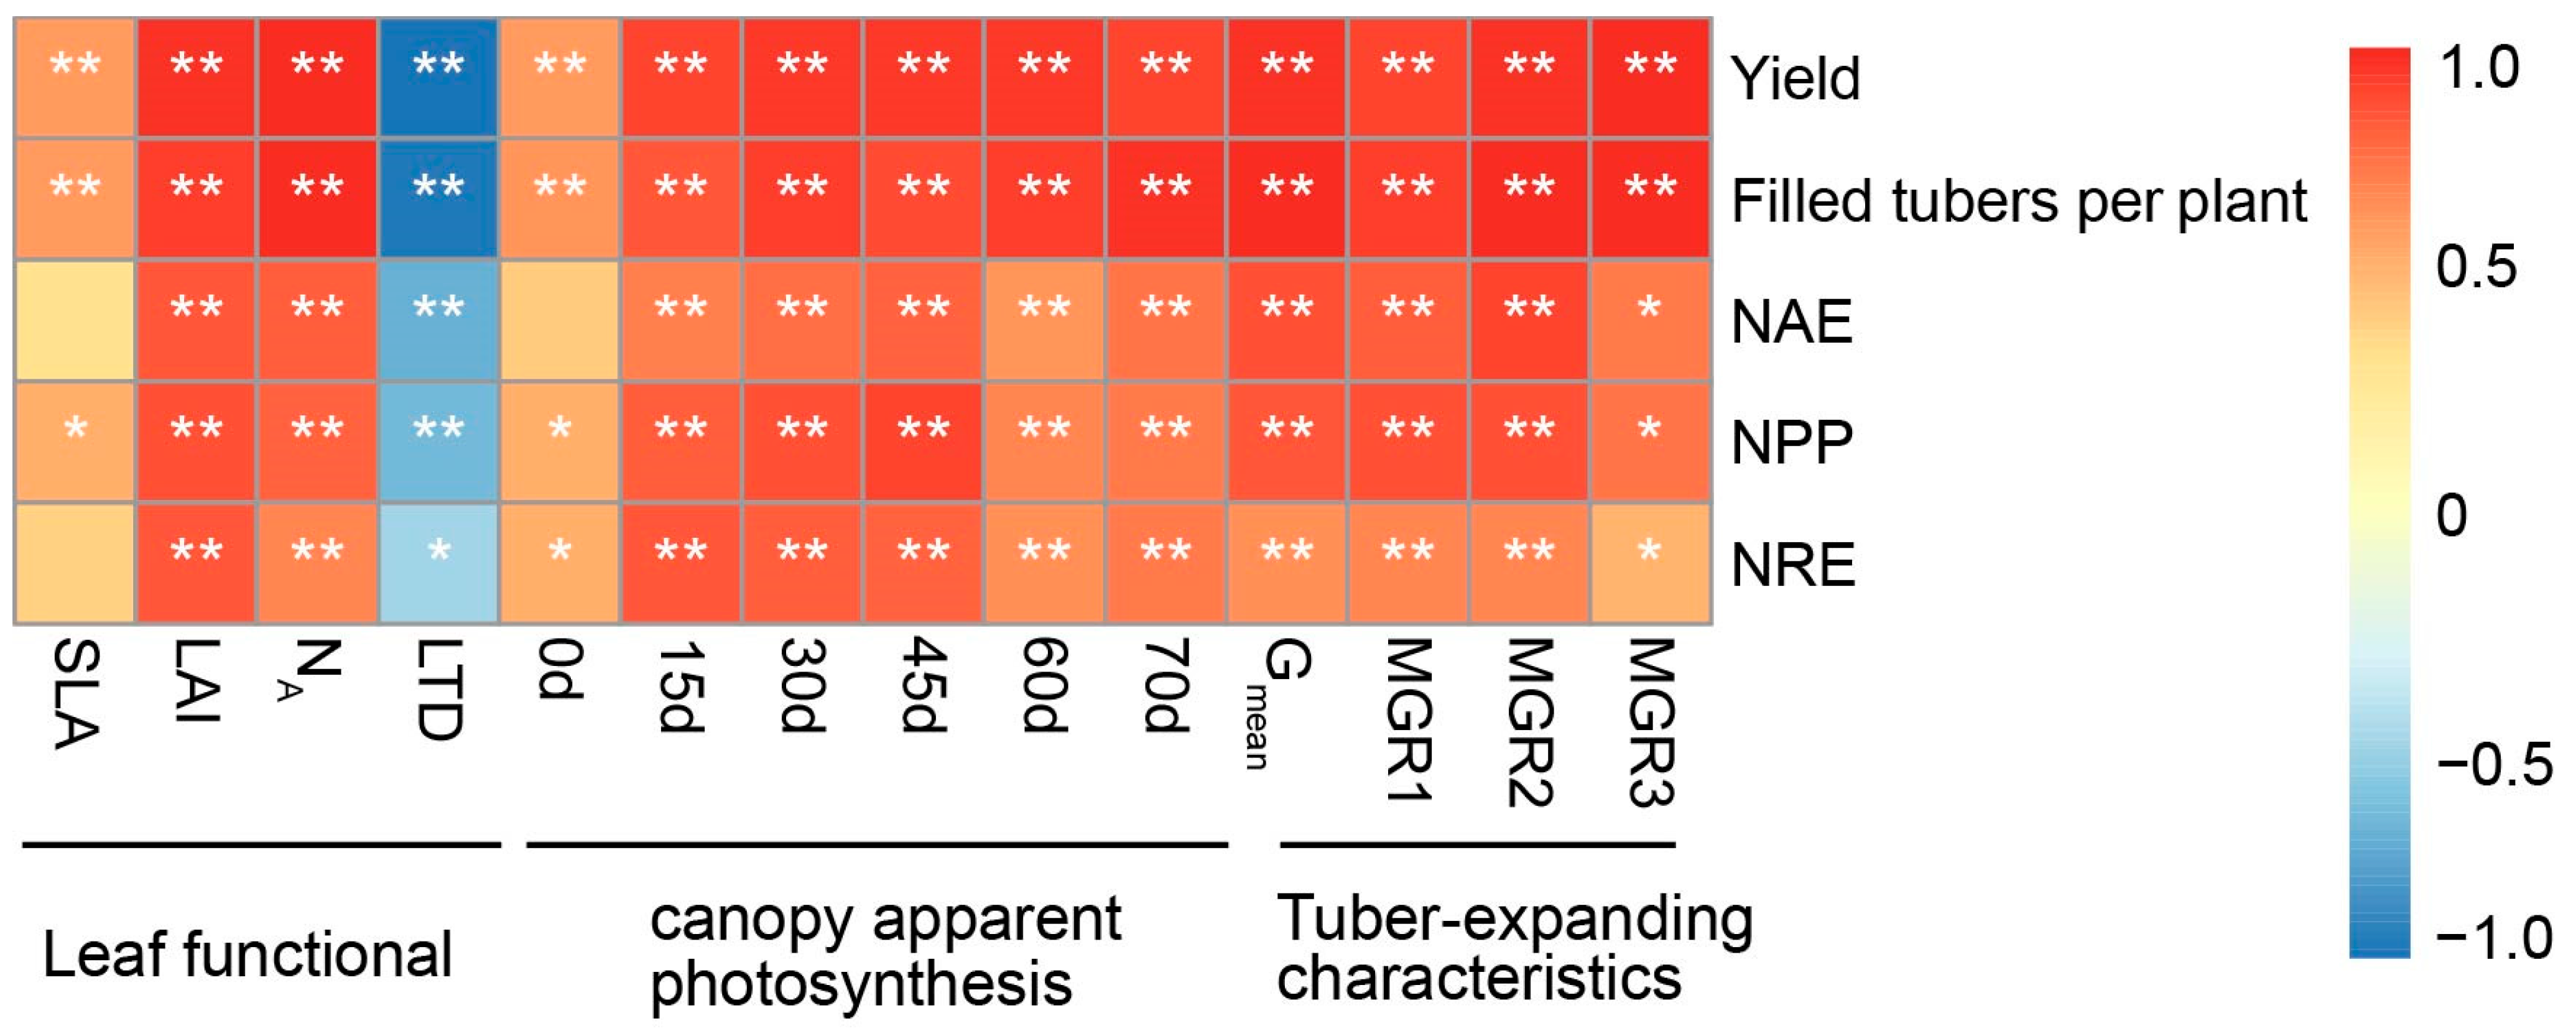
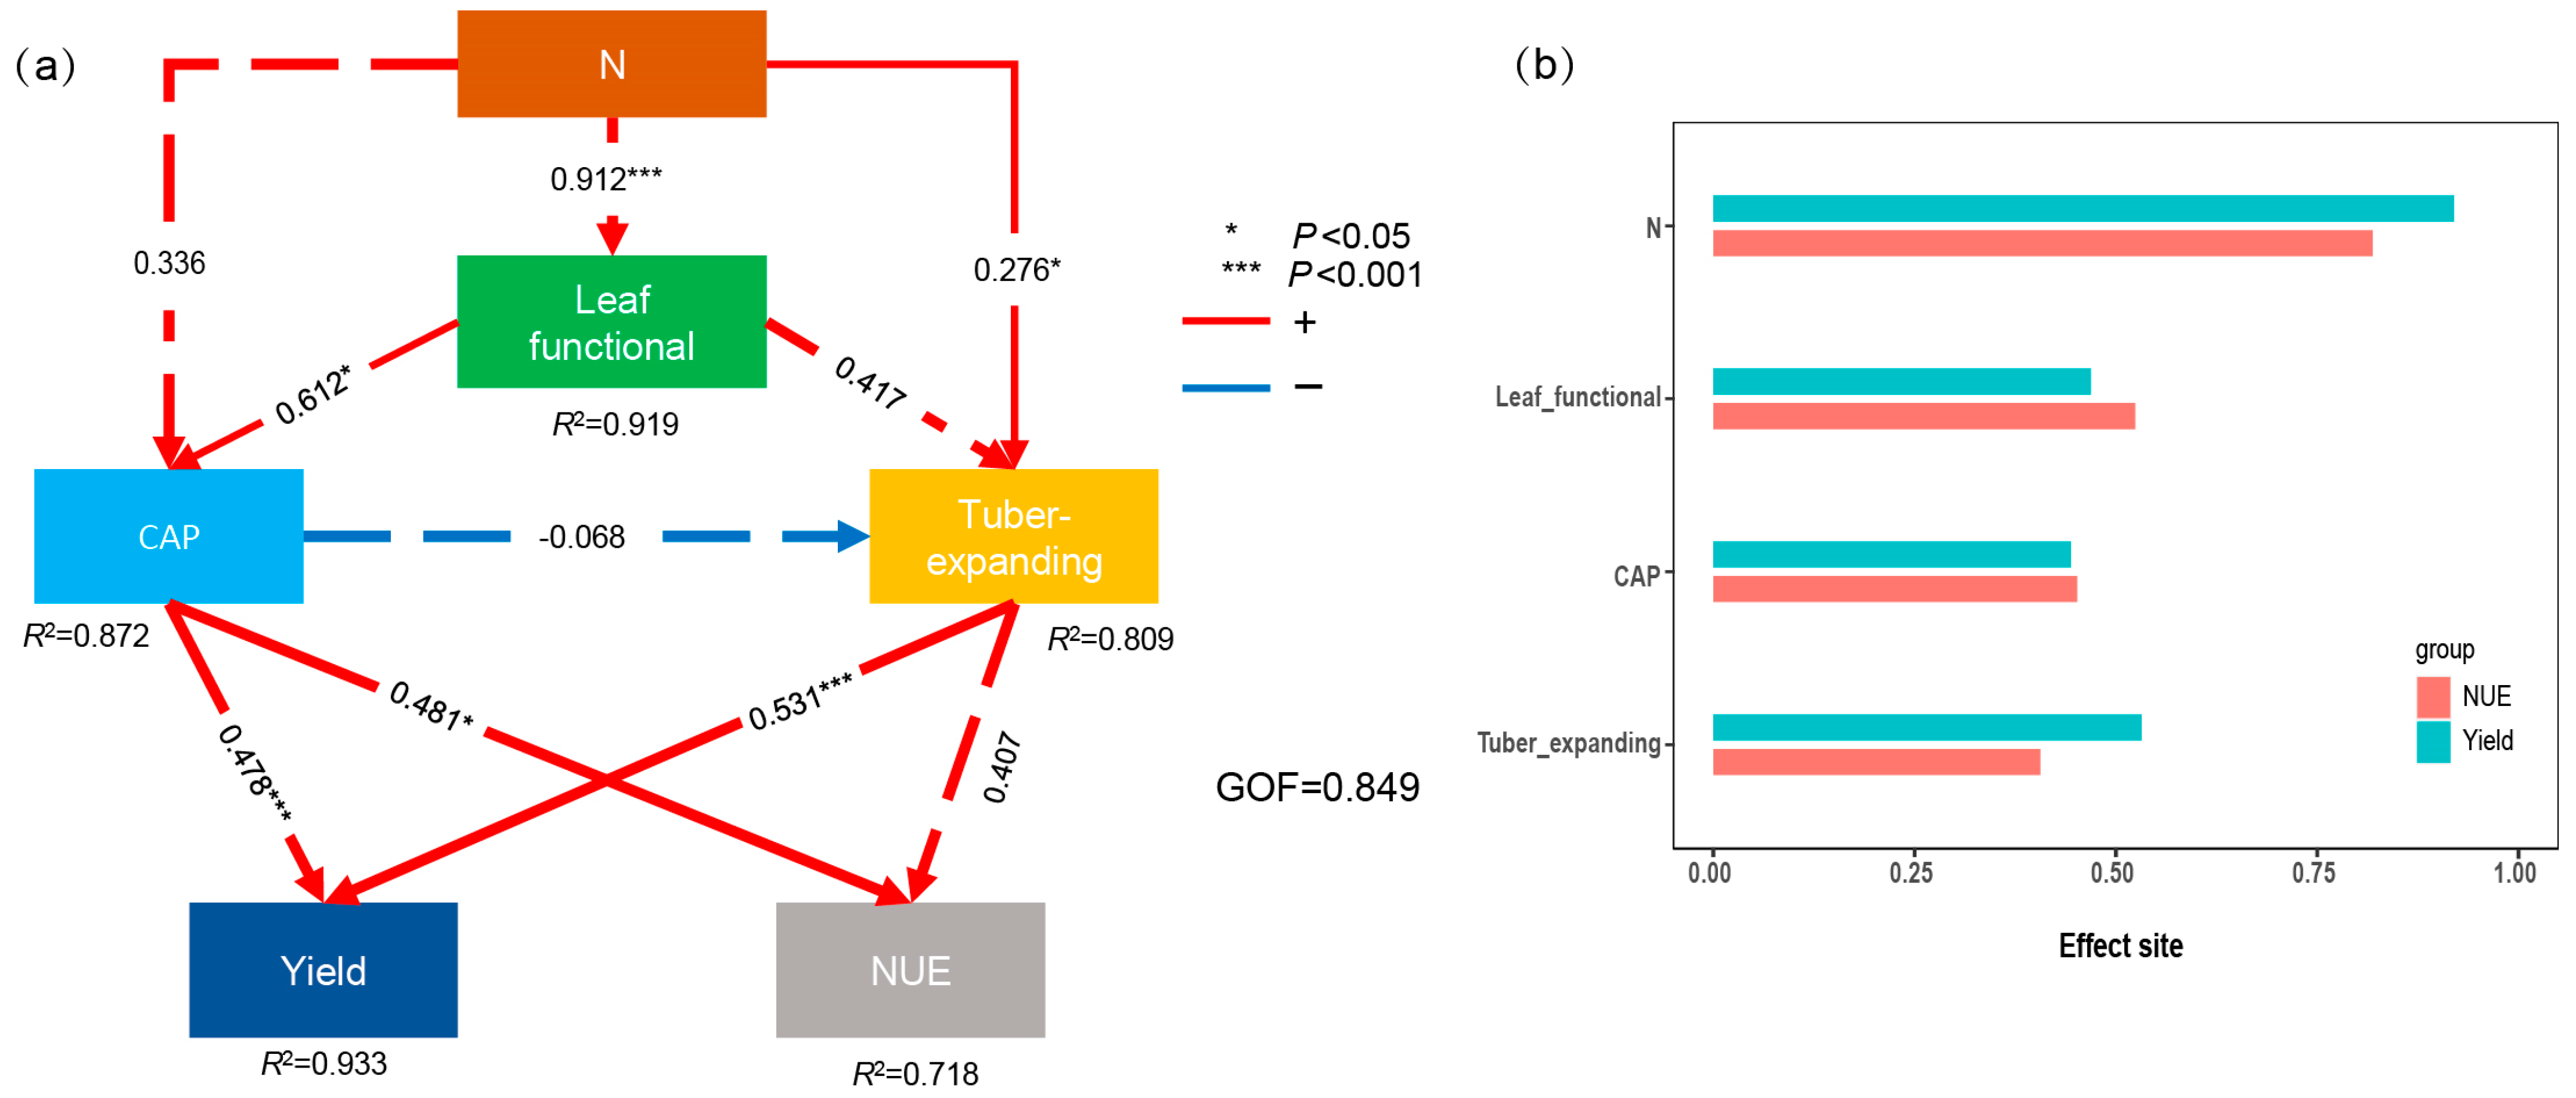
3.6. Correlations between Yield and NUE
4. Discussion
4.1. Yield and Yield Formation
4.2. Relationship between NUE and Tuber Yield
4.3. Synergistically Improving the Tuber Yield and NUE
5. Conclusions
Supplementary Materials
Author Contributions
Funding
Data Availability Statement
Conflicts of Interest
References
- Tan, J.; Wu, X.; He, Y.; Li, Y.; Li, X.; Yu, X.; Shi, J. Mutual feedback mechanisms between functional traits and soil nutrients drive adaptive potential of tiger nuts (Cyperus esculentus L.) in marginal land. Plant Soil 2023, 495, 177–194. [Google Scholar] [CrossRef]
- Rebezov, M.; Usman Khan, M.; Bouyahya, A.; Imran, M.; Tufail, T.; Loretts, O.; Neverova, O.; Artyukhova, S.; Kuznetsova, E.; Ermolaev, V. Nutritional and technical aspect of tiger nut and its micro-constituents: An overview. Food Rev. Int. 2023, 39, 3262–3282. [Google Scholar] [CrossRef]
- Fang, L.; Martre, P.; Jin, K.; Du, X.; van der Putten, P.E.; Yin, X.; Struik, P.C. Neglecting acclimation of photosynthesis under drought can cause significant errors in predicting leaf photosynthesis in wheat. Glob. Chang. Biol. 2023, 29, 505–521. [Google Scholar] [CrossRef] [PubMed]
- Du, Y.; Zhang, Y.; Chai, X.; Li, X.; Ullah, A.; Islam, W.; Zhang, Z.; Zeng, F. Effects of different tillage systems and mowing time on nutrient accumulation and forage nutritive value of Cyperus esculentus. Front. Plant Sci. 2023, 14, 1162572. [Google Scholar] [CrossRef] [PubMed]
- Asare, P.A.; Kpankpari, R.; Adu, M.O.; Afutu, E.; Adewumi, A.S. Phenotypic characterization of tiger nuts (Cyperus esculentus L.) from major growing areas in Ghana. Sci. World J. 2020, 2020, 7232591. [Google Scholar] [CrossRef]
- Pascual-Seva, N.; Pascual, B. Determination of crop coefficient for chufa crop (Cyperus esculentus L. var. sativus Boeck.) for sustainable irrigation scheduling. Sci. Total Environ. 2021, 768, 144975. [Google Scholar] [CrossRef] [PubMed]
- Fadeyi, O.J.; Fabunmi, T.O.; Soretire, A.A.; Olowe, V.I.O.; Raphael, A.O. Application of Moringa leaves as soil amendment to tiger-nut for suppressing weeds in the Nigerian Savanna. BMC Plant Biol. 2023, 23, 187. [Google Scholar] [CrossRef] [PubMed]
- Tang, B.; Rocci, K.S.; Lehmann, A.; Rillig, M.C. Nitrogen increases soil organic carbon accrual and alters its functionality. Glob. Chang. Biol. 2023, 29, 1971–1983. [Google Scholar] [CrossRef] [PubMed]
- Kon’kova, N.G.; Khoreva, V.I.; Popov, V.S.; Yakusheva, T.V.; Malyshev, L.L.; Solovyeva, A.E.; Shelenga, T.V. Variability of the Main Economically Valuable Characteristics of Cyperus esculentus L. in Various Ecological and Geographical Conditions. Plants 2024, 13, 308. [Google Scholar] [CrossRef]
- Kiesel, A.; von Cossel, M.; Clifton-Brown, J.; Lewandowski, I. Valorisation of marginal agricultural land in the bioeconomy. Glob. Chang. Biol. Bioenergy 2023, 15, 1418–1423. [Google Scholar] [CrossRef]
- Mehmood, M.A.; Ibrahim, M.; Rashid, U.; Nawaz, M.; Ali, S.; Hussain, A.; Gull, M. Biomass production for bioenergy using marginal lands. Sustain. Prod. Consum. 2017, 9, 3–21. [Google Scholar] [CrossRef]
- Yao, H.; Zhang, Y.; Yi, X.; Zhang, X.; Zhang, W. Cotton responds to different plant population densities by adjusting specific leaf area to optimize canopy photosynthetic use efficiency of light and nitrogen. Field Crops Res. 2016, 188, 10–16. [Google Scholar] [CrossRef]
- Yu, Z.; Shen, Z.; Xu, L.; Yu, J.; Zhang, L.; Wang, X.; Yin, G.; Zhang, W.; Li, Y.; Zuo, W. Effect of Combined Application of Slow-Release and Conventional Urea on Yield and Nitrogen Use Efficiency of Rice and Wheat under Full Straw Return. Agronomy 2022, 12, 998. [Google Scholar] [CrossRef]
- Huang, T.; Liu, H.; Tao, J.-P.; Zhang, J.-Q.; Zhao, T.-M.; Hou, X.-L.; Xiong, A.-S.; You, X. Low light intensity elongates period and defers peak time of photosynthesis: A computational approach to circadian-clock-controlled photosynthesis in tomato. Hortic. Res. 2023, 10, uhad077. [Google Scholar] [CrossRef] [PubMed]
- Burlacot, A. Quantifying the roles of algal photosynthetic electron pathways: A milestone towards photosynthetic robustness. New Phytol. 2023, 240, 2197–2203. [Google Scholar] [CrossRef] [PubMed]
- Liu, Z.; Jin, W.; Guo, J.; Yuan, J.; Wang, S.; Yang, H.; Meng, Y.; Zhou, Z. Efficient cotton population photosynthetic production synergistically increases seedcotton yield and fiber quality through straw incorporation with appropriate nitrogen fertilization in wheat-cotton rotation system. Field Crops Res. 2023, 304, 109147. [Google Scholar] [CrossRef]
- Feng, X.; Dietze, M. Scale dependence in the effects of leaf ecophysiological traits on photosynthesis: B ayesian parameterization of photosynthesis models. New Phytol. 2013, 200, 1132–1144. [Google Scholar] [CrossRef] [PubMed]
- Bagheri Faradonbeh, H.R.; Bistgani, Z.E.; Barker, A.V. Tuber Yield and Physiological Characteristics of Potato Under Irrigation and Fertilizer Application. Commun. Soil Sci. Plant Anal. 2022, 53, 1432–1443. [Google Scholar] [CrossRef]
- Khan, A.; Yan, L.; Hasan, M.M.; Wang, W.; Xu, K.; Zou, G.; Liu, X.-D.; Fang, X.-W. Leaf traits and leaf nitrogen shift photosynthesis adaptive strategies among functional groups and diverse biomes. Ecol. Indic. 2022, 141, 109098. [Google Scholar] [CrossRef]
- Da Silva, A.L.B.R.; Zotarelli, L.; Dukes, M.D.; van Santen, E.; Asseng, S. Nitrogen fertilizer rate and timing of application for potato under different irrigation methods. Agric. Water Manag. 2023, 283, 108312. [Google Scholar] [CrossRef]
- Fontes, P.C.; Braun, H.; Busato, C.; Cecon, P.R. Economic optimum nitrogen fertilization rates and nitrogen fertilization rate effects on tuber characteristics of potato cultivars. Potato Res. 2010, 53, 167–179. [Google Scholar] [CrossRef]
- Simkin, A.J.; Faralli, M.; Ramamoorthy, S.; Lawson, T. Photosynthesis in non-foliar tissues: Implications for yield. Plant J. 2020, 101, 1001–1015. [Google Scholar] [CrossRef] [PubMed]
- Sun, Y.; Sun, Y.; Yan, F.; Li, Y.; Wu, Y.; Guo, C.; Ma, P.; Yang, G.; Yang, Z.; Ma, J. Coordinating postanthesis carbon and nitrogen metabolism of hybrid rice through different irrigation and nitrogen regimes. Agronomy 2020, 10, 1187. [Google Scholar] [CrossRef]
- Zhao, W.; Ren, T.-H.; Huang, X.-Y.; Xu, Z.; Zhou, Y.-Z.; Yin, C.-L.; Zhao, R.; Liu, S.-B.; Ning, T.-Y.; Li, G. Leaf shape, planting density, and nitrogen application affect soybean yield by changing direct and diffuse light distribution in the canopy. Plant Physiol. Biochem. 2023, 204, 108071. [Google Scholar] [CrossRef] [PubMed]
- Zhang, G.; Liu, S.; Dong, Y.; Liao, Y.; Han, J. A nitrogen fertilizer strategy for simultaneously increasing wheat grain yield and protein content: Mixed application of controlled-release urea and normal urea. Field Crops Res. 2022, 277, 108405. [Google Scholar] [CrossRef]
- Nie, J.; Li, Z.; Zhang, Y.; Zhang, D.; Xu, S.; He, N.; Zhan, Z.; Dai, J.; Li, C.; Li, W. Plant pruning affects photosynthesis and photoassimilate partitioning in relation to the yield formation of field-grown cotton. Ind. Crops Prod. 2021, 173, 114087. [Google Scholar] [CrossRef]
- Adekiya, A.O.; Olaniran, A.F.; Adenusi, T.T.; Aremu, C.; Ejue, W.S.; Iranloye, Y.M.; Gbadamosi, A.; Olayanju, A. Effects of cow dung and wood biochars and green manure on soil fertility and tiger nut (Cyperus esculentus L.) performance on a savanna Alfisol. Sci. Rep. 2020, 10, 21021. [Google Scholar] [CrossRef] [PubMed]
- Barrett, R.L. Sedges on the edge: New agronomic and research opportunities? Plant Soil 2023, 495, 195–200. [Google Scholar] [CrossRef]
- Wang, Z.; Wang, Z.; Ma, L.; Lv, X.; Meng, Y.; Zhou, Z. Straw returning coupled with nitrogen fertilization increases canopy photosynthetic capacity, yield and nitrogen use efficiency in cotton. Eur. J. Agron. 2021, 126, 126267. [Google Scholar] [CrossRef]
- Nurmanov, Y.T.; Chernenok, V.G.; Kuzdanova, R.S. Potato in response to nitrogen nutrition regime and nitrogen fertilization. Field Crops Res. 2019, 231, 115–121. [Google Scholar] [CrossRef]
- Milagres, C.d.C.; Fontes, P.C.R.; Silva, J.M.d. Potato tuber yield and plant morphological descriptors as affected by nitrogen application. Commun. Soil Sci. Plant Anal. 2019, 50, 1897–1906. [Google Scholar] [CrossRef]
- Abdo, A.I.; Elrys, A.S.; Abdel-Fattah, M.K.; Desoky, E.-S.M.; Huitong, L.; Wang, L. Mitigating nitrate accumulation in potato tubers under optimum nitrogen fertilization with K-humate and calcium chloride. J. Clean. Prod. 2020, 259, 121108. [Google Scholar] [CrossRef]
- Vilarrasa-Nogué, M.; Teira-Esmatges, M.R.; Villar, J.; Rufat, J. Effect of N dose on soil GHG emissions from a drip-fertigated olive (Olea europaea L.) orchard. Sci. Total Environ. 2019, 677, 350–361. [Google Scholar] [CrossRef] [PubMed]
- Tan, Y.; Xu, C.; Liu, D.; Wu, W.; Lal, R.; Meng, F. Effects of optimized N fertilization on greenhouse gas emission and crop production in the North China Plain. Field Crops Res. 2017, 205, 135–146. [Google Scholar] [CrossRef]
- Ayyub, C.; Wasim Haidar, M.; Zulfiqar, F.; Abideen, Z.; Wright, S.R. Potato tuber yield and quality in response to different nitrogen fertilizer application rates under two split doses in an irrigated sandy loam soil. J. Plant Nutr. 2019, 42, 1850–1860. [Google Scholar] [CrossRef]
- Da Silva, A.L.B.R.; Zotarelli, L.; Dukes, M.D.; Agehara, S.; Asseng, S.; van Santen, E. Irrigation method and application timing effect on potato nitrogen fertilizer uptake efficiency. Nutr. Cycl. Agroecosystems 2018, 112, 253–264. [Google Scholar] [CrossRef]
- Wu, C.; Zhou, S.; Cheng, X.; Wei, X. Alternating processes of dry and wet nitrogen deposition have different effects on the function of canopy leaves: Implications for leaf photosynthesis. Front. Plant Sci. 2023, 13, 1105075. [Google Scholar] [CrossRef]


| Year | N Treatments | Tillers/ Number | Number of Tubers per Plant (Number) | 100-Grain Weight/ g | Yield/ kg ha−1 |
|---|---|---|---|---|---|
| 2021 | N0 | 10.3 ± 0.7 d | 25.3 ± 1.7 d | 64.23 ± 1.30 a | 2162 ± 142 d |
| N100 | 16.3 ± 1.2 c | 42.0 ± 1.5 c | 59.84 ± 1.18 b | 3944 ± 184 c | |
| N200 | 19.7 ± 0.3 b | 56.0 ± 4.6 b | 54.32 ± 1.27 c | 6026 ± 264 b | |
| N300 | 24.6 ± 0.7 a | 68.0 ± 0.6 a | 53.63 ± 2.79 c | 7962 ± 146 ab | |
| N400 | 26.3 ± 1.2 a | 72.3 ± 2.6 a | 47.92 ± 1.67 d | 8165 ± 247 a | |
| 2022 | N0 | 11.3 ± 0.7 d | 21.3 ± 1.5 d | 61.40 ± 1.30 a | 1987 ± 87 e |
| N100 | 18.7 ± 0.9 c | 43.6 ± 1.2 c | 57.70 ± 0.71 b | 3425 ± 124 d | |
| N200 | 22.3 ± 1.2 b | 57.3 ± 2.4 b | 52.30 ± 0.64 c | 5856 ± 274 c | |
| N300 | 28.3 ± 0.4 a | 67.0 ± 1.5 a | 51.49 ± 0.41 c | 7865 ± 146 ab | |
| N400 | 29.7 ± 0.8 a | 70.0 ± 2.1 a | 46.26 ± 0.39 d | 8135 ± 172 a | |
| Y N N × Y | 0.55 ns | 0.62 ns | 2.27 ns | 1.26 ns | |
| 179.93 ** | 242.04 ** | 357.84 ** | 186.72 ** | ||
| 0.45 ns | 0.14 ns | 0.69 ns | 0.72 ns | ||
| Year | N Treatments | R0 | Tmax (d) | Gmax (g plant d–1) | Gmean (g plant d–1) |
|---|---|---|---|---|---|
| 2021 | N0 | 0.106 ± 0.02 c | 20.23 ± 1.12 c | 0.143 ± 0.03 c | 0.174 ± 0.032 d |
| N100 | 0.092 ± 0.08 d | 26.77 ± 0.78 a | 0.385 ± 0.11 c | 0.290 ± 0.011 c | |
| N200 | 0.127 ± 0.012 b | 24.10 ± 1.22 b | 0.744 ± 0.12 a | 0.517 ± 0.086 b | |
| N300 | 0.145 ± 0.12 a | 24.37 ± 1.26 b | 0.700 ± 0.26 a | 0.624 ± 0.057 a | |
| N400 | 0.150 ± 0.08 a | 23.15 ± 0.88 b | 0.686 ± 0.21 b | 0.588 ± 0.125 a | |
| 2022 | N0 | 0.366 ± 0.012 a | 17.09 ± 1.12 c | 0.214 ± 0.033 c | 0.163 ± 0.086 d |
| N100 | 0.099 ± 0.024 d | 28.95 ± 2.12 a | 0.556 ± 0.126 b | 0.301 ± 0.118 c | |
| N200 | 0.084 ± 0.013 d | 24.82 ± 1.11 b | 0.686 ± 0.138 ab | 0.477 ± 0.133 b | |
| N300 | 0.190 ± 0.022 c | 23.62 ± 0.88 b | 0.742 ± 0.162 a | 0.688 ± 0.067 a | |
| N400 | 0.317 ± 0.037 b | 22.61 ± 0.37 bc | 0.671 ± 0.126 ab | 0.632 ± 0.126 a |
| Year | N Treatment | Early Expansion Stage | Middle Expansion Stage | Late Expansion Stage | ||||||
|---|---|---|---|---|---|---|---|---|---|---|
| Days (d) | MGR (g·plant−1 d−1) | RGC % | Days (d) | MGR (g·plant−1 d−1) | RGC % | Days (d) | MGR (g·plant−1 d−1) | RGC % | ||
| 2021 | N0 | 8.85 ± 0.62 d | 0.15 ± 0.07 c | 14.86 ± 1.32 d | 23.96 ± 2.62 b | 0.25 ± 0.11 e | 65.27 ± 3.68 a | 29.91 ± 2.11 c | 0.06 ± 0.01 c | 19.87 ± 1.42 c |
| N100 | 13.82 ± 0.38 b | 0.21 ± 0.02 b | 16.24 ± 0.66 c | 26.21 ± 2.24 a | 0.42 ± 0.10 d | 62.47 ± 0.73 ab | 36.97 ± 3.42 a | 0.10 ± 0.02 b | 21.29 ± 0.72 b | |
| N200 | 11.73 ± 0.62 c | 0.42 ± 0.11 a | 17.64 ± 1.43 b | 24.75 ± 1.73 ab | 0.69 ± 0.18 b | 60.34 ± 0.34 b | 31.33 ± 2.13 b | 0.20 ± 0.06 a | 22.02 ± 1.15 a | |
| N300 | 17.09 ± 1.18 a | 0.43 ± 0.08 a | 20.62 ± 2.14 a | 24.62 ± 2.24 ab | 0.90 ± 0.04 a | 62.27 ± 1.17 ab | 28.64 ± 1.32 c | 0.21 ± 0.04 a | 17.11 ± 1.27 c | |
| N400 | 10.94 ± 0.87 c | 0.40 ± 0.10 a | 18.66 ± 0.83 ab | 24.42 ± 1.43 ab | 0.83 ± 0.12 ab | 60.74 ± 1.98 b | 27.70 ± 1.18 c | 0.23 ± 0.03 a | 20.60 ± 1.34 bc | |
| 2022 | N0 | 9.24 ± 1.32 c | 0.13 ± 0.03 d | 12.68 ± 1.32 d | 23.87 ± 2.12 b | 0.27 ± 0.11 d | 67.00 ± 1.32 a | 30.22 ± 2.21 b | 0.07 ± 0.01 d | 20.32 ± 1.32 b |
| N100 | 12.27 ± 0.72 b | 0.22 ± 0.06 c | 15.68 ± 0.62 c | 26.72 ± 1.11 aa | 0.40 ± 0.08 c | 61.70 ± 1.66 b | 34.87 ± 1.06 a | 0.11 ± 0.02 c | 22.62 ± 2.12 ab | |
| N200 | 13.36 ± 0.88 b | 0.34 ± 0.11 b | 16.62 ± 1.74 b | 24.32 ± 1.06 b | 0.68 ± 0.11 b | 60.04 ± 0.68 b | 31.26 ± 0.32 b | 0.21 ± 0.03 b | 23.34 ± 1.32 a | |
| N300 | 16.88 ± 1.26 a | 0.44 ± 0.12 a | 19.86 ± 1.13 a | 24.46 ± 0.66 b | 0.94 ± 0.12 a | 61.88 ± 1.12 b | 27.12 ± 1.72 c | 0.25 ± 0.03 ab | 18.26 ± 1.13 d | |
| N400 | 13.24 ± 1.08 b | 0.42 ± 0.62 a | 17.62 ± 0.32 b | 25.22 ± 1.02 ab | 0.85 ± 0.17 a | 62.26 ± 0.43 b | 26.68 ± 0.83 c | 0.27 ± 0.02 a | 21.12 ± 0.62 ab | |
| Year | N Treatment | NHI (%) | NGPE (kg kg−1) | NAE (%) | NPP (kg kg−1) | NRE (%) |
|---|---|---|---|---|---|---|
| 2021 | N0 | 55.91 ± 3.41 a | 57.00 ± 1.38 a | - | - | - |
| N100 | 52.87 ± 1.14 ab | 44.60 ± 0.60 b | 9.29 ± 0.81 d | 28.55 ± 2.31 b | 32.56 ± 2.24 c | |
| N200 | 50.97 ± 1.99 b | 38.81 ± 0.93 d | 11.03 ± 0.10 c | 28.86 ± 1.74 b | 38.35 ± 2.55 b | |
| N300 | 50.67 ± 1.40 bc | 41.81 ± 1.78 c | 16.30 ± 0.47 a | 36.94 ± 1.76 a | 44.08 ± 1.14 a | |
| N400 | 47.17 ± 1.32 c | 38.91 ± 1.45 d | 14.75 ± 0.50 b | 35.31 ± 0.63 a | 41.79 ± 0.40 a | |
| 2022 | N0 | 57.68 ± 1.68 a | 49.46 ± 2.73 a | - | - | - |
| N100 | 53.26 ± 2.38 b | 43.85 ± 2.33 c | 10.49 ± 1.24 c | 30.54 ± 1.42 c | 31.47 ± 0.13 c | |
| N200 | 51.43 ± 1.08 b | 43.56 ± 1.66 c | 12.70 ± 1.86 b | 34.74 ± 2.27 b | 35.90 ± 0.77 c | |
| N300 | 49.32 ± 1.85 c | 44.90 ± 1.54 b | 14.78 ± 0.90 a | 39.53 ± 1.12 a | 39.34 ± 0.87 a | |
| N400 | 47.28 ± 1.35 c | 41.12 ± 1.94 cd | 12.73 ± 1.28 b | 36.09 ± 0.48 b | 36.64 ± 1.17 b | |
| Y | 0.26 | 0.42 | 1.16 | 2.33 | 2.51 | |
| N | 7.47 ** | 101.07 ** | 12.68 ** | 19.22 ** | 23.18 ** | |
| N × Y | 0.14 | 0.33 | 0.12 | 0.69 | 0.48 | |
Disclaimer/Publisher’s Note: The statements, opinions and data contained in all publications are solely those of the individual author(s) and contributor(s) and not of MDPI and/or the editor(s). MDPI and/or the editor(s) disclaim responsibility for any injury to people or property resulting from any ideas, methods, instructions or products referred to in the content. |
© 2024 by the authors. Licensee MDPI, Basel, Switzerland. This article is an open access article distributed under the terms and conditions of the Creative Commons Attribution (CC BY) license (https://creativecommons.org/licenses/by/4.0/).
Share and Cite
Zheng, X.; Liu, J.; Cheng, Z.; Sun, Y.; Li, L.; Wang, J. Improving Tuber Yield of Tiger Nut (Cyperus esculentus L.) through Nitrogen Fertilization in Sandy Farmland. Plants 2024, 13, 1063. https://doi.org/10.3390/plants13081063
Zheng X, Liu J, Cheng Z, Sun Y, Li L, Wang J. Improving Tuber Yield of Tiger Nut (Cyperus esculentus L.) through Nitrogen Fertilization in Sandy Farmland. Plants. 2024; 13(8):1063. https://doi.org/10.3390/plants13081063
Chicago/Turabian StyleZheng, Xu, Jianguo Liu, Zhibo Cheng, Yingqiang Sun, Luhua Li, and Jiaping Wang. 2024. "Improving Tuber Yield of Tiger Nut (Cyperus esculentus L.) through Nitrogen Fertilization in Sandy Farmland" Plants 13, no. 8: 1063. https://doi.org/10.3390/plants13081063
APA StyleZheng, X., Liu, J., Cheng, Z., Sun, Y., Li, L., & Wang, J. (2024). Improving Tuber Yield of Tiger Nut (Cyperus esculentus L.) through Nitrogen Fertilization in Sandy Farmland. Plants, 13(8), 1063. https://doi.org/10.3390/plants13081063