
Proteomic Analysis of Arachis hypogaea Seeds from Different Maturity Classes
 ,
,
Abstract
:1. Introduction
2. Results
3. Discussion
4. Materials and Methods
4.1. Pod Blasting
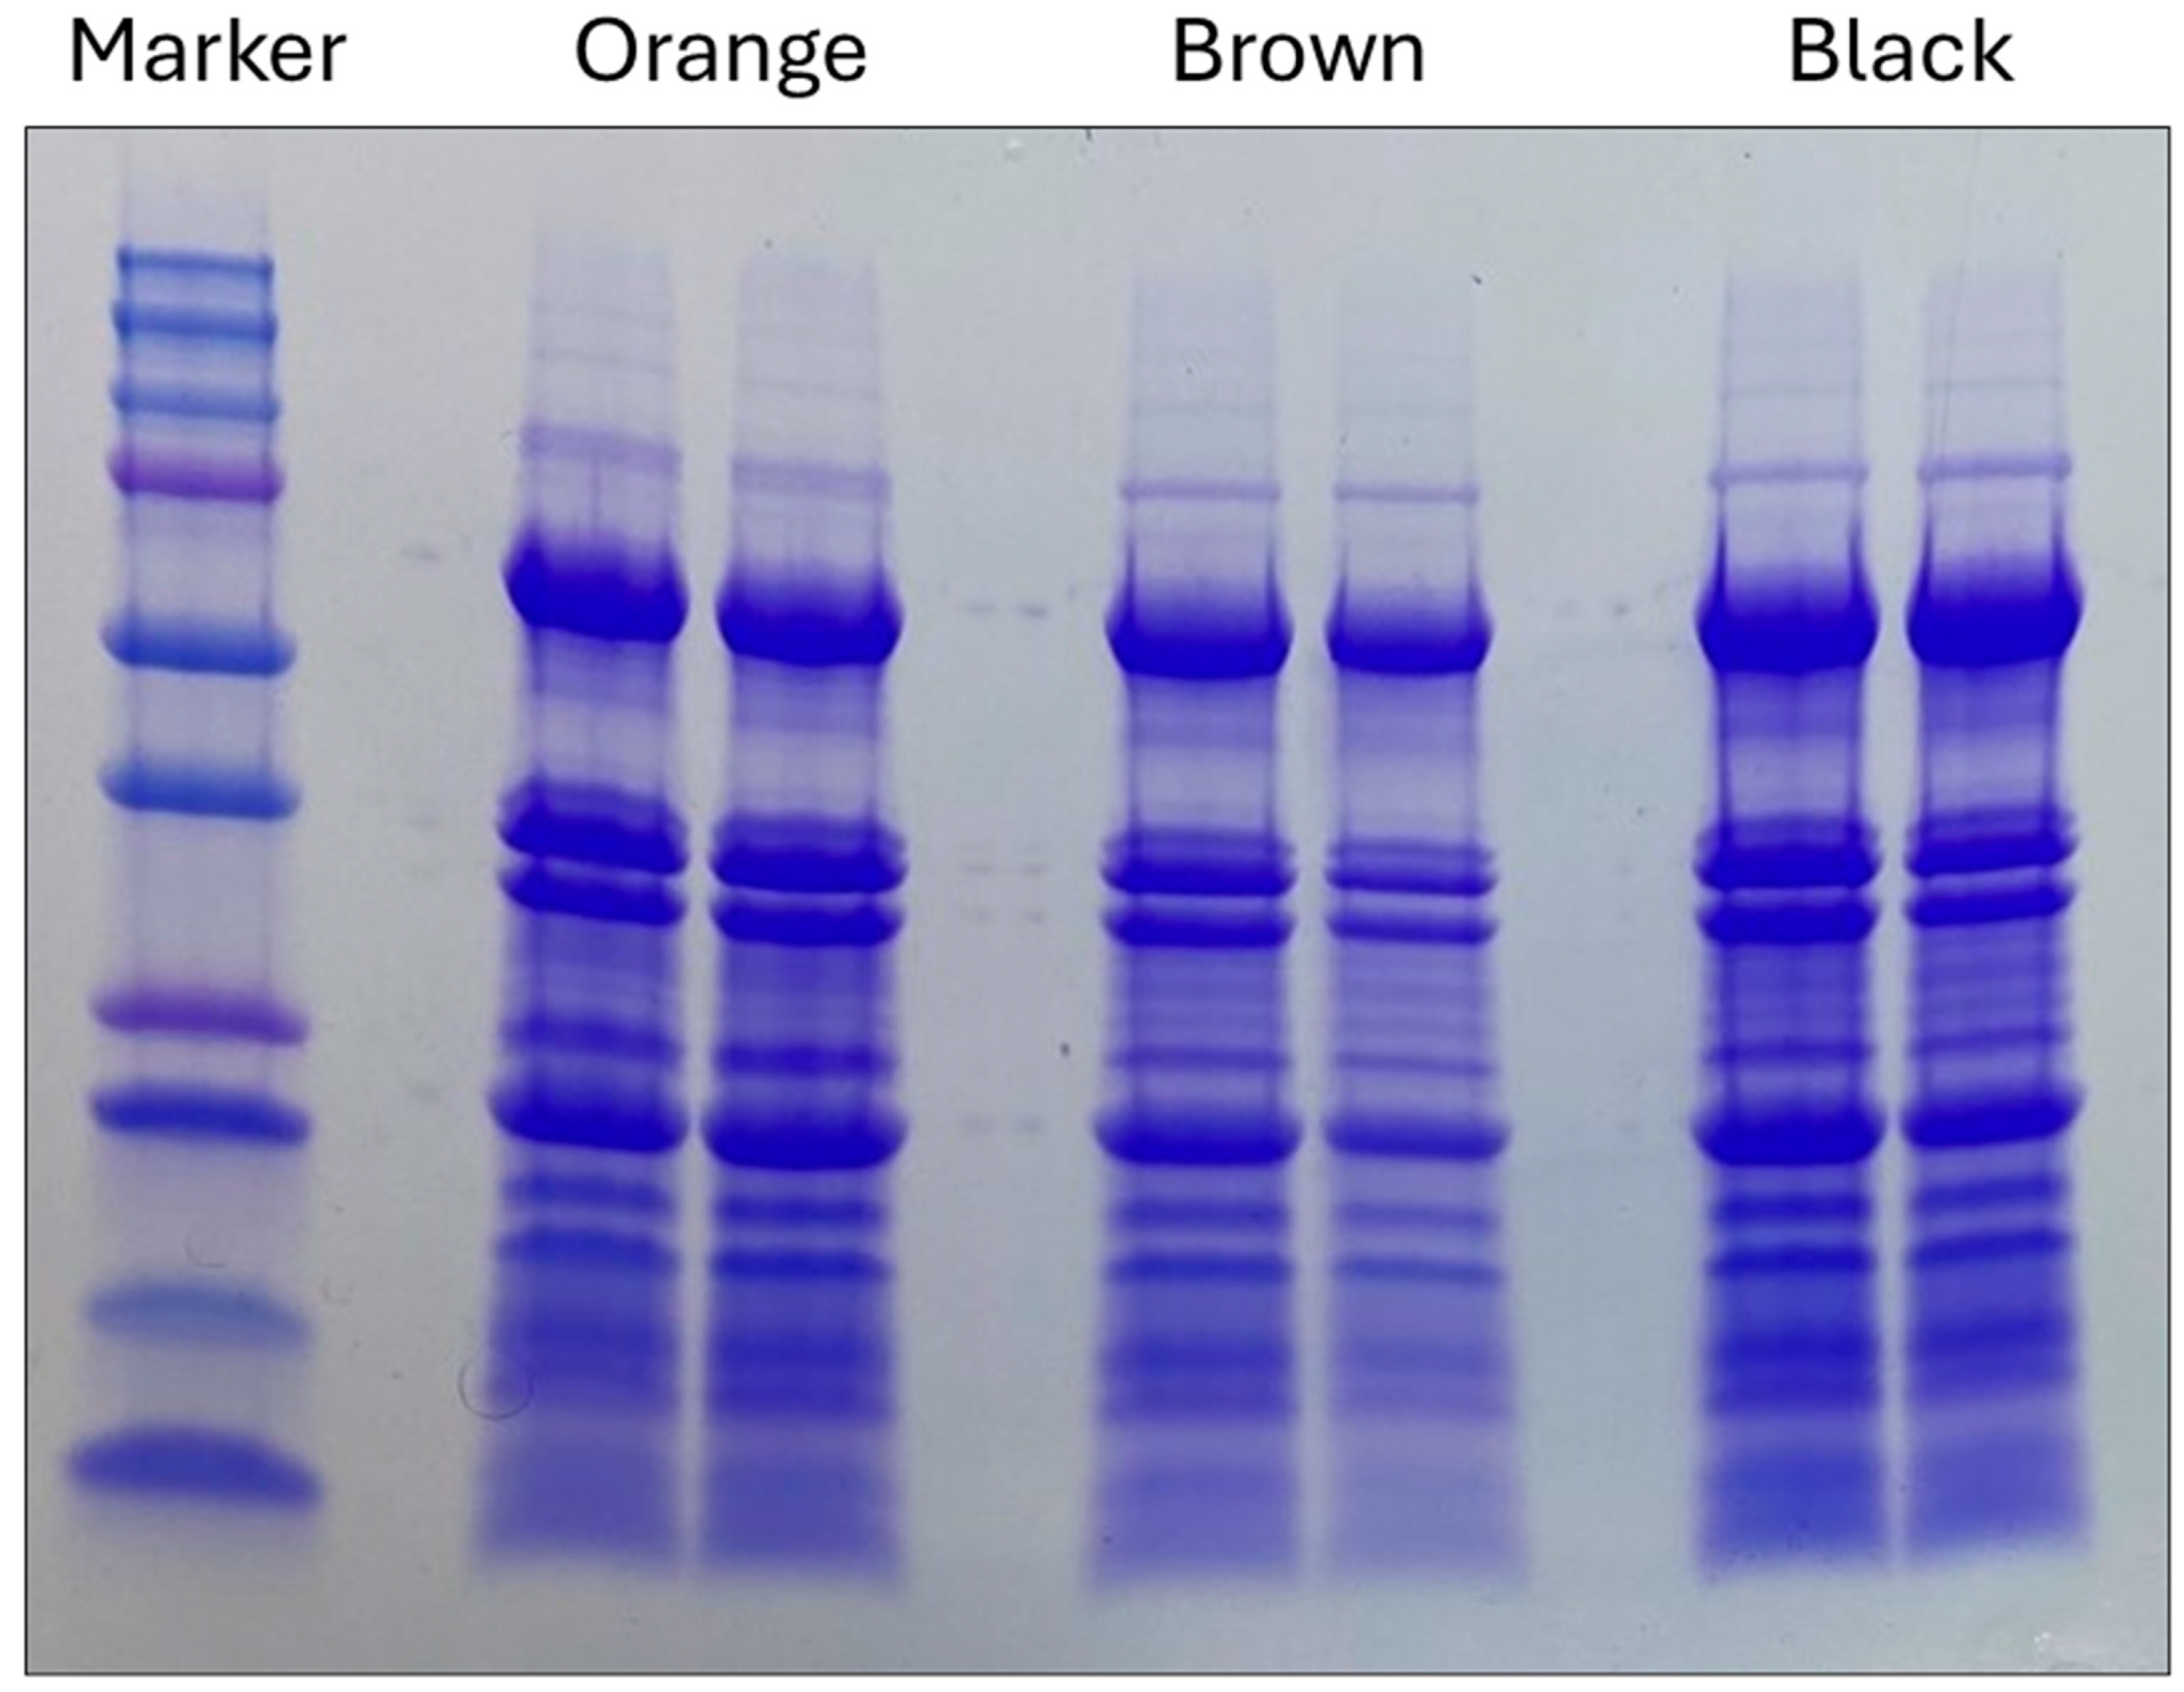
4.2. Electrophoresis
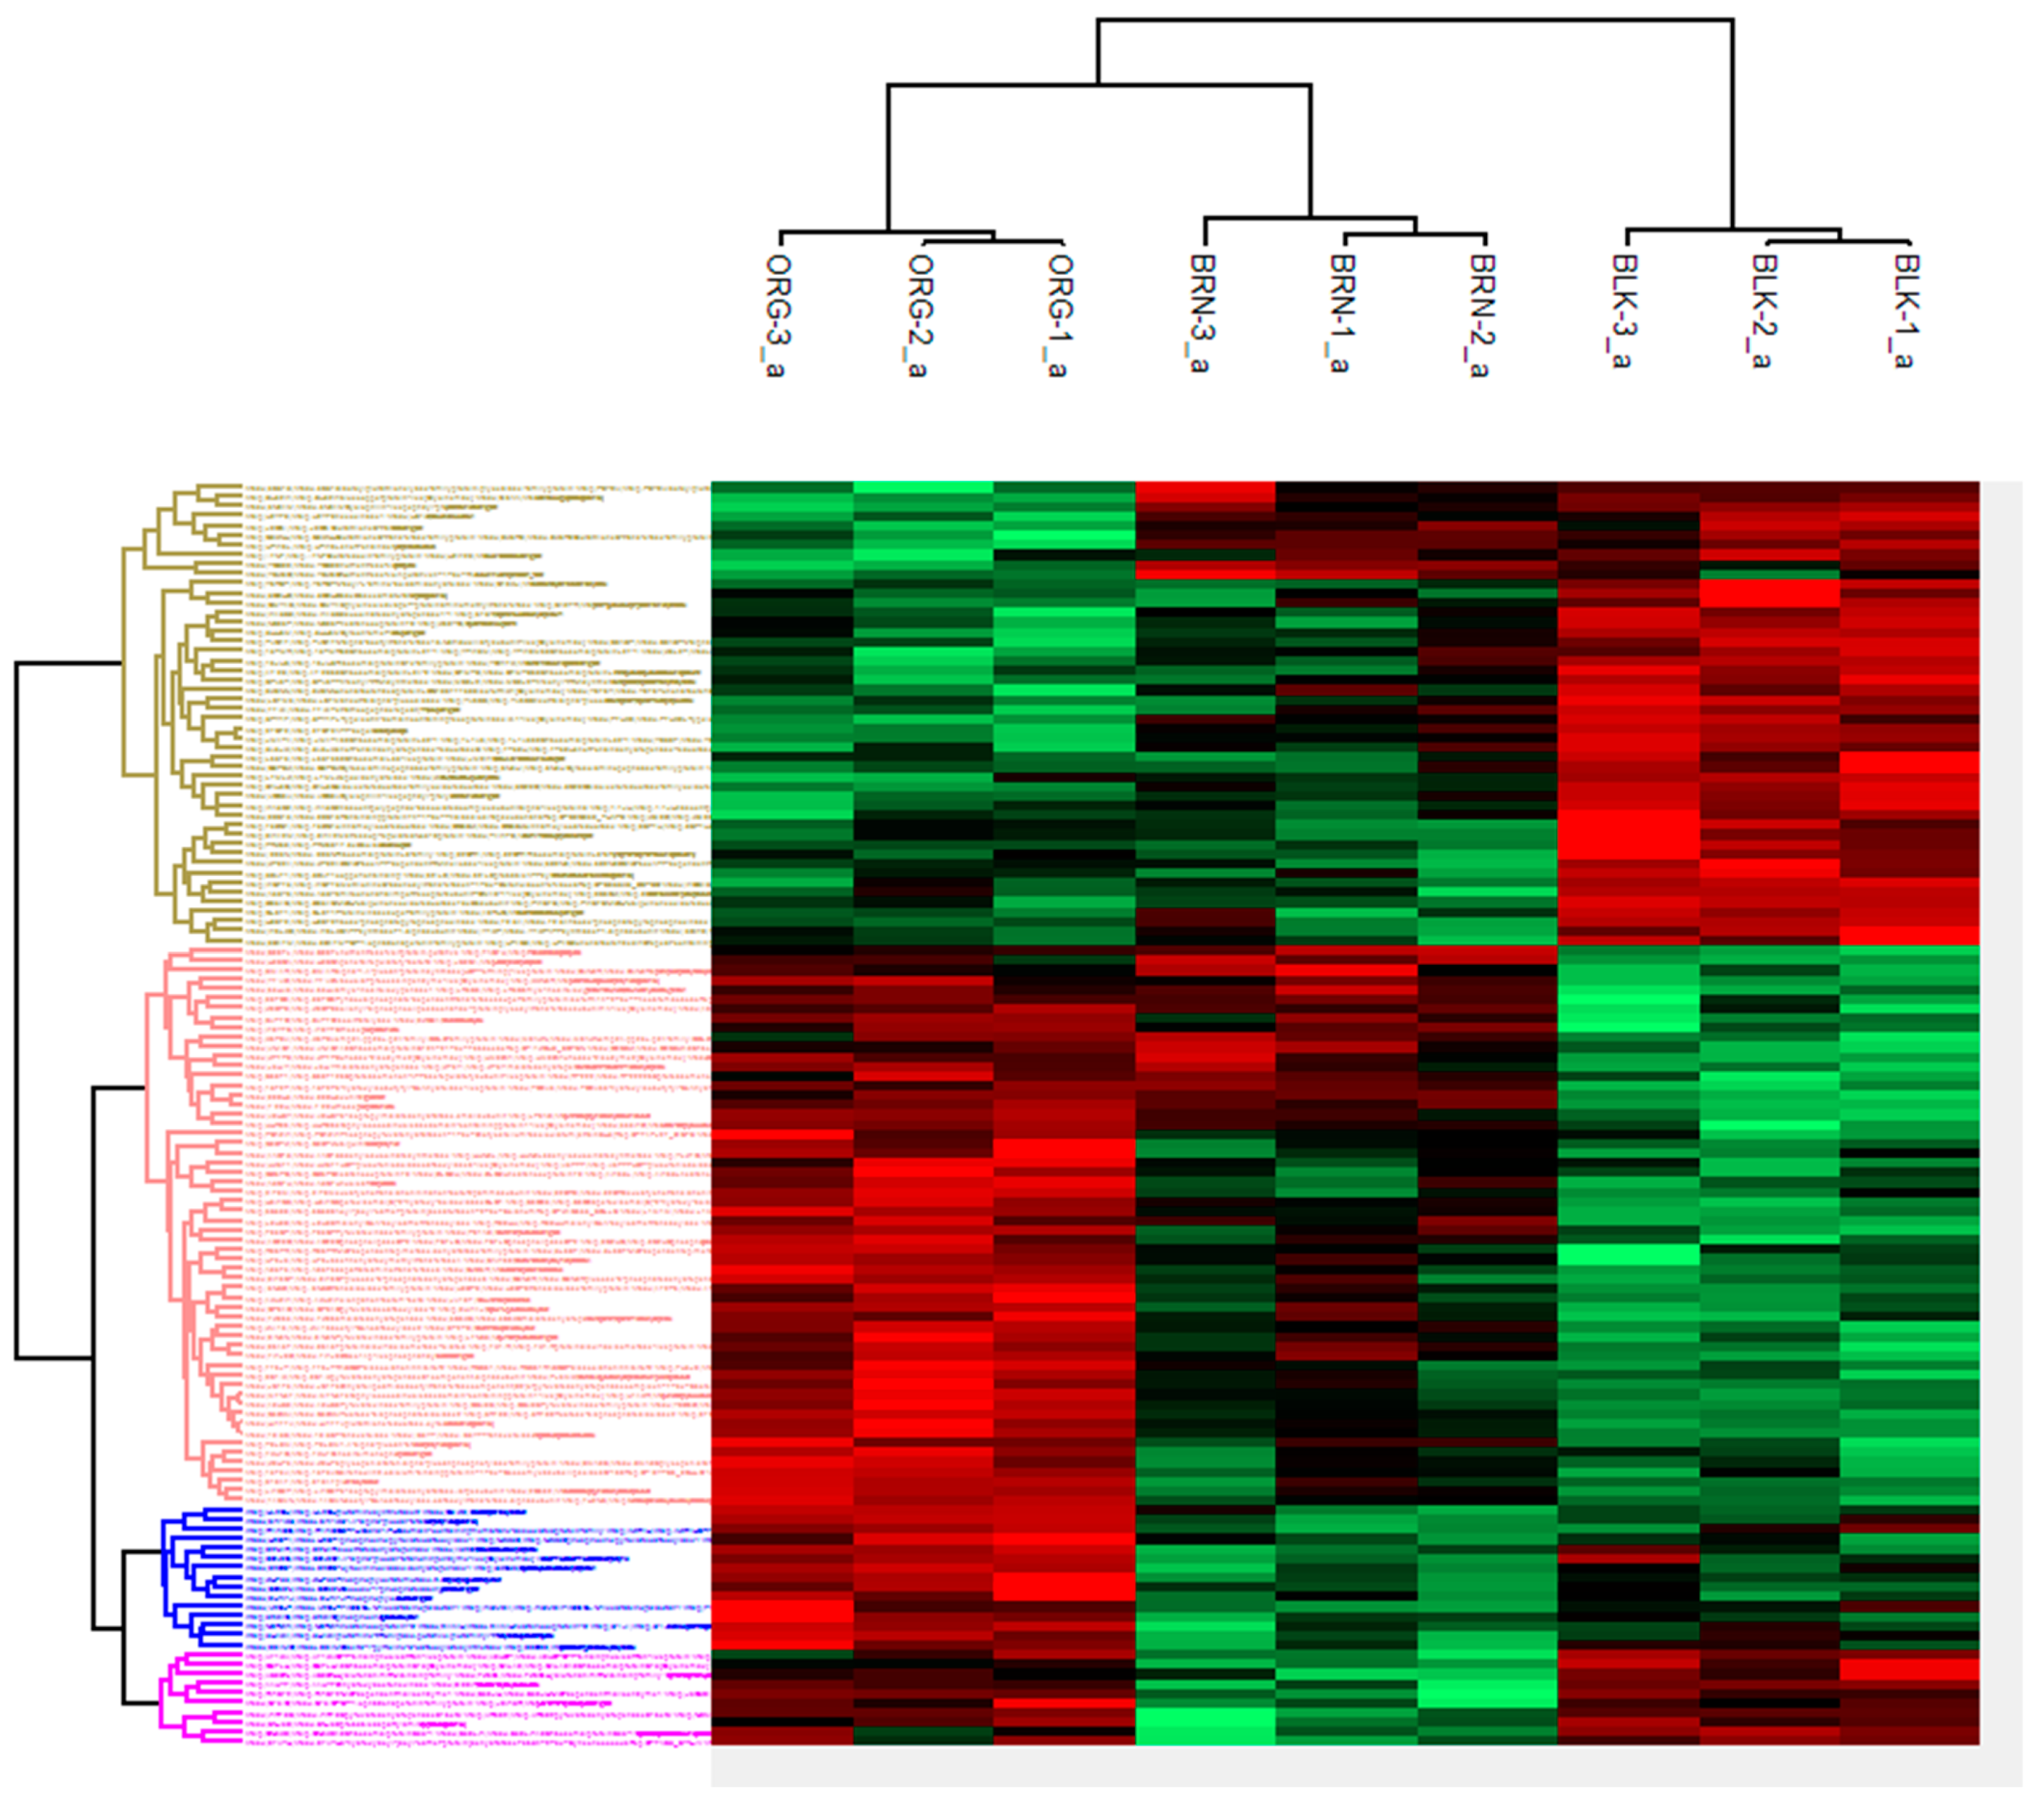
4.3. Proteomic Analysis
4.4. Identification of the Gene Name and Sequence
5. Conclusions
Author Contributions
Funding
Data Availability Statement
Acknowledgments
Conflicts of Interest
Appendix A

| Aradu|5SZ1Z|Aradu.5SZ1Zlactoylglutathionelyasefamilyprotein/glyoxalaseIfamilyprotein;Araip|PBY0V|Araip.PBY0Vlactoylglutathionelyasefamilyprotein/glyoxalaseIfamilyprotein;Aradu|T0KE9|Aradu.T0KE9nucleobase-ascorbatetransporter-likeprotein |
| Araip|BU32W|Araip.BU32Wbluecopperprotein-like[Glycinemax];Aradu|CI6AA|Aradu.CI6AAbluecopperprotein-like[Glycinemax] |
| Aradu|3N04M|Aradu.3N04MCyclophilin-likepeptidyl-prolylcis-transisomerasefamilyprotein |
| Araip|U2YF8|Araip.U2YF8hexokinase1;Aradu|UE1X3|Aradu.UE1X3hexokinase1 |
| Araip|J9Q6I|Araip.J9Q6IGlutathioneS-transferasefamilyprotein |
| Araip|C8XNH|Araip.C8XNHGlutathioneS-transferasefamilyprotein;Aradu|EK5R9|Aradu.EK5R9GlutathioneS-transferasefamilyprotein;Araip|18DX7|Araip.18DX7glutathioneS-transferaseF3;Araip|Z2UT4|Araip.Z2UT4glutathioneS-transferasetau5;Aradu|V7D4Y|Aradu.V7D4YglutathioneS-transferaseF3;Aradu|G9I7U|Aradu.G9I7UglutathioneS-transferaseF4;Aradu|8J8HS|Aradu.8J8HSglutathioneS-transferaseF3;Araip|QEE3P|Araip.QEE3PglutathioneS-transferasetau5;Aradu|EL1FN|Aradu.EL1FNglutathioneS-transferasetau5;Araip|4CL10|Araip.4CL10glutathioneS-transferasetau5;Araip|Q3KHN|Araip.Q3KHNGlutathioneS-transferasefamilyprotein;Araip|PK7TM|Araip.PK7TMglutathioneS-transferasetau5;Araip|CV75M|Araip.CV75MglutathioneS-transferasetau5 |
| Araip|UPW6L|Araip.UPW6Lshort-chaindehydrogenase-reductaseB |
| Araip|II7NF|Araip.II7NFGlutaredoxinfamilyprotein;Aradu|H2W20|Aradu.H2W20Glutaredoxinfamilyprotein |
| Aradu|YGS80|Aradu.YGS80nutrientreservoirprotein,putative |
| Aradu|YBK6Q|Aradu.YBK6QNutrientreservoir,putativen=1Tax=RicinuscommunisRepID=B9SKF4_RICCO |
| Araip|Y6RST|Araip.Y6RSTN-acyl-L-amino-acidamidohydrolase;Aradu|G18XJ|Aradu.G18XJN-acyl-L-amino-acidamidohydrolase |
| Aradu|ZQ8HD|Aradu.ZQ8HD35kDaseedmaturationprotein[Glycinemax] |
| Aradu|GMY4S|Aradu.GMY4SglycinecleavageT-proteinaminomethyltransferase;Araip|SA2FR|Araip.SA2FRglycinecleavageT-proteinaminomethyltransferase |
| Aradu|W4ZB9|Aradu.W4ZB9succinatedehydrogenase1-1;Araip|67ZY4|Araip.67ZY4succinatedehydrogenase1-1 |
| Aradu|NS05P|Aradu.NS05Pheatshockprotein70;Araip|K60YG|Araip.K60YGheatshockprotein70 |
| Araip|ZHH6M|Araip.ZHH6MCytochromeP450superfamilyprotein |
| Araip|TVG17|Araip.TVG17N-alpha-acetyltransferase15,NatAauxiliarysubunit-like[Glycinemax];Aradu|B8ABT|Aradu.B8ABTN-alpha-acetyltransferase15,NatAauxiliarysubunit-like[Glycinemax];Araip|IN65G|Araip.IN65GN-alpha-acetyltransferase15,NatAauxiliarysubunit-like[Glycinemax];Araip|9K5V6|Araip.9K5V6N-alpha-acetyltransferase15,NatAauxiliarysubunit-like[Glycinemax];Araip|WU330|Araip.WU330N-alpha-acetyltransferase15,NatAauxiliarysubunit-like[Glycinemax];Araip|UE19H|Araip.UE19HN-alpha-acetyltransferase15,NatAauxiliarysubunit-like[Glycinemax];Araip|5R0B1|Araip.5R0B1N-alpha-acetyltransferase15,NatAauxiliarysubunit-like[Glycinemax];Araip|XF9L3|Araip.XF9L3N-alpha-acetyltransferase15,NatAauxiliarysubunit-like[Glycinemax];Aradu|0NM9S|Aradu.0NM9SN-alpha-acetyltransferase15,NatAauxiliarysubunit-like[Glycinemax];Araip|2HW6R|Araip.2HW6RBTB/POZdomain-containingprotein[Glycinemax];Araip|333AM|Araip.333AMputativeMybfamilytranscriptionfactorAt1g14600-likeisoformX2[Glycinemax];Araip|XL9UX|Araip.XL9UXN-alpha-acetyltransferase15,NatAauxiliarysubunit-like[Glycinemax] |
| Araip|13TMR|Araip.13TMR60SribosomalproteinL27-1;Araip|YTW8M|Araip.YTW8M60SribosomalproteinL27-1;Aradu|K6L2T|Aradu.K6L2T60SribosomalproteinL27-1;Aradu|FJQ8M|Aradu.FJQ8M60SribosomalproteinL27-1;Aradu|4N88U|Aradu.4N88U60SribosomalproteinL27-1 |
| Araip|16JUZ|Araip.16JUZRibosomalproteinS7efamilyprotein;Aradu|YQW7X|Aradu.YQW7XRibosomalproteinS7efamilyprotein |
| Araip|47I29|Araip.47I2960SribosomalproteinL24-2;Aradu|Q7MTE|Aradu.Q7MTE60SribosomalproteinL24-2;Araip|H35VE|Araip.H35VE60SribosomalproteinL24-2 |
| Araip|BPV5T|Araip.BPV5TThreonyl-tRNAsynthetase;Aradu|MS8J2|Aradu.MS8J2Threonyl-tRNAsynthetase;Araip|238GJ|Araip.238GJThreonyl-tRNAsynthetase |
| Araip|8K0NN|Araip.8K0NNuncharacterizedproteinLOC100777508isoformX1[Glycinemax];Aradu|Y876Y|Aradu.Y876YuncharacterizedproteinLOC100777508isoformX1[Glycinemax];Araip|UA5AR|Araip.UA5ARuncharacterizedproteinLOC100777508isoformX3[Glycinemax] |
| Aradu|LB7M3|Aradu.LB7M3neutralalpha-glucosidase;Araip|YV6BB|Araip.YV6BBneutralalpha-glucosidase;Araip|5ND1T|Araip.5ND1Tneutralalpha-glucosidase |
| Aradu|77IXI|Aradu.77IXITetratricopeptiderepeat(TPR)-likesuperfamilyprotein |
| Araip|ZPY1F|Araip.ZPY1FL-typelectin-domaincontainingreceptorkinaseIX.1-like[Glycinemax];Aradu|P7UX8|Aradu.P7UX8L-typelectin-domaincontainingreceptorkinaseIX.1-like[Glycinemax];Aradu|WK040|Aradu.WK040L-typelectin-domaincontainingreceptorkinaseIX.1-like[Glycinemax];Aradu|K9J4G|Aradu.K9J4GL-typelectin-domaincontainingreceptorkinaseIX.1-like[Glycinemax];Araip|SHF6J|Araip.SHF6Jreceptorlectinkinase |
| Araip|27Q72|Araip.27Q72ATP-dependentchaperoneClpB |
| Araip|JM4T4|Araip.JM4T460SribosomalproteinL32-1;Araip|1L1V5|Araip.1L1V560SribosomalproteinL32-1;Aradu|YEZ8F|Aradu.YEZ8F60SribosomalproteinL32-1;Aradu|P3N99|Aradu.P3N9960SribosomalproteinL32-1 |
| Araip|ZV5JX|Araip.ZV5JXshort-chaindehydrogenase-reductaseB;Araip|7T58U|Araip.7T58Ushort-chaindehydrogenase-reductaseB;Aradu|INB2E|Aradu.INB2Eshort-chaindehydrogenase-reductaseB;Aradu|IZX1C|Aradu.IZX1Cshort-chaindehydrogenase-reductaseB;Araip|F8GND|Araip.F8GNDshort-chaindehydrogenase-reductaseB;Aradu|W7RTE|Aradu.W7RTEshort-chaindehydrogenase-reductaseB |
| Araip|L6Z75|Araip.L6Z7560SribosomalL35-likeprotein;Aradu|JM0WC|Aradu.JM0WC60SribosomalL35-likeprotein |
| Aradu|G9PBK|Aradu.G9PBKCytosolaminopeptidasefamilyprotein;Araip|6N5UI|Araip.6N5UICytosolaminopeptidasefamilyprotein;Araip|6D01Y|Araip.6D01YCytosolaminopeptidasefamilyprotein;Aradu|G5LF8|Aradu.G5LF8Cytosolaminopeptidasefamilyprotein;Araip|7PX0B|Araip.7PX0BCytosolaminopeptidasefamilyprotein;Araip|2B3BK|Araip.2B3BKCytosolaminopeptidasefamilyprotein |
| Araip|L7MLK|Araip.L7MLKepoxidehydrolase;Aradu|KX25J|Aradu.KX25Jepoxidehydrolase |
| Araip|DAU5G|Araip.DAU5Galdo/ketoreductasefamilyoxidoreductase;Aradu|ZC28Q|Aradu.ZC28Qaldo/ketoreductasefamilyoxidoreductase;Araip|ZLU4I|Araip.ZLU4Ialdo/ketoreductasefamilyoxidoreductase;Araip|V0ZQ0|Araip.V0ZQ0aldo/ketoreductasefamilyoxidoreductase;Araip|VH5TY|Araip.VH5TYaldo/ketoreductasefamilyoxidoreductase;Araip|PLQ0G|Araip.PLQ0Galdo/ketoreductasefamilyoxidoreductase;Aradu|41CRM|Aradu.41CRMaldo/ketoreductasefamilyoxidoreductase;Araip|ZV6FQ|Araip.ZV6FQaldo/ketoreductasefamilyoxidoreductase |
| Aradu|VQS6V|Aradu.VQS6VCyclophilin-likepeptidyl-prolylcis-transisomerasefamilyprotein |
| Araip|WA3C2|Araip.WA3C2nascentpolypeptide-associatedcomplexsubunitalpha-likeprotein3;Araip|1I1JH|Araip.1I1JHnascentpolypeptide-associatedcomplexsubunitalpha-likeprotein3;Aradu|16HC5|Aradu.16HC5nascentpolypeptide-associatedcomplexsubunitalpha-likeprotein3;Aradu|44W8K|Aradu.44W8Knascentpolypeptide-associatedcomplexsubunitalpha-likeprotein3 |
| Aradu|0ES15|Aradu.0ES15Ranbindingprotein7n=1Tax=ThalassiosirapseudonanaRepID=B8C038_THAPS;Araip|KZI9D|Araip.KZI9DRanbindingprotein7n=1Tax=ThalassiosirapseudonanaRepID=B8C038_THAPS |
| Araip|75DC1|Araip.75DC1cinnamoylcoareductase;Aradu|QQ3BK|Aradu.QQ3BKcinnamoylcoareductase;Araip|8BP1U|Araip.8BP1Ucinnamoylcoareductase1;Araip|34LPA|Araip.34LPAcinnamoylcoareductase;Aradu|60Z65|Aradu.60Z65NAD(P)-bindingRossmann-foldsuperfamilyprotein |
| Araip|8W42M|Araip.8W42Mstressup-regulatedNod19protein;Aradu|T4WFS|Aradu.T4WFSstressup-regulatedNod19protein |
| Araip|PRK60|Araip.PRK6017.6kDaclassIIheatshockprotein |
| Aradu|I095N|Aradu.I095NRibosomalproteinL6family;Araip|02QR1|Araip.02QR1RibosomalproteinL6family;Araip|7RK7R|Araip.7RK7RRibosomalproteinL6family |
| Aradu|KT924|Aradu.KT924DEAD-boxATP-dependentRNAhelicase-likeprotein;Aradu|6E2N9|Aradu.6E2N9DEAD-boxATP-dependentRNAhelicase-likeprotein;Araip|GL8YQ|Araip.GL8YQDEAD-boxATP-dependentRNAhelicase-likeprotein;Araip|Q0672|Araip.Q0672DEAD-boxATP-dependentRNAhelicase-likeprotein;Araip|1I9C8|Araip.1I9C8DEAD-boxATP-dependentRNAhelicase-likeprotein;Araip|TDP4I|Araip.TDP4IDEAD-boxATP-dependentRNAhelicase-likeprotein;Araip|RP4NC|Araip.RP4NCDEAD-boxATP-dependentRNAhelicase-likeprotein;Araip|SW89G|Araip.SW89GDEAD-boxATP-dependentRNAhelicase-likeprotein;Araip|4V1SV|Araip.4V1SVDEAD-boxATP-dependentRNAhelicase-likeprotein;Araip|K52G2|Araip.K52G2DEAD-boxATP-dependentRNAhelicase-likeprotein |
| Araip|ZBV71|Araip.ZBV71copperionbinding;Aradu|62ILE|Aradu.62ILEprobableATPsynthase24kDasubunit,mitochondrial-like[Glycinemax] |
| Araip|WCF75|Araip.WCF75MethionineS-adenosyltransferasen=1Tax=DetonulaconfervaceaRepID=B9ZZX3_DETCO;Aradu|WQE4S|Aradu.WQE4SMethionineS-adenosyltransferasen=1Tax=DetonulaconfervaceaRepID=B9ZZX3_DETCO;Araip|R525U|Araip.R525UMethionineS-adenosyltransferasen=1Tax=DetonulaconfervaceaRepID=B9ZZX3_DETCO;Araip|WY7N2|Araip.WY7N2MethionineS-adenosyltransferasen=1Tax=DetonulaconfervaceaRepID=B9ZZX3_DETCO;Araip|XJS45|Araip.XJS45MethionineS-adenosyltransferasen=1Tax=DetonulaconfervaceaRepID=B9ZZX3_DETCO;Aradu|X6LF1|Aradu.X6LF1MethionineS-adenosyltransferasen=1Tax=DetonulaconfervaceaRepID=B9ZZX3_DETCO;Araip|H8UEI|Araip.H8UEIMethionineS-adenosyltransferasen=1Tax=DetonulaconfervaceaRepID=B9ZZX3_DETCO;Aradu|RXW02|Aradu.RXW02MethionineS-adenosyltransferasen=1Tax=DetonulaconfervaceaRepID=B9ZZX3_DETCO |
| Aradu|A5ZY3|Aradu.A5ZY3mitochondrialimportreceptorsubunitTOM40-1-like[Glycinemax];Araip|9S6CK|Araip.9S6CKmitochondrialimportreceptorsubunitTOM40-1-like[Glycinemax] |
| Araip|D054C|Araip.D054CNADH-ubiquinoneoxidoreductase75kDasubunit;Araip|PWS7S|Araip.PWS7SNADH-ubiquinoneoxidoreductase75kDasubunit;Aradu|L20DB|Aradu.L20DBNADH-ubiquinoneoxidoreductase75kDasubunit |
| Araip|CL071|Araip.CL071Proteinkinasesuperfamilyprotein;Aradu|49RUG|Aradu.49RUGProteinkinasesuperfamilyprotein |
| Araip|H0E72|Araip.H0E72ribose-phosphatepyrophosphokinase;Aradu|72I34|Aradu.72I34ribose-phosphatepyrophosphokinase;Araip|24XA5|Araip.24XA5ribose-phosphatepyrophosphokinase;Aradu|9CV6N|Aradu.9CV6Nribose-phosphatepyrophosphokinase |
| Aradu|W6LXE|Aradu.W6LXEATPsynthaseF1,alphasubunit;Aradu|IY1XP|Aradu.IY1XPATPsynthaseF1,alphasubunit;Aradu|I3BW0|Aradu.I3BW0ATPsynthaseF1,alphasubunit;Aradu|G65EG|Aradu.G65EGATPsynthaseF1,alphasubunit;Aradu|BQ1D7|Aradu.BQ1D7ATPsynthaseF1,alphasubunit;Aradu|36GQX|Aradu.36GQXATPsynthaseF1,alphasubunit;Aradu|2SF5Z|Aradu.2SF5ZATPsynthaseF1,alphasubunit;Aradu|1HD8G|Aradu.1HD8GATPsynthaseF1,alphasubunit;Aradu|1AM8X|Aradu.1AM8XATPsynthaseF1,alphasubunit;Aradu|E87V5|Aradu.E87V5ATPsynthaseF1,alphasubunit;Aradu|ZR85T|Aradu.ZR85TATPsynthaseF1,alphasubunit;Aradu|RD9HF|Aradu.RD9HFATPsynthaseF1,alphasubunit;Aradu|B876B|Aradu.B876BATPsynthaseF1,alphasubunit;Aradu|AX7EV|Aradu.AX7EVATPsynthaseF1,alphasubunit;Araip|YB8JU|Araip.YB8JUATPsynthaseF1,alphasubunit |
| Aradu|0D47M|Aradu.0D47MTCP-1/cpn60chaperoninfamilyprotein;Araip|UP4C0|Araip.UP4C0uncharacterizedWDrepeat-containingproteinC2A9.03-likeisoformX3[Glycinemax];Aradu|55CHH|Aradu.55CHHuncharacterizedWDrepeat-containingproteinC2A9.03-likeisoformX1[Glycinemax] |
| Aradu|B98FL|Aradu.B98FLnutrientreservoirprotein,putative;Araip|FAG7U|Araip.FAG7Unutrientreservoirprotein,putative |
| Aradu|H0SGA|Aradu.H0SGAgeneralregulatoryfactor9;Araip|JB0C4|Araip.JB0C4generalregulatoryfactor9 |
| Araip|EMI4R|Araip.EMI4Ralpha-1,4-glucan-proteinsynthase[UDP-forming]-likeprotein;Aradu|QVN0R|Aradu.QVN0Ralpha-1,4-glucan-proteinsynthase[UDP-forming]-likeprotein |
| Aradu|Y7IVD|Aradu.Y7IVDvacuolar-processingenzyme-like[Glycinemax];Araip|XXN6R|Araip.XXN6Rvacuolar-processingenzyme-like[Glycinemax] |
| Aradu|65HV5|Aradu.65HV5myo-inositoloxygenase1;Araip|LR3B6|Araip.LR3B6myo-inositoloxygenase1;Aradu|JAU6Z|Aradu.JAU6Zmyo-inositoloxygenase1 |
| Araip|00FQ0|Araip.00FQ0Pyridoxalphosphate-dependenttransferasessuperfamilyproteinisoform1n=2Tax=TheobromacacaoRepID=UPI00042B06C0;Aradu|V4C8J|Aradu.V4C8JPyridoxalphosphate-dependenttransferasessuperfamilyproteinisoform1n=2Tax=TheobromacacaoRepID=UPI00042B06C0 |
| Araip|K8DPE|Araip.K8DPEdolichyl-diphosphooligosaccharide--proteinglycosyltransferasesubunit1A-like[Glycinemax];Aradu|4E354|Aradu.4E354dolichyl-diphosphooligosaccharide--proteinglycosyltransferasesubunit1A-like[Glycinemax] |
| Araip|SVT7Q|Araip.SVT7Qisocitratelyase;Aradu|0KG04|Aradu.0KG04isocitratelyase |
| Araip|W9YFB|Araip.W9YFBtriosephosphateisomerase |
| Araip|X6PEV|Araip.X6PEVemp24/gp25L/p24family/GOLDfamilyprotein;Aradu|M0AKN|Aradu.M0AKNemp24/gp25L/p24family/GOLDfamilyprotein;Aradu|H5XDC|Aradu.H5XDCIntegralmembranecomponentofendoplasmicreticulum-derivedCOPII-coatedvesiclesn=2Tax=KomagataellapastorisRepID=C4R1A2_PICPG |
| Aradu|VN4G1|Aradu.VN4G140SribosomalproteinS12n=21Tax=FabaceaeRepID=I1KGU0_SOYBN;Aradu|Q0CSK|Aradu.Q0CSK40SribosomalproteinS12n=21Tax=FabaceaeRepID=I1KGU0_SOYBN;Araip|XI5DK|Araip.XI5DK40SribosomalproteinS12n=21Tax=FabaceaeRepID=I1KGU0_SOYBN;Araip|MS30Q|Araip.MS30Q40SribosomalproteinS12n=21Tax=FabaceaeRepID=I1KGU0_SOYBN;Araip|RI7AH|Araip.RI7AH40SribosomalproteinS12n=21Tax=FabaceaeRepID=I1KGU0_SOYBN;Aradu|T2SCC|Aradu.T2SCC40SribosomalproteinS12n=2Tax=PapilionoideaeRepID=I1KVK9_SOYBN;Aradu|NWM4M|Aradu.NWM4M40SribosomalproteinS12n=2Tax=PapilionoideaeRepID=I1KVK9_SOYBN |
| Aradu|KP7PE|Aradu.KP7PEuricase-2isozyme2[Glycinemax];Araip|UM9DW|Araip.UM9DWuricase-2isozyme2[Glycinemax];Aradu|C7VL7|Aradu.C7VL7CHD3-typechromatin-remodelingfactorpickleprotein |
| Aradu|J5HIY|Aradu.J5HIYmalatedehydrogenase;Araip|KT3YI|Araip.KT3YImalatedehydrogenase;Aradu|N8RFP|Aradu.N8RFPmalatedehydrogenase |
| Araip|B69F1|Araip.B69F126Sproteasomenon-ATPaseregulatorysubunit-likeprotein;Aradu|RT222|Aradu.RT22226Sproteasomenon-ATPaseregulatorysubunit-likeprotein;Aradu|L82NR|Aradu.L82NR26Sproteasomenon-ATPaseregulatorysubunit-likeprotein;Araip|9S7LJ|Araip.9S7LJ26Sproteasomenon-ATPaseregulatorysubunit-likeprotein;Aradu|QC0XQ|Aradu.QC0XQ26Sproteasomenon-ATPaseregulatorysubunit-likeprotein;Aradu|623R5|Aradu.623R526Sproteasomenon-ATPaseregulatorysubunit-likeprotein |
| Araip|1ZF2P|Araip.1ZF2P3-hydroxyisobutyryl-CoAhydrolase-likeprotein;Aradu|TQ8V3|Aradu.TQ8V33-hydroxyisobutyryl-CoAhydrolase-likeprotein;Aradu|65YWZ|Aradu.65YWZ3-hydroxyisobutyryl-CoAhydrolase-likeprotein3,mitochondrial-likeisoform1[Glycinemax] |
| Aradu|88EH5|Aradu.88EH5kunitztrypsininhibitor1 |
| Aradu|7I20U|Aradu.7I20Utriosephosphateisomerase |
| Aradu|V8HSY|Aradu.V8HSY3-isopropylmalatedehydratase,smallsubunit;Araip|LP8AE|Araip.LP8AE3-isopropylmalatedehydratase,smallsubunit |
| Araip|UHR96|Araip.UHR96staphylococcalnucleasedomain-containingprotein1-like[Glycinemax];Aradu|335WD|Aradu.335WDstaphylococcalnucleasedomain-containingprotein1-like[Glycinemax] |
| Araip|PQA2W|Araip.PQA2WPhosphopyruvatehydratasen=1Tax=Dictyosteliumfasciculatum(strainSH3)RepID=F4PJ27_DICFS;Aradu|07WQA|Aradu.07WQAPhosphopyruvatehydratasen=1Tax=Dictyosteliumfasciculatum(strainSH3)RepID=F4PJ27_DICFS |
| Araip|C8DTK|Araip.C8DTKubiquitinactivatingenzyme2 |
| Aradu|4AQ1Z|Aradu.4AQ1Zadenylosuccinatesynthetase;Araip|HUN8L|Araip.HUN8Ladenylosuccinatesynthetase;Araip|YLK1G|Araip.YLK1Gadenylosuccinatesynthetase;Aradu|RX3FZ|Aradu.RX3FZadenylosuccinatesynthetase |
| Aradu|UKZ71|Aradu.UKZ71UDP-glucuronicaciddecarboxylase6-like[Glycinemax];Araip|V5PPP|Araip.V5PPPUDP-glucuronicaciddecarboxylase6-like[Glycinemax];Araip|QUX0P|Araip.QUX0PUDP-glucuronicaciddecarboxylase6-like[Glycinemax];Aradu|X23MZ|Aradu.X23MZUDP-glucuronicaciddecarboxylase6-like[Glycinemax];Araip|I2Y83|Araip.I2Y83UDP-glucuronicaciddecarboxylase5[Glycinemax];Aradu|42MBK|Aradu.42MBKUDP-glucuronicaciddecarboxylase5-likeisoformX3[Glycinemax];Araip|Y9HHS|Araip.Y9HHSUDP-glucuronicaciddecarboxylase1;Araip|UGL36|Araip.UGL36UDP-glucuronicaciddecarboxylase1;Aradu|W3UAF|Aradu.W3UAFUDP-glucuronicaciddecarboxylase1;Aradu|F3XNS|Aradu.F3XNSUDP-glucuronicaciddecarboxylase1;Aradu|G5902|Aradu.G5902UDP-glucuronicaciddecarboxylase1;Aradu|BAA8F|Aradu.BAA8FUDP-glucuronicaciddecarboxylase1;Araip|S12BL|Araip.S12BLUDP-glucuronicaciddecarboxylase1 |
| Araip|GD3PG|Araip.GD3PGheatshockprotein70;Aradu|DLG8U|Aradu.DLG8Uheatshockprotein70;Araip|4W6ZL|Araip.4W6ZLheatshockprotein70;Araip|6D8Q6|Araip.6D8Q6heatshockprotein70;Aradu|2IN3E|Aradu.2IN3Eheatshockprotein70;Aradu|L2DZ2|Aradu.L2DZ2heatshockprotein70;Aradu|TET8U|Aradu.TET8Uheatshockprotein70;Aradu|0J1NB|Aradu.0J1NBheatshockprotein70;Araip|SDN9Y|Araip.SDN9Yheatshockprotein70;Aradu|XG1KZ|Aradu.XG1KZheatshockprotein70;Araip|NU4GY|Araip.NU4GYheatshockprotein70 |
| Aradu|AZC7U|Aradu.AZC7Unucleartransportfactor2B |
| Araip|2IF8M|Araip.2IF8Meukaryotictranslationinitiationfactor2gammasubunit;Aradu|92DR8|Aradu.92DR8eukaryotictranslationinitiationfactor2gammasubunit;Aradu|Q8YUB|Aradu.Q8YUBeukaryotictranslationinitiationfactor2gammasubunit;Araip|Z4ZAK|Araip.Z4ZAKeukaryotictranslationinitiationfactor2gammasubunit |
| Araip|H6WCB|Araip.H6WCBperoxisomal(S)-2-hydroxy-acidoxidaseGLO1;Araip|S6Q95|Araip.S6Q95peroxisomal(S)-2-hydroxy-acidoxidaseGLO1;Aradu|U8IBL|Aradu.U8IBLperoxisomal(S)-2-hydroxy-acidoxidaseGLO1 |
| Araip|6S389|Araip.6S389Acyl-[acyl-carrier-protein]desaturasen=2Tax=SolanumRepID=K4C635_SOLLC;Aradu|L1M1M|Aradu.L1M1MAcyl-[acyl-carrier-protein]desaturasen=2Tax=SolanumRepID=K4C635_SOLLC |
| Araip|L8U0E|Araip.L8U0EmalonylCoA-acylcarriertransacylase;Araip|R08HU|Araip.R08HUmalonylCoA-acylcarriertransacylase;Aradu|AR6IT|Aradu.AR6ITmalonylCoA-acylcarriertransacylase;Aradu|2W51Q|Aradu.2W51QmalonylCoA-acylcarriertransacylase;Araip|TR8WR|Araip.TR8WRmalonylCoA-acylcarriertransacylase |
| Araip|F83CP|Araip.F83CPPyruvatekinasefamilyprotein;Aradu|P81AE|Aradu.P81AEPyruvatekinasefamilyprotein |
| Aradu|4Q29Q|Aradu.4Q29QphospholipaseDP2;Aradu|FS7LG|Aradu.FS7LGphospholipaseDP2;Araip|0C2UG|Araip.0C2UGphospholipaseDalpha1;Aradu|H7I4I|Aradu.H7I4IphospholipaseDalpha1 |
| Araip|R86PR|Araip.R86PRNAD-dependentepimerase/dehydratasefamilyprotein;Aradu|ZL6EF|Aradu.ZL6EFNAD-dependentepimerase/dehydratasefamilyprotein;Araip|N3G5W|Araip.N3G5WNAD-dependentepimerase/dehydratasen=7Tax=MethylobacteriumRepID=A9VXU6_METEP;Araip|U179F|Araip.U179FNAD-dependentepimerase/dehydratasen=7Tax=MethylobacteriumRepID=A9VXU6_METEP |
| Araip|UF6J5|Araip.UF6J5serinehydroxymethyltransferase4;Aradu|BAW60|Aradu.BAW60serinehydroxymethyltransferase4 |
| Araip|A03F3|Araip.A03F3aspartateaminotransferase5;Aradu|GKD3R|Aradu.GKD3Raspartateaminotransferase5 |
| Aradu|9W6CT|Aradu.9W6CTglucose-6-phosphatedehydrogenase6;Aradu|G9N9R|Aradu.G9N9Rglucose-6-phosphatedehydrogenase6;Araip|52S9A|Araip.52S9Aglucose-6-phosphatedehydrogenase5;Araip|Z8HBD|Araip.Z8HBDglucose-6-phosphatedehydrogenase6;Araip|8D8E0|Araip.8D8E0glucose-6-phosphatedehydrogenase6;Araip|L2MWP|Araip.L2MWPglucose-6-phosphatedehydrogenase6;Araip|Y3H9F|Araip.Y3H9Fglucose-6-phosphatedehydrogenase6 |
| Araip|I6NSD|Araip.I6NSDtransaldolasefamilyprotein;Aradu|U0DT9|Aradu.U0DT9transaldolasefamilyprotein;Aradu|472P6|Aradu.472P6transaldolasefamilyprotein;Aradu|NKW3P|Aradu.NKW3Preceptorkinase2 |
| Araip|4XU2W|Araip.4XU2Welongationfactor1-beta;Aradu|JV10F|Aradu.JV10Felongationfactor1-beta |
| Aradu|GP04Q|Aradu.GP04Qpyruvatedecarboxylase-2;Araip|8UW4J|Araip.8UW4Jpyruvatedecarboxylase-2 |
| Aradu|7K065|Aradu.7K065malatedehydrogenase;Aradu|5S6XB|Aradu.5S6XBmalatedehydrogenase;Araip|Q2R8P|Araip.Q2R8Pmalatedehydrogenase |
| Araip|KVI16|Araip.KVI16acetyl-CoAcarboxylase2;Aradu|ET2TE|Aradu.ET2TEacetyl-CoAcarboxylase2 |
| Aradu|8IN6N|Aradu.8IN6NPyruvatekinasefamilyprotein;Araip|L7NBZ|Araip.L7NBZPyruvatekinasefamilyprotein |
| Aradu|9645F|Aradu.9645Fproteindisulfideisomerase-related;Araip|7X1IR|Araip.7X1IRproteindisulfideisomerase-likeprotein;Aradu|IJE78|Aradu.IJE78proteindisulfideisomerase-likeprotein;Aradu|L73E9|Aradu.L73E9proteindisulfideisomerase-likeprotein;Araip|34ZNV|Araip.34ZNVprobableproteindisulfide-isomeraseA6-likeisoform1[Glycinemax] |
| Aradu|7WJ9D|Aradu.7WJ9DSec14p-likephosphatidylinositoltransferfamilyprotein |
| Araip|776JT|Araip.776JTRABGDPdissociationinhibitor2;Aradu|RCS61|Aradu.RCS61RABGDPdissociationinhibitor2;Araip|FU5J9|Araip.FU5J9RABGDPdissociationinhibitor2;Aradu|SJR7G|Aradu.SJR7GRABGDPdissociationinhibitor2;Araip|36SP7|Araip.36SP7RABGDPdissociationinhibitor2;Aradu|PD7X7|Aradu.PD7X7RABGDPdissociationinhibitor2 |
| Araip|0B1IX|Araip.0B1IXpyruvatedehydrogenaseE1component,alphasubunit;Aradu|PJ5MX|Aradu.PJ5MXpyruvatedehydrogenaseE1component,alphasubunit |
| Aradu|JB1F3|Aradu.JB1F3Dihydrolipoamideacetyltransferasecomponent(E2)ofpyruvatedehydrogenasecomplexn=7Tax=BacteriaRepID=F7URM9_SYNYG;Aradu|RRB5Y|Aradu.RRB5Ydihydrolipoyllysine-residueacetyltransferasecomponentofpyruvatedehydrogenasecomplex,mitochondrial-likeisoformX1[Glycinemax] |
| Aradu|M7N57|Aradu.M7N57staphylococcalnucleasedomain-containingprotein1-like[Glycinemax];Araip|U14XR|Araip.U14XRstaphylococcalnucleasedomain-containingprotein1-like[Glycinemax] |
| Aradu|49UB9|Aradu.49UB9Pyruvatekinasefamilyprotein;Araip|GCV0S|Araip.GCV0SPyruvatekinasefamilyprotein;Aradu|YED6D|Aradu.YED6DPentatricopeptiderepeat(PPR-like)superfamilyprotein;Araip|WH1S2|Araip.WH1S2Pentatricopeptiderepeat(PPR-like)superfamilyprotein |
| Aradu|C5DXV|Aradu.C5DXVfructose-bisphosphatealdolase2;Araip|ZR190|Araip.ZR190fructose-bisphosphatealdolase2;Araip|07C53|Araip.07C53fructose-bisphosphatealdolase2;Araip|60WE7|Araip.60WE7fructose-bisphosphatealdolase2;Aradu|Z5F9U|Aradu.Z5F9Ufructose-bisphosphatealdolase1;Aradu|N8WG9|Aradu.N8WG9fructose-bisphosphatealdolase2;Araip|GJ91G|Araip.GJ91Gfructose-bisphosphatealdolase1 |
| Aradu|HW77V|Aradu.HW77Vglutathionereductase,cytosolic-likeisoformX3[Glycinemax] |
| Aradu|19IZS|Aradu.19IZSTransketolase;Aradu|IS5YT|Aradu.IS5YTTransketolase;Araip|QYZ6U|Araip.QYZ6UTransketolase |
| Araip|T0LEM|Araip.T0LEM1,4-alpha-glucan-branchingenzyme-like[Glycinemax] |
| Araip|7XU1G|Araip.7XU1GInositolmonophosphatasefamilyprotein |
| Aradu|K9HT3|Aradu.K9HT3glycogen/starch/alpha-glucanphosphorylasefamilyprotein;Aradu|EMA8S|Aradu.EMA8Sglycogen/starch/alpha-glucanphosphorylasefamilyprotein;Araip|NE7CK|Araip.NE7CKglycogen/starch/alpha-glucanphosphorylasefamilyprotein |
| Araip|15F3V|Araip.15F3VCalreticulin2,calcium-bindingproteinn=1Tax=CoccomyxasubellipsoideaC-169RepID=I0YTB6_9CHLO;Aradu|59RNH|Aradu.59RNHCalreticulin2,calcium-bindingproteinn=1Tax=CoccomyxasubellipsoideaC-169RepID=I0YTB6_9CHLO |
| Araip|91947|Araip.91947glutaminesynthetase2 |
| Araip|LWG2P|Araip.LWG2P3-isopropylmalatedehydratase,largesubunit;Aradu|2Q562|Aradu.2Q5623-isopropylmalatedehydratase,largesubunit |
| Aradu|14CMN|Aradu.14CMNacetyl-CoAcarboxylase,carboxyltransferase,alphasubunit;Araip|7H2NS|Araip.7H2NSacetyl-CoAcarboxylase,carboxyltransferase,alphasubunit |
| Araip|UL2GU|Araip.UL2GUglutaminesynthetase2;Aradu|G6IK8|Aradu.G6IK8glutaminesynthetase2 |
| Aradu|6W1XZ|Aradu.6W1XZ1,4-alpha-glucan-branchingenzyme-like[Glycinemax] |
| Araip|R1WSG|Araip.R1WSGSPFH/Band7/PHBdomain-containingmembrane-associatedproteinfamily;Araip|AKR1H|Araip.AKR1HSPFH/Band7/PHBdomain-containingmembrane-associatedproteinfamily;Aradu|G1SYE|Aradu.G1SYESPFH/Band7/PHBdomain-containingmembrane-associatedproteinfamily;Aradu|0B0KP|Aradu.0B0KPSPFH/Band7/PHBdomain-containingmembrane-associatedproteinfamily;Aradu|F950X|Aradu.F950XSPFH/Band7/PHBdomain-containingmembrane-associatedproteinfamily;Araip|NDR0B|Araip.NDR0BSPFH/Band7/PHBdomain-containingmembrane-associatedproteinfamily;Araip|CE7Q8|Araip.CE7Q8SPFH/Band7/PHBdomain-containingmembrane-associatedproteinfamily;Araip|M9Q5C|Araip.M9Q5CSPFH/Band7/PHBdomain-containingmembrane-associatedproteinfamily;Aradu|M7QCJ|Aradu.M7QCJSPFH/Band7/PHBdomain-containingmembrane-associatedproteinfamily |
| Aradu|H2SP1|Aradu.H2SP1phosphoenolpyruvatecarboxylase1;Araip|NKX5E|Araip.NKX5Ephosphoenolpyruvatecarboxylase1;Araip|C5W32|Araip.C5W32phosphoenolpyruvatecarboxylase2;Araip|6YH6X|Araip.6YH6Xphosphoenolpyruvatecarboxylase2;Aradu|1TH42|Aradu.1TH42phosphoenolpyruvatecarboxylase1;Aradu|3579H|Aradu.3579Hglucose-6-phosphateisomerase;Aradu|IW635|Aradu.IW635phosphoenolpyruvatecarboxylase1;Aradu|UP5AZ|Aradu.UP5AZphosphoenolpyruvatecarboxylase1;Araip|C3PGN|Araip.C3PGNphosphoenolpyruvatecarboxylase1;Aradu|P6TAV|Aradu.P6TAVphosphoenolpyruvatecarboxylase3 |
| Araip|02N4R|Araip.02N4Risocitratedehydrogenase;Aradu|452B2|Aradu.452B2isocitratedehydrogenase |
| Araip|EDV8G|Araip.EDV8G1,4-alpha-glucan-branchingenzyme-like[Glycinemax];Aradu|37TWH|Aradu.37TWHstarchbranchingenzymeI |
| Aradu|82DSF|Aradu.82DSFcytokininoxidase/dehydrogenase1;Araip|ZXC56|Araip.ZXC56cytokininoxidase/dehydrogenase1 |
| Araip|KHF35|Araip.KHF35Phosphoglyceratemutase,2,3-bisphosphoglycerate-independent |
| Aradu|BD60N|Aradu.BD60NGlucose-1-phosphateadenylyltransferasefamilyprotein |
| Aradu|0UW7J|Aradu.0UW7JPhosphoglyceratekinasefamilyprotein |
| Aradu|V2CUT|Aradu.V2CUTFASCICLIN-likearabinogalactan1;Araip|WZM84|Araip.WZM84FASCICLIN-likearabinogalactan1;Araip|F7QJH|Araip.F7QJHFASCICLIN-likearabinogalactan1;Aradu|83VKU|Aradu.83VKUFASCICLIN-likearabinogalactan1 |
| Araip|32X4C|Araip.32X4Cphosphoenolpyruvatecarboxylase1 |
| Araip|N8RKW|Araip.N8RKWheatshockprotein70;Aradu|24A4H|Aradu.24A4Hheatshockprotein70;Araip|Z1IJI|Araip.Z1IJIheatshockprotein70;Araip|S73ZI|Araip.S73ZIheatshockprotein70 |
| Araip|3H4X4|Araip.3H4X4glutamine-tRNAligase,putative/glutaminyl-tRNAsynthetase,putative/GlnRS,putative |
| Aradu|094MD|Aradu.094MDdelta-1-pyrroline-5-carboxylatesynthetase;Araip|89D00|Araip.89D00delta-1-pyrroline-5-carboxylatesynthetase |
| Araip|V71XV|Araip.V71XVGTP-bindingnuclearRan-likeprotein;Aradu|V9UDT|Aradu.V9UDTGTP-bindingnuclearRan-likeprotein;Araip|P6YY9|Araip.P6YY9GTP-bindingnuclearRan-likeprotein;Aradu|03JH0|Aradu.03JH0GTP-bindingnuclearRan-likeprotein |
| Araip|G0FLH|Araip.G0FLH40SribosomalproteinS13[Glycinemax];Araip|CAL49|Araip.CAL4940SribosomalproteinS13[Glycinemax];Aradu|79MUY|Aradu.79MUY40SribosomalproteinS13[Glycinemax];Aradu|U6Y5X|Aradu.U6Y5XPentatricopeptiderepeat(PPR)superfamilyprotein;Aradu|NIR3G|Aradu.NIR3G40SribosomalproteinS13[Glycinemax];Araip|JK8VR|Araip.JK8VR40SribosomalproteinS13[Glycinemax] |
| Araip|VS9DN|Araip.VS9DNHyaluronan/mRNAbindingfamily;Aradu|FK6GI|Aradu.FK6GIHyaluronan/mRNAbindingfamily;Araip|FGD4N|Araip.FGD4NHyaluronan/mRNAbindingfamily |
| Araip|44UYF|Araip.44UYFDihydroxyacetonekinase;Aradu|EI99W|Aradu.EI99WDihydroxyacetonekinase |
| Araip|RWB72|Araip.RWB72NAD-dependentmalicenzyme1;Aradu|S56JH|Aradu.S56JHNAD-dependentmalicenzyme1;Araip|J5GX8|Araip.J5GX8NAD-dependentmalicenzyme1;Aradu|S5K3Z|Aradu.S5K3ZNAD-dependentmalicenzyme1;Araip|JZ063|Araip.JZ063NAD-dependentmalicenzyme1;Aradu|0C9TU|Aradu.0C9TUNAD-dependentmalicenzyme1;Aradu|CK0W6|Aradu.CK0W6NAD-dependentmalicenzyme2;Araip|F77JF|Araip.F77JFNAD-dependentmalicenzyme2;Aradu|P6639|Aradu.P6639NAD-dependentmalicenzyme1;Aradu|R9UNN|Aradu.R9UNNNADP-malicenzyme1;Araip|F5MI5|Araip.F5MI5NADP-malicenzyme4;Araip|G1WPG|Araip.G1WPGNAD-dependentmalicenzyme2 |
| Aradu|C73IQ|Aradu.C73IQTCP-1/cpn60chaperoninfamilyprotein;Araip|J0WZR|Araip.J0WZRTCP-1/cpn60chaperoninfamilyprotein |
| Aradu|WR10B|Aradu.WR10BpyruvatedehydrogenaseE1beta;Araip|VR692|Araip.VR692pyruvatedehydrogenaseE1beta;Araip|NEM0P|Araip.NEM0PpyruvatedehydrogenaseE1beta;Aradu|N2G7A|Aradu.N2G7ApyruvatedehydrogenaseE1beta |
| Aradu|BNJ3E|Aradu.BNJ3Eprobableaspartylaminopeptidase-like[Glycinemax] |
| Araip|GN6XE|Araip.GN6XE40SribosomalproteinS3a-1;Aradu|S59LW|Aradu.S59LW40SribosomalproteinS3a-1;Araip|CH8XD|Araip.CH8XD40SribosomalproteinS3a-1 |
| Aradu|07VYH|Aradu.07VYH3-hydroxyacyl-[acyl-carrier-protein]dehydrataseFabZn=2Tax=SynechococcusRepID=FABZ_SYNJA;Araip|5MC2N|Araip.5MC2N3-hydroxyacyl-[acyl-carrier-protein]dehydrataseFabZn=2Tax=SynechococcusRepID=FABZ_SYNJA |
References
- Duranti, M.; Gius, C. Legume seeds: Protein content and nutritional value. Field Crop. Res. 1997, 53, 31–45. [Google Scholar] [CrossRef]
- Djemel, N.; Guedon, D.; Lechevalier, A.; Salon, C.; Miquel, M.; Prosperi, J.M.; Rochat, C.; Boutin, J.P. Development and composition of the seeds of nine genotypes of the Medicago truncatula species complex. Plant Physiol. Biochem. 2005, 43, 557–566. [Google Scholar] [CrossRef] [PubMed]
- Gallardo, K.; Thompson, R.; Burstin, J. Reserve accumulation in legume seeds. Comptes. Rendus. Biol. 2008, 331, 755–762. [Google Scholar] [CrossRef] [PubMed]
- Siddique, K.H.; Johansen, C.; Turner, N.C.; Jeuffroy, M.H.; Hashem, A.; Sakar, D.; Gan, Y.; Alghamdi, S.S. Innovations in agronomy for food legumes. A review. Agron. Sustain. Dev. 2012, 32, 45–64. [Google Scholar] [CrossRef]
- Angelovici, R.; Galili, G.; Fernie, A.; Fait, A. Seed Desiccation: A Bridge Between Maturation and Germination. Cell 2010, 15, 211–218. [Google Scholar] [CrossRef] [PubMed]
- Hajduch, M.; Matusova, R.; Houston, N.; Thelen, J. Comparative Proteomics of Seed Maturation in Oilseed Reveals Differences in Intermediary Metabolism. Proteomics 2011, 11, 1619–1629. [Google Scholar] [CrossRef] [PubMed]
- Li, W.; Gao, Y.; Xu, H.; Zhang, Y.; Wang, J. A Proteomic Analysis of Seed Development in Brassica campestris L. PLoS ONE 2012, 7, e50290. [Google Scholar] [CrossRef]
- Liu, H.; Wang, C.; Komatsu, S.; He, M.; Liu, G.; Shin, S. Proteomic Analysis of the Seed Development in Jatropha curcas: From Carbon Flux to Lipid Accumulation. J. Proteom. 2013, 91, 23–40. [Google Scholar] [CrossRef]
- Guo, B.; Liang, X.; Chung, S.; Holbrook, C.; Maleki, S. Proteomic Analysis of Peanut Seed Storage Proteins and Genetic Variation in a Potential Peanut Allergen. Protein Pept. Lett. 2008, 15, 567–577. [Google Scholar] [CrossRef]
- White, B.; Gokce, E.; Nepomuceno, A.; Muddiman, D.; Sanders, T.; Davis, J. Comparative Proteomic Analysis and IgE Binding Properties of Peanut Seed and Testa (Skin). J. Agric. Food Chem. 2013, 61, 3957–3968. [Google Scholar] [CrossRef]
- Wang, Y.; Ma, X.; Zhang, X.; He, X.; Li, H.; Cui, D.; Yin, D. ITRAQ-Based Proteomic Analysis of the Metabolic Mechanisms Behind Lipid Accumulation and Degradation during Peanut Seed Development and Postgermination. J. Proteome Res. 2016, 15, 4277–4289. [Google Scholar] [CrossRef] [PubMed]
- Liu, H.; Li, H.; Gu, J.; Deng, L.; Ren, L.; Hong, Y.; Lu, Q.; Chen, X.; Liang, X. Identification of the Candidate Protein Related to Oleic Acid Accumulation During Peanut (Arachis hypogaea L.) Seed Development through Comparative Proteome Analysis. Int. J. Mol. Sci. 2018, 19, 1235. [Google Scholar] [CrossRef] [PubMed]
- Zhao, X.; Li, C.; Yan, C.; Wang, J.; Yuan, C.; Zhang, H.; Shan, S. Transcriptome and Proteome Analyses of Resistant Preharvest Peanut Seed Coat in Response to Aspergillus flavus Infection. Electron. J. Biotechnol. 2019, 39, 82–90. [Google Scholar] [CrossRef]
- Li, H.; Liang, X.; Zhou, B.; Chen, X.; Hong, Y.; Zhou, R.; Li, S.; Liu, H.; Lu, Q.; Liu, H.; et al. A Proteomic Analysis of Peanut Seed at Different Stages of Underground Development to Understand the Changes of Seed Proteins. PLoS ONE 2020, 15, e0243132. [Google Scholar] [CrossRef]
- Zhou, W.; Branch, W.; Gilliam, L.; Marshall, J. Phytosterol Composition of Arachis hypogaea Seeds from Different Maturity Classes. Molecules 2018, 24, 106. [Google Scholar] [CrossRef] [PubMed]
- Williams, E.J.; Drexler, J.S. A Non-Destructive Method for Determining Peanut Pod Maturity. Peanut Sci. 1981, 8, 134–141. [Google Scholar] [CrossRef]
- FoodData Central, U.S. Department of Agriculture, Agricultural Research Service. Available online: https://fdc.nal.usda.gov/fdc-app.html#/food-details/2515376/nutrients (accessed on 13 February 2024).
- Davis, J.P.; Dean, L.L. Peanut Composition, Flavor, and Nutrition. In Peanuts: Genetics, Processing Utilization, 1st ed.; Stalker, T., Wilson, R.F., Eds.; Elsevier: Amsterdam, The Netherlands, 2016; pp. 289–345. [Google Scholar] [CrossRef]
- Shevchenko, A.; Wilm, M.; Vorm, O.; Mann, M. Sequencing of Proteins from Silver-stained Polyacrylamide Gels. Anal. Chem. 1996, 68, 850–858. [Google Scholar] [CrossRef]
- Rappsilber, J.; Ishihama, Y.; Mann, M. Stop and Go Extraction Tips for Matrix-assisted Laser Desorption/Ionization, Nanoelectrospray, and LC/MS Sample Pretreatment in Proteomics. Anal. Chem. 2003, 75, 663–670. [Google Scholar] [CrossRef]
- Guerrero, A.; Dallas, D.C.; Contreras, S.; Chee, S.; Parker, E.A.; Sun, X.; Dimapascoc, L.; Barile, D.; German, J.B.; Lebrilla, C.B. Mechanistic Peptidomics: Factors that Dictate Specificity in the Formation of Endogenous Peptides in Human Milk. Mol. Cell Proteom. 2014, 13, 3343–3351. [Google Scholar] [CrossRef]
- Yang, L.L.; Li, Q.L.; Han, X.Y.; Jiang, X.L.; Wang, H.; Shi, Y.J.; Chen, L.L.; Li, H.L.; Liu, Y.Q.; Yang, X.; et al. A Cysteine-rich Secretory Protein Involves in Phytohormone Melatonin Mediated Plant resistance to CGMMV. BMC Plant Biol. 2023, 23, 215. [Google Scholar] [CrossRef]
- Üstün, S.; Sheikh, A.; Gimenez-Ibanez, S.; Jones, A.; Ntoukakis, V.; Börnke, F. The Proteasome Acts as a Hub for Plant Immunity and Is Targeted by Pseudomonas Type III Effectors. Plant Physiol. 2016, 172, 1941–1958. [Google Scholar] [CrossRef] [PubMed]
- Chen, M.; Thelen, J.J. The Plastid Isoform of Triose Phosphate Isomerase Is Required for the Postgerminative Transition from Heterotrophic to Autotrophic Growth. Plant Cell 2010, 22, 77–90. [Google Scholar] [CrossRef] [PubMed]
- Stone, J.M.; Walker, J.C. Plant Protein Kinase Families and Signal Transduction. Plant Physiol. 1995, 108, 451–457. [Google Scholar] [CrossRef]
- Zhou, J.; Zhao, L.; Wu, Y.; Zhang, X.; Cheng, S.; Wei, F.; Zhang, Y.; Zhu, H.; Zhou, Y.; Feng, Z.; et al. A DEK Domain-containing Protein GhDEK2D Mediated Gossypium hirsutum Enhanced Resistance to Verticillium dahlia. Plant Signal. Behav. 2022, 17, 2024738. [Google Scholar] [CrossRef] [PubMed]
- Xu, Z.-S.; Li, Z.-Y.; Chen, Y.; Chen, M.; Li, L.-C.; Ma, Y.-Z. Heat Shock Protein 90 in Plants: Molecular Mechanisms and Roles in Stress Responses. Int. J. Mol. Sci. 2012, 13, 15706–15723. [Google Scholar] [CrossRef] [PubMed]
- Kelaini, S.; Chan, C.; Cornelius, V.A.; Margariti, A. RNA-Binding Proteins Hold Key Roles in Function, Dysfunction, and Disease. Biology 2021, 10, 366. [Google Scholar] [CrossRef] [PubMed]
- Sun, Y.; Wu, Z.; Wang, Y.; Yang, J.; Wei, G.; Chou, M. Identification of Phytocyanin Gene Family in Legume Plants and their Involvement in Nodulation of Medicago truncatula. Plant Cell Physiol. 2019, 60, 900–915. [Google Scholar] [CrossRef]
- Yin, H.; Yang, F.; He, X.; Du, X.; Mu, P.; Ma, W. Advances in the Functional Study of Glutamine Synthetase in Plant Abiotic Stress Tolerance Response. Crop J. 2022, 10, 917–923. [Google Scholar] [CrossRef]
- Kumar, R.; Jiwani, G.; Pareek, A.; SravanKumar, T.; Khurana, A.; Sharma, A.K. Evolutionary Profiling of Group II Pyridoxal-Phosphate-Dependent Decarboxylases Suggests Expansion and Functional Diversification of Histidine Decarboxylases in Tomato. Plant Genome 2016, 9, 1–15. [Google Scholar] [CrossRef]
- Tetlow, I.J.; Morell, M.K.; Emes, M.J. Recent Developments in Understanding the Regulation of Starch Metabolism in Higher Plants. J. Exp. Bot. 2004, 55, 2131–2145. [Google Scholar] [CrossRef]
- Laemmli, U.K. Cleavage of Structural Proteins during the Assembly of the Head of Bacteriophage T4. Nature 1970, 227, 680–685. [Google Scholar] [CrossRef] [PubMed]
- Rappsilber, J.; Mann, M.; Ishihama, Y. Protocol for Micro-purification, Enrichment, Pre-fractionation and Storage of Peptides for Proteomics Using StageTips. Nat. Protoc. 2007, 2, 1896–1906. [Google Scholar] [CrossRef] [PubMed]
- Olsen, J.V.; de Godoy, L.M.; Li, G.; Macek, B.; Mortensen, P.; Pesch, R.; Makarov, A.; Lange, O.; Horning, S.; Mann, M. Parts per Million Mass Accuracy on an Orbitrap Mass Spectrometer via Lock Mass Injection into a C-trap. Mol. Cell Proteom. 2005, 4, 2010–2021. [Google Scholar] [CrossRef] [PubMed]
- Bunkenborg, J.; García, G.E.; Paz, M.I.P.; Andersen, J.S.; Molina, H. The Minotaur Proteome: Avoiding Cross-species Identifications deriving from Bovine Serum in Cell Culture Models. Proteomics 2010, 10, 3040–3044. [Google Scholar] [CrossRef]
- Cox, J.; Hein, M.Y.; Luber, C.A.; Paron, I.; Nagaraj, N.; Mann, M. Accurate Proteome-wide Label-free Quantification by Delayed Normalization and Maximal Peptide Ratio Extraction, Termed MaxLFQ. Mol. Cell Proteom. 2014, 13, 2513–2526. [Google Scholar] [CrossRef]


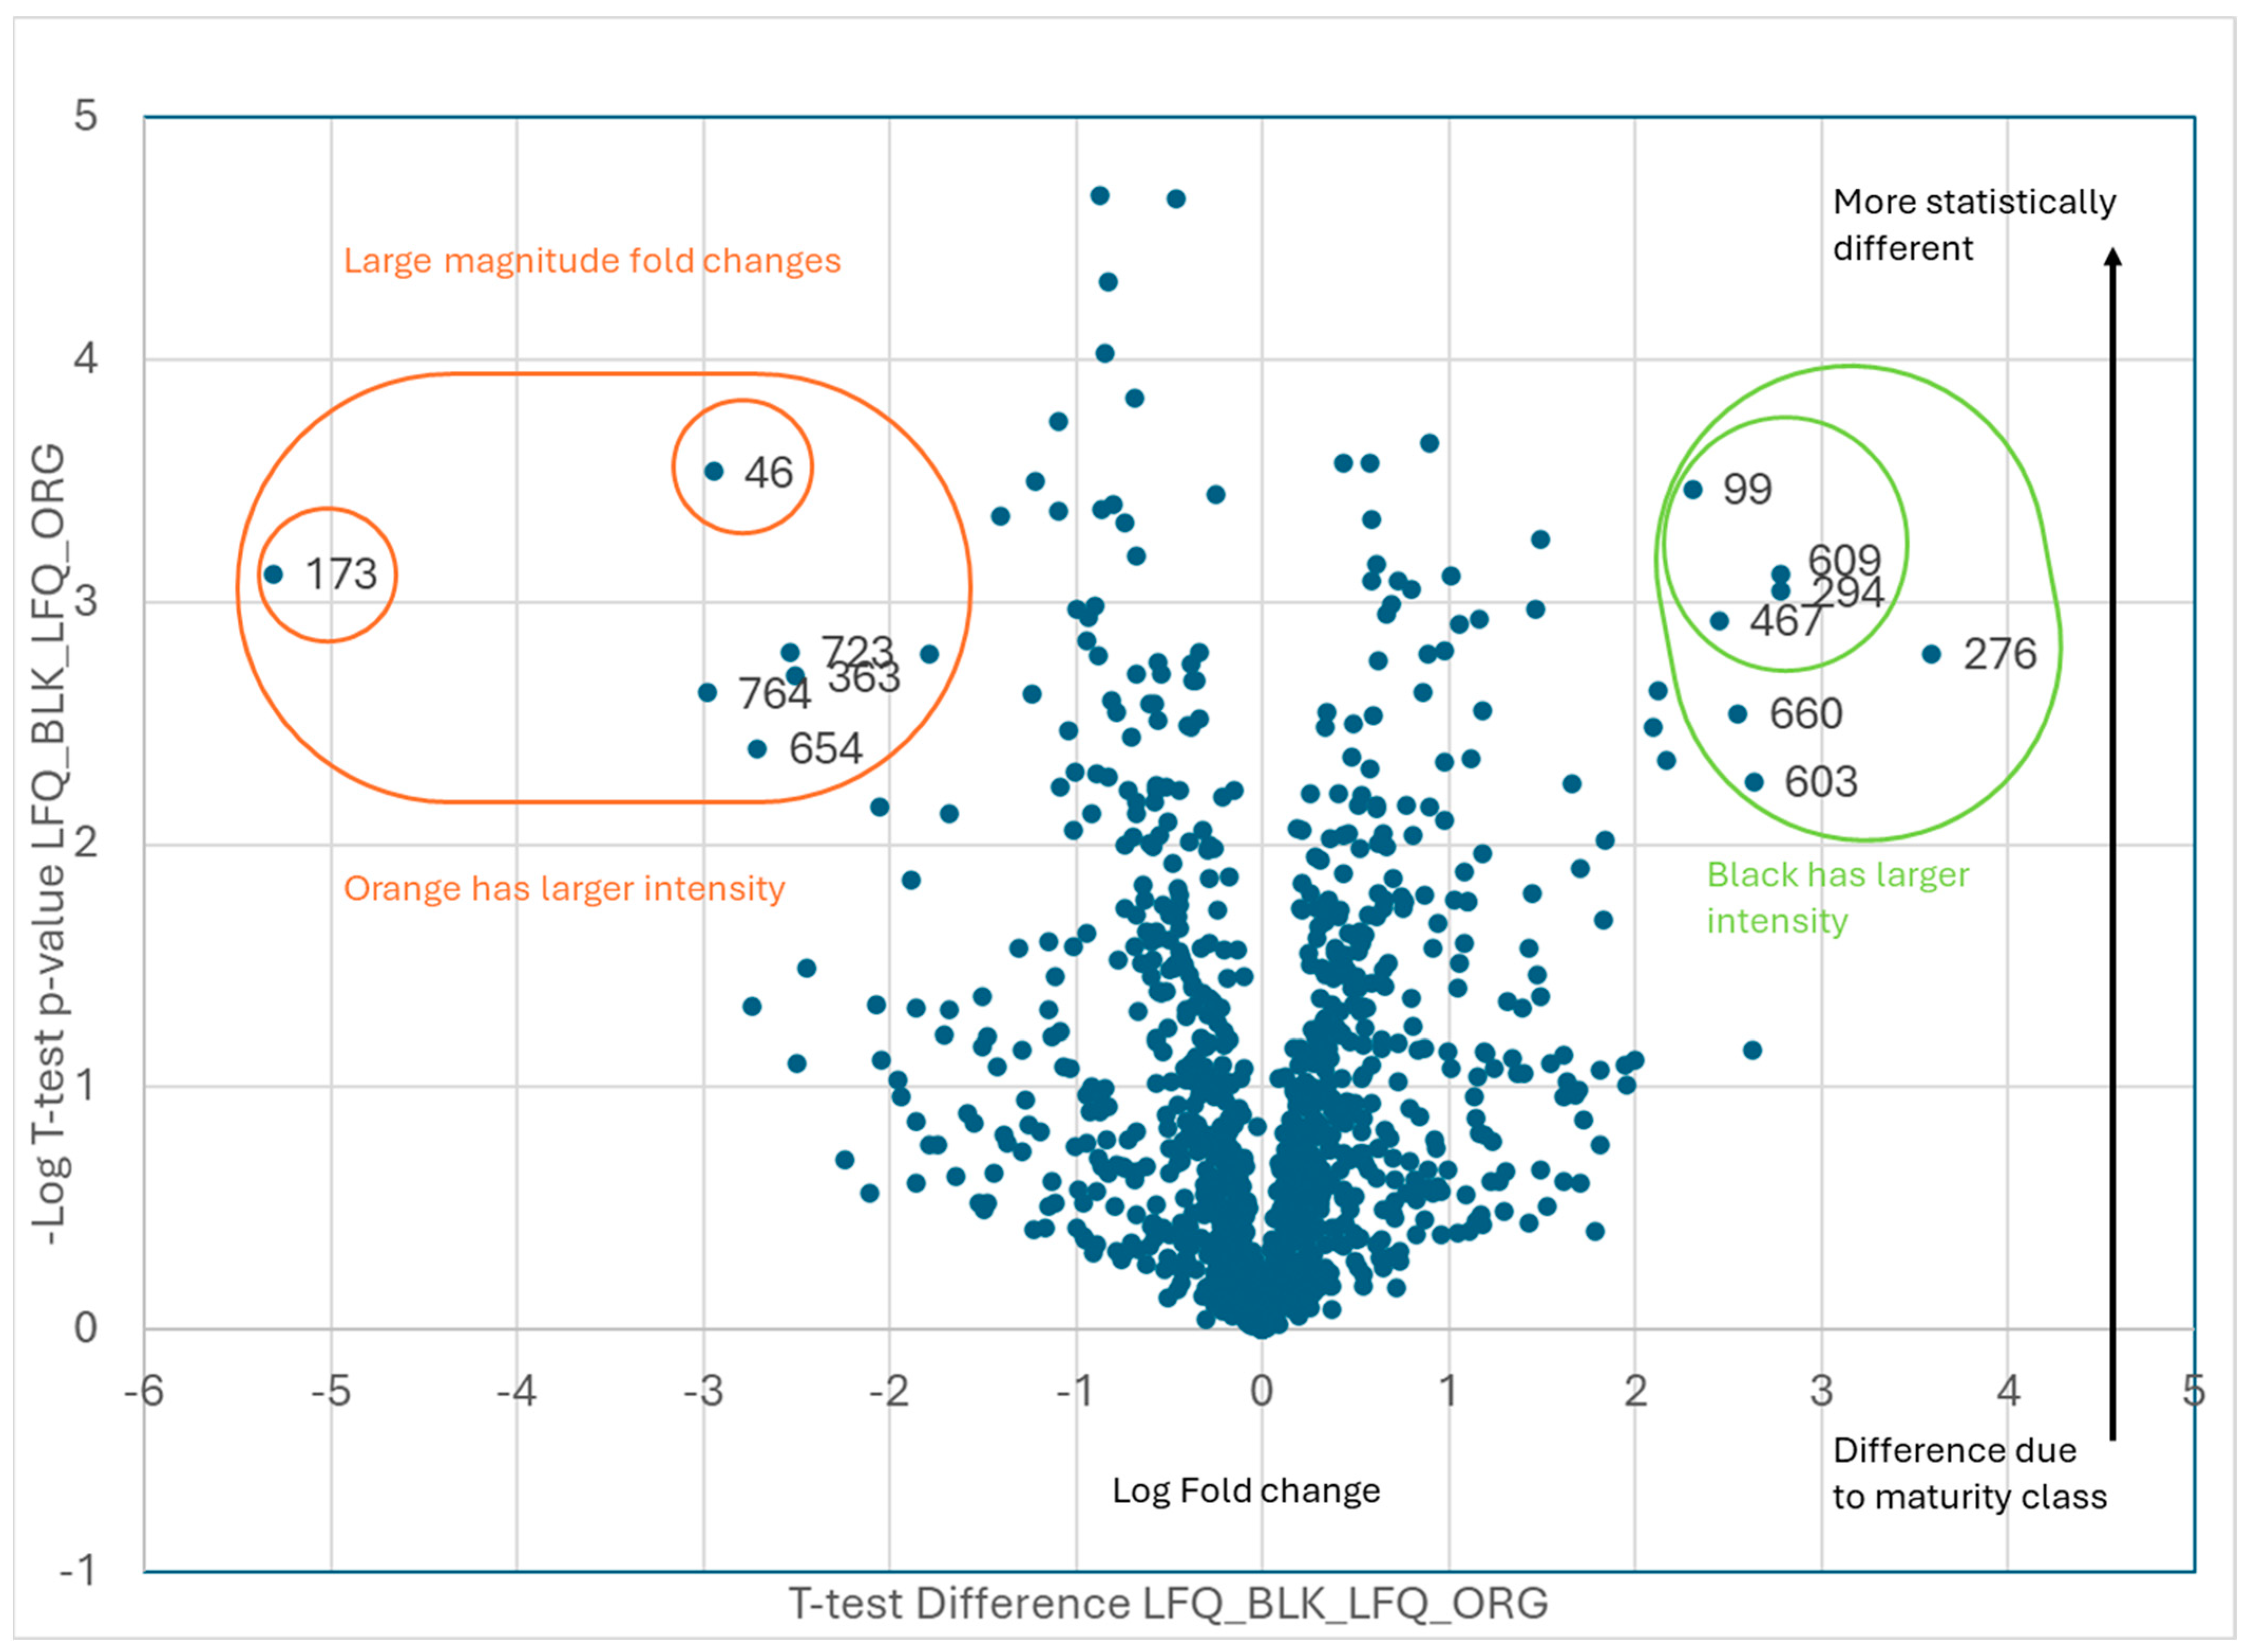


| Black vs. Orange | |
|---|---|
| Orange | |
| Code | Protein ID |
| 46 | Arahy|7L8B8I|Arahy.7L8B8ICAP Cysteine-richsecretoryproteins |
| 173 | Arahy|XZ8T7F|Arahy.XZ8T7Ftriosephosphateisomerase |
| 363 | Arahy|A863J5|Arahy.A863J5glutaminesynthetase2 |
| 654 | Arahy|KSV57K|Arahy.KSV57Kcelldivisioncycleprotein48homolog[Glycinemax] |
| 723 | Arahy|AUI3M2|Arahy.AUI3M2Pyridoxalphosphate-dependenttransferasessuperfamilyproteinisoform |
| 764 | Arahy|SN2AIN|Arahy.SN2AINRNA-bindingprotein1 |
| Black | |
| Code | Protein ID |
| 99 | Arahy|X0F9HV|Arahy.X0F9HVProteinkinasesuperfamilyprotein |
| 276 | Arahy|AP25S4|Arahy.AP25S460Sacidicribosomalproteinfamily |
| 294 | Arahy|TZW06C|Arahy.TZW06Cbluecopperprotein-like |
| 467 | Arahy|E04WLM|Arahy.E04WLMproteasomesubunitbetatype-7-Aprotein |
| 603 | Arahy|WK6QAZ|Arahy.WK6QAZseedstorage2Salbuminsuperfamilyprotein |
| 609 | Arahy|A9Q4ZU|Arahy.A9Q4ZUproteinDEK-likeisoformX1 |
| 660 | Arahy|6Q1KS5|Arahy.6Q1KS5MethionineS-adenosyltransferase |
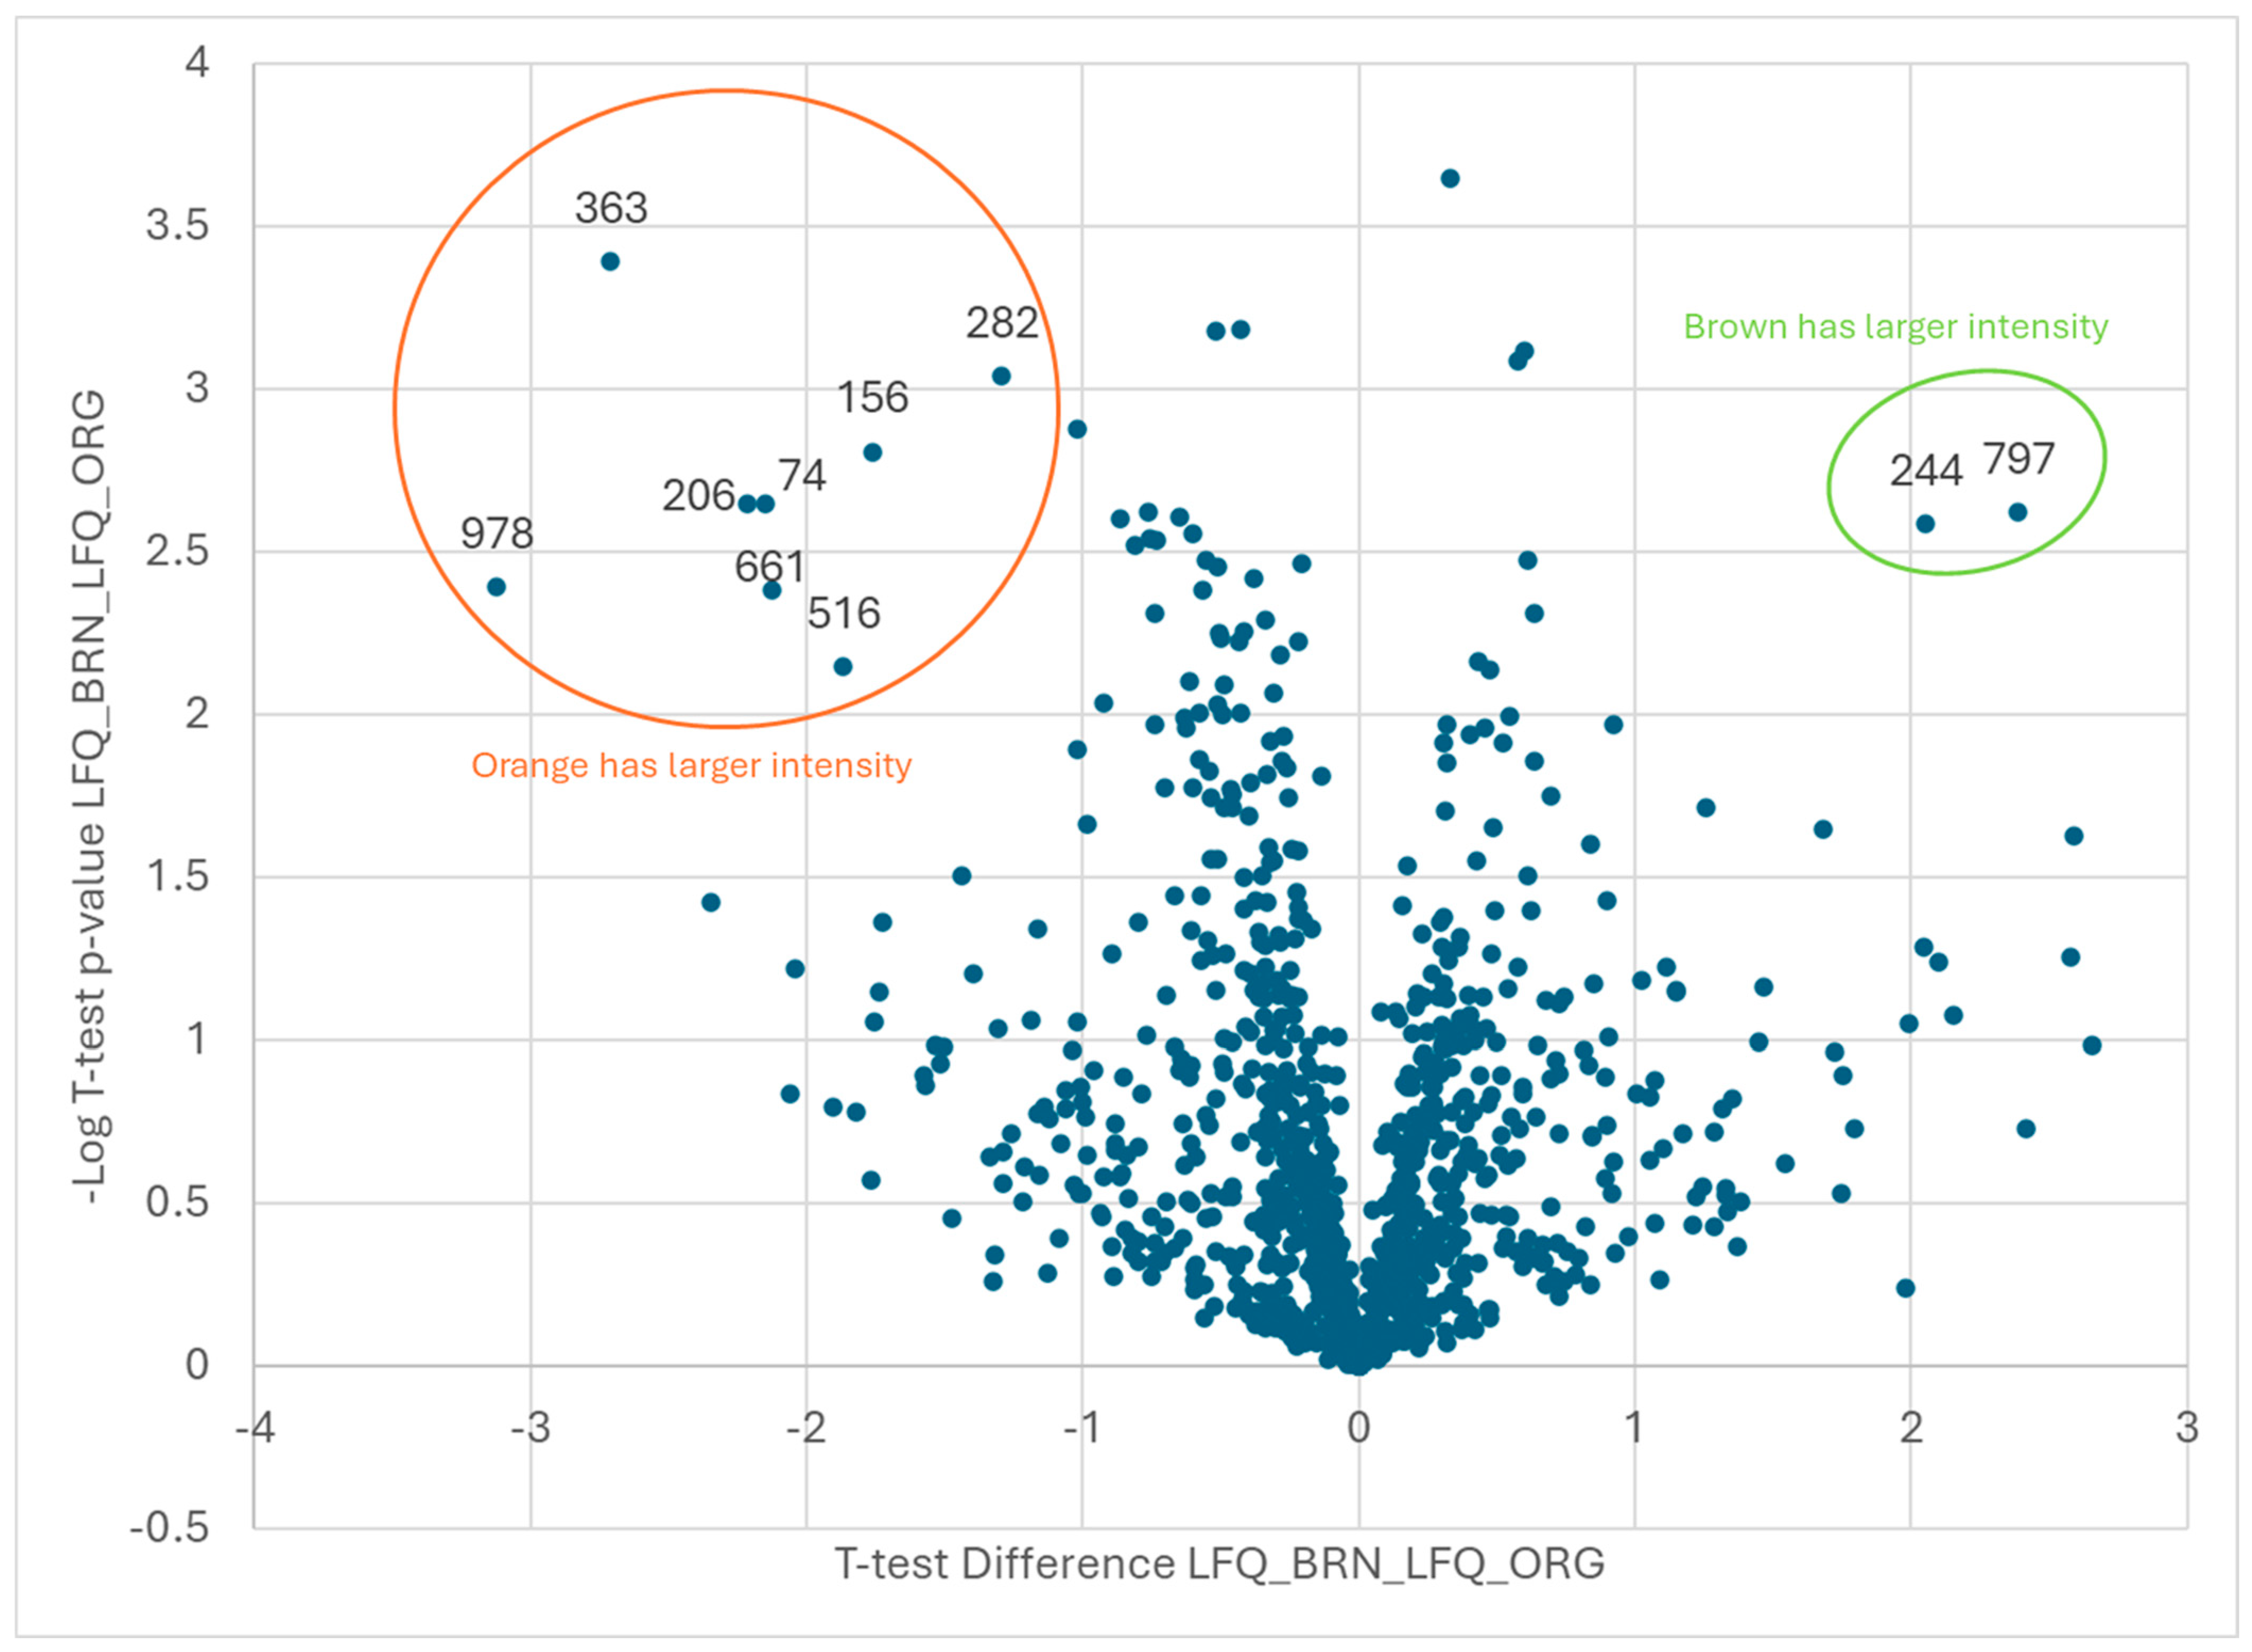
| Brown vs. Orange | |
|---|---|
| Orange | |
| Code | Protein ID |
| 74 | Arahy|NQP1ZX|Arahy.NQP1ZX1,4-alpha-glucan-branchingenzyme-like |
| 156 | Aradu|6W1XZ|Arahy.M043T11,4-alpha-glucan-branchingenzyme-like[Glycinemax] |
| 206 | Arahy|XGW13D|Arahy.XGW13Deukaryotictranslationinitiationfactor2gammasubunit |
| 282 | Araip|GQ1CY0|Arahy.GQ1CY0beta-galactosidase17 |
| 363 | Arahy|A863J5|Arahy.A863J5glutaminesynthetase2 |
| 516 | Arahy|MW1RK6|Arahy.MW1RK6WDrepeat-containingprotein5-like |
| 661 | Arahy|24C55C|Arahy.24C55CpyruvatedehydrogenaseE1beta |
| 978 | Araip|T59TA|Araip.T59TAreceptor-likeproteinkinase2 |
| Brown | |
| Code | Protein ID |
| 244 | Arahy|S6KYF2|Arahy.S6KYF2CAP(Cysteine-richsecretoryproteins |
| 797 | Arahy|EJRX2U|Arahy.EJRX2UProteinofunknownfunction(DUF1264) |
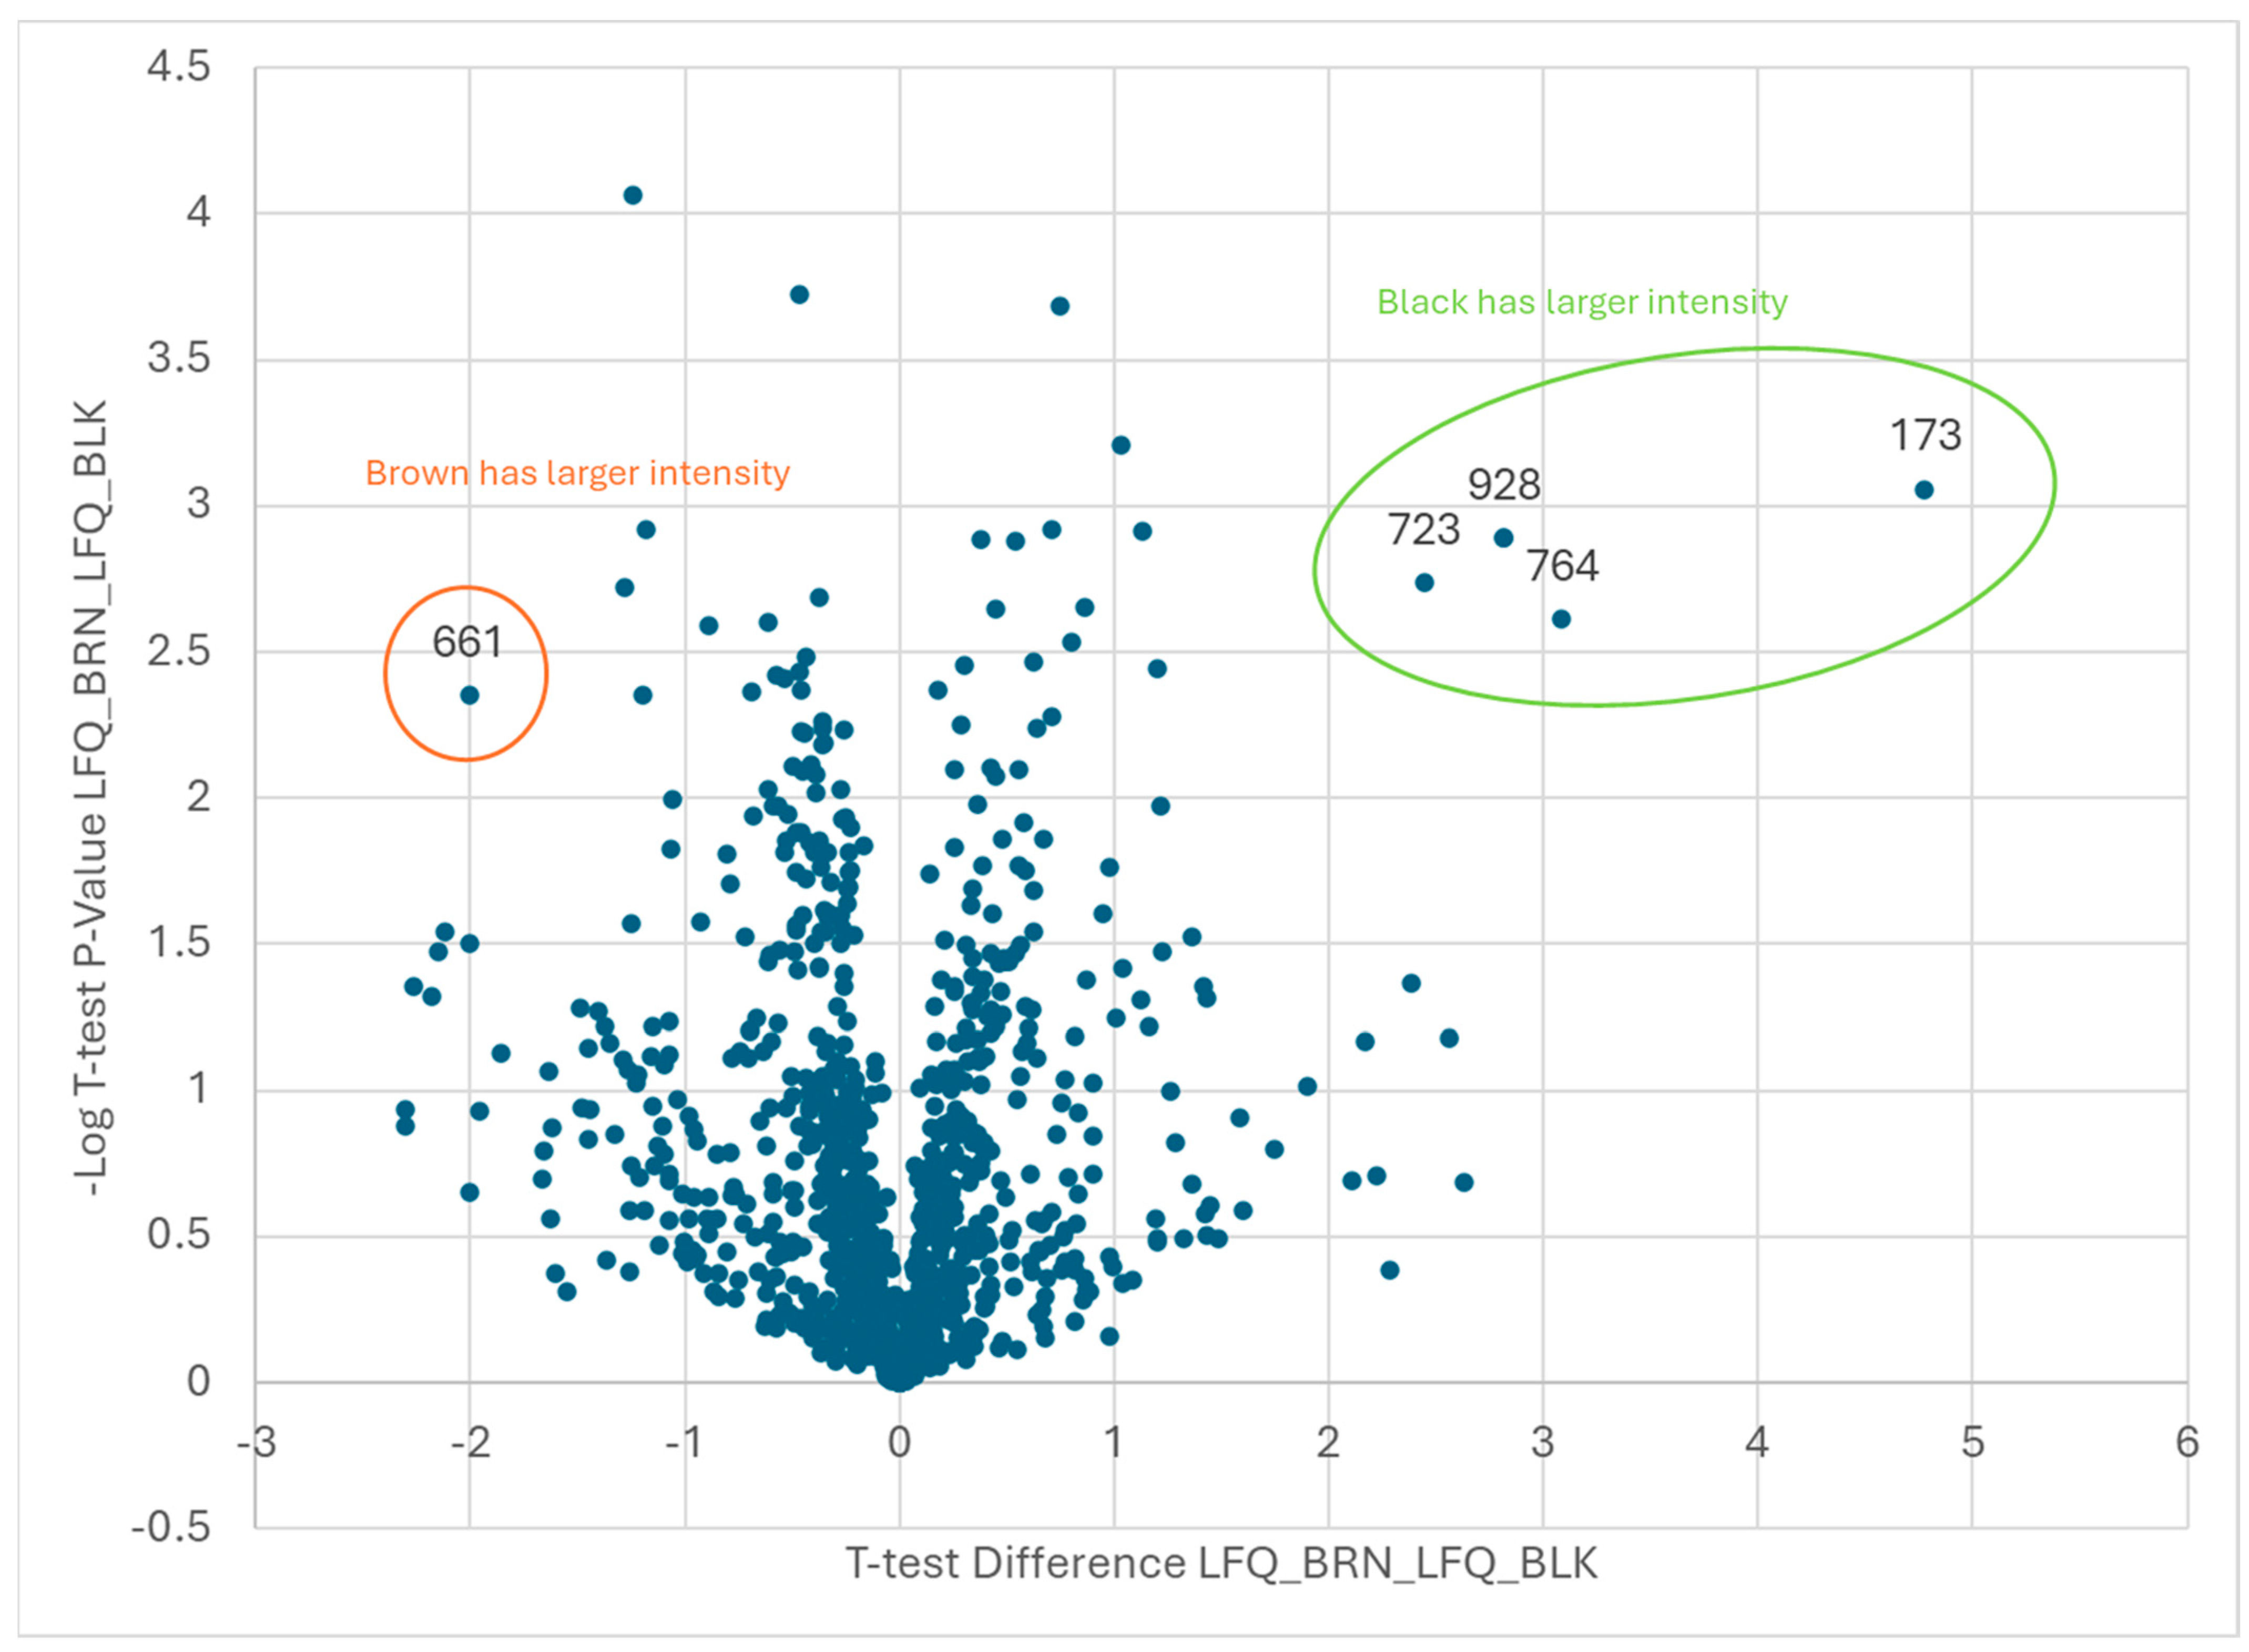
| Brown vs. Black | |
|---|---|
| Brown | |
| Code | Protein ID |
| 661 | Arahy|24C55C|Arahy.24C55CpyruvatedehydrogenaseE1beta |
| Black | |
| Code | Protein ID |
| 173 | Arahy|XZ8T7F|Arahy.XZ8T7Ftriosephosphateisomerase |
| 723 | Arahy|AUI3M2|Arahy.AUI3M2Pyridoxalphosphate-dependenttransferasessuperfamilyproteinisoform |
| 764 | Arahy|SN2AIN|Arahy.SN2AINRNA-bindingprotein1 |
| 928 | Arahy|L5T5KA|Arahy.L5T5KAheatshockprotein90.1 |
Disclaimer/Publisher’s Note: The statements, opinions and data contained in all publications are solely those of the individual author(s) and contributor(s) and not of MDPI and/or the editor(s). MDPI and/or the editor(s) disclaim responsibility for any injury to people or property resulting from any ideas, methods, instructions or products referred to in the content. |
© 2024 by the authors. Licensee MDPI, Basel, Switzerland. This article is an open access article distributed under the terms and conditions of the Creative Commons Attribution (CC BY) license (https://creativecommons.org/licenses/by/4.0/).
Share and Cite
Cherry, A.; Fisher, B.; Branch, W.; Peralta, C.; Gilliam, L.; Pahom, O.; Liebold, C.; Marshall, J. Proteomic Analysis of Arachis hypogaea Seeds from Different Maturity Classes. Plants 2024, 13, 1111. https://doi.org/10.3390/plants13081111
Cherry A, Fisher B, Branch W, Peralta C, Gilliam L, Pahom O, Liebold C, Marshall J. Proteomic Analysis of Arachis hypogaea Seeds from Different Maturity Classes. Plants. 2024; 13(8):1111. https://doi.org/10.3390/plants13081111
Chicago/Turabian StyleCherry, Ashley, Brian Fisher, William Branch, Christopher Peralta, Lissa Gilliam, Olga Pahom, Chris Liebold, and Julie Marshall. 2024. "Proteomic Analysis of Arachis hypogaea Seeds from Different Maturity Classes" Plants 13, no. 8: 1111. https://doi.org/10.3390/plants13081111