Article

Genome-Wide Identification, Characterization, and Expression Analysis of BES1 Family Genes in ‘Tieguanyin’ Tea Under Abiotic Stress

1
Metabolomics Center, Haixia Institute of Science and Technology, Fujian Agriculture and Forestry University, Fuzhou 350002, China
2
College of Jun Cao Science and Ecology (College of Carbon Neutrality), Fujian Agriculture and Forestry University, Fuzhou 350002, China
3
College of Future Technologies, Fujian Agriculture and Forestry University, Fuzhou 350002, China
4
College of Food Science, Fujian Agriculture and Forestry University, Fuzhou 350002, China
5
College of Computer and Information Sciences, Fujian Agriculture and Forestry University, Fuzhou 350002, China
6
College of Forestry, Fujian Agriculture and Forestry University, Fuzhou 350002, China
*
Authors to whom correspondence should be addressed.
Plants 2025, 14(3), 473; https://doi.org/10.3390/plants14030473
Submission received: 15 January 2025 / Revised: 31 January 2025 / Accepted: 4 February 2025 / Published: 5 February 2025
(This article belongs to the Special Issue Responses of Crops to Abiotic Stress)

Abstract

:
The BRI1-EMS-SUPPRESSOR 1 (BES1) family comprises plant-specific transcription factors, which are distinguished by atypical bHLH domains. Over the past two decades, genetic and biochemical studies have established that members of the BRI1-EMS-SUPPRESSOR 1 (BES1) family are crucial for regulating the expression of genes involved in brassinosteroid (BR) response in rapeseed. Due to the significance of the BES1 gene family, extensive research has been conducted to investigate its functional properties. This study presents a comprehensive identification and computational analysis of BES1 genes in ‘Tieguanyin’ (TGY) tea (Camellia sinensis). A total of 10 BES1 genes were initially identified in the TGY genome. Through phylogenetic tree analysis, this study uniquely revealed that CsBES1.2 and CsBES1.5 cluster with SlBES1.8 from Solanum lycopersicum, indicating their critical roles in fruit growth and development. Synteny analysis identified 20 syntenic genes, suggesting the conservation of their evolutionary functions. Analysis of the promoter regions revealed two types of light-responsive cis-elements, with CsBES1.4 exhibiting the highest number of light-related cis-elements (13), followed by CsBES1.9 and CsBES1.10. Additional validation via qRT-PCR experiments showed that CsBES1.9 and CsBES1.10 were significantly upregulated under light exposure, with CsBES1.10 reaching approximately six times the expression level of the control after 4 h. These results suggest that CsBES1.9 and CsBES1.4 could play crucial roles in responding to abiotic stress. This study offers novel insights into the functional roles of the BES1 gene family in ‘Tieguanyin’ tea and establishes a significant foundation for future research, especially in exploring the roles of these genes in response to abiotic stresses, such as light exposure.

1. Introduction

Brassinosteroids (BRs), a group of steroidal plant hormones, play a crucial role in regulating plant growth and numerous physiological functions. Maintaining appropriate BR levels is essential for proper root development and the overall growth of plants [1,2,3,4,5,6,7]. Brassinosteroids (BRs) were the sixth class of plant hormones to be discovered, following auxins, gibberellins, cytokinins, abscisic acid, and ethylene [8,9]. They promote cell elongation by stimulating hormone accumulation in meristematic tissues, thereby transitioning cells into elongation zones. In Arabidopsis thaliana, mutants deficient in brassinosteroids (BRs) exhibit traits such as dwarfism, impaired cell expansion, reduced apical dominance, delayed flowering and senescence, and male sterility [10,11]. Moreover, the BR signaling pathway interacts with various response networks to coordinate plant growth, development, and adaptation to abiotic stresses [8]. For details, please refer to Figure 1.
For instance, BRs negatively regulate the plant drought stress response via RESPONSIVE TO DESICCATION 26 (RD26) and interact with light, abscisic acid (ABA), and gibberellic acid (GA) signaling pathways through BES1 [2,12,13,14].
Transcription factors (TFs) regulate the expression of specific target genes in response to biotic and abiotic stresses, playing key roles in plant growth, development, and stress resistance. Through the activation of various defense mechanisms, they influence yield and quality [15,16]. BRI1-EMS-SUPPRESSOR 1 (BES1) and BRASSINAZOLE RESISTANT 1 (BZR1) are key transcription factors that directly mediate BR signaling [2,17,18,19,20]. BES1 and BZR1 exhibit significant sequence similarity and serve as crucial regulators in plant responses to stress [3,17,21,22,23,24,25]. Both function as activators of the BR signaling pathway [26]. Studies have shown that a conserved DNA-binding motif at the N-terminus of BES1-type proteins binds to E-box or BR response elements, thereby regulating the transcription of target genes [2,3,19,21]. In plant cells, when a brassinosteroid (BR) binds to the extracellular domain of the BR receptor BRI1, it activates the intracellular kinase activity of the receptor.
This activation triggers the release of BKI1 from the cell membrane and facilitates the interaction between BRI1 and BAK1, thereby transmitting BR signals into the cell [27,28]. In the cytoplasm, BR SIGNAL KINASE 1 (BSK1) activates BRI1 SUPPRESSOR 1 (BSU1) via a phosphorylation-dephosphorylation cascade. This process leads to the dephosphorylation and degradation of BR-INSENSITIVE 2 (BIN2), thus alleviating the inhibition of BES1 [29,30,31]. Additionally, BES1 undergoes dephosphorylation by PROTEIN PHOSPHATASE 2A (PP2A), which facilitates its accumulation in the nucleus and regulates downstream target genes [32,33]. In addition to mediating BR signaling, BES1/BZR1 integrates multiple plant hormone pathways, controlling tapetum development and various stress responses [34,35,36,37,38,39,40,41]. BES1 interacts with TFs such as phytochrome interacting factor 4 (PIF4), WRKY46, WRKY54, and WRKY70 to regulate cell expansion and enhance stress resistance [42,43].
A. thaliana contains eight members of the BES1 family, whereas other species, such as rapeseed (Brassica napus), cotton (Gossypium hirsutum), maize (Zea mays), tomato (Solanum lycopersicum), cabbage (Brassica oleracea), and cucumber (Cucumis sativus), possess varying numbers of BES1 homologs: 28, 22, 11, 9, 15, and 6, respectively [34,44,45,46,47,48,49]. BES1s are involved in cell growth [50], pollen development [51], plant immunity [52], and stress responses. For example, in cotton, the GhBES1 gene displays functional variability, influencing fiber development, plant morphology, and stress resistance [46]. The cotton variety ‘Xinluzao 17’ shows a rapid response to drought stress, which is regulated by BES1. In tomatoes, BES1 expression is significantly upregulated following salt stress at 6 and 24 h [47,53].
The tea plant, Camellia sinensis (L.) O. Kuntze, is native to southwestern China, where it has been grown and used for thousands of years [54]. Tea, the second most consumed beverage globally, is rich in amino acids, vitamins, minerals, tea polyphenols, and alkaloids [55]. It is renowned for its health benefits, including its antioxidant, anti-tumor, and cardiovascular properties [56,57,58]. Environmental conditions significantly affect the growth of tea plants, with factors such as extreme temperatures, drought, and light stress playing critical roles in their natural habitats [59]. Among these factors, light is a crucial environmental factor influencing various economic traits, including leaf size, shoot weight, harvest duration, and the synthesis of health-promoting compounds [60,61,62]. Previous research has demonstrated that BES1/BZR1 is essential for regulating light signaling in plant development [63].
Its phosphorylation status and stability are regulated by light signals, with dephosphorylation enhancing activity in the dark and phosphorylation by BIN2 keeping it in an inactive state under light [64]. The increasing frequency of extreme weather events, including high temperatures and droughts, exacerbated by global climate change, has caused significant damage to tea production. To improve both the yield and quality of tea, understanding the mechanisms underlying plants’ tolerance to environmental stress is essential. Therefore, investigating the molecular mechanisms by which BES1 responds to light and dark stress is vital for optimizing the growth and development of tea plants.
Among oolong teas, ‘Tieguanyin’ (TGY) is notable for its high concentration of nutritional and medicinal compounds. However, research on the BES1 gene family in TGY is still limited. Few studies have investigated changes in BES1 expression under light stress, despite its growing significance in the context of environmental challenges. This study systematically identified the BES1 gene family in TGY through bioinformatics, analyzing its physicochemical properties, evolutionary relationships, gene architecture, conserved domains, and intraspecies/interspecies variation. The expression profile of the CsBES1 gene was analyzed to provide insights into its role in adapting TGY tea to environmental stresses, improving quality, increasing yield, and developing stress-resistant crops in the face of global climate change.

2. Results

2.1. Identification and Characterization of CsBES1 Genes

The amino acid sequences of ten members of the CsBES1 family were predicted and labeled as CsBES1.1 to CsBES1.10 (details provided in Table 1). The size of the protein is generally positively correlated with the length of the amino acid sequence. Within the CsBES1 family, the number of amino acids varies significantly, ranging from 315 in CsBES1.5 to 699 in CsBES1.6. The molecular weight of these proteins ranges from 34,258.36 kDa (CsBES1.9) to 78,007.57 kDa (CsBES1.6), while their theoretical isoelectric points (pI) range from 5.37 (CsBES1.6) to 10.02 (CsBES1.1), with an average of 8.17. Variations in pI suggest that CsBES1 proteins function in diverse microenvironments.
All ten CsBES1 proteins exhibited negative hydrophilicity, classifying them as hydrophilic proteins. The lipid solubility indices of these proteins ranged from 37.02 (CsBES1.5) to 81.82 (CsBES1.3), with four proteins exhibiting indices above 70, suggesting heat stability. Proteins with instability coefficients below 40 are typically considered stable, whereas those with coefficients above 40 are classified as unstable. Among the ten CsBES1 family members, only CsBES1.5 and CsBES1.6 had instability coefficients below 40, indicating that they are stable proteins. The remaining members were predicted to be unstable.
Subcellular localization analysis also revealed that approximately nine CsBES1 proteins are localized in the nucleus. Notably, CsBES1.5 was the only member predicted to be localized in the chloroplast, emphasizing potential functional diversity within the family.

2.2. The Motif, Domain, and Gene Structure of CsBES1 Family

Gene structure is a key characteristic of gene families, offering valuable insights into their evolutionary history [65]. Conserved protein domains, characterized by high sequence similarity, provide essential insights into evolutionary relationships [66]. To explore the evolutionary relationships within the BES1 family, 10 conserved protein motifs and their structures were analyzed. Using MEME, 10 conserved motifs were identified among the 10 BES1 proteins (Figure 2). Most family members cluster within the same branch and share similar motif and domain structures, although notable diversity exists among CsBES1 proteins. Nearly all CsBES1 proteins contain motif 1, the most highly conserved motif across the family, emphasizing its potential functional significance. The widespread presence of motif 1 suggests a critical role in fundamental biological activities, possibly involving DNA binding or protein–protein interactions.
With the exception of CsBES1.2 and CsBES1.1, all proteins contain motif 2, indicating its relatively conserved nature. Notably, CsBES1.6 and CsBES1.10 both possess motifs 1, 2, 7, 9, and 8, while CsBES1.7 and CsBES1.8 share motifs 1, 2, 3, 4, 10, and 5, suggesting potential functional similarities. These proteins may regulate similar sets of genes or biological processes. Additionally, conserved domains were identified across all CsBES1 proteins, further supporting a high degree of conservation. This finding highlights the need for further exploration of their diverse biological functions.
Exon–intron structure analysis revealed a total of 10 genes. Notably, CsBES1.2 and CsBES1.5 lack non-coding regions, which are crucial for regulating mRNA stability and gene expression. Interestingly, CsBES1 members within the same group exhibit minimal variation in exon and intron number and length, reinforcing the functional conservation of BES1 genes within these groups.

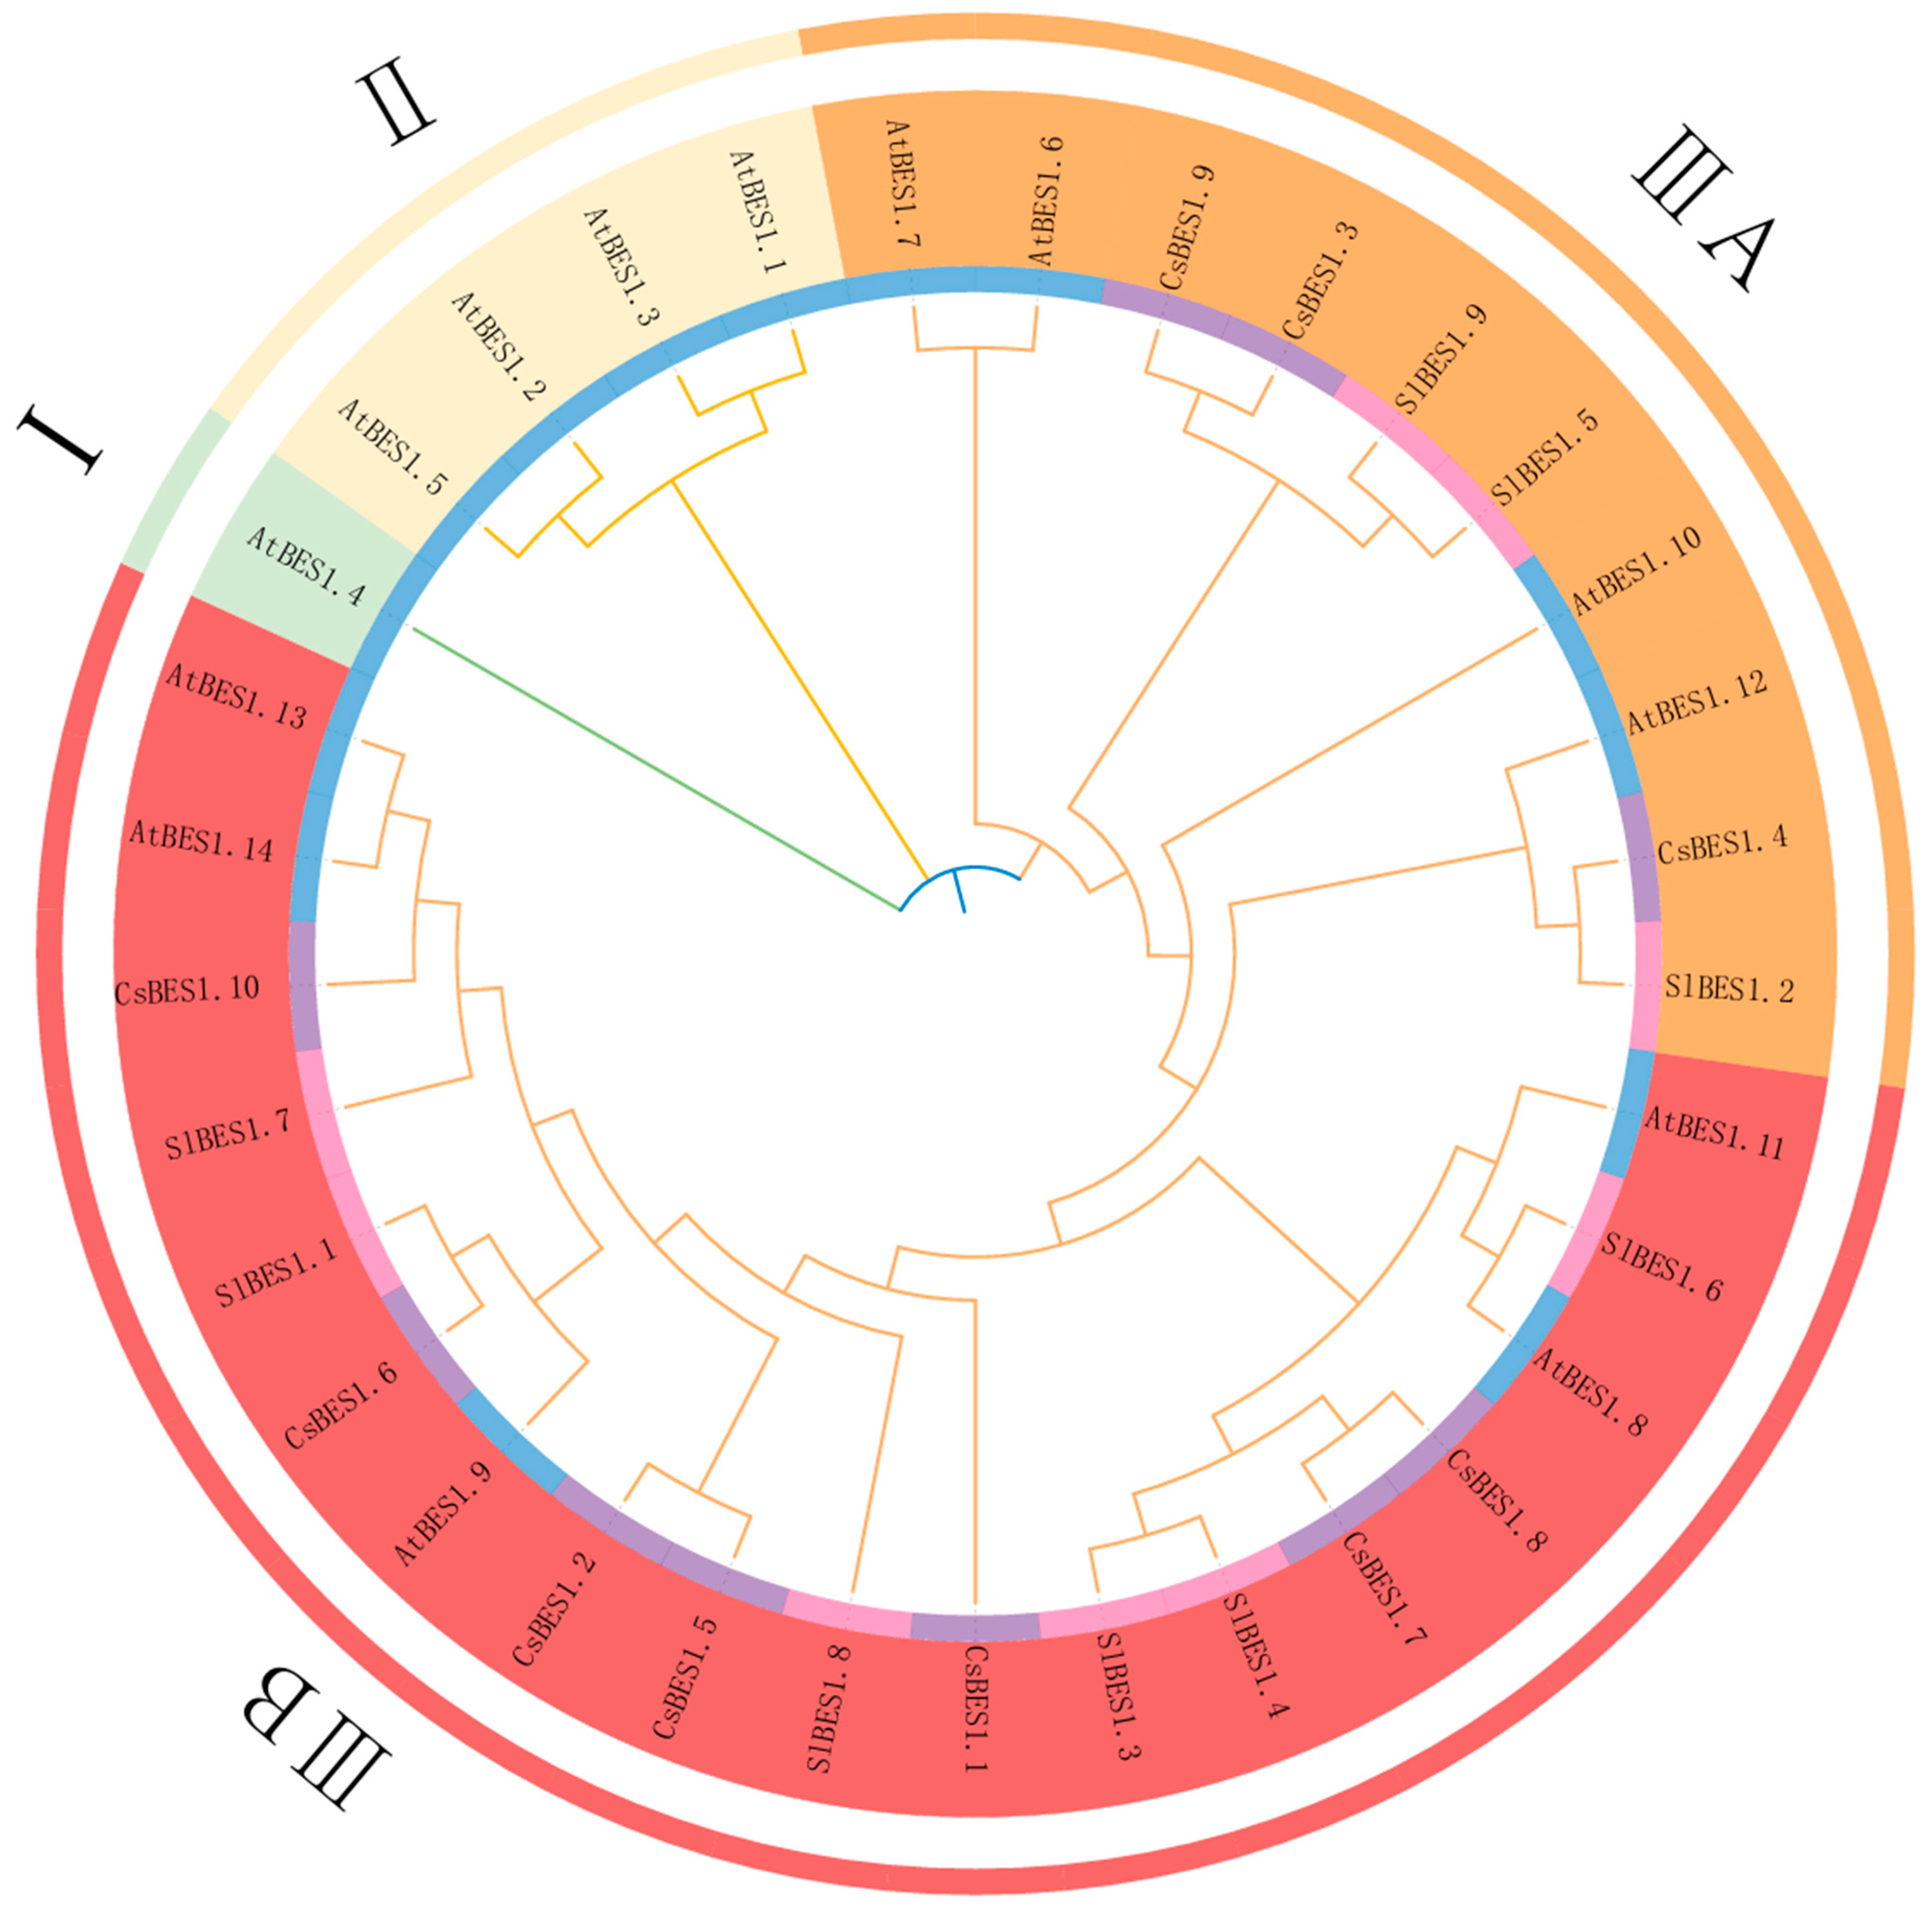
2.3. Phylogenetic Analysis of CsBES1s

The phylogenetic tree illustrates the evolutionary relationships among members of the CsBES1 gene family and their counterparts in other species. To further explore these relationships, a multiple sequence alignment and a maximum likelihood phylogenetic tree were constructed, with Arabidopsis and Solanum lycopersicum as reference species. The CsBES1 family in TGY comprises 10 members, while A. thaliana and S. lycopersicum have 14 and 9 members, respectively, yielding a total of 33 members, which are classified into four groups (I–IIIB) based on the grouping in A. thaliana (Figure 3). The distribution of CsBES1 genes among these groups is uneven. Group IIIB contains the majority of CsBES1 members (CsBES1.1, CsBES1.2, CsBES1.5, CsBES1.6, CsBES1.7, CsBES1.8, and CsBES1.10), whereas Group IIIA includes three members (CsBES1.3, CsBES1.4, and CsBES1.9). Groups I and II consist only of BES1 genes from A. thaliana, suggesting that BES1 in TGY underwent expansion after the divergence of monocots and retains conserved features.
Martin’s analysis suggests that BES1 genes originated during the bryophyte stage of biological evolution and further evolved after the phytoplankton stage [67]. Within Group IIIB, SlBES1.1 and CsBES1.6, as well as SlBES1.7 and CsBES1.10, form direct homologous relationships. Similarly, CsBES1.2 and CsBES1.5 cluster with SlBES1.8. Notably, SlBES1.8 plays a critical role in fruit setting and development in S. lycopersicum, with its activity being induced by auxin and gibberellin [19]. Since CsBES1.1 is a direct homolog of SlBES1.8, it is plausible to hypothesize that CsBES1.1 may play a similar role in TGY tea development. Further analysis revealed that CsBES1.10 clusters with AtBES1.13 and AtBES1.14, while CsBES1.6 and AtBES1.9 are orthologous pairs, potentially involved in similar regulatory pathways.

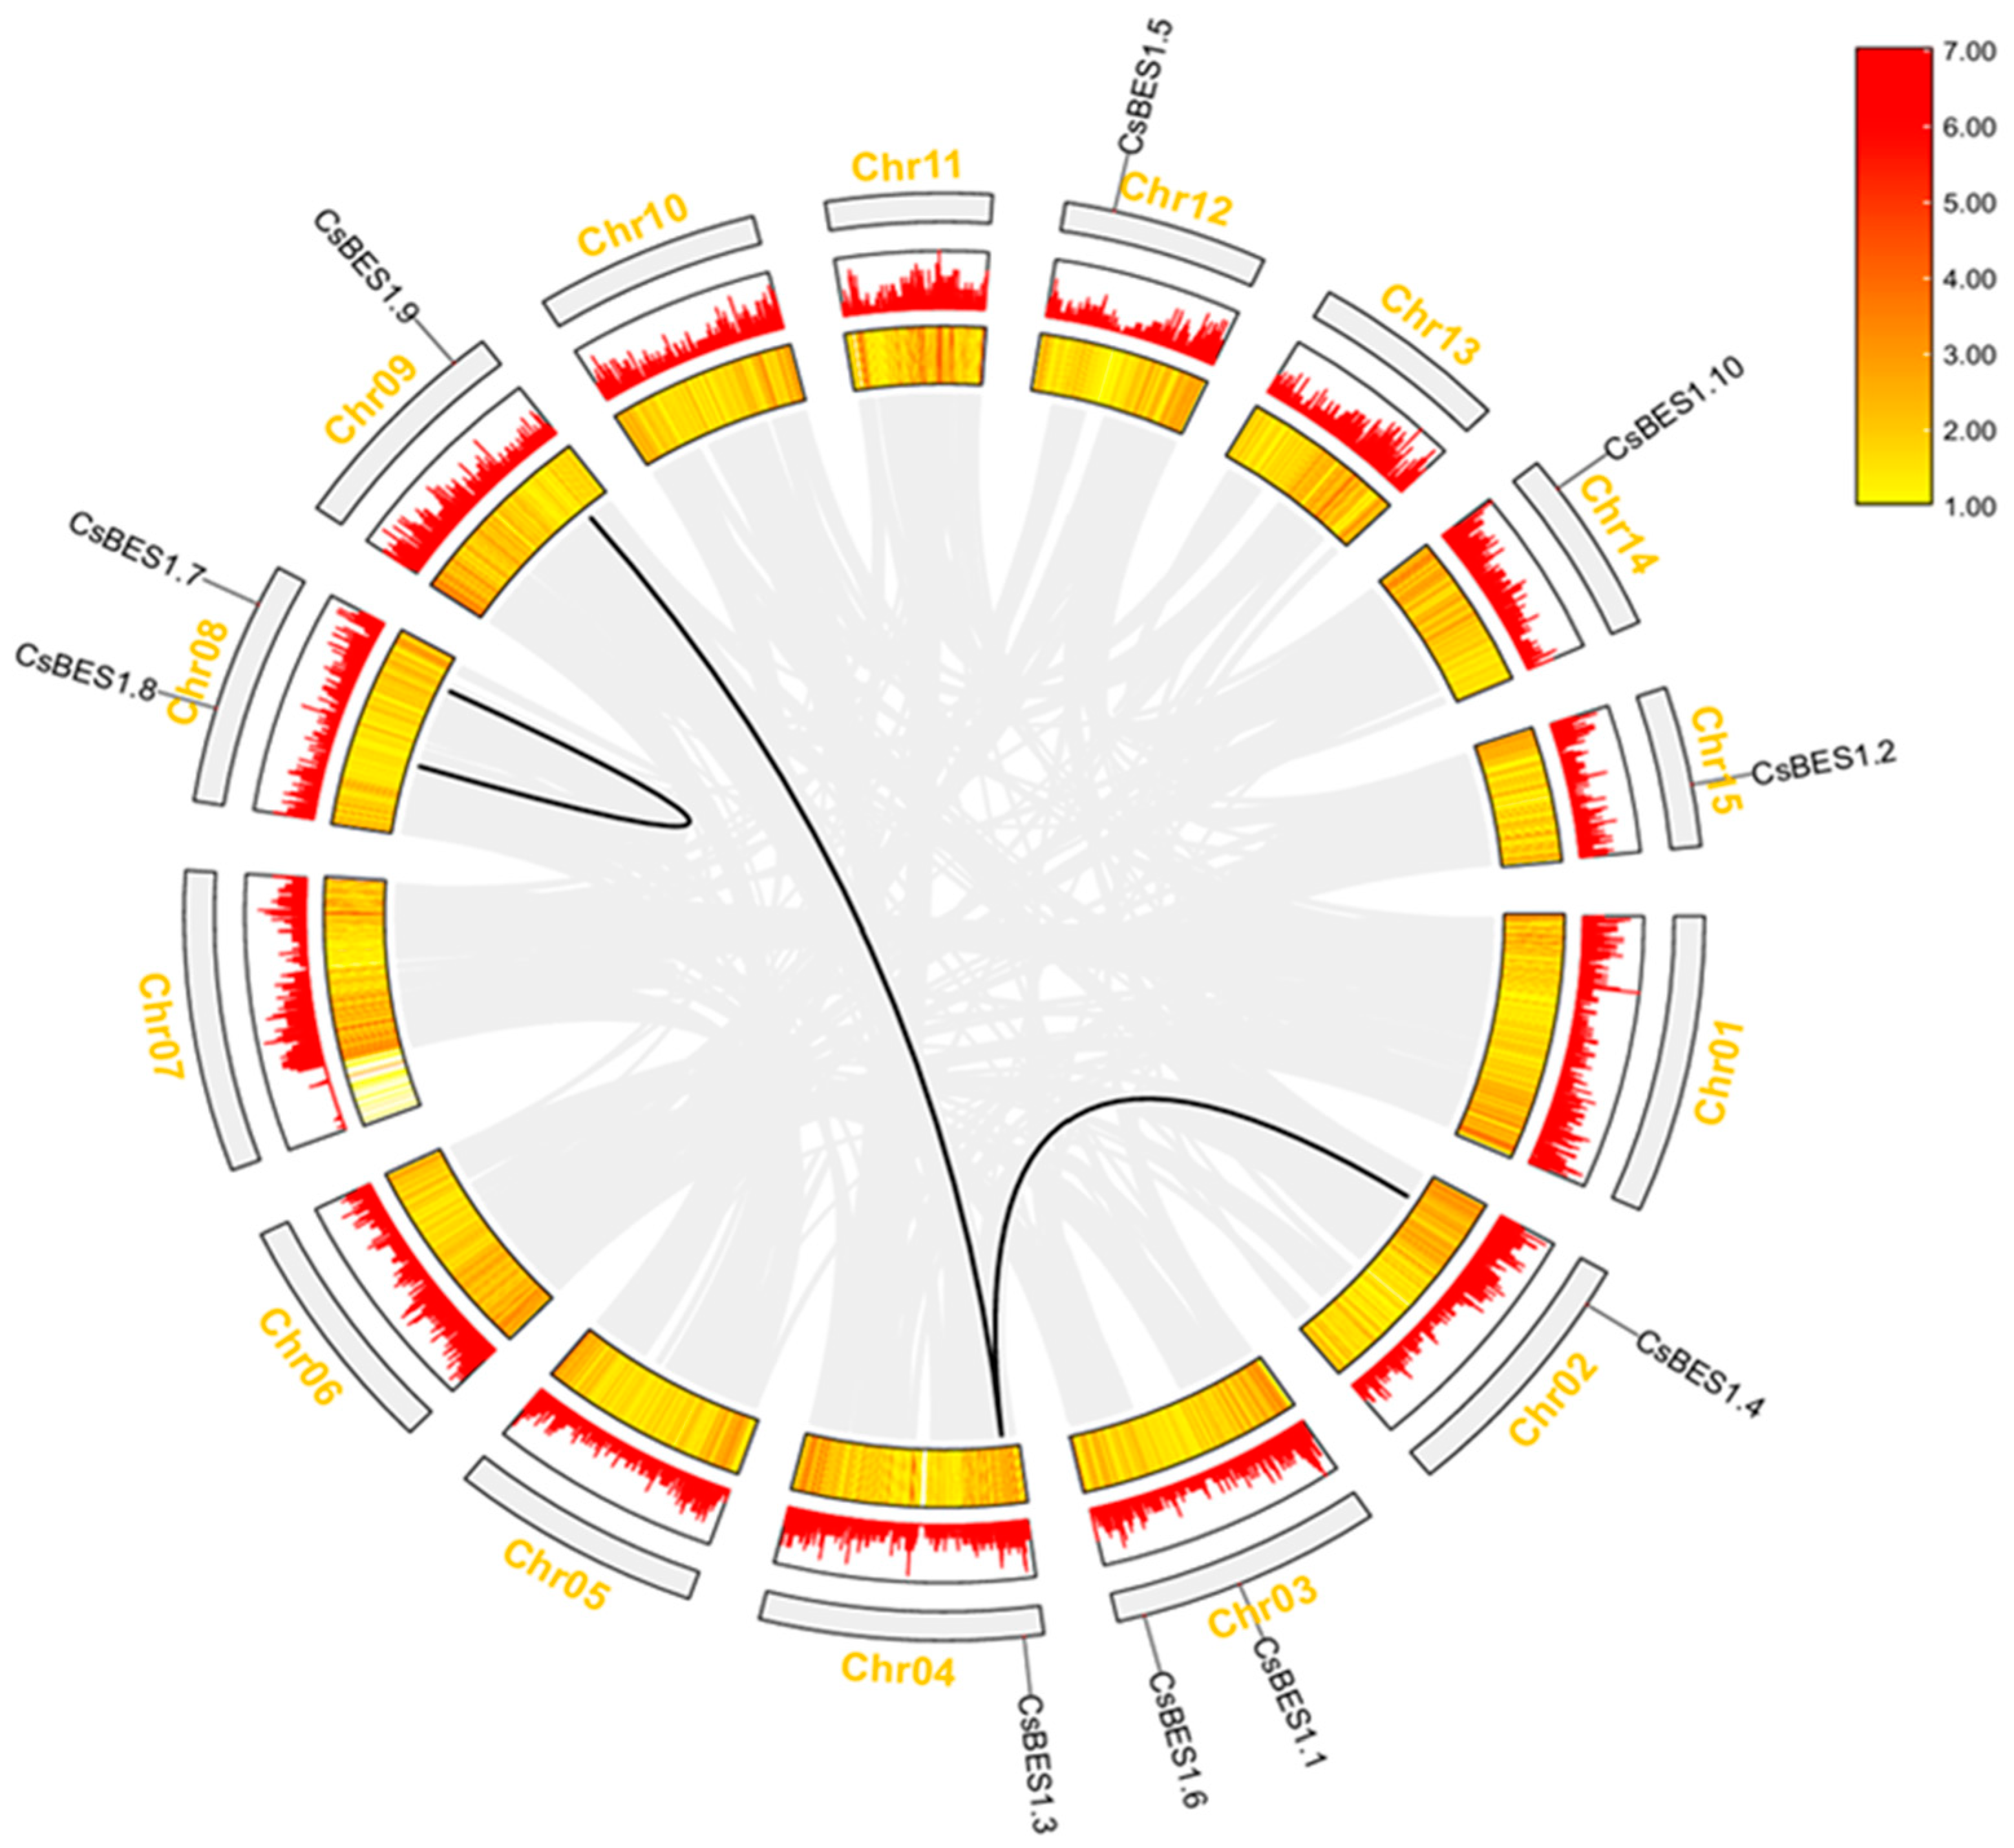
2.4. Chromosome Distribution of CsBES1s and Genomic Amplification in TGY

TGY tea has a total of 12 chromosomes, with 10 CsBES1 genes distributed across 8 of them. Chromosomes 8 and 3 contain the highest number of CsBES1 members, as shown in Figure 4. Specifically, CsBES1.7 and CsBES1.8 are located on chromosome 8, while CsBES1.1 and CsBES1.6 are found on chromosome 3. The remaining CsBES1 genes are distributed singly across chromosomes 9 (CsBES1.9), 12 (CsBES1.5), 14 (CsBES1.10), 15 (CsBES1.2), 2 (CsBES1.4), and 4 (CsBES1.3). This uneven distribution pattern likely reflects genetic variations that occurred during evolution. The collinear model provides valuable insights into the evolutionary history of the genome and facilitates subsequent correlation analyses [68]. Notably, three pairs of collinear genes were identified: one tandem duplication (CsBES1.7 and CsBES1.8) and two segmental duplications (CsBES1.9 and CsBES1.3, CsBES1.4 and CsBES1.3).
Gene duplications, whether tandem (within a 200 kb region) or segmental (between different chromosomes), are crucial drivers of evolutionary innovation and functional diversification [41,69,70]. To gain deeper insights into the evolution of the BES1 gene family, interspecific and intraspecific collinearity analyses were conducted (Figure 5). For interspecific analysis, A. thaliana, S. lycopersicum, and TGY were selected as study subjects to examine the consistency of their gene sequences. The results revealed 10 collinear gene pairs between TGY and each of the other two species, with chromosome 8 in TGY exhibiting the highest number of collinear pairs. Specifically, TGY shares 4 collinear pairs with S. lycopersicum and 2 pairs with A. thaliana. Across the three species, a total of 20 collinear genes were identified, suggesting conserved evolutionary roles.

2.5. Cis-Regulatory Element Prediction of Promoters in 10 CsBES1 Genes

Transcription factors (TFs) mainly exert their regulatory function by binding to specific cis-acting elements found in the promoter regions of target genes. This interaction regulates gene expression and influences the expression patterns of downstream genes [71]. In this study, the 2.0 kb promoter sequences of CsBES1 genes were analyzed using the PlantCARE online software, which identified several cis-acting elements [72]. Based on their functional characteristics, these elements were categorized into four groups (Figure 6): hormonal response, stress signaling, light signaling, and growth and development.
The CsBES1 genes showed significant correlations with hormone response elements, particularly ABA response elements (ABRE), salicylic acid response elements (SARE), methyl jasmonate (MeJA) response elements, gibberellin response elements (GBRE), and auxin response elements (AuxRE). This indicates a possible link between the CsBES1 gene family and the signaling pathways of ABA and growth hormones, which is consistent with prior studies [14,73]. Additionally, these genes respond to various external stressors, including drought (e.g., MYB-1, MYBHv1, and other drought-related factors), low temperature (LTR), wounding and defense (WUN), and hypoxia (ARE). Nearly all CsBES1 genes contain MYB-like transcription factor binding sites, which are strongly associated with drought response. MYB-like TFs are critical for regulating abiotic stress responses, especially drought stress [74]. These findings underscore the significant role of the CsBES1 gene family in enhancing plant resistance to drought stress.
Notably, two types of light-responsive cis-elements were detected, making them the most common cis-elements in the CsBES1 promoter regions. CsBES1.4 was found to contain 13 light-related cis-elements, the highest among all family members. CsBES1.9 and CsBES1.10 were found to contain 12 light-related cis-elements. In addition, CsBES1.2, CsBES1.7, and CsBES1.8 have only one photo-responsive homeostatic element. Several CsBES1 genes contain cis-elements that are associated with various aspects of plant growth and development. These include elements linked to mesophyll expression (MREs), components involved in zein metabolism, regulatory elements for circadian rhythm (Circadian), and those specific to endosperm expression. Genes such as CsBES1.3, CsBES1.4, CsBES1.5, CsBES1.6, and CsBES1.7, which contain diverse regulatory elements, are likely to play critical roles in responding to abiotic stresses. These family members merit further investigation.

2.6. Gene Ontology (GO) and KEGG Analysis in CsBES1

In order to gain deeper insights into the functions of CsBES1 genes, a Gene Ontology (GO) enrichment analysis was performed (Figure 7A). This analysis covered three main categories: molecular function, cellular components, and biological processes. This analysis provides valuable insights and a foundation for future exploration of the functions and mechanisms of CsBES1 genes. Notably, CsBES1 genes may interact with DNA-binding TF activity and transcription regulator activity. Furthermore, these genes are predominantly localized in the nucleus, aligning with subcellular localization predictions. Additionally, CsBES1 genes collectively contribute to the biosynthesis of various secondary metabolites and participate in plant hormone signaling pathways (Figure 7B).

2.7. Protein–Protein Interaction Network of CsBES1 Proteins

Alignment of CsBES1 genes with AtBES1 genes identified ten homologous genes, offering insights into potential functional interactions between CsBES1-encoded proteins and other key regulatory proteins. This understanding establishes a foundation for future functional validation and mechanistic studies. The interaction network of CsBES1 proteins was constructed using STRING and refined in Cytoscape (Figure 8). BES1, a plant-specific TF, is a critical regulator of plant embryonic development. Homologous proteins BEH1, BEH2, BEH3, and BEH4 function alongside BES1 to regulate plant growth and development by modulating downstream gene expression [75]. In the interaction network, BES1 serves as a central node, linking with other proteins to form a complex signal transduction network. It acts as a downstream TF in the TPD1-SERK1 signaling pathway, which regulates tapetum development and plays a vital role in plant reproduction [17].
BES1 is also predicted to interact with additional signaling components, including CYP90B1, SAUR15, ASK7, and BKI1; this process plays a crucial role in controlling and influencing the growth and development of plants. Furthermore, the probable interactions of BES1 with SAUR15, ASK7, BKI1, and SCRM suggest a role for CsBES1 in helping plants cope with abiotic stress [76,77]. CYP90B1, indirectly associated with BES1, is an enzyme from the cytochrome P450 family involved in diverse metabolic processes, highlighting its potential role in growth and development [78]. A deep understanding of the functional interactions between CsBES1 proteins and essential regulatory proteins establishes a solid basis for subsequent investigations into their roles and mechanisms.

2.8. Expression Patterns of CsBES1 Genes in Response to Dark and Light Treatments

Earlier research has thoroughly investigated the fundamental roles of the BES1 gene family in response to abiotic stress. In the present study, we examined the expression profiles of eight CsBES1 genes, categorized into four subgroups (I–IIIB), under two different abiotic stress conditions using quantitative real-time PCR (qRT-PCR). Stress treatments included light exposure (continuous 1200 µmol∙m−2∙s−1) and darkness. And the TmThe expression patterns of CsBES1 genes exhibited similar responses to abiotic stresses, with some genes showing significant upregulation or downregulation under specific conditions (Figure 9).
Under dark treatment, CsBES1.2, CsBES1.3, CsBES1.4, CsBES1.7, and CsBES1.8 displayed significant downregulation after four hours of treatment. Notably, CsBES1.4, CsBES1.7, and CsBES1.8 showed pronounced downregulation (p < 0.0001), reaching their lowest expression levels after 12 h. Subsequently, their expression levels began to increase as the duration of dark treatment was prolonged. In contrast, CsBES1.9 and CsBES1.10 exhibited upregulation after 12 h, with CsBES1.9 demonstrating a three-fold increase compared to the control group, suggesting that CsBES1.9 may be particularly sensitive to light reduction. However, the underlying regulatory mechanism remains unclear and requires further investigation.
Under light exposure, CsBES1.9 and CsBES1.10 showed significant upregulation, with CsBES1.10 reaching approximately six-fold the control expression level after four hours. After eight hours, the expression of all genes was inhibited except for CsBES1.9, which continued to upregulate and peaked at 12 h. Conversely, the expression of CsBES1.2 and CsBES1.7 became nearly undetectable. Notably, CsBES1.9 exhibited significant upregulation after 12 h of both darkness and light exposure (p < 0.0005), while CsBES1.4 showed significant downregulation under both conditions after 12 h (p < 0.0001). These findings suggest that CsBES1.9 and CsBES1.4 may have critical roles in responding to abiotic stress. Furthermore, it is speculated that responses to light and dark stress in ferroptosis are primarily regulated by a few specific CsBES1 genes.

3. Discussion

Tea, as a perennial woody plant, is widely distributed and exhibits significant resource diversity. Over its evolutionary history, the tea plant has developed specialized mechanisms to adapt to environmental changes. One critical area requiring further investigation is the molecular mechanism by which CsBES1 regulates the tea plant’s resistance to light stress. BES1 family members are widely distributed across plants and are essential for regulating BR signaling pathways. These proteins are involved in various processes, including responses to abiotic stress, cell proliferation and differentiation, seed germination, trichome cell degradation, and pollen development. This study identified 10 BES1 genes using bioinformatics methods, fewer than the 14 identified in Populus tomentosa [41], but more than the 6 identified in rice [79], and comparable to the counts in grape (8) [80] and Machilus nanmu (9) [81].
Analysis of the physicochemical properties of CsBES1 revealed that it is an unstable, hydrophilic protein capable of functioning in mildly acidic and alkaline environments. Consistent with these findings, the subcellular localization of AtBES1 has been observed in both the nucleus and cytoplasm [26,34]. Similarly, in our investigation, we found that the 10 genes are distributed across the nucleus and cytoplasm (Table 1), suggesting that TGY BES1 proteins participate in phosphorylation-regulated processes.
To explore the evolutionary relationships among Arabidopsis thaliana, Solanum lycopersicum, and TGY, we constructed a phylogenetic tree for the CsBES1 protein family. This analysis revealed that the 33 BES1 proteins are classified into four subgroups, with the majority of CsBES1 genes residing in subgroup IIIB (Figure 3). Previous studies have shown that changes in gene family size can lead to beneficial, harmful, or neutral outcomes and that variations in gene family numbers significantly influence species specificity [79]. Our findings align with this, demonstrating that the phylogenetic relationships of BES1 genes differ among species.
Additionally, SlBES1.8, a key regulator of fruit setting and development in S. lycopersicum is induced by auxin and gibberellin [19]. Since CsBES1.1 is a direct homolog of SlBES1.8 in subgroup IIIB, it is plausible that CsBES1.1 also contributes to TGY development. Interestingly, motif analysis (Figure 2) reveals that CsBES1.1 is approximately 25 kb in length, making it the longest gene in this family. Given the established relationship between gene structure and function [80], further investigation into CsBES1.1 is of significant scientific interest. Furthermore, CsBES1.2 and CsBES1.5 cluster with SlBES1.8, suggesting their potential involvement in related regulatory processes. It is also noteworthy that BES1 genes in Class I and II groups are exclusively found in Arabidopsis thaliana, indicating that BES1 genes in TGY may have undergone expansion following the divergence of monocots.
Martin’s analysis suggests that BES1 first appeared in bryophytes and evolved further after phytoplankton [67]. Previous studies have shown that AtBZR1 plays a redundant role in plant growth and development by facilitating BR-induced growth while providing feedback inhibition on BR biosynthesis [81,82]. In contrast, AtBES1 is involved in glucosinolate biosynthesis via BR signaling [26]. Our study identified that CsBES1.10 clusters with AtBES1.13-14, while CsBES1.6 forms an orthologous gene pair with AtBES1.9, both potentially involved in related regulatory processes.
To further investigate the evolution of the BES1 gene family, we performed both inter- and intra-species synteny analyses, which revealed 20 pairs of syntenic genes across the three species, underscoring their conserved evolutionary significance.
Gene families mainly arise through six distinct mechanisms: whole-genome duplication, tandem duplication, segmental duplication, insertion of retrotransposons, exon duplication, and reshuffling [69]. The expansion of the CsBES1 gene family primarily occurs through fragment replication events, which represent its primary evolutionary mechanism. Similarly, the BES1 gene family in wheat expands through segmental duplication [83]. In species such as A. thaliana, cabbage, rice, and apple, segmental duplications are predominantly observed among homologous BES1 paralogous genes, aligning with our findings in TGY [84,85]. These results underscore the importance of segmental duplication in the amplification of CsBES1 genes and highlight the gene family’s critical role in understanding TGY’s biological evolution.
Introns are crucial in plant evolution [86]. Exon-intron structure analysis further revealed that CsBES1.2 and CsBES1.5 lack non-coding regions, which are crucial for regulating mRNA stability and gene expression. A phylogenetic tree constructed for the BES1 gene family indicated a clear evolutionary relationship between CsBES1 genes in ‘Tieguanyin’ tea, Arabidopsis thaliana, and Solanum lycopersicum. Specifically, CsBES1.2 and CsBES1.5 clustered with SlBES1.8 from tomato, which is known to play a key role in fruit set and development in tomato and is induced by auxin and gibberellin. This suggests that CsBES1.1, as a direct homolog of SlBES1.8, may play a similar role in the development of ‘Tieguanyin’ tea. Furthermore, CsBES1.10 clustered with AtBES1.13 and AtBES1.14 from Arabidopsis, while CsBES1.6 is homologous to AtBES1.9, possibly participating in similar regulatory pathways.
Exon–intron analysis identified 10 CsBES1 genes, with CsBES1.6, CsBES1.10, CsBES1.7, and CsBES1.8 showing conserved motifs and similar structures. Phylogenetic analysis supports these findings. CsBES1.2 and CsBES1.5 lack non-coding regions, unlike the grape BES1 family [87], which includes regulatory non-coding regions affecting mRNA stability and gene expression. Most CsBES1 proteins contain motif 1, the most conserved. These results highlight the importance of motifs 1 and 2 in the CsBES1 gene family.
To further investigate the potential role of the BES1 gene family in environmental responses, we analyzed the light-responsive cis-acting elements in the promoter regions of CsBES1 genes. Cis-acting elements, which play a crucial role in the initiation of genes and the regulation of transcription, are found within the promoters [88]. The BES1 gene family plays a critical role in various stress responses [13,42,89,90]. The results showed that CsBES1.4 contains the highest number of light-related cis-acting elements (13), followed by CsBES1.9 and CsBES1.10. QRT-PCR analysis revealed that under light conditions, the expression of CsBES1.9 and CsBES1.10 was significantly upregulated, with CsBES1.10 reaching six times the control group’s expression level after 4 h. After 8 h, all genes except CsBES1.9 showed suppressed expression, while CsBES1.9 continued to increase and peaked at 12 h. In contrast, the expression of CsBES1.2 and CsBES1.7 was nearly undetectable. Notably, CsBES1.9 exhibited significant upregulation after 12 h of both dark and light exposure (p < 0.0005), while CsBES1.4 showed significant downregulation under both conditions (p < 0.0001). These results suggest that CsBES1.9 and CsBES1.4 may play key roles in responding to abiotic stress.
Using A. thaliana as a model, we predicted a protein–protein interaction network. As a key downstream TF in the TPD1-SERK1 signaling pathway, BES1 plays an essential role in regulating tapetum layer development, thereby influencing plant reproduction. Building on previous findings, we identified eight CsBES1 homologous genes and analyzed their expression patterns under different light conditions. Quantitative real-time polymerase chain reaction (qRT-PCR) analysis revealed that the upregulation of CsBES1.9 and CsBES1.10 under light exposure, along with the downregulation of CsBES1.4, CsBES1.7, and CsBES1.8 under dark conditions, highlights the differential regulation of these genes in response to light and dark stress. It is speculated that the genes containing the most light-responsive cis-elements (CsBES1.4, CsBES1.9, and CsBES1.10) play critical roles in regulating light stress responses and ferroptosis processes in plants. These results suggest that these genes may play pivotal roles in responding to light variations and adapting to environmental stress.
BES1/BZR1 plays a central role in regulating light signaling during plant morphogenesis, with its phosphorylation status and stability modulated by light signals [63]. Previous studies have shown that under dark stress, the protein levels of SINATs decrease, leading to the activation of COP1 [91]. Simultaneously, inactive CRY1 fails to interact with dephosphorylated BES1, resulting in elevated levels of dephosphorylated BES1. This dephosphorylated form can form homodimers (BES1-BES1 and BZR1-BZR1) and heterodimers (BES1-PIF4 and BZR1-PIF4) to regulate downstream gene expression, promoting hypocotyl elongation (Figure 10A) [92]. It is important to note that Constitutive Photomorphogenic 1 (COP1), an E3 ubiquitin ligase, is responsible for the dark-induced degradation of the inactive, phosphorylated version of BZR1 [64].
In the presence of light, SINAT levels rise, facilitating the degradation of dephosphorylated BES1/BZR1. At the same time, COP1 activity is inhibited, leading to a decrease in the ratio of BES1/BZR1 to pBES1/pBZR1 [91]. Additionally, activated CRY1 interacts with dephosphorylated BES1 through its N-terminal (CNT1), inhibiting its DNA-binding activity and suppressing hypocotyl growth (Figure 10B) [93]. UV-B light, an integral component of sunlight, significantly affects plant development via the UVR8 photoreceptor [94,95,96,97]. Under UV-B exposure, UVR8 interacts with COP1 and accumulates in the nucleus, where it binds to dephosphorylated BES1. This interaction inhibits BES1’s DNA-binding activity, reducing the transcription of growth-promoting genes and thereby suppressing hypocotyl elongation [97,98,99].
When UV-B radiation is not present, UVR8 remains mainly in the cytoplasm, whereas BIM1 and active BES1 are localized in the nucleus, where they facilitate the transcription of genes induced by brassinosteroids (BR). This activity enhances cell elongation under low-temperature conditions. Our analysis of cis-acting elements and protein–protein interactions (Figure 5 and Figure 7) suggests a potential link between key response proteins and CsBES1, indicating that CsBES1 may play a crucial role in environmental stress resistance by interacting with or regulating these proteins (Figure 10). While these findings align with our research on CsBES1 and previous studies on plant stress responses, further experiments are necessary to confirm its precise contributions to plant resilience.

4. Materials and Methods

4.1. Identification and Analysis of BES1 Gene Families in TGY

TGY was acquired from the China National GeneBank genome sequence database sequence file (https://db.cngb.org/search/project/CNP0002030/ (accessed on 1 October 2024)) [100]. Meanwhile, amino acid sequence information of A. thaliana BES1 was obtained from the TAIR database (https://www.arabidopsis.org (accessed on 1 October 2024)). The protein sequence of TGY was compared with AtBES1s using the BLASTp 2.12.0 program of the National Center for Biotechnology Information (NCBI). Combining the results obtained using these two methods, CsBES1s was accurately located. Then, we used the NCBI CDD search tool (https://www.ncbi.nlm.nih.gov/Structure/bwrpsb/bwrpsb.cgi (accessed on 2 October 2024)) and SMART network database (http://smart.Embl-heidelberg.de/ (accessed on 3 October 2024)) to carry out in-depth analysis and verification of CsBES1s.
Finally, Tie Guanyin’s BES1 gene family was successfully identified as having 10 gene family members, and it was renamed CsBES11-10. ExPASy online (https://web.expasy.org/protparam (accessed on 15 July 2024)) [101] was utilized to predict and calculate the molecular weight, number of amino acids, theoretical PI (isoelectric point), number of positive (negative) residues, instability coefficient, lipolysis coefficient, and total average hydrophilicity of each BES1 protein in TGY.

4.2. Physical and Chemical Properties of TGY

HMMER 3.3 software was used to conduct comprehensive screening of the TGY genome and accurately locate the BES1 homologous sequence. The preliminary screening of the proceeds of the gene sequences was uploaded to the SMART database (https://smart.embl-Heidelberg.DE/ (accessed on 4 October 2024)) and the National Center for Biotechnology Information (NCBI) website (https://www.ncbi.nlm.nih.gov/ (accessed on 8 October 2024)). In this way, its domain can be accurately confirmed. In this process, the redundant sequences were effectively eliminated through meticulous manual comparison and screening, so as to successfully obtain CsBES1 gene members. Subsequently, the physicochemical properties of CsBES1 gene members were further investigated using the Protparam database (https://www.expasy.org/ (accessed on 9 October 2024)).
The ProtParam tool available on the ExPasy website was used to perform an in-depth analysis of essential protein characteristics, including the number of amino acids, molecular weight, and isoelectric point for each member. This analysis provided valuable data and a theoretical foundation for a deeper understanding of the properties and functions of the CsBES1 gene family. Furthermore, the CDD function of the NCBI website (https://www.ncbi.nlm.nih.gov/cdd (accessed on 10 October 2024)) and SMART online (https://smart.embl.de/ (accessed on 11 October 2024)) [31] were employed to analyze and integrate the obtained protein sequences.

4.3. Phylogenetic Analysis of CsBES1s and BES1s from Other Species

In this study, the BES1 protein sequence of TGY was successfully obtained by accessing the Ensemble Plant database. For Arabidopsis and S. lycopersicum, the genome and annotated data were downloaded from the specific ftp (https://www.etc.site/ftp/genomes/Nicotiana_tabacum/edwards_et_al_2017/ (accessed on 13 October 2024)). In order to deeply explore the evolutionary relationship between different species, the phylogenetic tree was constructed by adopting the neighbor-joining method (NJ) and setting 1000 repeats (the bootstrap value was 1000). Firstly, the online tool ITOL (https://itol.embl.de/ (accessed on 14 October 2024)) was used to construct preliminary phylogenetic trees for Arabidopsis and S. lycopersicum and TGY species, and MEGA 7.0.26 software was applied to construct the phylogenetic trees.

4.4. Collinearity Analysis and Replication Event Analysis of BES1

We used MCScanX (https://github.com/wyp1125/MCScanX/ (accessed on 15 October 2024)) software to study Arabidopsis and rice and maize CsBES1 and BES1 gene synthesis relationship in depth [68]. With the help of this software, the segmentation and tandem replication events occurring in the CsBES1 gene were identified, providing key genetic structural variation information. At the same time, TBtools-v2.10 [102], a software tool, was utilized to conduct a comprehensive analysis of the visual distribution and collinearity of CsBES1 genes.

4.5. GO and KEGG Analysis

In this study, the egg NOG-MAPPER platform was used to implement GO and KEGG analysis processes for the BES1 protein (https://www.kegg.jp/ (accessed on 20 October 2024)) [103]. In the framework of this analysis, the number of CsBES1 proteins was subdivided into three categories [104]. Then, Tbtools v2.10 software was used to visualize and analyze the annotation results.

4.6. Protein–Protein Interaction Network of CsBES1s

Complete and in-depth analysis is performed by uploading the BES1 protein sequence to the STRING database (https://cn.string-db.org/ (accessed on 25 October 2024)). Based on the observations of protein interactions in Arabidopsis, the association patterns among key proteins were prospectively predicted. Finally, Cytoscape (V3.10.2) software is used to visualize and optimize the acquired network [105].

4.7. Abiotic Stress Therapy

In this experiment, TGY seedlings were selected from TGY specimens. The soil for planting seedlings was prepared using a mixture of peat, humus, sandy soil, and perlite in a ratio of 5:2:2:1, resulting in soil organic content ranging from 2.57% to 6.07%. The average annual temperature was 16–20 °C, the annual precipitation was 900–2100 mm, and the annual relative humidity was about 77%. There were three experimental groups, drought, heat stress, and light treatment, and each experimental group included several groups. The drought and heat stress groups were divided into 4 groups, and the light stress groups were divided into 3 groups. Each group was treated with customized experimental conditions. In the sampling time setting, the sampling time of the drought and heat treatment groups was 0, 4, 8, 12, and 24 h.
The Nt group was sampled at 0, 24, 48, and 72 h, and seedlings collected at 0 h were used as the control group. During stress treatment, the parameters of the artificial climate chamber were set as follows: photocycle was 12 h/day, LED lighting was used, photosynthetic activity E radiation was set at 1200 µmol·mol−1·s−1, and the temperature was constant at 25 °C. Drought stress simulation was carried out with a specific scheme. The seedlings were incubated at 40 °C during temperature treatment. For light treatment, the corresponding treatment group was exposed to a light intensity of 1200 µmol·mol−1·s−1 for 24, 48, and 72 h, while the control group was exposed to 12 h of dark treatment and sampled at the half photocycle time. After processing, leaf specimens were quickly collected and stored in liquid nitrogen at −80 °C for subsequent RNA extraction.
Real-time PCR analysis was performed with 1 μL cDNA template, 10 μL SYBR Premix-Ex TaqTM II, 2 μL specific primers, and 7 μL ddH2O. The reaction conditions were as follows: 95 °C for 30 s; 95 °C for 5 s; 60 °C for 30 s; 95 °C for 5 s; 60 °C for 60 s; and 50 °C for 30 s, for a total of 40 cycles. The internal reference gene was GAPDH (GenBank No. KX682032) [106]. The expression level of the target gene was calculated using the 2-AACt method, and the quantitative data were analyzed with the t-test in SPSS26. Statistical significance was determined when p < 0.05. GraphPad Prism8.0 was applied for data visualization. Table 2 lists the primer sequences used, with GAPDH serving as the reference gene.

4.8. RNA Extraction and Statistical Analysis

For the RNA extraction and cDNA synthesis experiment, we used Omega Bio-Tek’s RNA extraction (Norcross, GA, USA) kit to extract total RNA from the sample. RNA extracted from Transgen was used as a template to synthesize cDNA for subsequent experiments. For the qRT-PCR experiment, the materials required are 1 μL cDNA, 2 μL specific primers (concentration 0.5 μM), 10 μL SYBR Premix Ex TaqTM II, and 7 μL ddH2O. The reaction process is denaturation annealing and extension. Finally, the relative expression of the CsBES1 gene was calculated using 2−∆∆CT method, and one-way variance analysis and Duncan multiple comparison tests were performed using GraphPad Prism 9.0 software (software web site: https://www.graphpad.com/ (accessed on 1 November 2024)) [107]. All quantitative PCR experiments were repeated three times.

5. Conclusions

In this study, a total of 10 CsBES1 genes were identified in TGY, and their properties, structural features, functional roles, relationships, and expression profiles were thoroughly analyzed. Among them, CsBES1.3, CsBES1.4, CsBES1.5, CsBES1.6, and CsBES1.7, which contain promoter regions, are more likely to play critical roles in responding to various abiotic stresses. The BES1 proteins may interact with other signal transduction components, such as CYP90B1, SAUR15, ASK7, and BKI1, to regulate plant growth and development. Further analysis revealed that CsBES1.9 and CsBES1.4 exhibit the most significant expression changes under different stress conditions.
Specifically, the expression of CsBES1.9 was most strongly upregulated under light stress, suggesting its potential role in light stress resistance. Nevertheless, the exact mechanisms by which CsBES1 genes control the growth and development of TGY remain unclear and warrant further exploration. This study offers a comprehensive analysis of the expression patterns of CsBES1 genes across various tissues and their responses to abiotic stress, shedding light on their potential roles in plant stress tolerance.

Author Contributions

Conceptualization, Y.Z. (Yanlin Zhang); Methodology, Y.Z. (Yanzi Zhang), W.C. and H.C.; Software, Z.Y. and S.C.; Validation, Y.Z. (Yanlin Zhang); Formal analysis, Y.Z. (Yanlin Zhang) and Q.L.; Investigation, X.W. All authors have read and agreed to the published version of the manuscript.

Funding

Fuiian Aariculture and Forestry Wniversity Forestry Peak Discipline Construction project. This research received no external funding.

Data Availability Statement

Data are contained within the article.

Conflicts of Interest

The authors declare no conflict of interest.

References

  1. Li, L.; Deng, X.W. It runs in the family: Regulation of brassinosteroid signaling by the BZR1-BES1 class of transcription factors. Trends Plant Sci. 2005, 10, 266–268. [Google Scholar] [CrossRef] [PubMed]
  2. Wang, Z.Y.; Bai, M.Y.; Oh, E.; Zhu, J.Y. Brassinosteroid signaling network and regulation of photomorphogenesis. Annu. Rev. Genet. 2012, 46, 701–724. [Google Scholar] [CrossRef] [PubMed]
  3. Anwar, A.; Liu, Y.; Dong, R.; Bai, L.; Yu, X.; Li, Y. The physiological and molecular mechanism of brassinosteroid in response to stress: A review. Biol. Res. 2018, 51, 46. [Google Scholar] [CrossRef] [PubMed]
  4. Feng, Z.; Shi, H.; Lv, M.; Ma, Y.; Li, J. Protein farnesylation negatively regulates brassinosteroid signaling via reducing BES1 stability in Arabidopsis thaliana. J. Integr. Plant Biol. 2021, 63, 1353–1366. [Google Scholar] [CrossRef] [PubMed]
  5. Li, Q.; Xu, F.; Chen, Z.; Teng, Z.; Sun, K.; Li, X.; Yu, J.; Zhang, G.; Liang, Y.; Huang, X.; et al. Synergistic interplay of ABA and BR signal in regulating plant growth and adaptation. Nat. Plants 2021, 7, 1108–1118. [Google Scholar] [CrossRef]
  6. González-García, M.P.; Vilarrasa-Blasi, J.; Zhiponova, M.; Divol, F.; Mora-García, S.; Russinova, E.; Caño-Delgado, A.I. Brassinosteroids control meristem size by promoting cell cycle progression in Arabidopsis roots. Development 2011, 138, 849–859. [Google Scholar] [CrossRef]
  7. Planas-Riverola, A.; Gupta, A.; Betegón-Putze, I.; Bosch, N.; Ibañes, M.; Caño-Delgado, A.I. Brassinosteroid signaling in plant development and adaptation to stress. Development 2019, 146, dev151894. [Google Scholar] [CrossRef]
  8. Mitchell, J.W.; Mandava, N.; Worley, J.F.; Plimmer, J.R.; Smith, M.V. Brassins--a new family of plant hormones from rape pollen. Nature 1970, 225, 1065–1066. [Google Scholar] [CrossRef]
  9. Peres, A.; Soares, J.S.; Tavares, R.G.; Righetto, G.; Zullo, M.A.T.; Mandava, N.B.; Menossi, M. Brassinosteroids, the Sixth Class of Phytohormones: A Molecular View from the Discovery to Hormonal Interactions in Plant Development and Stress Adaptation. Int. J. Mol. Sci. 2019, 20, 331. [Google Scholar] [CrossRef]
  10. Nolan, T.M.; Vukašinović, N.; Hsu, C.W.; Zhang, J.; Vanhoutte, I.; Shahan, R.; Taylor, I.W.; Greenstreet, L.; Heitz, M.; Afanassiev, A.; et al. Brassinosteroid gene regulatory networks at cellular resolution in the Arabidopsis root. Science 2023, 379, eadf4721. [Google Scholar] [CrossRef]
  11. Kim, E.J.; Russinova, E. Brassinosteroid signalling. Curr. Biol. 2020, 30, R294–R298. [Google Scholar] [CrossRef] [PubMed]
  12. Jiang, H.; Tang, B.; Xie, Z.; Nolan, T.; Ye, H.; Song, G.Y.; Walley, J.; Yin, Y. GSK3-like kinase BIN2 phosphorylates RD26 to potentiate drought signaling in Arabidopsis. Plant J. 2019, 100, 923–937. [Google Scholar] [CrossRef] [PubMed]
  13. Ye, H.; Liu, S.; Tang, B.; Chen, J.; Xie, Z.; Nolan, T.M.; Jiang, H.; Guo, H.; Lin, H.-Y.; Li, L.; et al. RD26 mediates crosstalk between drought and brassinosteroid signalling pathways. Nat. Commun. 2017, 8, 14573. [Google Scholar] [CrossRef]
  14. Bulgakov, V.P.; Avramenko, T.V. Linking Brassinosteroid and ABA Signaling in the Context of Stress Acclimation. Int. J. Mol. Sci. 2020, 21, 5108. [Google Scholar] [CrossRef]
  15. Liu, Z.; Guo, J.T.; Li, T.; Xu, Y. Structure-based prediction of transcription factor binding sites using a protein-DNA docking approach. Proteins Struct. Funct. Genet. 2008, 72, 1114–1124. [Google Scholar] [CrossRef]
  16. Century, K.; Reuber, T.L.; Ratcliffe, O.J. Regulating the regulators: The future prospects for transcription-factor-based agricultural biotechnology products. Plant Physiol. 2008, 147, 20–29. [Google Scholar] [CrossRef]
  17. Chen, W.; Lv, M.; Wang, Y.; Wang, P.A.; Cui, Y.; Li, M.; Wang, R.; Gou, X.; Li, J. BES1 is activated by EMS1-TPD1-SERK1/2-mediated signaling to control tapetum development in Arabidopsis thaliana. Nat. Commun. 2019, 10, 4164. [Google Scholar] [CrossRef]
  18. Cui, X.Y.; Gao, Y.; Guo, J.; Yu, T.F.; Zheng, W.J.; Liu, Y.W.; Chen, J.; Xu, Z.S.; Ma, Y.Z. BES/BZR Transcription Factor TaBZR2 Positively Regulates Drought Responses by Activation of TaGST1. Plant Physiol. 2019, 180, 605–620. [Google Scholar] [CrossRef]
  19. Su, D.; Xiang, W.; Wen, L.; Lu, W.; Shi, Y.; Liu, Y.; Li, Z. Genome-wide identification, characterization and expression analysis of BES1 gene family in tomato. BMC Plant Biol. 2021, 21, 161. [Google Scholar] [CrossRef]
  20. Kono, A.; Yin, Y. Updates on BES1/BZR1 Regulatory Networks Coordinating Plant Growth and Stress Responses. Front. Plant Sci. 2020, 11, 617162. [Google Scholar] [CrossRef]
  21. Yin, Y.; Vafeados, D.; Tao, Y.; Yoshida, S.; Asami, T.; Chory, J. A new class of transcription factors mediates brassinosteroid-regulated gene expression in Arabidopsis. Cell 2005, 120, 249–259. [Google Scholar] [CrossRef] [PubMed]
  22. Guo, H.; Ye, H.; Li, L.; Yin, Y. A family of receptor-like kinases are regulated by BES1 and involved in plant growth in Arabidopsis thaliana. Plant Signal Behav. 2009, 4, 784–786. [Google Scholar] [CrossRef] [PubMed]
  23. Reinhold, H.; Soyk, S.; Simková, K.; Hostettler, C.; Marafino, J.; Mainiero, S.; Vaughan, C.K.; Monroe, J.D.; Zeeman, S.C. β-amylase-like proteins function as transcription factors in Arabidopsis, controlling shoot growth and development. Plant Cell 2011, 23, 1391–1403. [Google Scholar] [CrossRef]
  24. Lachowiec, J.; Mason, G.A.; Schultz, K.; Queitsch, C. Redundancy, Feedback, and Robustness in the Arabidopsis thaliana BZR/BEH Gene Family. Front. Genet. 2018, 9, 523. [Google Scholar] [CrossRef]
  25. Otani, Y.; Tomonaga, Y.; Tokushige, K.; Kamimura, M.; Sasaki, A.; Nakamura, Y.; Nakamura, T.; Matsuo, T.; Okamoto, S. Expression profiles of four BES1/BZR1 homologous genes encoding bHLH transcription factors in Arabidopsis. J. Pestic. Sci. 2020, 45, 95–104. [Google Scholar] [CrossRef]
  26. Yin, Y.; Wang, Z.Y.; Mora-Garcia, S.; Li, J.; Yoshida, S.; Asami, T.; Chory, J. BES1 accumulates in the nucleus in response to brassinosteroids to regulate gene expression and promote stem elongation. Cell 2002, 109, 181–191. [Google Scholar] [CrossRef]
  27. Mueller, A.K.; Labaied, M.; Kappe, S.H.; Matuschewski, K. Genetically modified Plasmodium parasites as a protective experimental malaria vaccine. Nature 2005, 433, 164–167. [Google Scholar] [CrossRef]
  28. Li, J.; Wen, J.; Lease, K.A.; Doke, J.T.; Tax, F.E.; Walker, J.C. BAK1, an Arabidopsis LRR receptor-like protein kinase, interacts with BRI1 and modulates brassinosteroid signaling. Cell 2002, 110, 213–222. [Google Scholar] [CrossRef]
  29. Kim, T.W.; Guan, S.; Burlingame, A.L.; Wang, Z.Y. The CDG1 kinase mediates brassinosteroid signal transduction from BRI1 receptor kinase to BSU1 phosphatase and GSK3-like kinase BIN2. Mol. Cell 2011, 43, 561–571. [Google Scholar] [CrossRef]
  30. He, J.-X.; Gendron, J.M.; Yang, Y.; Li, J.; Wang, Z.-Y. The GSK3-like kinase BIN2 phosphorylates and destabilizes BZR1, a positive regulator of the brassinosteroid signaling pathway in Arabidopsis. Proc. Natl. Acad. Sci. USA 2002, 99, 10185–10190. [Google Scholar] [CrossRef]
  31. Li, J.; Nam, K.H. Regulation of brassinosteroid signaling by a GSK3/SHAGGY-like kinase. Science 2002, 295, 1299–1301. [Google Scholar] [CrossRef] [PubMed]
  32. Toledo-Ortiz, G.; Huq, E.; Quail, P.H. The Arabidopsis basic/helix-loop-helix transcription factor family. Plant Cell 2003, 15, 1749–1770. [Google Scholar] [CrossRef] [PubMed]
  33. Wang, R.; Wang, R.; Liu, M.; Yuan, W.; Zhao, Z.; Liu, X.; Peng, Y.; Yang, X.; Sun, Y.; Tang, W. Nucleocytoplasmic trafficking and turnover mechanisms of BRASSINAZOLE RESISTANT1 in Arabidopsis thaliana. Proc. Natl. Acad. Sci. USA 2021, 118, e2101838118. [Google Scholar] [CrossRef]
  34. Jiang, J.; Zhang, C.; Wang, X. A recently evolved isoform of the transcription factor BES1 promotes brassinosteroid signaling and development in Arabidopsis thaliana. Plant Cell 2015, 27, 361–374. [Google Scholar] [CrossRef]
  35. Saha, G.; Park, J.I.; Jung, H.J.; Ahmed, N.U.; Kayum, M.A.; Kang, J.G.; Nou, I.S. Molecular characterization of BZR transcription factor family and abiotic stress induced expression profiling in Brassica rapa. Plant Physiol. Biochem. 2015, 92, 92–104. [Google Scholar] [CrossRef]
  36. Setsungnern, A.; Muñoz, P.; Pérez-Llorca, M.; Müller, M.; Thiravetyan, P.; Munné-Bosch, S. A defect in BRI1-EMS-SUPPRESSOR 1 (bes1)-mediated brassinosteroid signaling increases photoinhibition and photo-oxidative stress during heat stress in Arabidopsis. Plant Sci. 2020, 296, 110470. [Google Scholar] [CrossRef]
  37. Yan, M.Y.; Xie, D.L.; Cao, J.J.; Xia, X.J.; Shi, K.; Zhou, Y.H.; Zhou, J.; Foyer, C.H.; Yu, J.Q. Brassinosteroid-mediated reactive oxygen species are essential for tapetum degradation and pollen fertility in tomato. Plant J. 2020, 102, 931–947. [Google Scholar] [CrossRef]
  38. Mecchia, M.A.; García-Hourquet, M.; Lozano-Elena, F.; Planas-Riverola, A.; Blasco-Escamez, D.; Marquès-Bueno, M.; Mora-García, S.; Caño-Delgado, A.I. The BES1/BZR1-family transcription factor MpBES1 regulates cell division and differentiation in Marchantia polymorpha. Curr. Biol. 2021, 31, 4860–4869.e4868. [Google Scholar] [CrossRef]
  39. Korwin Krukowski, P.; Visentin, I.; Russo, G.; Minerdi, D.; Bendahmane, A.; Schubert, A.; Cardinale, F. Transcriptome Analysis Points to BES1 as a Transducer of Strigolactone Effects on Drought Memory in Arabidopsis thaliana. Plant Cell Physiol. 2022, 63, 1873–1889. [Google Scholar] [CrossRef]
  40. Sun, Z.; Liu, X.; Zhu, W.; Lin, H.; Chen, X.; Li, Y.; Ye, W.; Yin, Z. Molecular Traits and Functional Exploration of BES1 Gene Family in Plants. Int. J. Mol. Sci. 2022, 23, 4242. [Google Scholar] [CrossRef]
  41. Yang, J.; Wu, Y.; Li, L.; Li, C. Comprehensive analysis of the BES1 gene family and its expression under abiotic stress and hormone treatment in Populus trichocarpa. Plant Physiol. Biochem. 2022, 173, 1–13. [Google Scholar] [CrossRef] [PubMed]
  42. Chen, J.; Nolan, T.M.; Ye, H.; Zhang, M.; Tong, H.; Xin, P.; Chu, J.; Chu, C.; Li, Z.; Yin, Y. Arabidopsis WRKY46, WRKY54, and WRKY70 Transcription Factors Are Involved in Brassinosteroid-Regulated Plant Growth and Drought Responses. Plant Cell 2017, 29, 1425–1439. [Google Scholar] [CrossRef] [PubMed]
  43. Franklin, K.A.; Lee, S.H.; Patel, D.; Kumar, S.V.; Spartz, A.K.; Gu, C.; Ye, S.; Yu, P.; Breen, G.; Cohen, J.D.; et al. PHYTOCHROME-INTERACTING FACTOR 4 (PIF4) regulates auxin biosynthesis at high temperature. Proc. Natl. Acad. Sci. USA 2011, 108, 20231–20235. [Google Scholar] [CrossRef] [PubMed]
  44. Song, X.; Ma, X.; Li, C.; Hu, J.; Yang, Q.; Wang, T.; Wang, L.; Wang, J.; Guo, D.; Ge, W.; et al. Comprehensive analyses of the BES1 gene family in Brassica napus and examination of their evolutionary pattern in representative species. BMC Genom. 2018, 19, 346. [Google Scholar] [CrossRef]
  45. Liu, Z.; Qanmber, G.; Lu, L.; Qin, W.; Liu, J.; Li, J.; Ma, S.; Yang, Z.; Yang, Z. Genome-wide analysis of BES1 genes in Gossypium revealed their evolutionary conserved roles in brassinosteroid signaling. Sci. China Life Sci. 2018, 61, 1566–1582. [Google Scholar] [CrossRef]
  46. Feng, W.; Zhang, H.; Cao, Y.; Liu, Y.; Zhao, Y.; Sun, F.; Yang, Q.; Zhang, X.; Zhang, Y.; Wang, Y.; et al. Maize ZmBES1/BZR1-1 transcription factor negatively regulates drought tolerance. Plant Physiol. Biochem. 2023, 205, 108188. [Google Scholar] [CrossRef]
  47. Gao, Y.; Hu, J.; Zhao, T.; Xu, X.; Jiang, J.; Li, J. Genome-wide Identification and Expression Pattern Analysis of BRI1-EMS–suppressor Transcription Factors in Tomato under Abiotic Stresses. J. Am. Soc. Hortic. Sci. 2018, 143, 84–90. [Google Scholar] [CrossRef]
  48. Song, X.; Li, Y.; Hou, X. Genome-wide analysis of the AP2/ERF transcription factor superfamily in Chinese cabbage (Brassica rapa ssp. pekinensis). BMC Genom. 2013, 14, 573. [Google Scholar] [CrossRef]
  49. Ma, S.; Ji, T.; Liang, M.; Li, S.; Tian, Y.; Gao, L. Genome-Wide Identification, Structural, and Gene Expression Analysis of BRI1-EMS-Suppressor 1 Transcription Factor Family in Cucumis sativus. Front. Genet. 2020, 11, 583996. [Google Scholar] [CrossRef]
  50. Xie, L.; Yang, C.; Wang, X. Brassinosteroids can regulate cellulose biosynthesis by controlling the expression of CESA genes in Arabidopsis. J. Exp. Bot. 2011, 62, 4495–4506. [Google Scholar] [CrossRef]
  51. Ye, Q.; Zhu, W.; Li, L.; Zhang, S.; Yin, Y.; Ma, H.; Wang, X. Brassinosteroids control male fertility by regulating the expression of key genes involved in Arabidopsis anther and pollen development. Proc. Natl. Acad. Sci. USA 2010, 107, 6100–6105. [Google Scholar] [CrossRef] [PubMed]
  52. Lozano-Durán, R.; Macho, A.P.; Boutrot, F.; Segonzac, C.; Somssich, I.E.; Zipfel, C. The transcriptional regulator BZR1 mediates trade-off between plant innate immunity and growth. Elife 2013, 2, e00983. [Google Scholar] [CrossRef] [PubMed]
  53. Li, X.; Liu, L.; Sun, S.; Li, Y.; Jia, L.; Ye, S.; Yu, Y.; Dossa, K.; Luan, Y. Leaf-transcriptome profiles of phoebe bournei provide insights into temporal drought stress responses. Front. Plant Sci. 2022, 13, 1010314. [Google Scholar] [CrossRef]
  54. Reygaert, W.C. The antimicrobial possibilities of green tea. Front. Microbiol. 2014, 5, 434. [Google Scholar] [CrossRef]
  55. Huang, Z.; Sanaeifar, A.; Tian, Y.; Liu, L.; Zhang, D.; Wang, H.; Ye, D.; Li, X. Improved generalization of spectral models associated with Vis-NIR spectroscopy for determining the moisture content of different tea leaves. J. Food Eng. 2021, 293, 110374. [Google Scholar] [CrossRef]
  56. Zeng, L.; Zhou, Y.; Fu, X.; Mei, X.; Cheng, S.; Gui, J.; Dong, F.; Tang, J.; Ma, S.; Yang, Z. Does oolong tea (Camellia sinensis) made from a combination of leaf and stem smell more aromatic than leaf-only tea? Contribution of the stem to oolong tea aroma. Food Chem. 2017, 237, 488–498. [Google Scholar] [CrossRef]
  57. Hara, Y. Elucidation of Physiological Functions of Tea Catechins and Their Practical Applications. J. Food Drug Anal. 2012, 20, 296–300. [Google Scholar] [CrossRef]
  58. Zhang, S.; Takano, J.; Murayama, N.; Tominaga, M.; Abe, T.; Park, I.; Seol, J.; Ishihara, A.; Tanaka, Y.; Yajima, K.; et al. Subacute Ingestion of Caffeine and Oolong Tea Increases Fat Oxidation without Affecting Energy Expenditure and Sleep Architecture: A Randomized, Placebo-Controlled, Double-Blinded Cross-Over Trial. Nutrients 2020, 12, 3671. [Google Scholar] [CrossRef]
  59. Wang, W.; Xin, H.; Wang, M.; Ma, Q.; Wang, L.; Kaleri, N.A.; Wang, Y.; Li, X. Transcriptomic Analysis Reveals the Molecular Mechanisms of Drought-Stress-Induced Decreases in Camellia sinensis Leaf Quality. Front. Plant Sci. 2016, 7, 385. [Google Scholar] [CrossRef]
  60. Yu, S.; Li, P.; Zhao, X.; Tan, M.; Ahmad, M.Z.; Xu, Y.; Tadege, M.; Zhao, J. CsTCPs regulate shoot tip development and catechin biosynthesis in tea plant (Camellia sinensis). Hortic. Res. 2021, 8, 104. [Google Scholar] [CrossRef]
  61. Zhang, Q.; Shi, Y.; Ma, L.; Yi, X.; Ruan, J. Metabolomic analysis using ultra-performance liquid chromatography-quadrupole-time of flight mass spectrometry (UPLC-Q-TOF MS) uncovers the effects of light intensity and temperature under shading treatments on the metabolites in tea. PLoS ONE 2014, 9, e112572. [Google Scholar] [CrossRef] [PubMed]
  62. Zheng, C.; Ma, J.Q.; Ma, C.L.; Shen, S.Y.; Liu, Y.F.; Chen, L. Regulation of Growth and Flavonoid Formation of Tea Plants (Camellia sinensis) by Blue and Green Light. J. Agric. Food Chem. 2019, 67, 2408–2419. [Google Scholar] [CrossRef] [PubMed]
  63. Li, Q.F.; Huang, L.C.; Wei, K.; Yu, J.W.; Zhang, C.Q.; Liu, Q.Q. Light involved regulation of BZR1 stability and phosphorylation status to coordinate plant growth in Arabidopsis. Biosci. Rep. 2017, 37, BSR20170069. [Google Scholar] [CrossRef] [PubMed]
  64. Kim, B.; Jeong, Y.J.; Corvalán, C.; Fujioka, S.; Cho, S.; Park, T.; Choe, S. Darkness and gulliver2/phyB mutation decrease the abundance of phosphorylated BZR1 to activate brassinosteroid signaling in Arabidopsis. Plant J. 2014, 77, 737–747. [Google Scholar] [CrossRef]
  65. Roy, S.W.; Penny, D. A very high fraction of unique intron positions in the intron-rich diatom Thalassiosira pseudonana indicates widespread intron gain. Mol. Biol. Evol. 2007, 24, 1447–1457. [Google Scholar] [CrossRef]
  66. Kolodny, R. Searching protein space for ancient sub-domain segments. Curr. Opin. Struct. Biol. 2021, 68, 105–112. [Google Scholar] [CrossRef]
  67. Zhou, Q.; Zhao, M.; Xing, F.; Mao, G.; Wang, Y.; Dai, Y.; Niu, M.; Yuan, H. Identification and Expression Analysis of CAMTA Genes in Tea Plant Reveal Their Complex Regulatory Role in Stress Responses. Front. Plant Sci. 2022, 13, 910768. [Google Scholar] [CrossRef]
  68. Wang, Y.; Tang, H.; Debarry, J.D.; Tan, X.; Li, J.; Wang, X.; Lee, T.H.; Jin, H.; Marler, B.; Guo, H.; et al. MCScanX: A toolkit for detection and evolutionary analysis of gene synteny and collinearity. Nucleic Acids Res. 2012, 40, e49. [Google Scholar] [CrossRef]
  69. Panchy, N.; Lehti-Shiu, M.; Shiu, S.H. Evolution of Gene Duplication in Plants. Plant Physiol. 2016, 171, 2294–2316. [Google Scholar] [CrossRef]
  70. Holub, E.B. The arms race is ancient history in Arabidopsis, the wildflower. Nat. Rev. Genet. 2001, 2, 516–527. [Google Scholar] [CrossRef]
  71. Xiong, M.; Yu, J.; Wang, J.; Gao, Q.; Huang, L.; Chen, C.; Zhang, C.; Fan, X.; Zhao, D.; Liu, Q.-Q.; et al. Brassinosteroids regulate rice seed germination through the BZR1-RAmy3D transcriptional module. Plant Physiol. 2022, 189, 402–418. [Google Scholar] [CrossRef] [PubMed]
  72. Lescot, M.; Déhais, P.; Thijs, G.; Marchal, K.; Moreau, Y.; Van de Peer, Y.; Rouzé, P.; Rombauts, S. PlantCARE, a database of plant cis-acting regulatory elements and a portal to tools for in silico analysis of promoter sequences. Nucleic Acids Res. 2002, 30, 325–327. [Google Scholar] [CrossRef] [PubMed]
  73. Gendron, J.M.; Wang, Z.Y. Multiple mechanisms modulate brassinosteroid signaling. Curr. Opin. Plant Biol. 2007, 10, 436–441. [Google Scholar] [CrossRef]
  74. Wang, X.; Niu, Y.; Zheng, Y. Multiple Functions of MYB Transcription Factors in Abiotic Stress Responses. Int. J. Mol. Sci. 2021, 22, 6125. [Google Scholar] [CrossRef]
  75. Kim, S.H.; Lee, S.H.; Park, T.K.; Tian, Y.; Yu, K.; Lee, B.H.; Bai, M.Y.; Cho, S.J.; Kim, T.W. Comparative analysis of BZR1/BES1 family transcription factors in Arabidopsis. Plant J. 2024, 117, 747–765. [Google Scholar] [CrossRef]
  76. Li, M.; Liu, C.; Hepworth, S.R.; Ma, C.; Li, H.; Li, J.; Wang, S.M.; Yin, H. SAUR15 interaction with BRI1 activates plasma membrane H+-ATPase to promote organ development of Arabidopsis. Plant Physiol. 2022, 189, 2454–2466. [Google Scholar] [CrossRef]
  77. Kojima, K.; Ichijo, H.; Naguro, I. Molecular functions of ASK family in diseases caused by stress-induced inflammation and apoptosis. J. Biochem. 2021, 169, 395–407. [Google Scholar] [CrossRef]
  78. Ohnishi, T.; Godza, B.; Watanabe, B.; Fujioka, S.; Hategan, L.; Ide, K.; Shibata, K.; Yokota, T.; Szekeres, M.; Mizutani, M. CYP90A1/CPD, a brassinosteroid biosynthetic cytochrome P450 of Arabidopsis, catalyzes C-3 oxidation. J. Biol. Chem. 2012, 287, 31551–31560. [Google Scholar] [CrossRef]
  79. Demuth, J.P.; Hahn, M.W. The life and death of gene families. Bioessays 2009, 31, 29–39. [Google Scholar] [CrossRef]
  80. Oudelaar, A.M.; Higgs, D.R. The relationship between genome structure and function. Nat. Rev. Genet. 2021, 22, 154–168. [Google Scholar] [CrossRef]
  81. Li, L.; Yu, X.; Thompson, A.; Guo, M.; Yoshida, S.; Asami, T.; Chory, J.; Yin, Y. Arabidopsis MYB30 is a direct target of BES1 and cooperates with BES1 to regulate brassinosteroid-induced gene expression. Plant J. 2009, 58, 275–286. [Google Scholar] [CrossRef] [PubMed]
  82. Saito, M.; Kondo, Y.; Fukuda, H. BES1 and BZR1 Redundantly Promote Phloem and Xylem Differentiation. Plant Cell Physiol. 2018, 59, 590–600. [Google Scholar] [CrossRef] [PubMed]
  83. Roy, S.W.; Gilbert, W. The evolution of spliceosomal introns: Patterns, puzzles and progress. Nat. Rev. Genet. 2006, 7, 211–221. [Google Scholar] [CrossRef] [PubMed]
  84. Song, X.M.; Huang, Z.N.; Duan, W.K.; Ren, J.; Liu, T.K.; Li, Y.; Hou, X.L. Genome-wide analysis of the bHLH transcription factor family in Chinese cabbage (Brassica rapa ssp. pekinensis). Mol. Genet. Genom. 2014, 289, 77–91. [Google Scholar] [CrossRef]
  85. Cao, X.; Khaliq, A.; Lu, S.; Xie, M.; Ma, Z.; Mao, J.; Chen, B. Genome-wide identification and characterization of the BES1 gene family in apple (Malus domestica). Plant Biol. 2020, 22, 723–733. [Google Scholar] [CrossRef]
  86. Cheng, M.; Yuan, H.; Wang, R.; Wang, W.; Zhang, L.; Fan, F.; Li, S. Identification and characterization of BES1 genes involved in grain size development of Oryza sativa L. Int. J. Biol. Macromol. 2023, 253, 127327. [Google Scholar] [CrossRef]
  87. Cao, X.; Ma, W.; Zeng, F.; Cheng, Y.; Ma, Z.; Mao, J.; Chen, B. Grape BES1 transcription factor gene VvBES1-3 confers salt tolerance in transgenic Arabidopsis. Gene 2023, 854, 147059. [Google Scholar] [CrossRef]
  88. Cartharius, K.; Frech, K.; Grote, K.; Klocke, B.; Haltmeier, M.; Klingenhoff, A.; Frisch, M.; Bayerlein, M.; Werner, T. MatInspector and beyond: Promoter analysis based on transcription factor binding sites. Bioinformatics 2005, 21, 2933–2942. [Google Scholar] [CrossRef]
  89. Yang, C.J.; Zhang, C.; Lu, Y.N.; Jin, J.Q.; Wang, X.L. The mechanisms of brassinosteroids’ action: From signal transduction to plant development. Mol. Plant 2011, 4, 588–600. [Google Scholar] [CrossRef]
  90. Ibañez, C.; Delker, C.; Martinez, C.; Bürstenbinder, K.; Janitza, P.; Lippmann, R.; Ludwig, W.; Sun, H.; James, G.V.; Klecker, M.; et al. Brassinosteroids Dominate Hormonal Regulation of Plant Thermomorphogenesis via BZR1. Curr. Biol. 2018, 28, 303–310.e303. [Google Scholar] [CrossRef]
  91. Yang, M.; Li, C.; Cai, Z.; Hu, Y.; Nolan, T.; Yu, F.; Yin, Y.; Xie, Q.; Tang, G.; Wang, X. SINAT E3 Ligases Control the Light-Mediated Stability of the Brassinosteroid-Activated Transcription Factor BES1 in Arabidopsis. Dev. Cell 2017, 41, 47–58.e44. [Google Scholar] [CrossRef] [PubMed]
  92. Oh, E.; Zhu, J.Y.; Wang, Z.Y. Interaction between BZR1 and PIF4 integrates brassinosteroid and environmental responses. Nat. Cell Biol. 2012, 14, 802–809. [Google Scholar] [CrossRef]
  93. Wang, W.; Lu, X.; Li, L.; Lian, H.; Mao, Z.; Xu, P.; Guo, T.; Xu, F.; Du, S.; Cao, X.; et al. Photoexcited CRYPTOCHROME1 Interacts with Dephosphorylated BES1 to Regulate Brassinosteroid Signaling and Photomorphogenesis in Arabidopsis. Plant Cell 2018, 30, 1989–2005. [Google Scholar] [CrossRef] [PubMed]
  94. Heijde, M.; Ulm, R. UV-B photoreceptor-mediated signalling in plants. Trends Plant Sci. 2012, 17, 230–237. [Google Scholar] [CrossRef] [PubMed]
  95. Jenkins, G.I. Structure and function of the UV-B photoreceptor UVR8. Curr. Opin. Struct. Biol. 2014, 29, 52–57. [Google Scholar] [CrossRef] [PubMed]
  96. Tilbrook, K.; Arongaus, A.B.; Binkert, M.; Heijde, M.; Yin, R.; Ulm, R. The UVR8 UV-B Photoreceptor: Perception, Signaling and Response. Arab. Book 2013, 11, e0164. [Google Scholar] [CrossRef]
  97. Rizzini, L.; Favory, J.J.; Cloix, C.; Faggionato, D.; O’Hara, A.; Kaiserli, E.; Baumeister, R.; Schäfer, E.; Nagy, F.; Jenkins, G.I.; et al. Perception of UV-B by the Arabidopsis UVR8 protein. Science 2011, 332, 103–106. [Google Scholar] [CrossRef]
  98. Huang, X.; Yang, P.; Ouyang, X.; Chen, L.; Deng, X.W. Photoactivated UVR8-COP1 module determines photomorphogenic UV-B signaling output in Arabidopsis. PLoS Genet. 2014, 10, e1004218. [Google Scholar] [CrossRef]
  99. Liang, T.; Mei, S.; Shi, C.; Yang, Y.; Peng, Y.; Ma, L.; Wang, F.; Li, X.; Huang, X.; Yin, Y.; et al. UVR8 Interacts with BES1 and BIM1 to Regulate Transcription and Photomorphogenesis in Arabidopsis. Dev. Cell 2018, 44, 512–523.e515. [Google Scholar] [CrossRef]
  100. Han, X.; Zhang, J.; Han, S.; Chong, S.L.; Meng, G.; Song, M.; Wang, Y.; Zhou, S.; Liu, C.; Lou, L.; et al. The chromosome-scale genome of Phoebe bournei reveals contrasting fates of terpene synthase (TPS)-a and TPS-b subfamilies. Plant Commun. 2022, 3, 100410. [Google Scholar] [CrossRef]
  101. Gasteiger, E.; Gattiker, A.; Hoogland, C.; Ivanyi, I.; Appel, R.D.; Bairoch, A. ExPASy: The proteomics server for in-depth protein knowledge and analysis. Nucleic Acids Res. 2003, 31, 3784–3788. [Google Scholar] [CrossRef]
  102. Chen, C.; Wu, Y.; Li, J.; Wang, X.; Zeng, Z.; Xu, J.; Liu, Y.; Feng, J.; Chen, H.; He, Y.; et al. TBtools-II: A “one for all, all for one“ bioinformatics platform for biological big-data mining. Molecular Plant 2023, 16, 1733–1742. [Google Scholar] [CrossRef]
  103. Cantalapiedra, C.P.; Hernández-Plaza, A.; Letunic, I.; Bork, P.; Huerta-Cepas, J. eggNOG-mapper v2: Functional Annotation, Orthology Assignments, and Domain Prediction at the Metagenomic Scale. Mol. Biol. Evol. 2021, 38, 5825–5829. [Google Scholar] [CrossRef] [PubMed]
  104. Kanehisa, M.; Furumichi, M.; Tanabe, M.; Sato, Y.; Morishima, K. KEGG: New perspectives on genomes, pathways, diseases and drugs. Nucleic Acids Res. 2017, 45, D353–D361. [Google Scholar] [CrossRef] [PubMed]
  105. Otasek, D.; Morris, J.H.; Bouças, J.; Pico, A.R.; Demchak, B. Cytoscape Automation: Empowering workflow-based network analysis. Genome Biol. 2019, 20, 185. [Google Scholar] [CrossRef] [PubMed]
  106. Winters, M.; Eskes, M.; Weir, A.; Moen, M.H.; Backx, F.J.; Bakker, E.W. Treatment of medial tibial stress syndrome: A systematic review. Sports Med. 2013, 43, 1315–1333. [Google Scholar] [CrossRef] [PubMed]
  107. Day, R.W.; Quinn, G.P. Comparisons of Treatments After an Analysis of Variance in Ecology. Ecol. Monogr. 1989, 59, 433–463. [Google Scholar] [CrossRef]
Figure 1. Summary of BR regulating developmental processes in A. thaliana. (A) High temperature inhibits thTFs, determines their gene targets, and leads to different cellular responses. (B) Xylem differentiation is controlled by the TRACHEARY ELEMENT DIFFERENTIATION INHIBITORY FACTOR (TDIF) signaling pathway (the red dots represent the TDIF signal). GSK3 is a key component in this pathway. It acts as a negative regulator of xylem differentiation and crosstalks with the brassinosteroid (BR) signaling pathway. The TDIF signal acts on the TDR receptor on cambium cells, resulting in the inhibition of BRS1 activity by GSK3s. In the xylem where it is not inhibited by the activity of PHYB, light promotes the activity of PHYB. PHYB inhibits the production of PIF4 and indirectly determines the level of PIF4-BES1 heterodimerization. The interactions among these transcription factors (DIF and BES1) functions to promote cell elongation (the gray arrows indicate that no has reaction occurred). (C) Brassinosteroids (BRs) inhibit flowering by promoting the expression of the flowering inhibitor FLC. (D) In the root apical meristem, BRs control the size of the stem cell niche by balancing the expression of BRAVO, which negatively regulates cell division in the quiescent center. BR signaling levels increase along the longitudinal axis, with higher levels present in cells closer to the differentiation/elongation zone. Arrows indicate activation and blunt-ended lines indicate inhibition.
Plants 14 00473 g001
Figure 2. Protein motifs, domains, and structures of the BES1 gene family in ‘Tieguanyin’. (A) A phylogenetic tree of CsBES1 proteins was constructed using MEGAX 12.0 software. The tree was generated with the maximum likelihood method and validated through 1000 bootstrap replications, ensuring consistency and reliability. (B) Protein motifs in CsBES1 members are represented by colorful boxes, each denoting a distinct motif. (C) Conserved domains are depicted, illustrating the shared structural features of the BES1 proteins. (D) The gene structures of the CsBES1 gene family are shown. Coding sequence (CDS) regions are represented by green rectangles, untranslated regions (UTRs) are represented by yellow rectangles, and introns are represented by black lines.
Plants 14 00473 g002
Figure 3. A phylogenetic analysis of BES1 proteins from Tieguanyin (Cs), A. thaliana (At), and Solanum lycopersicum (Sl) was conducted using the neighbor-joining method with the maximum likelihood approach and 1000 bootstrap replicates. Different colors in the inner circle represent the three species, while the four subgroups of BES1 proteins (Groups I–IIIB) are distinguished by varying colors in the outer circle.
Plants 14 00473 g003
Figure 4. The distribution of CsBES1 genes across 15 chromosomes, along with evidence of genomic amplification. A line plot and heatmap display the density of CsBES1 genes along each chromosome. Black lines indicate gene pairs originating from CsBES1.
Plants 14 00473 g004
Figure 5. Comparative synteny analysis of BES1 genes across TGY, A. thaliana (A), and S. lycopersicum (B). Grey lines in the background highlight syntenic BES1 gene pairs, while red lines indicate collinearity between CsBES1 and genes from other species. Chromosome numbers are displayed at the top or bottom of their respective diagrams.
Plants 14 00473 g005
Figure 6. Schematic representation and visualization of the localization of cis-acting elements in each CsBES1 gene.
Plants 14 00473 g006
Figure 7. GO enrichment (A) and KEGG pathway and (B) analysis of BES1 genes.
Plants 14 00473 g007
Figure 8. Protein–protein interaction network generated using STRING. The size of each protein’s circle corresponds to its number of interactions, with larger circles and deeper colors indicating higher correlation.
Plants 14 00473 g008
Figure 9. Expression profiles of CsBES1 genes under various stress conditions. Error bars represent the standard deviation (SD). Statistical significance was assessed using one-way ANOVA, with the number of asterisks (*) indicating the level of significance (p < 0.05). Significant differences relative to the control group are indicated as follows: * p < 0.05, ** p < 0.01, *** p < 0.0005, and **** p < 0.0001.
Plants 14 00473 g009
Figure 10. In darkness (A), CRY1 remains in its inactive form and is unable to suppress BR signaling because it does not interact with dephosphorylated BES1. SINATs undergo self-degradation, leading to a rise in the levels of dephosphorylated BES1, while phosphorylated BES1 (pBES1) is degraded via the COP1 pathway. As a result, the ratio of dephosphorylated BES1 to pBES1 increases. The active dephosphorylated BES1 then regulates gene expression to promote hypocotyl elongation. During this phase, UVR8 predominantly resides in the cytoplasm, whereas BIM1 and functional BES1 are localized in the nucleus, where they facilitate the transcription of BR-induced genes to enhance hypocotyl growth. The meaning of ‘X’ is not to express it in this situation. In light conditions (B), CRY1 becomes activated and binds to dephosphorylated BES1, inhibiting its ability to bind DNA. The accumulation of SINATs promotes the degradation of BES1, resulting in a decrease in dephosphorylated BES1/BZR1 levels and reducing the ratio of dephosphorylated BES1/BZR1 to phosphorylated BES1/BZR1 (pBES1/pBZR1). This reduction in the ratio leads to the suppression of hypocotyl elongation. Under UV-B light, UVR8 accumulates in the nucleus, where it interacts with nuclear BIM1 and dephosphorylated BES1, blocking their DNA-binding activity and thereby repressing the transcription of BR-responsive genes and hypocotyl elongation. The varying font sizes for BES1 indicate different levels of dephosphorylated and phosphorylated BES1.
Plants 14 00473 g010
Table 1. Physical and chemical characteristics of the ‘TieguanyinBES1s including Gene Name, Gene ID, Size/aa (Size in Amino Acids), Molecular Weight/kDa (Molecular Weight in Kilodaltons), Theoretical PI (Theoretical Isoelectric Point), Grand Average of Hydropathicity, Instability Index, and Subcellular Localization.
Gene NameGene IDSize/aa
(Size in Amino Acids)
Molecular
Weight/kDa (Molecular Weight in Kilodaltons)
Theoretical PI (Theoretical Isoelectric Point)Grand Average of
Hydropathicity
Instability
Index
Subcellular
Localization
CsBES1.1CsTGY03G000190349555,357.0810.02−0.76572.8Nucleus
CsBES1.2CsTGY15G000119539544,896.929.05−0.39143.17Nucleus
CsBES1.3CsTGY04G000035137740,575.018.92−0.65481.82Nucleus
CsBES1.4CsTGY02G000073632234,442.068.6−0.60870.99Nucleus
CsBES1.5CsTGY12G000046331535,172.598.13−0.60437.02Chloroplast
CsBES1.6CsTGY03G000293569978,007.575.37−0.45437.34Nucleus
CsBES1.7CsTGY08G000209132334,725.647.61−0.60358.53nucleus
CsBES1.8CsTGY08G000098132634,687.468.81−0.60959.21nucleus
CsBES1.9CsTGY09G000259331634,258.369.25−0.70876.49nucleus
CsBES1.10CsTGY14G000064068377,043.465.96−0.51140.49nucleus
Table 2. Primer sequences used for qRT-PCR analysis of each CsBES1 genes.
Gene NameForward Primer (5′-3′)Reverse Primer (5′-3′)
CsBES1.2GGGTTAAGCAGATGGGTGGTGTTCCGGTGAGGTCGGAATG
CsBES1.3GGAGGAGGGAGGAGGAAGCCGTGCCATCGGGTTCGACTGT
CsBES1.4CAAACACTGCGACAACAACGCGATAAGTGGTGCCATCGTC
CsBES1.6TGTGGAGGCAACGTTGGTGAATTCAGGGTTGCGCCTTCCC
CsBES1.7TGGACTCCTGGGCAAAGTGGTCCCATGCCTTCACCAACCC
CsBES1.8GGGTCAGCTTCAGCAAGTCCTGGCAGCGTAACGTGATGAG
CsBES1.9CGCCAACTATGGTCCCAACCGCTTCACTGGGACGCTTTCA
CsBES1.10GTCAGGGCTGGTTCCGTGTCATCCTCGATCCCAGGCCGAA
GAPDHTTGGCATCGTTGAGGGTCTCAGTGGGAACACGGAAAGC
Disclaimer/Publisher’s Note: The statements, opinions and data contained in all publications are solely those of the individual author(s) and contributor(s) and not of MDPI and/or the editor(s). MDPI and/or the editor(s) disclaim responsibility for any injury to people or property resulting from any ideas, methods, instructions or products referred to in the content.

