Article

Phylogenetic Inferences and Historical Biogeography of Onocleaceae

1
School of Ecology and Environmental Science, Yunnan University, Kunming 650504, China
2
School of Life Sciences, Yunnan University, East Outer Ring Road, Chenggong District, Kunming 650500, China
*
Authors to whom correspondence should be addressed.
These authors contributed equally to this work.
Plants 2025, 14(4), 510; https://doi.org/10.3390/plants14040510
Submission received: 14 January 2025 / Revised: 3 February 2025 / Accepted: 6 February 2025 / Published: 7 February 2025
(This article belongs to the Section Plant Systematics, Taxonomy, Nomenclature and Classification)

Abstract

:
The family Onocleaceae represents a small family of terrestrial ferns, with four genera and around five species. It has a circumboreal to north temperate distribution, and exhibits a disjunct distribution between Eurasia and North America, including Mexico. Historically, the taxonomy and classification of this family has been subject to debate and contention among scholars, leading to contradictory classifications and disagreements on the number of genera and species within the family. Furthermore, due to this disjunct intercontinental distribution and the lack of detailed study across its wide range, this family merits further study to clarify its distributional pattern. Maximum likelihood and Bayesian phylogenetic reconstructions were based on a concatenated sequence dataset for 17 plastid loci and one nuclear locus, which were generated from 106 ingroup and six outgroup taxa from three families. Phylogenetic analyses support that Onocleaceae is composed of four main clades, and Pentarhizidium was recovered as the first branching lineages in Onocleaceae. Molecular dating and ancestral area reconstruction analyses suggest that the stem group of Onocleaceae originated in Late Cretaceous, with subsequent diversification and establishment of the genera Matteuccia, Onoclea, Onocleopsis, and Pentarhizidium during the Paleogene and Neogene. The ancestors of Matteuccia, Onoclea, and Onocleopsis could have migrated to North America via the Beringian land bridge or North Atlantic land bridge which suggests that the diversification of Matteuccia + Onoclea + Onocleopsis closely aligns with the Paleocene-Eocene Thermal Maximum (PETM). In addition, these results suggest that Onocleaceae species diversity peaks during the late Neogene to Quaternary. Studies such as this enhance our understanding of the mechanisms and climatic conditions shaping disjunct distribution in ferns and lycophytes of eastern Asia, North America, and Mexico and contribute to a growing body of evidence from other taxa, to advance our understanding of the origins and migration of plants across continents.

1. Introduction

The onocleoid ferns form a distinct group distinguished morphologically by rhizomes long- to short-creeping to ascending, sometimes stoloniferous, having dimorphic leaves, petioles with two vascular bundles, and thickened petiole bases, sori enclosed (sometimes tightly) by reflexed laminar margins, also with membranous, often fugacious true indusia, and chlorophyllous spores [1,2,3]. Onocleaceae Pic.Serm. is a lineage of terrestrial ferns with few species [2,3], which are generally accepted to include four genera (Matteuccia Tod., Onoclea L., Onocleopsis F.Ballard, Pentarhizidium Hayata) and about five species (e.g., Matteuccia struthiopteris (L.) Tod., Onocleopsis hintonii F.Ballard, Onoclea sensibilis L., Pentarhizidium intermedium (C.Chr.) Hayata, Pentarhizidium orientale (Hook.) Hayata; [4]). Although the species delimitation of Onocleaceae has rarely been controversial [5,6,7,8,9], the generic and infraspecific classification within Onocleaceae has been notoriously contentious [2,4,5,6,7,8,10,11,12,13].
Copeland [5], Llyod [6], and Tryon and Tryon [7] recognized that Onocleaceae consisted of three genera (Matteuccia, Onocleopsis, and Onoclea) and five species (Matteuccia struthiopteris, M. intermedia C.Chr., M. orientalis (Hook.) Trevis., Onocleopsis hintonii, Onoclea sensibilis). Kato and Sahashi [10] established a bi-generic (Matteuccia and Onoclea) classification of Onocleaceae, where each genus is subdivided into two sections (M. sect. Matteuccia [M. struthiopteris, M. intermedia], M. sect. Onocleopsis [M. hintonii (F.Ballard) M.Kato]; O. sect. Onoclea [O. sensibilis, O. sensibilis var. interrupta Maxim.], O. sect. Pentarhizidium [O. orientalis (Hook.) Hook.]). However, it should be noted that Kato and his collaborators have twice circumscribed the species of Matteuccia (M. orientalis, M. intermedia) into Onoclea (O. orientalis, O. intermedia (C.Chr.) M.Kato) and later on re-circumscribed these taxa at the rank of variety where O. sensibiliis is recognized as a North American endemic, and O. sensibilis var. interrupta as an East Asian endemic [10,11]. Kramer [8] returned to the tri-generic classification system of Copeland [5] and five-species classification of Onocleaceae, but diverged by recognizing that Onoclea is composed of only two sections (O. sect. Onoclea and O. sect. Pentarhizidium) and by placing Matteuccia intermedia into Onoclea sect. Pentarhizidium.
Gastony and Ungerer [1] first integrated nucleotide sequences of the plastid rbcL gene to infer the phylogenetic relationship of Onocleaceae based on 10 samples, which included all five species. Due to the limited number of informative sites in plastid markers, such as rbcL, the phylogenetic relationships between species have not been well supported (Maximum Parsimony Bootstrap Support [MP-BS] = 71–100; Maximum-Likelihood Bootstrap Support [ML-BS] = 67–100). Gastony and Ungerer [1] proposed two alternative classifications of Onocleaceae: (1) Four genera (Matteuccia [M. struthiopteris], Onoclea [O. sensibilis, O. sensibilis var. interrupta], Onocleopsis [O. hintonii], Pentarhizidium [P. intermedium (C.Chr.) Hayata, P. orientale (Hook.) Hayata]); (2) Three genera (Matteuccia [but divided into two sections, M. sect. Matteuccia (M. struthiopteris), M. sect. Onocleopsis [M. hintonii], Onoclea [O. sensibilis, O. sensibilis var. interrupta], and Pentarhizidium [P. intermedium, P. orientale]). More recently, Christenhusz et al. [13] circumscribed the family as a single genus Onoclea, but most pteridologists disagree with this circumscription, and recognize the four genera system as the accepted classification [2,3,4,12,14,15,16]. Following the study of Gastony and Ungerer [1], up to five accessions, and as many as five plastid makers, have been used to infer the phylogenetic relationship of Onocleaceae [14]. However, further research such as plastomes (chloroplast genomes), single-molecule sequencing, transcriptome sequencing, whole genome sequencing, and so on, have yet to confirm the phylogenetic relationships between species in the family Onocleaceae across their vast intercontinental ranges.
Another aspect warranting more detailed study in Onocleaceae concern its origins and disjunct distribution patterns. Onocleaceae is composed of five species largely distributed in north-temperate regions and Mexico [2,16,17]. Pentarhizidium contains two species and is the only genus in the family endemic to eastern Asia [3,17]. The most widely distributed species is Matteuccia struthiopteris, which is circumboreal in the northern hemisphere near river banks and is found floodplain forests [18]. Onocleopsis hintonii is a rare species and endemic to wet mountain canyons in southern Mexico and Guatemala [19]. Onoclea sensibilis is widely distributed in northern Asia and throughout central and eastern North America, where it is common near marshes, lakes, moist woodlands and other riparian environments [20]. Onoclea sensibilis has one of the most familiar and well-documented disjunct distribution between East Asian and North American fern species [16,21,22,23]. A vicariance hypothesis to explain this disjunct distribution has been proposed and is supported by fossil evidence which found that the O. sensiblis group was widely distributed in Alaska, Canada, the United States, Europe, and Japan in the Cretaceous and Tertiary [24], but it is suspected that long-distance dispersal (LDD) may also played a role in the history of this group [25].
Furthermore, the backbone support for species relationships remain poorly supported in this family [1]. Molecular dating analyses might be help to further clarify this point. The species level relationships and extant distributions in the family Onocleaceae merit further study in several areas. First, there is a need to determine for whether the disjunct populations of Onoclea sensibilisis should be treated as distinctly different species. Previous studies had suspected that O. sensibilis from Asian and North America were shown to be phylogenetically differentiated from each other, with only 4–7 bp different in rbcL [1]. Additionally, there is still outstanding disagreement on whether the extinct species, such as O. fecunda, are the same species as the extant species O. sensibils [26,27]. Other researchers have identified fossil evidence as extinct species, such as O. fecunda [28], O. hebridica [29], and O. hesperia [28]. Moreover, there is a clearly understudied aspect of the family in general, and a need to perform an ancestral area reconstruction to test various historical hypotheses.
In this context, the present study aims to achieve the following goals: (1) Generate and annotate novel plastomes for the Onocleaceace species; (2) Perform a phylogenetic reconstruction for the family; (3) Propose a biogeographic hypothesis for the origins, dispersal, and migration to their extant distributions.

2. Materials and Methods

2.1. Taxon Sampling, DNA Extraction and Sequencing

In the present study, 12 specimens from different locations or populations were newly sampled and genome skimming data were generated for the following taxa: Matteuccia struthiopteris, Onoclea sensibilis, O. sensibilis var. interrupta, Pentarhizidium orientale, P. intermedium, Woodwardia japonica (L.f.) Sm (Table 1 and Table S1). Total genomic DNA was extracted from silica-dried material using the TIANGEN plant genomic DNA extraction kit (TIANGEN Biotech., Beijing, China) following the manufacturers’ protocols. Sequencing was conducted on the Illumina NovaSeq 6000 platform at Biomaker Technology Co., Ltd. (Beijing, China) with paired-end sequence and an insert size of 350 bp. Voucher specimens for all the materials were deposited at PYU (Table 1 and Table S1), and 3.72 ± 0.62 Gbp of raw data were obtained for each sample.

2.2. Plastome Assembly, Annotation, and Phylogenetic Analysis

Sequencing adapters, reads containing Ns, and low-quality bases were removed with Fastp v0.12.4 [30] with default parameters. Plastid sequence reads were assembled using the software GetOrganelle v1.7.5 [31], with the reference plastid genomes of Matteuccia struthiopteris (NC035859; [32]). Each plastid genome was initially annotated using GeSeq [33] and CPGAVAS2 [34]. Start and stop codons of all loci were manually checked in Geneious Prime 2019.2.1. For any uncertain protein-coding genes, a Blastn search was performed with default parameter settings, and all tRNAs was verified using tRNAscan-SE v2.0 web server [35]. All the plastid genome sequences were deposited in GenBank (Table 1), circular gene map drawn by OmicsSuite v1.3.9 [36], and manually modified accordingly for clarity and accessibility. Additionally, the “embplant_nr” module was used to assemble Embryophyta plant nuclear ribosomal RNA (18S-ITS1-5.8S-ITS2-26S). In order to integrate all available public data, 13 plastid coding regions (accD, atpA, atpB, matK, psbA, rbcL, rps4, trnF, trnG, trnH, trnL, trnR, trnS), 4 plastid non-coding regions (psbA-trnH spacer, rps4-trnS spacer, trnG-trnR spacer, trnL-trnF spacer), and 1 nuclear maker (ITS) of 100 taxa were downloaded from GenBank, and the novel 18 loci were extracted and included for phylogenetic analyses. When necessary, five additional species belonging to Woodsiaceae, Athyriaceae, and Blechnaceae were chosen as outgroups [4,37]. In total, 112 taxa were included for sequent analyses (Table S2). Sequences were aligned with MAFFT v7.450 [38] implemented in Geneious Prime before concatenation. The alignments were manually assembled and edited using BioEdit v7.0.5.3 [39] for quality control and to remove ambiguous sites. To infer the appropriate nucleotide substitution model for the phylogenetic analyses, ModelFinder [40] was employed, and the model was selected based on the bias-corrected Akaike information criterion (AICc). A maximum likelihood (ML) tree was generated by performing a rapid bootstrap analysis on IQ-tree v2.1.3 [41] with the selected GTR + F + I + G4 model for both partitions. After 5000 rapid bootstrap search step, ML bootstrap values (ML-BS) from each node were visualized using FigTree v1.4.3 [42]. The Bayesian inference (BI) analysis was performed in MrBayes v3.2.7 [43] based on the model identified in the ModelFinder analysis, using one million generations with one tree sampled every one thousand generations; four runs with four chains were performed in parallel. The first 25% of trees were discarded as burn-in. The standard deviation of splits frequencies below 0.001, and the Markov Chain Monte Carlo (MCMC) output was examined to check for convergence and to ensure that all of the effective sample size (ESS) values were >200. Four chains were run, each for two million generations, and were sampled every one hundred generations, with a random starting tree. Bayesian posterior probabilities (BI-PP) were calculated for the majority consensus tree of all sampled trees after discarding trees sampled within the burn-in phase in MrBayes. In addition, we implemented two measures for quantifying genealogical concordance in concatenated datasets through IQ-tree: the gene concordance factor (gCF) and the site concordance factor (sCF) [44,45].
Table 1. Taxa and plastomes features overview used in this study.
TaxonPlastome Size (bp)GC Content (%)LSC Size (bp)LSC GC Content (%)SSC Size (bp)SSC GC Content (%)IR Size (bp)IR GC Content (%)VoucherHerbarium AcronymsLocationGenBank IDReference
Matteuccia struthiopteris (L.) Tod.151,10144.281,97443.721,69542.123,71646.1YUS8847PYUChina, SichuanPP712888This study
Matteuccia struthiopteris (L.) Tod.151,07844.382,02043.821,67242.223,69346.1Wei Q. et al. FB854KUNChina, YunnanMT130666[37]
Matteuccia struthiopteris (L.) Tod.151,00344.381,96443.821,67542.223,68246.1WR0331PEChina, BeijingNC035859[32]
Onoclea sensibilis L.148,60444.481,58844.121,73042.522,64345.9ZhouXM677PYUUSA, Cult.PP712887This study
Onoclea sensibilis L.148,39544.481,57144.121,72642.622,54945.8WR0327PEChina, BeijingNC035860[32]
Onoclea sensibilis var. interrupta Maxim.138,25944.775,51844.317,05742.922,90345.9ZhaoJingLNPYUChina, LiaoningPP712885This study
Onoclea sensibilis var. interrupta Maxim.141,82644.677,87144.319,08942.922,03945.9ZhaoJingLN3PYUChina, LiaoningPP712886This study
Onoclea sensibilis var. interrupta Maxim.148,73944.481,62944.121,74442.522,68345.9Lu J.M. Lu472KUNChina, JilinMT130573[37]
Pentarhizidium intermedium (C.Chr.) Hayata151,16844.282,55443.721,62042.223,49746YUS7829PYUChina, YunnanPP712890This study
Pentarhizidium intermedium (C.Chr.) Hayata151,16744.282,55543.721,62042.223,49646YUS7844PYUChina, YunnanPP712889This study
Pentarhizidium intermedium (C.Chr.) Hayata151,17544.282,56243.721,61942.223,49746YUS9511PYUChina, YunnanPP712891This study
Pentarhizidium orientale (Hook.) Hayata151,2794482,64643.521,59141.923,52145.9YUS6905PYUChina, YunnanPP712894This study
Pentarhizidium orientale (Hook.) Hayata151,3334482,62843.521,59141.923,55745.9YUS8029PYUChina, YunnanPP712895This study
Pentarhizidium orientale (Hook.) Hayata151,2034482,57143.521,59041.923,52145.9YUS9702PYUChina, YunnanPP712893This study
Pentarhizidium orientale (Hook.) Hayata151,2024482,57043.521,59041.923,52145.9YUS10377PYUChina, YunnanPP712892This study
Pentarhizidium orientale (Hook.) Hayata151,2434482,61043.521,59141.923,52145.9Lu J.M. Lu715KUNChina, JiangxiMT130641[37]
Woodwardia japonica (L.f.) Sm.153,70843.282,37742.421,55940.524,88645.8YUS8839PYUChina, SichuanPP712896This study

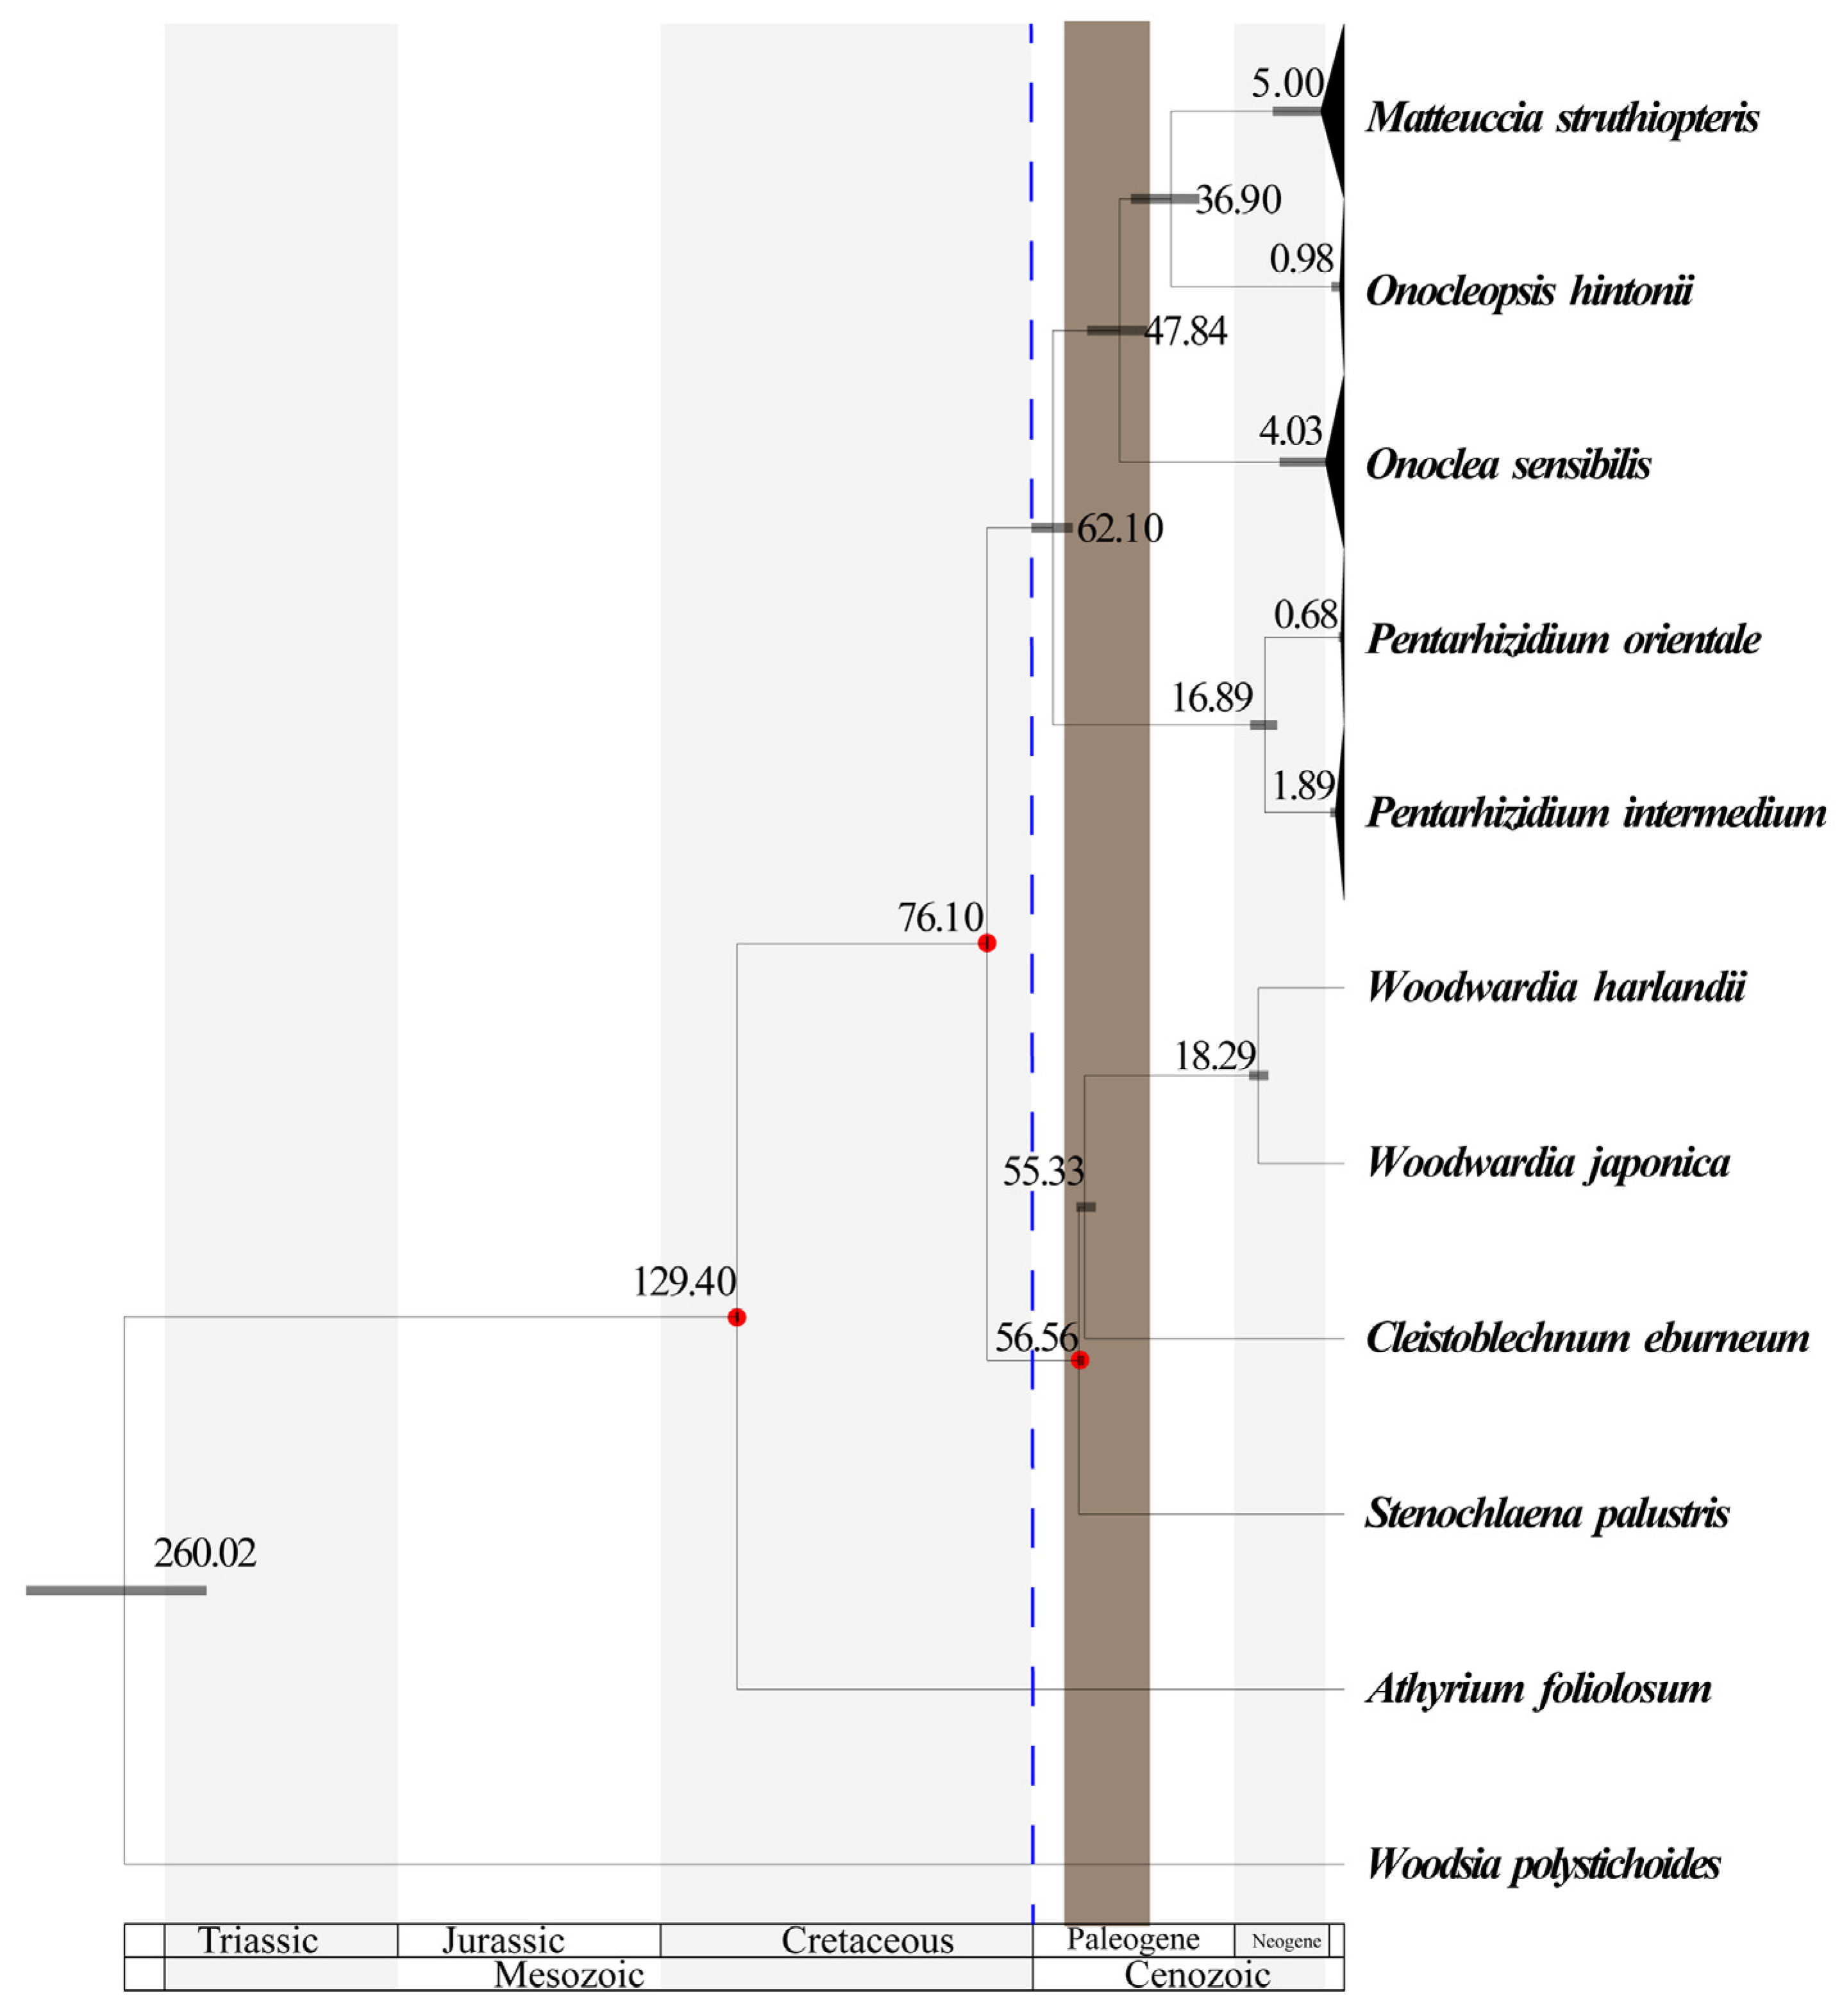
2.3. Molecular Dating and Historical Biogeography

Following the guideline of Maurin [46], penalized likelihood dating analysis was undertaken in treePL v2.6.3 [47] using the same sequence partitions as in phylogenetic analyses. One thousand bootstrap replicates using the best ML tree as a topology constraint were conducted in IQ-tree. Randomly sampled cross-validation analysis for the best ML tree was conducted with rate-smoothing values from 1010 to 10−30 and a multistep of 0.1, which resulted in an optimal smoothing parameter. Then, the bootstrap trees were dated using the best smoothing values. The output trees were used to summarize the maximum clade credibility (MCC) tree and confidence interval using TreeAnnotator v2.6.3 [48]. Three fossil calibration points were employed in this study as the minimum and the maximum age constraints in the divergence time estimates: (1) a fossil of Athyrium cretaceum Chen et Meng as the stem age of Athyriaceae reported from Neocomian (Berriasian– Hauterivian) (129.4–145.0 Ma; [49]) was used recently in dating analyses [37]; (2) a fossil of Woodwardia (72.5–76.1 Ma; [50]) found in south-central New Mexico was used here to constrain the divergence between Blechnaceae and Onocleaceae, which also was used recently in dating analyses [37]; (3) a fossil of Woodwardia gravida Hickey reported from the late Palaeocene (55.4–56.8 Ma; [51]), which was used here as the stem node of Blechnaceae being extensively utilized in other fern and lycophyte molecular dating analyses (e.g., [37,52,53,54]).
Five continental and subcontinental regions were delineated based on the occurrence records of the extant taxa, including (A) South Asia, (B) East Asia, (C) Palearctic, (D) North America, and (E) Mexico. Ranges of extant taxa were determined from a survey of the literature [6,10,17,19,55,56], herbaria, field work, and online databases of GBIF (https://www.gbif.org; [57]), Tropicos (http://www.tropicos.org), and JSTOR (http://plants.jstor.org/). To infer the ancestral distribution within Onocleaceae, we used the chronogram resulting from treePL as the input file to perform an ancestral area reconstruction after removing outgroup taxa. We first tested the best-fitted models available in the R package BioGeoBEARS [58] by time stratification events. A dispersal multiplier matrix was specified following the definition of Buerki et al. [59] and Wei et al. [60]: low dispersal = 0.01; medium dispersal = 0.5; high dispersal = 1.0 (Table S3), and analyses were carried out with a distance matrix. We tested the six models (DEC, DEC + J, DIVALIKE, DIVALIKE + J, BAYAREALIKE, BAYAREALIKE + J; [61]) implemented in BioGeoBEARS, the model with the highest AICc weight value selected has the best fitting model, and the maximum area number was set to four. We also estimated the number and type of biogeographic events in RASP v4.4 [62]. After providing a biogeographical model, the stochastic mapping algorithm generates simulations across nodes and branches of the provided phylogeny [63], including the times and locations of all events along the branches in that simulation. Event frequencies were taken to be the mean of event counts from 50 simulations.

3. Results

3.1. Plastome Organization and Features

The newly sequenced plastomes of the 12 individuals of Onocleaceae exhibited a typical quadripartite structure and included a large single-copy (LSC) region and a small single-copy (SSC) region separated by two inverted repeat (IR) copies (Figure 1). By integrating all complete plastomes of Onocleaceae available in GenBank (Table 1), the plastome size ranged from 138,259 bp in Onoclea sensibilis var. interrupta to 151,333 bp in Pentarhizidium orientale. The overall GC content ranged narrowly from 44.0% to 44.7%, whereas the GC content in the LSC, SSC, and IR regions varied from 43.5% to 44.3%, 41.9% to 42.9%, and 45.9% to 46.0%, respectively (Figure 1; Table 1). We observed only marginal variation in the IR length, which ranged from 22,039 bp in O. sensibilis var. interrupta to 23,716 bp in Matteuccia struthiopteris (Table 1). Substantial length variation was evident in the LSC and SSC, with LSC ranging from 75,518 bp in O. sensibilis var. interrupta to 82,646 bp in Pentarhizidium orientale, and SSC ranging from 17,057 bp in O. sensibilis var. interrupta to 21,695 bp in M. struthiopteris (Table 1).The plastomes of all 12 accessions of Onocleaceae encoded a set of 130 genes, of which 117 were single-copy and 13 were duplicated gene pairs in the IR regions (Figure 1). Among the 117 unique genes, there were 85 protein-coding genes, 28 tRNA genes, and four rRNA genes (Figure 1). Five tRNA genes and nine protein-coding genes contained a single intron, and three genes including rps12, clpP, and ycf3 contained two introns (Figure 1). The 5′-end exon of the rps12 gene was located in the LSC region, and the intron and 3′-end exon of the gene were situated in the IR region (Figure 1).

3.2. Phylogenetic Relationships

The BI tree of Onocleaceae reconstructed from the combined dataset are shown in Figure 2, and the dataset consists of the 13 plastid coding regions (accD, atpA, atpB, matK, psbA, rbcL, rps4, trnF, trnG, trnH, trnL, trnR, trnS), four plastid non-coding regions (psbA-trnH spacer, rps4-trnS spacer, trnG-trnR spacer, trnL-trnF spacer), and one nuclear gene marker (ITS) was 12,422 nucleotides in length.
The monophyly of Onocleaceae was strongly supported at the crown node with 100% ML-BS, a BI-PP of 1.00, 100% gCF, and 39% sCF (Figure 2). ML and BI analyses recovered four main clades, each supported by high statistical values (ML-BS and BI-PP; Figure 2). Almost all major branches within the ingroup were strongly supported (ML-BS = 100; BI-PP = 1.0; gCF = 90% to 100%; sCF = 36% to 62%; Figure 2). Pentarhizidium was recovered in a clade with two monophyletic species sisters to the rest of the family which are the only lineage endemic to Asia (Figure 2). Onoclea was recovered sister to a clade composed of the circumboreal M. struthiopteris and the Mexican endemic Onocleopsis. In addition, a monophyletic Onoclea sensibilis var. interrputa was not supported by the phylogenetic analysis and there was no clear geographic pattern based on the topology in the recovered phylogenetic inferences (Figure 2). The remaining lineages were composed of two monotypic genera (Figure 2), Matteuccia struthiopteris has a circumboreal distribution, while Onocleopsis hintonii is only found in the Neotropics (Table 2; Figure 2).

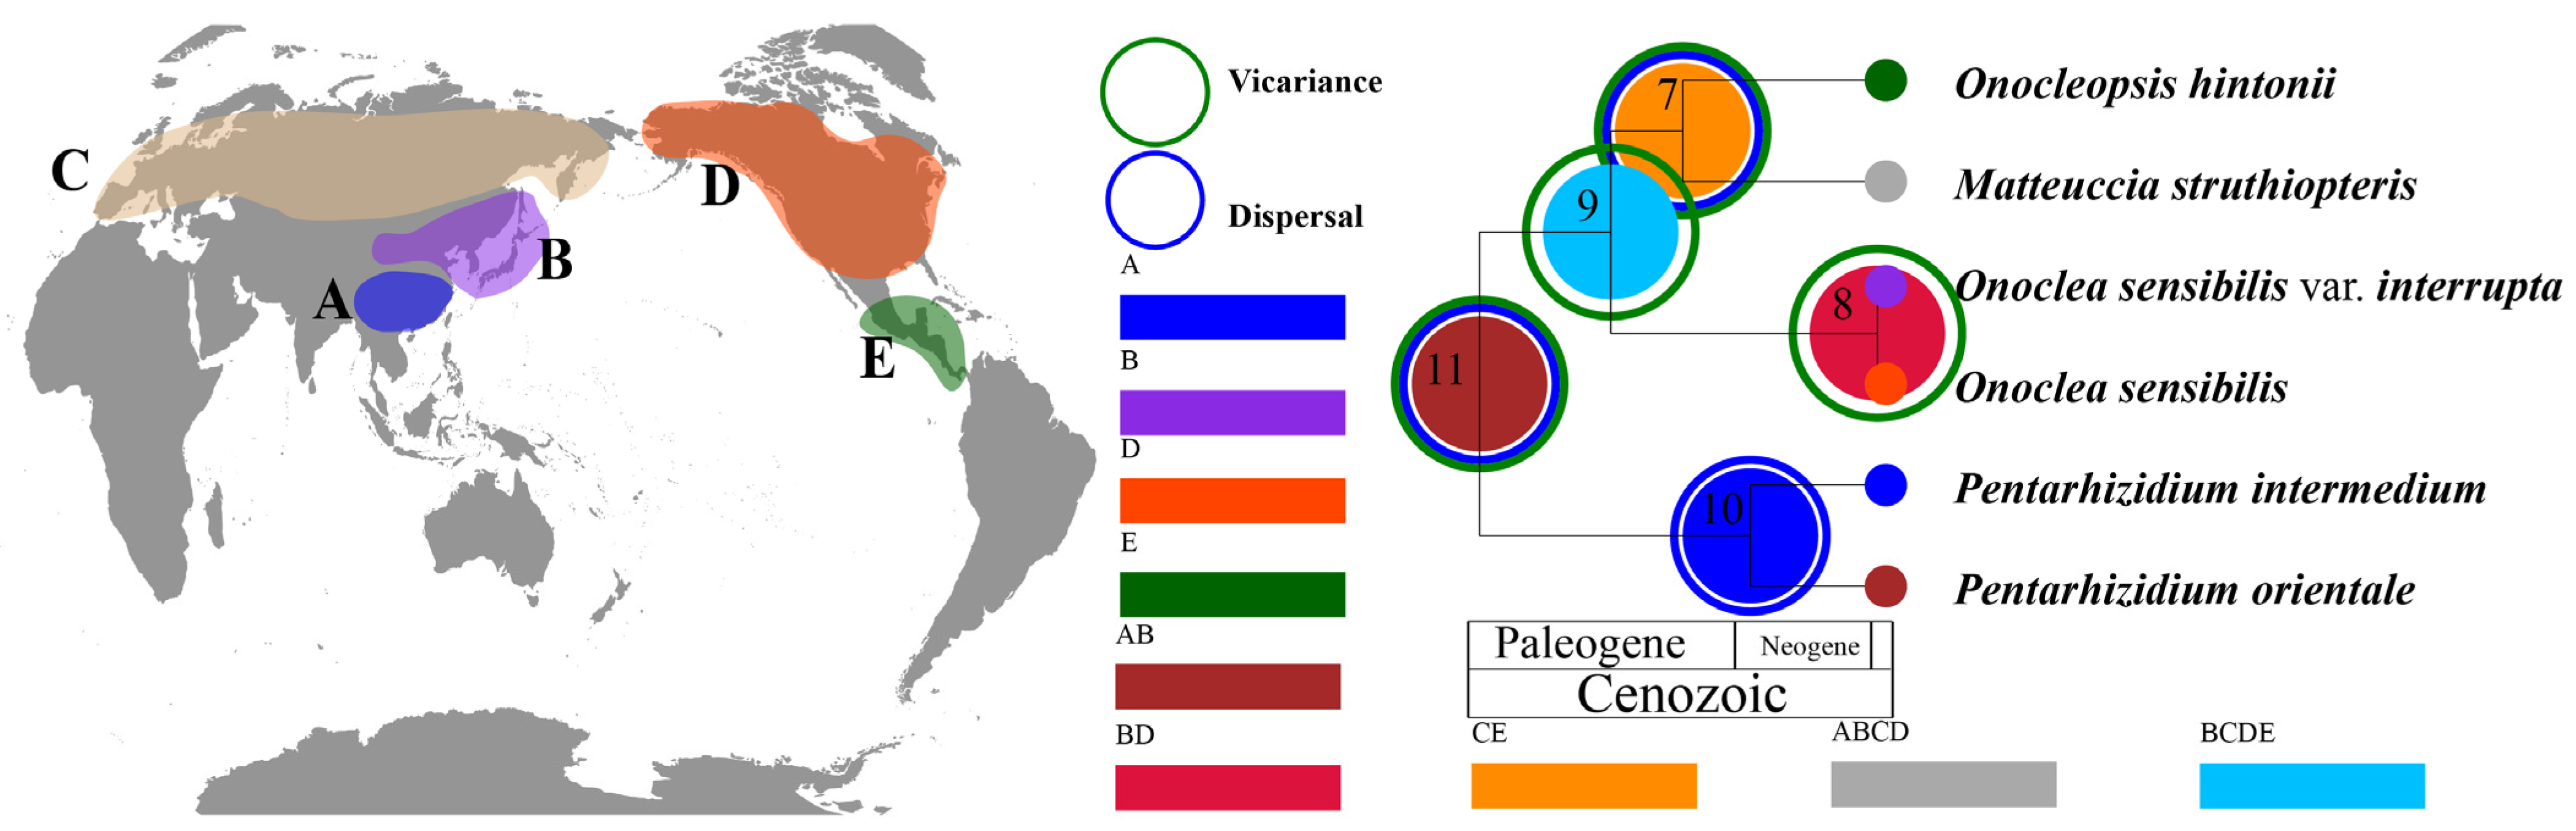
3.3. Biogeographic History and Ancestral Area Reconstruction

The molecular dating analysis estimated divergence between Onocleaceae and Blechnaceae to be 76 Ma (95% highest posterior density (HPD) ranged from 76.0 to 76.1 Ma; late Cretaceous; Figure 3). The crown of Onocleaceae diversified in the early Paleogene (95% HPD ranged from 57.9 to 66.7 Ma) with the subsequent establishment of the genera Matteuccia, Onoclea, Onocleopsis, and Pentarhizidium during the Paleogene and Neogene and these genera subsequently diversified from the late Neogene to the Quaternary (0.68 to 5 Ma; Figure 3). The estimated age for the split between Onoclea and Matteuccia + Onocleopsis was Eocene (95% HPD ranged from 42.0 to 54.7 Ma; Figure 3). The estimated age for the split between Matteuccia and Onocleopsis was between the Oligocene and the Eocene (95% HPD ranged from 30.8 to 45.5 Ma; Figure 3).
The best fitting biogeographic model was DIVALIKE with the highest AICc weight value (Table 3). Asia was recovered as the most probable ancestral area (11.22%; Table S4) for the Onocleaceae crown node (node 11; Figure 4). For each of the three genera of Matteuccia, Onoclea, and Onocleopsis, we found evidence of Asian origins followed by migration to (C) Palearctic, (D) North America, and (E) Mexico. We detected three dispersal events and four vicariance events within Onocleaceae (Figure 4).

4. Discussion

4.1. Conservative Plastome Characteristics in Onocleaceae

In recent times, the growing availability of new plastome data from lycophytes and ferns has facilitated a clearer understanding of the evolutionary trends in structural variations within vascular plant plastomes [64,65,66,67]. Previous research works have established the observed patterns of plastome variation in ferns and lycophytes, encompassing inversions, shifts in IR boundaries, and alterations in gene content [68,69]. However, our results demonstrate that the gene number, gene order, and GC content of the plastid genome are largely consistent among eupolypods II and other polypod ferns [32,70,71,72]. Generally, we also supported that the plastome structure and gene content are highly conserved across Cretaceous to Cenozoic among members of the eupolypods II (Figure 1; Table 1; [32,66]).

4.2. Systematic Implications

The phylogenetic results of this study are largely in agreement with prior results that were based on a smaller sample of individuals [1,14]. Onocleaceae formed a well-supported clade (ML-BS = 100; BI-PP = 1.0; Figure 2). The inferred phylogenetic tree includes all six currently recognized taxa in the family, and strongly supports that this family contains four distinct evolutionary lineages (Figure 2). With the exception of the genus Pentarhizidium, which was recovered with two species, all other clades contained only one species (Figure 2 and Figure 3). It worth noting that Matteuccia recovered a sister to Onoclea based on nuclear loci, but Matteuccia recovered a sister to Pentarhizidium based on concatenated plastid locus (available at: doi.org/10.6084/m9.figshare.25203950, accessed on 11 November 2024), which implied there were might ancient gene flow [73,74] existed but need further study. In this study, P. orientalis and P. intermedia from Asia were recovered sister to the rest of the family with the other genera diversifying after Pentarhizidium had already diverged from the common ancestor to the family (Table 2; Figure 2, Figure 3 and Figure 4). Gastony and Ungerer [1] proposed to consider Onoclea interrupta (Maxim.) Gastony and Ungerer as a distinct species, endemic to eastern Asia and O. sensibilis as a species endemic to eastern North America. Maximowicz [75] recognized the Asian specimens as O. sensibilis var. interrupta Maxim based on the longer fertile frond, and sorus-bearing segments remote from each other. Our ML analysis also found that O. sensibilis formed two independent branches with weak support (available at: doi.org/10.6084/m9.figshare.25203950, accessed on 11 November 2024), but the BI analysis did not support that population of O. sensibilis from Asia to be sufficiently differentiated from North American populations to recognize O. interrupta at the species level (Figure 2). The specimens as O. sensibilis fossilis reported from Middle to late Paleocene (ca. 56 Ma), which might represent an extinct species or ancestor to the extant species [28,29]. In addition, molecular dating in this analysis recovered the stem age of extant O. sensibilis to have originated during the Paleogene around 47.84 Ma and the crown node of this species was recovered in the Pliocene (5 Ma; Figure 3). Furthermore, the four genera have been regarded as a single genus Onoclea [13]. We support Onocleaceae consists of four clades (Figure 2 and Figure 3; Table 2), and here advocate for the recognition of each clade at the genus rank in Onocleaceae based on morphological variation in addition to the results of the molecular dating and biogeographic analysis in this study. Molecular dating estimated that the stem ages of the four genera were dated back to the Paleogene, and at least four vicariance events were detected (Figure 4), which fall in the known range of previous studies using molecular based dating methods (e.g., [16,37,52,53,54,76,77]; Figure 3).

4.3. Origin and Historical Biogeography of Onocleaceae

Although the intercontinental disjunct distributions are well documented in fern resulting from the breakup of the Gondwanan supercontinents [76], the divergence times between the Onocleaceae and Blechnaceae lineages recovered in this study are too recent to be explained by a vicariance caused by the breakup of the Gondwana (120–140 Ma) [78]. Our results support an origin of crown Onocleaceae on continental Asia at around 62 Ma with both long-distance dispersal events and vicariance events to have occurred from continental Asia to other regions during the Paleogene (Figure 3 and Figure 4; Table S4). These results are consistent with the fossil record and previous studies using divergence time estimation to indicate that Onocleaceae originated during the Paleogene [54,76,79]. It is worth noting that thousands of fossils Onoclea specimens have been collected in the Paleocene sediments, and the molecular dating results (Figure 3) indicated that due to the Cretaceous Paleocene (K-Pg) extinction event, and the drastic environmental changes around the K-Pg boundary at that time led to the extinction of a large number of Onocleaceae [16,77,80,81,82]. Additionally, the abiotic and biotic factors after the K-Pg boundary may have facilitated the diversification of the other lineages within the family of Onocleaceae (Figure 3). Although Pentahizidium is now widely distributed in both (A) South Asia and (B) East Asia (Figure 4; Table S4), the ancestral area of Pentarhizidium was assumed that area (A) South Asia is most likely the original area (node 10; Figure 4; Table S4). The dispersal of Pentarhizidium from South Asia to East Asia could have happened after experiencing many rapid uplifts and unroofing of the Hymalayas. During this period (95% HPD ranged from 14.3 to 20.0 Ma; Figure 3), the collision between India and Asia (~22–25 Ma) resulted in the orogeny, which in turn altered the formation of landforms and climate zones in the region of Indochina [83]. Some fern genera, such as Pyrrosia [84] and Platycerium [85], have also been reported to have such patterns. The diversification of Matteuccia + Onoclea + Onocleopsis closely aligns with the Paleocene-Eocene Thermal Maximum (PETM), a period during which a well-documented boreotropical flora was extensively distributed in the high northern latitudes [86,87]. Our results show that intercontinental migration events in Onocleaceae occurred in the Eocene (36.9–47.8 Ma) (Figure 3 and Figure 4). The biogeographic analysis supports the ancestral range of the ancestor of Matteuccia + Onoclea + Onocleopsis to be widespread in the Northern Hemisphere (node 9; Figure 4; Table S4). The fossil record showed Onoclea was widely distributed in North America, Europe, and Japan in the Cretaceous and Tertiary [27] which supported the hypothesis that Onocleaceae once had a wider distribution. For Onoclea, paleogeographic changes and/or climatic cooling as well such as competition from other cold-adapted species during the Eocene had probably caused habitat reduction and extensive extinction of Onoclea species in the Northern Hemisphere. Starting from the early Eocene, global climate showed an overall cooling with a sharp temperature drop at the end of the Eocene termed the terminal Eocene event [88,89]. We hypothesize that the ancestors of Matteuccia + Onoclea + Onocleopsis could have migrated via the Beringian land bridge (BLB), which connected the two continents at least until the Quaternary, and the North Atlantic land bridge (NALB), which existed from the Late Cretaceous to the Paleogene [90,91]. The extant species of Onocleaceae have a higher species diversity during the late Neogene to Quaternary might be influenced by paleoclimate change ([16] Figure 3). Throughout the Neogene and Quaternary periods, climatic variations and major geological events also may have been influential in driving complex processes of migration/dispersal, extinction, and speciation, resulting in intercontinental disjunct distributions of plants in the Northern Hemisphere [92].
Taken together, our results enhance our understanding of the mechanisms and climatic conditions shaping disjunct distribution of ferns and lycophytes in eastern Asia, North America, and Mexico and contribute to a growing body of evidence from other taxa, advancing our understanding of the origins and migration of plants across continents.

Supplementary Materials

The following supporting information can be downloaded at: https://www.mdpi.com/article/10.3390/plants14040510/s1, Table S1: Collect information of taxa newly sampled; Table S2: List of taxa sampled with information related to taxonomy, GenBank accession numbers, references, and voucher information; Table S3: Dispersal matrix. Five continental and subcontinental regions were delineated: (A) South Asia, (B) East Asia, (C) Palearctic, (D) North America, and (E) Mexico.; Table S4: Ancestral range estimation for each node.

Author Contributions

H.Y., X.-M.Z. and Z.-R.H. designed the research; J.Z. and J.-G.W. performed the research; J.Z., Y.-P.H., C.-J.H., S.-L.F., Z.-Y.W. and R.-J.L. contributed materials; J.Z. and J.-G.W. analyzed data; and J.Z., Z.-R.H., X.-M.Z. and J.-G.W. wrote the paper. J.Z. and J.-G.W. contributed equally to this work. The authors also thank the anonymous referees and editors for their critiques and suggestions which greatly improved our manuscript. All authors have read and agreed to the published version of the manuscript.

Funding

The authors thank the support of Yunnan Provincial Department of Education Science Research Fund Project (Grant No. 2023Y0202), Yunnan Fundamental Research Projects (Grant No. 202301BF07001-016), and National Science & Technology Fundamental Resources Investigation Program of China (Grant No. 2022FY100201).

Data Availability Statement

The multiple sequence alignments, concatenated alignments, and phylogenetic trees for this study are publicly available at Figshare repository: https://doi.org/10.6084/m9.figshare.25203950, accessed on 11 November 2024.

Conflicts of Interest

The authors declare no conflicts of interest.

References

  1. Gastony, G.J.; Ungerer, M.C. Molecular systematics and a revised taxonomy of the onocleoid ferns (Dryopteridaceae: Onocleeae). Am. J. Bot. 1997, 84, 840–849. [Google Scholar] [CrossRef] [PubMed]
  2. Smith, A.R.; Pryer, K.M.; Schuettpelz, E.; Korall, P.; Schneider, H.; Wolf, P.G. A classification for extant ferns. Taxon 2006, 55, 705–731. [Google Scholar] [CrossRef]
  3. Rothfels, C.J.; Sundue, M.A.; Kuo, L.-Y.; Larsson, A.; Kato, M.; Schuettpelz, E.; Pryer, K.M. A revised family–level classification for eupolypod II ferns (Polypodiidae: Polypodiales). Taxon 2012, 61, 515–533. [Google Scholar] [CrossRef]
  4. PPGI. A community-derived classification for extant lycophytes and ferns. J. Syst. Evol. 2016, 54, 563–603. [Google Scholar] [CrossRef]
  5. Copeland, E.B. Genera filicum. In Chronica Botanica; Chronica Botanica Company: Waltham, MA, USA, 1947. [Google Scholar]
  6. Lloyd, R.M. Systematics of the Onocleoid Ferns, (University of California Publications in Botany); University of California Press: Berkeley, CA, USA, 1971; Volume 61, pp. 1–93. [Google Scholar]
  7. Tryon, R.M.; Tryon, A.F. Ferns and Allied Plants with Special Reference to Tropical America; Springer: New York, NY, USA, 1982. [Google Scholar]
  8. Kramer, K.U. Dryopteridaceae. In The Families and Genera of Vascular Plants, Pteridophytes and Gymnosperms; Kubitzki, K., Green, P.S., Eds.; Springer: Berlin, Germany, 1990; Volume 1, pp. 101–144. [Google Scholar]
  9. Hasebe, M.; Wolf, P.G.; Pryer, K.M.; Ueda, K.; Ito, M.; Samo, R.; Gastony, G.J.; Yokoyama, J.; Murakami, N.; Crane, E.H.; et al. Fern phylogeny based on rbcL nucleotide sequences. Am. Fern J. 1995, 85, 134–181. [Google Scholar] [CrossRef]
  10. Kato, M.; Sahashi, N. Affinities in the onocleoid ferns. Acta Phytotaxon. Geo. 1980, 31, 127–138. [Google Scholar]
  11. Kato, M.; Suzuki, T.; Nakato, N. The systematic status of Matteuccia intermedia (Woodsiaceae: Pteridophyta). Fern Gaz. 1991, 14, 65–71. [Google Scholar]
  12. Smith, A.R.; Pryer, K.M.; Schuettpelz, E.; Korall, P.; Schneider, H.; Wolf, P.G. Fern classification. In Biology and Evolution of Ferns and Lycophytes; Ranker, T.A., Haufler, C.H., Eds.; Cambridge University Press: Cambridge, UK, 2008; pp. 417–467. [Google Scholar]
  13. Christenhusz, M.J.M.; Zhang, X.-C.; Schneider, H. A linear sequence of extant families and genera of lycophytes and ferns. Phytotaxa 2011, 19, 7–54. [Google Scholar] [CrossRef]
  14. Rothfels, C.J.; Larsson, A.; Kuo, L.-Y.; Korall, P.; Chiou, W.-L.; Pryer, K.M. Overcoming deep roots, fast rates, and short internodes to resolve the ancient rapid radiation of eupolypod II ferns. Syst. Biol. 2012, 61, 490. [Google Scholar] [CrossRef]
  15. Schuettpelz, E.; Rouhan, G.; Pryer, K.M.; Rothfels, C.J.; Prado, J.; Sundue, M.A.; Windham, M.D.; Moran, M.D.; Smith, A.R. Are there too many fern genera? Taxon 2018, 67, 473–480. [Google Scholar] [CrossRef]
  16. Berry, K. East Asian-eastern North American disjunction in the Onoclea sensibilis species complex: Vicariance or peripatry? Palaeobotany 2021, 12, 88–94. [Google Scholar] [CrossRef]
  17. Xing, F.-W.; Wang, F.-G.; Kato, M. Onocleaceae. In Flora of China, (Pteridophytes); Wu, Z.Y., Raven, P.H., Hong, D.Y., Eds.; Science Press: Beijing, China; Missouri Botanical Garden Press: St. Louis, MO, USA, 2013; Volume 2–3, pp. 408–410. [Google Scholar]
  18. Koenemann, D.M. Broad-scale integrity and local divergence in the fiddlehead fern Matteuccia struthiopteris (L.) Todaro (Onocleaceae). Am. Fern J. 2011, 101, 213–230. [Google Scholar] [CrossRef]
  19. Ballard, F. Further Notes on Onocleopsis. Am. Fern J. 1948, 38, 125–132. [Google Scholar] [CrossRef]
  20. Lellinger, D.B. A Field Manual of the Ferns and Fern Allies of the United States and Canada; Smithson Institute Press: Washington, DC, USA, 1985; p. 389. [Google Scholar]
  21. Li, H.-L. Floristic relationships between eastern Asia and eastern North-America. Trans. Am. Phil. Soci. 1952, 42, 371–429. [Google Scholar] [CrossRef]
  22. Kato, M. Biogeography of ferns: Dispersal and vicariance. J. Biogeogr. 1993, 20, 265–274. [Google Scholar] [CrossRef]
  23. Xiang, J.-Y.; Wen, J.; Peng, H. Evolution of the eastern Asian–North American biogeographic disjunctions in ferns and lycophytes. J. Syst. Evol. 2015, 53, 2–32. [Google Scholar] [CrossRef]
  24. Boureau, E. Traité de Paléobotanique IV(I). Filicopside; Masson et Cie: Paris, France, 1970. [Google Scholar]
  25. Barrington, D.S. Ecological and historical factors in fern biogeography. J. Biogeogr. 1993, 20, 275–280. [Google Scholar] [CrossRef]
  26. Newberry, J.S. Notes on the latter extinct floras of North America, with descriptions of some new species of fossil plants from the Cretaceous and Tertiary strata. Lyceum Nat. Hist. N. Y. Ann. 1868, 9, 1–76. [Google Scholar]
  27. Rothwell, G.W.; Stockey, R.A. Fossil Ophioglossales in the Paleocene of Western North America. Am. J. Bot. 1989, 76, 637–644. [Google Scholar] [CrossRef]
  28. Brown, R.W. Paleocene flora of the Rockey Mountains and Great Plains. Geol. Surv. Prof. Pap. 1962, 375, 1–119. [Google Scholar]
  29. Gardner, J.S.; Ettingshausen, C. A Monograph of the British Eocene Flora; Filices Paleontological Society: London, UK, 1879; Volume 1, p. 283. [Google Scholar]
  30. Chen, S.-F.; Zhou, Y.-Q.; Chen, Y.-R.; Gu, J. Fastp: An ultra-fast all-in-one FASTQ preprocessor. Bioinformatics 2018, 34, i884–i890. [Google Scholar] [CrossRef] [PubMed]
  31. Jin, J.-J.; Yu, W.-B.; Yang, J.-B.; Song, Y.; de Pamphilis, C.W.; Yi, T.-S.; Li, D.-Z. GetOrganelle: A fast and versatile toolkit for accurate de novo assembly of organelle genomes. Genome Biol. 2020, 21, 241. [Google Scholar] [CrossRef] [PubMed]
  32. Wei, R.; Yan, Y.-H.; Harris, A.J.; Kang, J.-S.; Shen, H.; Xiang, Q.-P.; Zhang, X.-C. Plastid phylogenomics resolve deep relationships among eupolypod II ferns with rapid radiation and rate heterogeneity. Genome Biol. Evol. 2017, 9, 1646–1657. [Google Scholar] [CrossRef]
  33. Tillich, M.; Lehwark, P.; Pellizzer, T.; Ulbricht-Jones, E.S.; Fischer, A.; Bock, R.; Greiner, S. GeSeq–versatile and accurate annotation of organelle genomes. Nucleic Acids Res. 2017, 45, W6–W11. [Google Scholar] [CrossRef] [PubMed]
  34. Shi, L.; Chen, H.; Jiang, M.; Wang, L.; Wu, X.; Huang, L.; Liu, C. CPGAVAS2, an integrated plastome sequence annotator and analyzer. Nucleic Acids Res. 2019, 47, W65–W73. [Google Scholar] [CrossRef]
  35. Chan, P.-P.; Lowe, T.M. tRNAscan-SE: Searching for tRNA genes in genomic sequences. Methods Mol. Biol. 2019, 1962, 1–14. [Google Scholar]
  36. Miao, B.-B.; Dong, W.; Gu, Y.-X.; Han, Z.-F.; Luo, X.; Ke, C.-H.; You, W.-W. OmicsSuite: A customized and pipelined suite for analysis and visualization of multi-omics big data. Hortic. Res. 2023, 10, uhad195. [Google Scholar] [CrossRef]
  37. Du, X.-Y.; Lu, J.-M.; Zhang, L.-B.; Wen, J.; Kuo, L.-Y.; Mynsseng, C.M.; Schneider, H.; Li, D.-Z. Simultaneous diversification of Polypodiales and angiosperms in the Mesozoic. Cladistics 2021, 37, 518–539. [Google Scholar] [CrossRef]
  38. Katoh, K.; Standley, D.M. MAFFT multiple sequence alignment software version 7: Improvements in performance and usability. Mol. Biol. Evol. 2013, 30, 772–780. [Google Scholar] [CrossRef]
  39. Hall, T.A. BioEdit: A user-friendly biological sequence alignment editor and analysis program for windows 95/98/NT. Nucleic Acids Symp. Ser. 1999, 41, 95–98. [Google Scholar]
  40. Kalyaanamoorthy, S.; Minh, B.Q.; Wong, T.K.F.; von Haeseler, A.; Jermiin, L.S. ModelFinder: Fast model selection for accurate phylogenetic estimates. Nat. Methods 2017, 14, 587–589. [Google Scholar] [CrossRef] [PubMed]
  41. Nguyen, L.T.; Schmidt, H.; von Haeseler, A.; Minh, B.Q. IQ-TREE: A fast and effective stochastic algorithm for estimating maximum likelihood phylogenies. Mol. Biol. Evol. 2015, 32, 268–274. [Google Scholar] [CrossRef] [PubMed]
  42. Rambaut, A. FigTree-Version 1.4.3, A Graphical Viewer of Phylogenetic Trees. 2017. Available online: http://tree.bio.ed.ac.uk/software/figtree/ (accessed on 5 May 2023).
  43. Ronquist, F.; Teslenko, M.; van der Mark, P.; Ayres, D.L.; Darling, A.; Höhna, S.; Larget, B.; Liu, L.; Suchard, M.A.; Huelsenbeck, J.P. MrBayes 3.2: Efficient Bayesian phylogenetic inference and model choice across a large model space. Syst. Biol. 2012, 61, 539–542. [Google Scholar] [CrossRef]
  44. Minh, B.Q.; Hahn, M.W.; Lanfear, R. New methods to calculate concordance factors for phylogenomic datasets. Mol. Biol. Evol. 2020, 37, 2727–2733. [Google Scholar] [CrossRef]
  45. Mo, Y.-K.; Lanfear, R.; Hahn, M.W.; Minh, B.Q. Updated site concordance factors minimize effects of homoplasy and taxon sampling. Bioinformatics 2023, 39, btac741. [Google Scholar] [CrossRef]
  46. Maurin, J.L.K. An empirical guide for producing a dated phylogeny with treePL in a maximum likelihood framework. arXiv 2020, arXiv:2008.07054v2. [Google Scholar]
  47. Smith, S.A.; O’Meara, B.C. treePL: Divergence time estimation using penalized likelihood for large phylogenies. Bioinformatics 2012, 28, 2689–2690. [Google Scholar] [CrossRef]
  48. Drummond, A.J.; Suchard, M.A.; Xie, D.; Rambaut, A. Bayesian phylogenetics with BEAUti and the BEAST 1.7. Mol. Biol. Evol. 2012, 29, 1969–1973. [Google Scholar] [CrossRef]
  49. Chen, F.; Deng, S.-H.; Sun, K.-Q. Early Cretaceous Athyrium Roth from northeastern China. Palaeobotanist 1997, 46, 117–133. [Google Scholar] [CrossRef]
  50. Upchurch, G.R.; Mack, G.H. Latest Cretaceous leaf megafloras from the Jose Creek Member, McRae Formation of New Mexico. In Fall Field Conference Guidebook-49: Las Cruces Country II; Mack, G.H., Austin, G.S., Barker, J.M., Eds.; New Mexico Geological Society: Socorro, NM, USA, 1998; pp. 209–222. [Google Scholar]
  51. Wilf, P.; Beard, K.C.; Daviesvollum, K.S.; Norejko, J.W. Portrait of a late Paleocene (early Clarkforkian) terrestrial ecosystem; big multi quarry and associated strata, Washakie Basin, southwestern Wyoming. Palaios 1998, 13, 514–532. [Google Scholar] [CrossRef]
  52. Schuettpelz, E.; Pryer, K.M. Evidence for a Cenozoic radiation of ferns in an angiosperm-dominated canopy. Proc. Natl. Acad. Sci. USA 2009, 106, 11200–11205. [Google Scholar] [CrossRef] [PubMed]
  53. Qi, X.-P.; Kuo, L.-Y.; Guo, C.; Li, H.; Li, Z.-Y.; Qi, J.; Wang, L.; Hu, Y.; Xiang, J.; Zhang, C.; et al. A well-resolved fern nuclear phylogeny reveals the evolution history of numerous transcription factor families. Mol. Phylogenet. Evol. 2018, 127, 961–977. [Google Scholar] [CrossRef] [PubMed]
  54. Pelosi, J.A.; Kim, E.H.; Barbazuk, W.B.; Sessa, E.B. Phylotranscriptomics illuminates the placement of whole genome duplications and gene retention in ferns. Front. Plant Sci. 2022, 13, 882441. [Google Scholar] [CrossRef]
  55. Ballard, F. A new fern genus from Mexico and Guatemala. Am. Fern J. 1945, 35, 1–3. [Google Scholar] [CrossRef]
  56. Kato, M. Woodsiaceae. In Flora of Japan, Pteridophyta and Gymnospermae; Iwatsuki, K., Yamazaki, T., Boufford, D.E., Ohba, H., Eds.; Kodansha Ltd.: Tokyo, Japan, 1995; Volume 1, pp. 195–231. [Google Scholar]
  57. GBIF.org. GBIF Occurrence Download. Available online: https://www.gbif.org/occurrence/download/0015267-231120084113126 (accessed on 1 December 2023).
  58. Matzke, N.J. BioGeoBEARS: BioGeography with Bayesian (and Likelihood) Evolutionary Analysis with R Scripts, Version 1.1.1. 2018. Available online: https://github.com/nmatzke/BioGeoBEARS (accessed on 6 November 2018).
  59. Buerki, S.; Forest, F.; Alvarez, N.; Nylander, J.A.A.; Arrigo, N.; Sanmartın, I. An evaluation of new parsimony-based versus parametric inference methods in biogeography: A case study using the globally distributed plant family Sapindaceae. J. Biogeogr. 2011, 38, 531–550. [Google Scholar] [CrossRef]
  60. Wei, R.; Xiang, Q.-P.; Schneider, H.; Sundue, M.A.; Kessler, M.; Kamau, P.W.; Hidayat, A.; Zhang, X.-C. Eurasian origin, boreotropical migration and transoceanic dispersal in the pantropical fern genus Diplazium (Athyriaceae). J. Biogeogr. 2015, 42, 1809–1819. [Google Scholar] [CrossRef]
  61. Matzke, N.J. Model selection in historical biogeography reveals that founder-event speciation is a crucial process in Island clades. Syst. Biol. 2014, 63, 951–970. [Google Scholar] [CrossRef]
  62. Yu, Y.; Blair, C.; He, X.-J. RASP 4: Ancestral state reconstruction tool for multiple genes and characters. Mol. Biol. Evol. 2020, 37, 604–606. [Google Scholar] [CrossRef]
  63. Matzke, N.J. Stochastic Mapping Under Biogeographical Models. 2015. Available online: http://phylo.wikidot.com/biogeobears#stochastic_mapping (accessed on 1 June 2015).
  64. Kuo, L.-Y.; Qi, X.; Ma, H.; Li, F.-W. Order-level fern plastome phylogenomics: New insights from Hymenophyllales. Am. J. Bot. 2018, 105, 1545–1555. [Google Scholar] [CrossRef]
  65. Mower, J.P.; Ma, P.-F.; Grewe, F.; Taylor, A.; Michael, T.P.; VanBuren, R.; Qiu, Y.-L. Lycophyte plastid genomics: Extreme variation in GC, gene and intron content and multiple inversions between a direct and inverted orientation of the rRNA repeat. New Phytol. 2019, 222, 1061–1075. [Google Scholar] [CrossRef]
  66. Du, X.-Y.; Kuo, L.-Y.; Zuo, Z.-Y.; Li, D.-Z.; Lu, J.-M. Structural variation of plastomes provides key insight into the deep phylogeny of ferns. Front. Plant Sci. 2022, 13, 862772. [Google Scholar] [CrossRef] [PubMed]
  67. Zhou, X.-M.; Zhao, J.; Yang, J.-J.; Le Péchonc, T.; Zhang, L.; He, Z.-R.; Zhang, L.-B. Plastome structure, evolution, and phylogeny of Selaginella. Mol. Phylogenet. Evol. 2022, 169, 107410. [Google Scholar] [CrossRef]
  68. Grewe, F.; Guo, W.H.; Gubbels, E.A.; Hansen, A.K.; Mower, J.P. Complete plastid genomes from Ophioglossum californicum, Psilotum nudum, and Equisetum hyemale reveal an ancestral land plant genome structure and resolve the position of Equisetales among monilophytes. BMC Evol. Biol. 2013, 13, 8. [Google Scholar] [CrossRef]
  69. Kim, H.T.; Chung, M.G.; Kim, K.J. Chloroplast genome evolution in early diverged leptosporangiate ferns. Mol. Cell. 2014, 37, 372–382. [Google Scholar] [CrossRef] [PubMed]
  70. Wolf, P.G.; Rowe, C.A.; Sinclair, R.B.; Hasebe, M. Complete nucleotide sequence of the chloroplast genome from a leptosporangiate fern, Adiantum capillus-veneris L. DNA Res. 2003, 10, 59–65. [Google Scholar] [CrossRef]
  71. Wolf, P.G.; Roper, J.M.; Duffy, A.M. The evolution of chloroplast genome structure in ferns. Genome 2010, 53, 731–738. [Google Scholar] [CrossRef]
  72. Lu, J.-M.; Zhang, N.; Du, X.-Y.; Wen, J.; Li, D.-Z. Chloroplast phylogenomics resolves key relationships in ferns. J. Syst. Evol. 2015, 53, 448–457. [Google Scholar] [CrossRef]
  73. Zhao, J.; Zhou, X.-M.; Fang, S.-L.; Zhu, Z.-M.; Li, Y.-X.; Yu, H.; He, Z.-R. Transcriptome-based study on the phylogeny and hybridization of Marattialean ferns (Marattiaceae). Plants 2023, 12, 2237. [Google Scholar] [CrossRef]
  74. Jiang, L.-J.; Zhao, J.; Wang, J.-G.; Landrein, S.; Shi, J.-P.; Huang, C.-J.; Luo, M.; Zhou, X.-M.; Niu, H.-B.; He, Z.-R. Deciphering the evolution and biogeography of ant-ferns Lecanopteris s.s. Mol. Phylogenet. Evol. 2024, 201, 108199. [Google Scholar] [CrossRef]
  75. Maximowicz, C.J. Primitiae florae Amuresis; Saraswati Press: St. Petersburg, Russia, 1859. [Google Scholar]
  76. Testo, W.; Sundue, M. A 4000-species dataset provides new insight into the evolution of ferns. Mol. Phylogenet. Evol. 2016, 105, 200–211. [Google Scholar] [CrossRef]
  77. Berry, K. Fern macroflora from the basal Danian of the Raton Formation supports palynological signal of a widespread “postdisaster” fern flora. Int. J. Plant Sci. 2023, 184, 1–13. [Google Scholar] [CrossRef]
  78. Ali, J.R.; Aitchison, J.C. Gondwana to Asia: Plate tectonics, paleogeography and the biological connectivity of the Indian subcontinent from the Middle Jurassic through latest Eocene (166–35 Ma). Earth-Sci. Rev. 2008, 88, 145–166. [Google Scholar] [CrossRef]
  79. Rothwell, G.W.; Stockey, R.A. Onoclea sensibilis in the Paleocene of North America, a dramatic example of structural and ecological stasis. Rev. Palaeobot. Palynol. 1991, 70, 113–124. [Google Scholar] [CrossRef]
  80. Fox, R.C. The succession of Paleocene mammals in western Canada. In Dawn of the Age of Mammals in the Northern Part of the Rocky Mountain Interior, North America; Brown, T.M., Rose, K.D., Eds.; Geological Society of America: Boulder, CO, USA, 1990; p. 243. [Google Scholar]
  81. Johnson, K. Megaflora of the Hell Creek Formation and lower Fort Union Formations in the western Dakotas: Vegetational response to climate change, the Cretaceous-Tertiary boundary event, and rapid marine transgression. In The Hell Creek Formation and the Cretaceous-Tertiary Boundary in the Northern Great Plains: An Integrated Continental Record of the End of the Cretaceous; Hartman, J., Johnson, K.R., Nichols, D.J., Eds.; Geological Society of America: Boulder, CO, USA, 2002; pp. 329–391. [Google Scholar]
  82. Wilf, P.; Johnson, K.R.; Huber, B.T. Correlated terrestrial and marine evidence for global climate changes before mass extinction at the Cretaceous-Paleogene boundary. Proc. Natl. Acad. Sci. USA 2003, 100, 599–604. [Google Scholar] [CrossRef] [PubMed]
  83. Aitchison, J.C.; Ali, J.R.; Davis, A.M. When and where did India and Asia collide? J. Geophys. Res. 2007, 112, B05423. [Google Scholar] [CrossRef]
  84. Wei, X.-P.; Qi, Y.-D.; Zhang, X.-C.; Luo, L.; Shang, H.; Wei, R.; Liu, H.-T.; Zhang, B.-G. Phylogeny, historical biogeography and characters evolution of the drought resistant fern Pyrrosia Mirbel (Polypodiaceae) inferred from plastid and nuclear markers. Sci. Rep. 2017, 7, 12757. [Google Scholar] [CrossRef]
  85. Zhao, J.; Huang, C.-J.; Jiang, L.-J.; He, Z.-R.; Yang, S.; Zhu, Z.-M.; Zhang, L.; Yu, H.; Zhou, X.-M.; Wang, J.-G. Phylogenomic analyses of the pantropical Platycerium Desv. (Platycerioideae) reveal their complex evolution and historical biogeography. Mol. Phylogenet. Evol. 2024, 201, 108213. [Google Scholar] [CrossRef]
  86. Davis, C.C.; Bell, C.D.; Mathews, S.; Donoghue, M.J. Laurasian migration explains Gondwanan disjunctions: Evidence from Malpighiaceae. Proc. Natl. Acad. Sci. USA 2002, 99, 6833–6837. [Google Scholar] [CrossRef]
  87. Testo, W.L.; de Gasper, A.L.; Molino, S.; Galán, J.M.G.Y.; Salino, A.; Dittrich, V.A.O.; Sessa, E.B. Deep vicariance and frequent transoceanic dispersal shape the evolutionary history of a globally distributed fern family. Am. J. Bot. 2022, 109, 1579–1595. [Google Scholar] [CrossRef]
  88. Zachos, J.; Pagani, M.; Sloan, L.; Thomas, E.; Billups, K. Trends, rhythms, and aberrations in global climate 65 Ma to present. Science 2001, 292, 686–693. [Google Scholar] [CrossRef]
  89. Morley, R.J. Cretaceous and Tertiary climate change and the past distribution of megathermal rainforests. In Tropical Rainforest Responses to Climatic Change; Springer Praxis Books; Bush, M.B., Flenley, J.R., Eds.; Springer: Berlin/Heidelberg, Germany, 2007; pp. 1–31. [Google Scholar]
  90. Wen, J. Evolution of eastern Asian and eastern North American disjunct distributions in flowering plants. Ann. Rev. Ecol. Evol. Syst. 1999, 30, 421–455. [Google Scholar] [CrossRef]
  91. Tiffney, B.H.; Manchester, S.R. The use of geological and paleontological evidence in evaluating plant phylogeographic hypotheses in the northern hemisphere Tertiary. Int. J. Plant Sci. 2001, 162, S3–S17. [Google Scholar] [CrossRef]
  92. Wen, J.; Ickert-Bond, S.; Nie, Z.-L.; Li, R. Timing and modes of evolution of eastern Asian–North American biogeographic disjunctions in seed plants. In Darwin′s Heritage Today: Proceedings of the Darwin 200 Beijing International Conference; Long, M., Gu, H., Zhou, Z., Eds.; Higher Education Press: Beijing, China, 2010; pp. 252–269. [Google Scholar]
Figure 1. The plastome map of Onoclea sensibilis L. Green background represents single copy regions, blue background represents repeat regions. The dark gray track inside the map shows the GC content. Genes on the outside of the map are transcribed clockwise, and genes on the inside are transcribed counterclockwise. Genes belonging to different functional groups are shown in different colors; see the legend for groups. Bold indicated duplicated gene pairs.
Plants 14 00510 g001
Figure 2. Phylogenetic tree reconstruction using Bayesian inference (BI) based on concatenated dataset. The numbers above the branches represent ML-BS/BI-PP. The numbers below the branches represent gCF/sCF. Voucher information and geographical provenance are indicated in red and blue, respectively. Maps show the distribution of species based on Global Biodiversity Information Facility (GBIF) data as black points for the species.
Plants 14 00510 g002
Figure 3. Time-calibrated phylogeny inferred by treePL based on concatenated dataset of Onocleaceae. The divergence times (Ma) are shown above the nodes. Black bars on nodes indicate the 95% highest probability density interval of the age. Fossil calibrated nodes are indicated by red dots. Blue dotted line indicates the K/Pg boundary. The brown stripe corresponds to the hottest period of the Cenozoic era (Paleocene-Eocene Thermal Maximum: PETM).
Plants 14 00510 g003
Figure 4. Ancestral range estimation used BioGeoBEARS to implement in RASP under the DIVALIKE model. The distribution of each species is mapped to the right of the chronogram. The single-most-probable state (geographical range) is shown at each node. The numbers above the branches represent node number. The green circle and blue circle around the nodes represent vicariance events and dispersal events, respectively.
Plants 14 00510 g004
Table 2. Comparison of characters.
GenusMatteucciaOnoclea
Rhizomeserectcreeping
Laminadimorphicdimorphic
Trophophylls veinsopen pinnate, freereticulate
Chromosome numberx = 39, 40x = 37
Glandular hairs of gametophytesabsentpresent
DistributionDisjunctly circumborealNorth America and Eastern Asia
GenusOnoclepsisPentarhizidium
Rhizomeserectcreeping
Laminadimorphicdimorphic
Trophophylls veinsreticulateopen pinnate, free
Chromosome numberx = 40x = 40, 41
Glandular hairs of gametophytesabsentpresent
DistributionSouthern Mexico and GuatemalaAsiatic
Table 3. Results of the BioGeoBEARS analysis.
ModelLnLNumparamsdejAICcAICc_wt
DEC−14.1220.0180.05036.240.2
DEC + J−13.0430.0130.0370.2344.070.004
DIVALIKE−13.2220.0160.04034.450.49
DIVALIKE + J−12.8930.0150.0450.2843.770.0046
BAYAREALIKE−13.7120.542.38035.410.3
BAYAREALIKE + J−13.6730.562.350.9645.330.0021
Disclaimer/Publisher’s Note: The statements, opinions and data contained in all publications are solely those of the individual author(s) and contributor(s) and not of MDPI and/or the editor(s). MDPI and/or the editor(s) disclaim responsibility for any injury to people or property resulting from any ideas, methods, instructions or products referred to in the content.

