Novel Patterns of Photosynthetic Activity Within Canopies of Poplar Stands with Different Densities

Abstract
1. Introduction
2. Results
2.1. ANOVA of Photosynthetic Traits and Leaf Traits
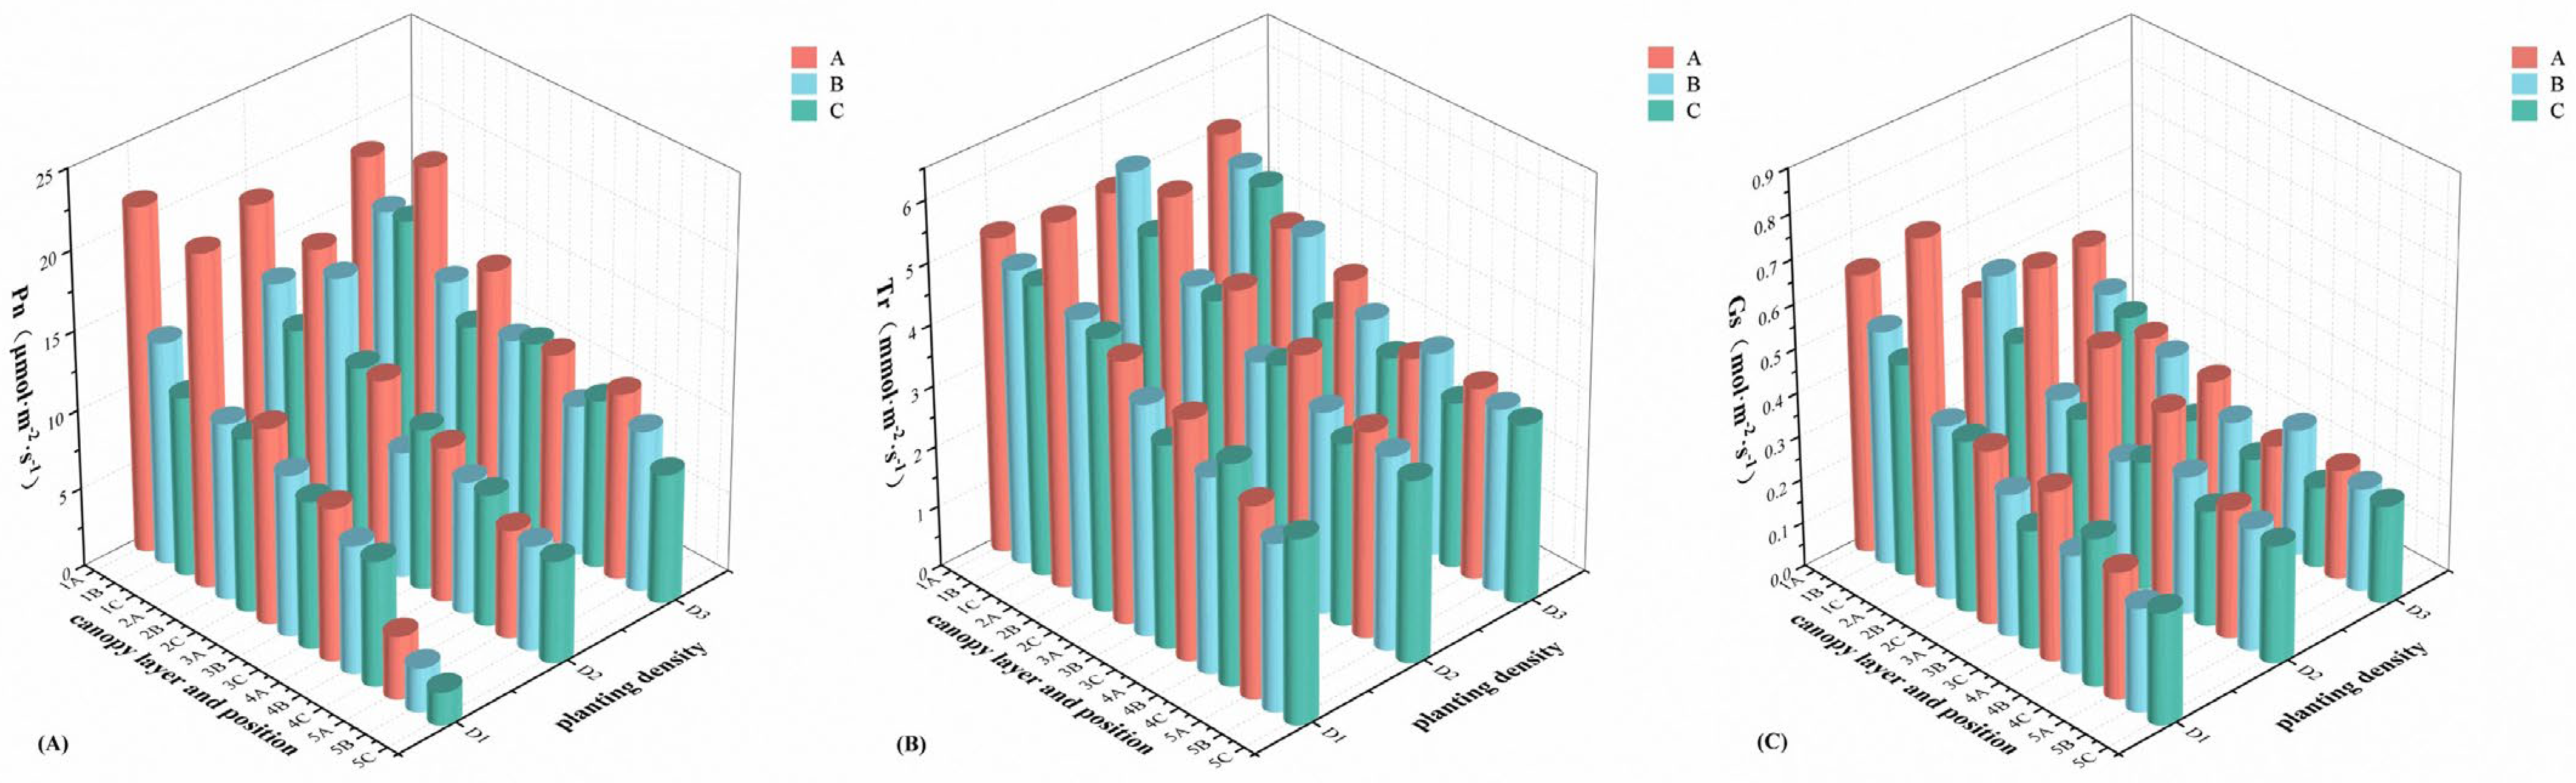
2.2. Mean Value Analysis of Photosynthetic Traits at Different Planting Densities, Different Canopy Layers, and Different Positions
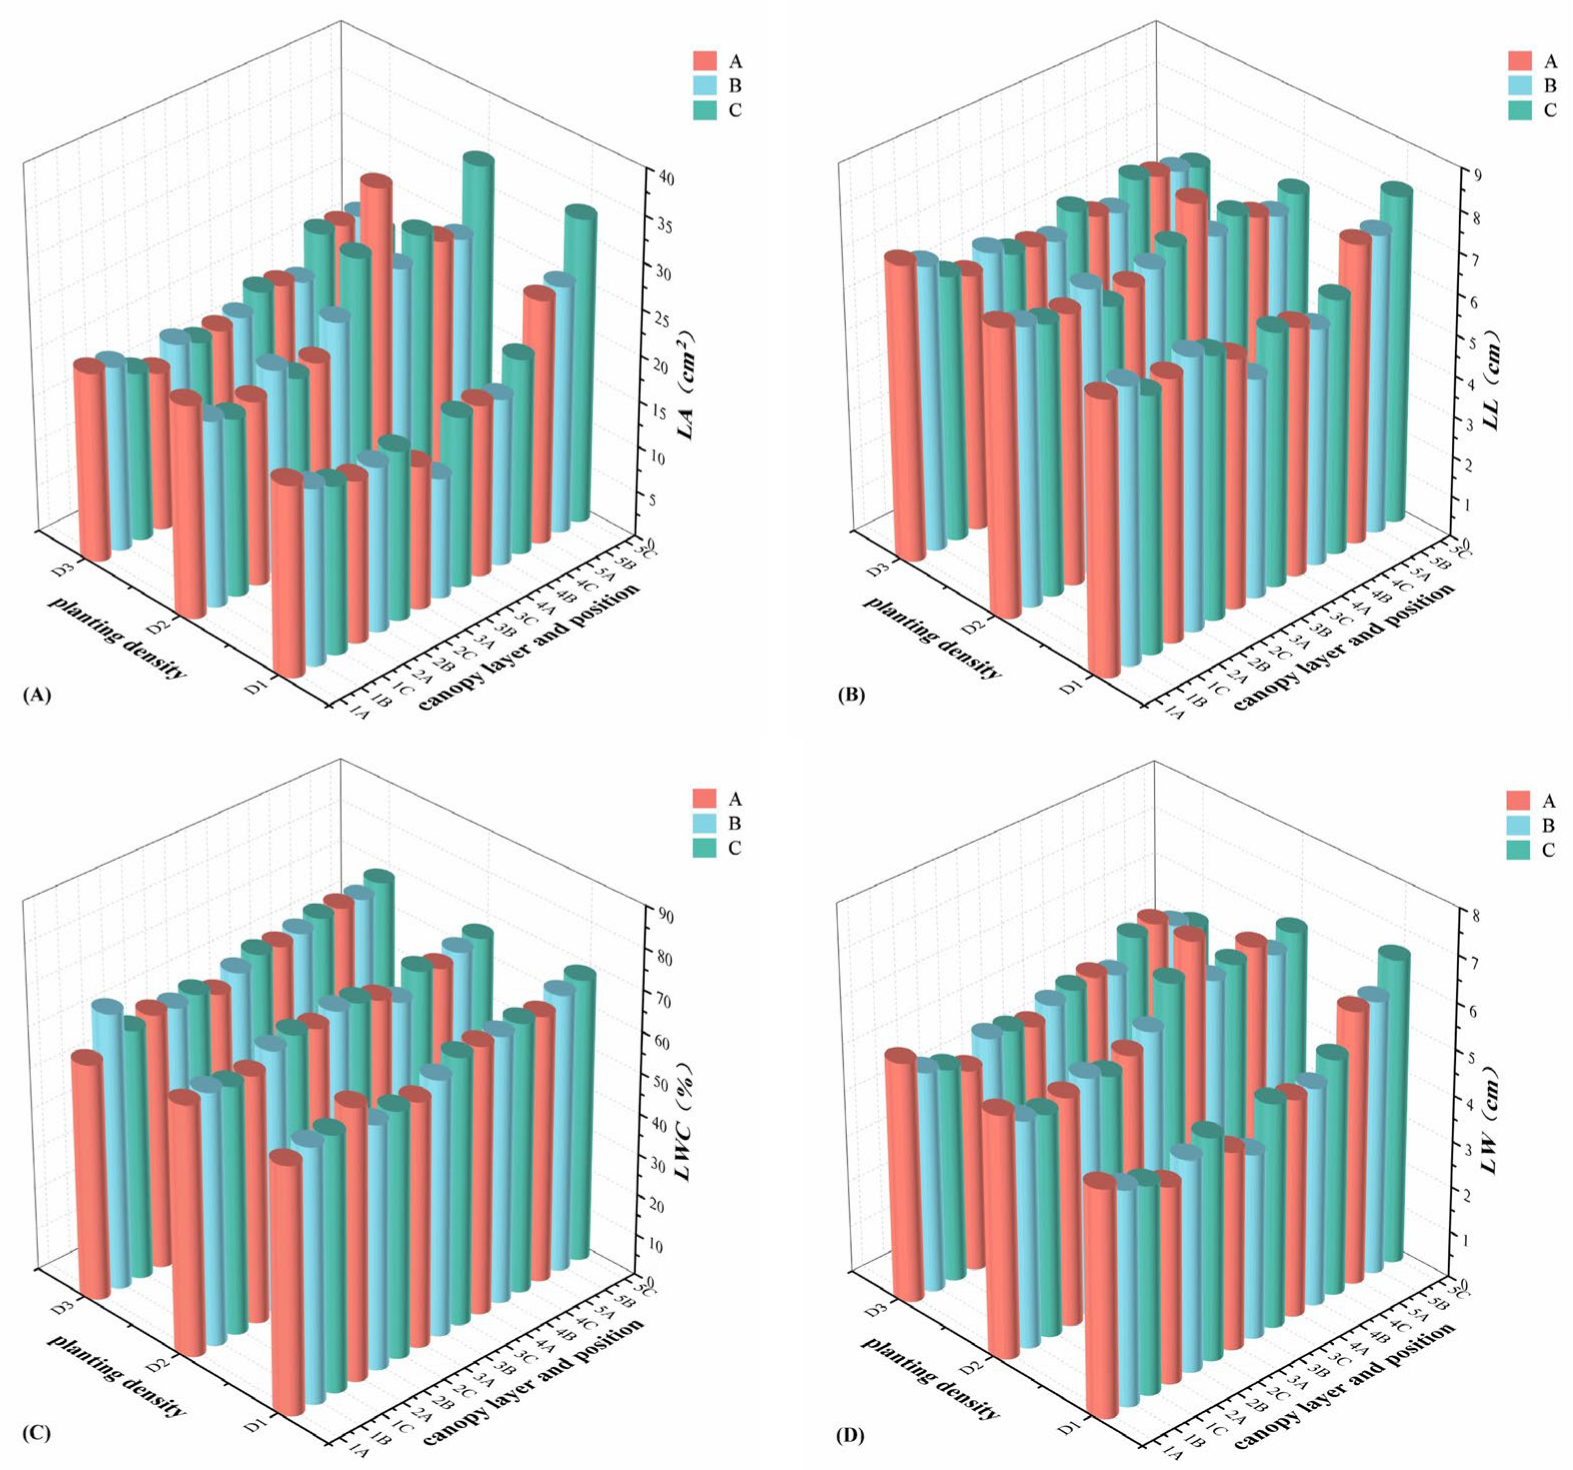
2.3. Analysis of Leaf Traits at Different Planting Densities, Different Canopy Layers, and Different Positions
2.4. Correlation Analysis of Photosynthetic Traits and Leaf Traits
3. Discussion
4. Materials and Methods
4.1. Study Site
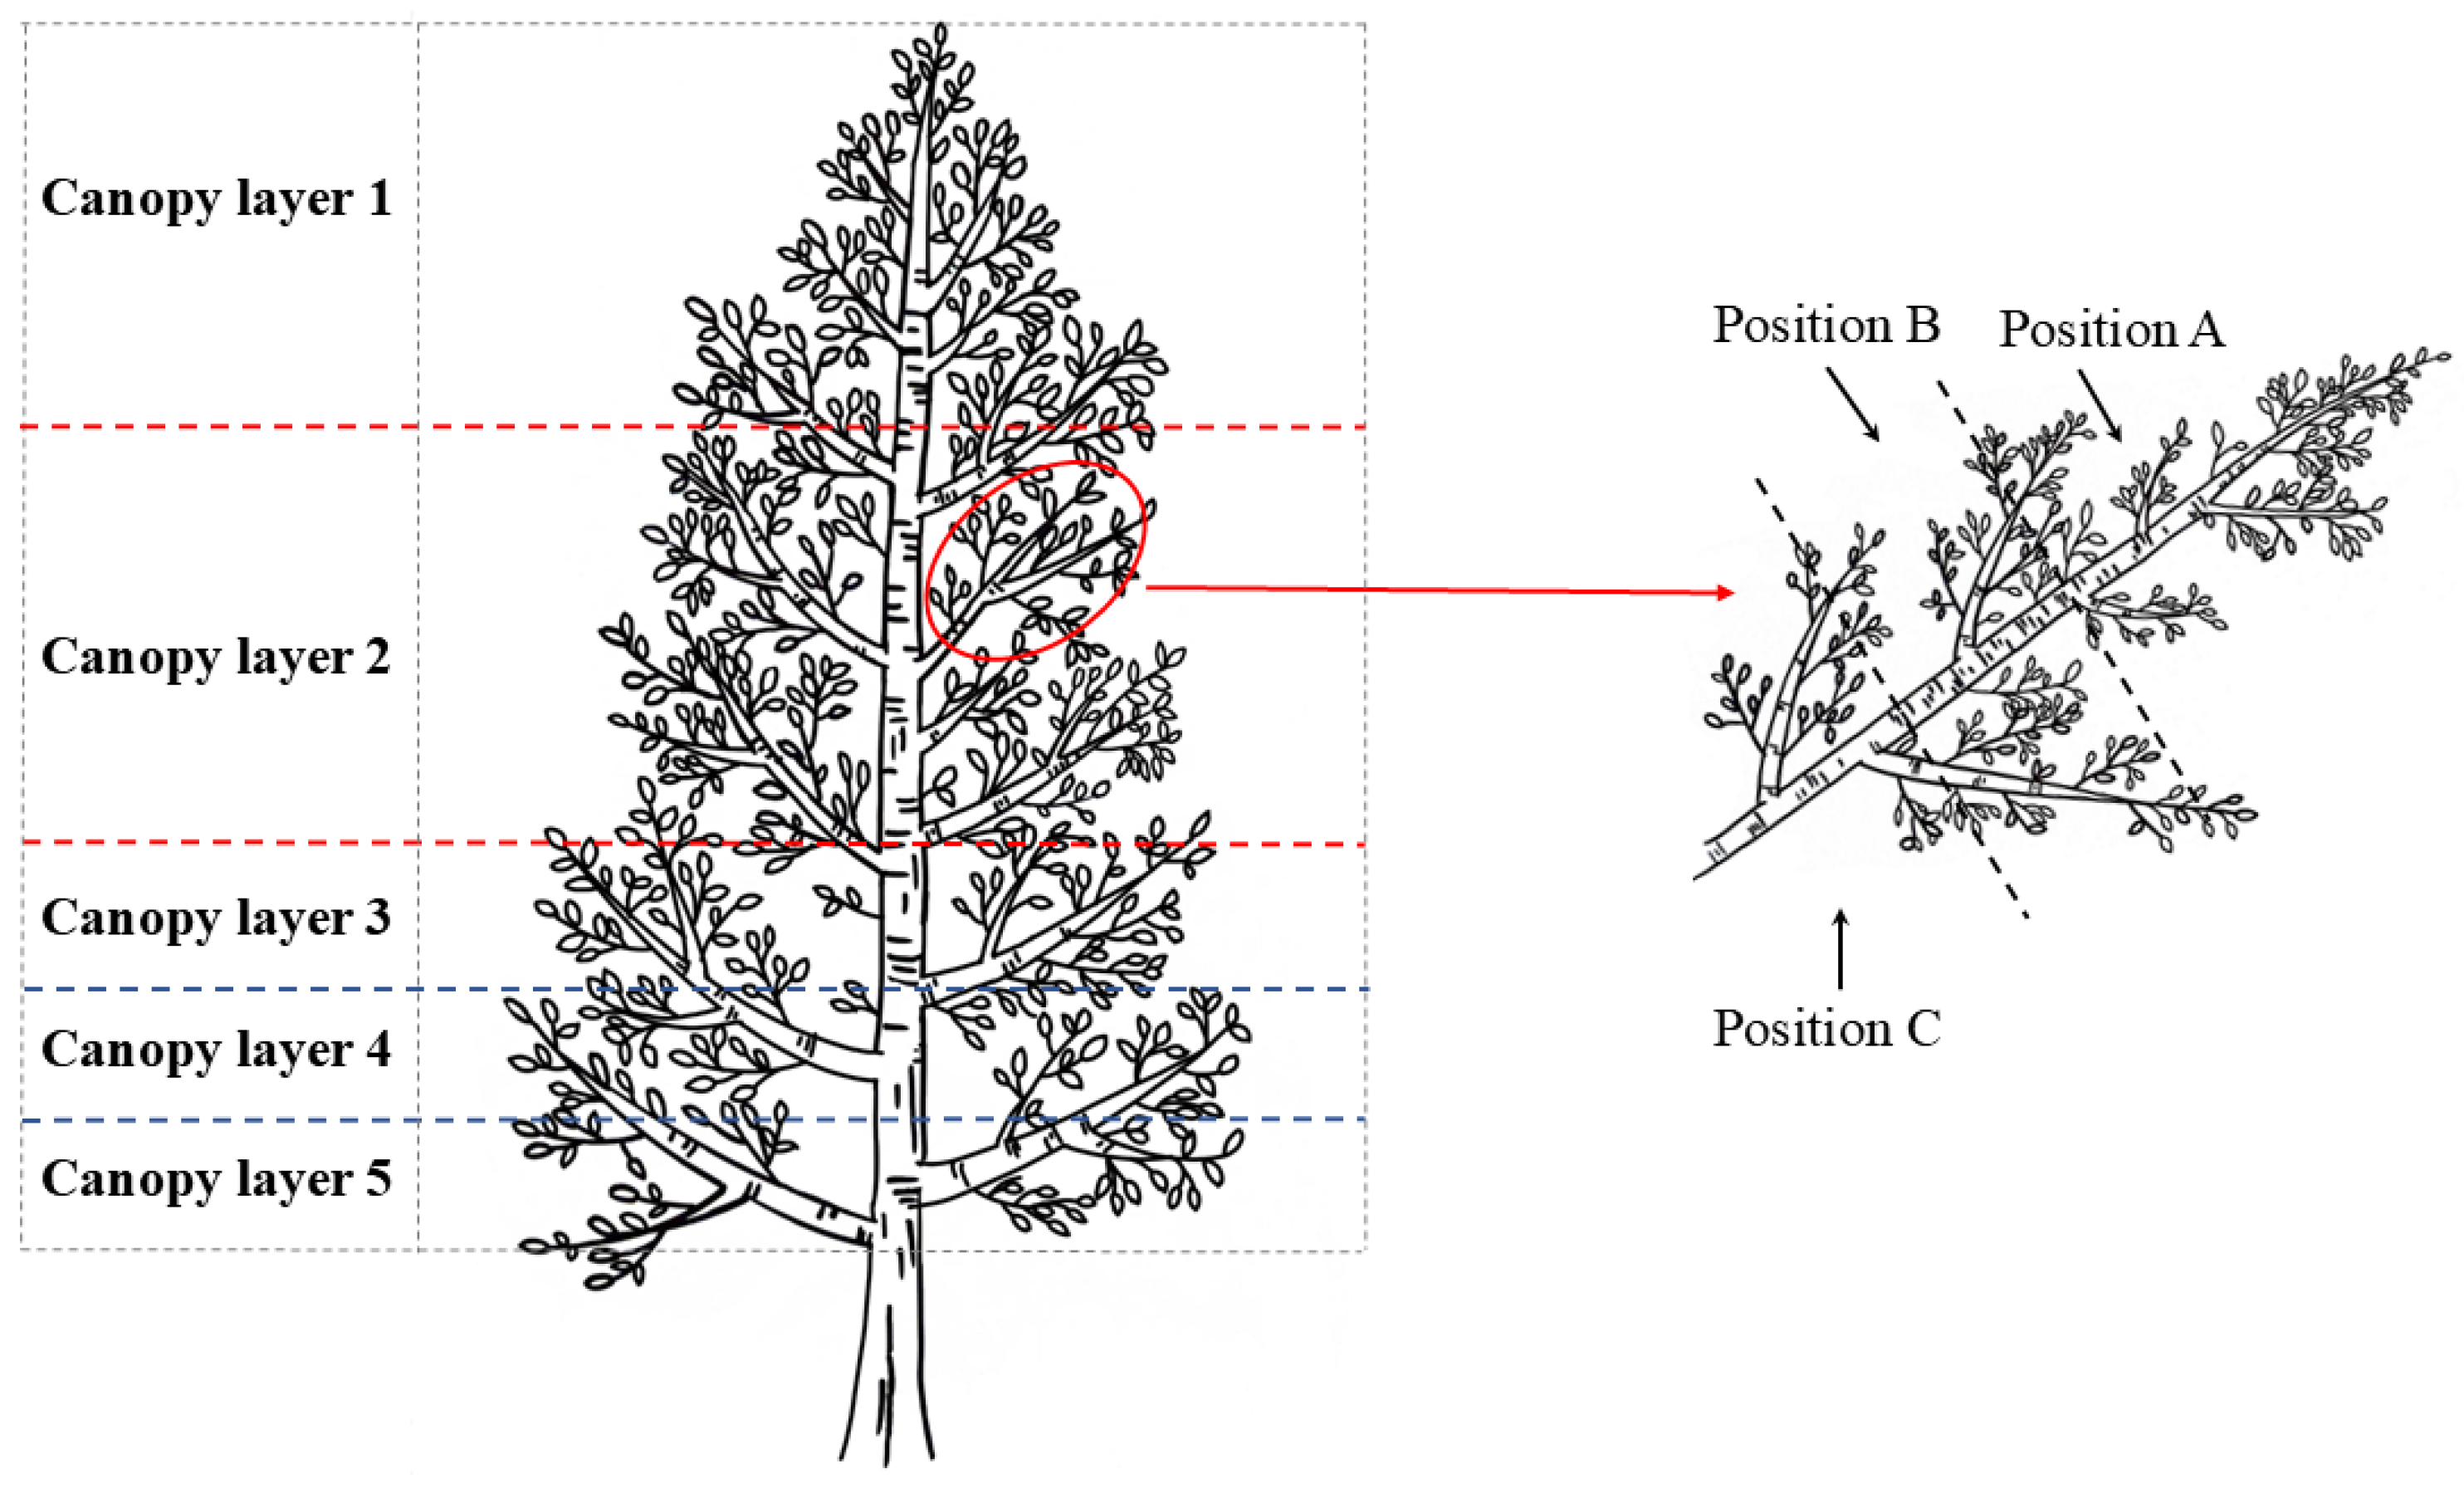
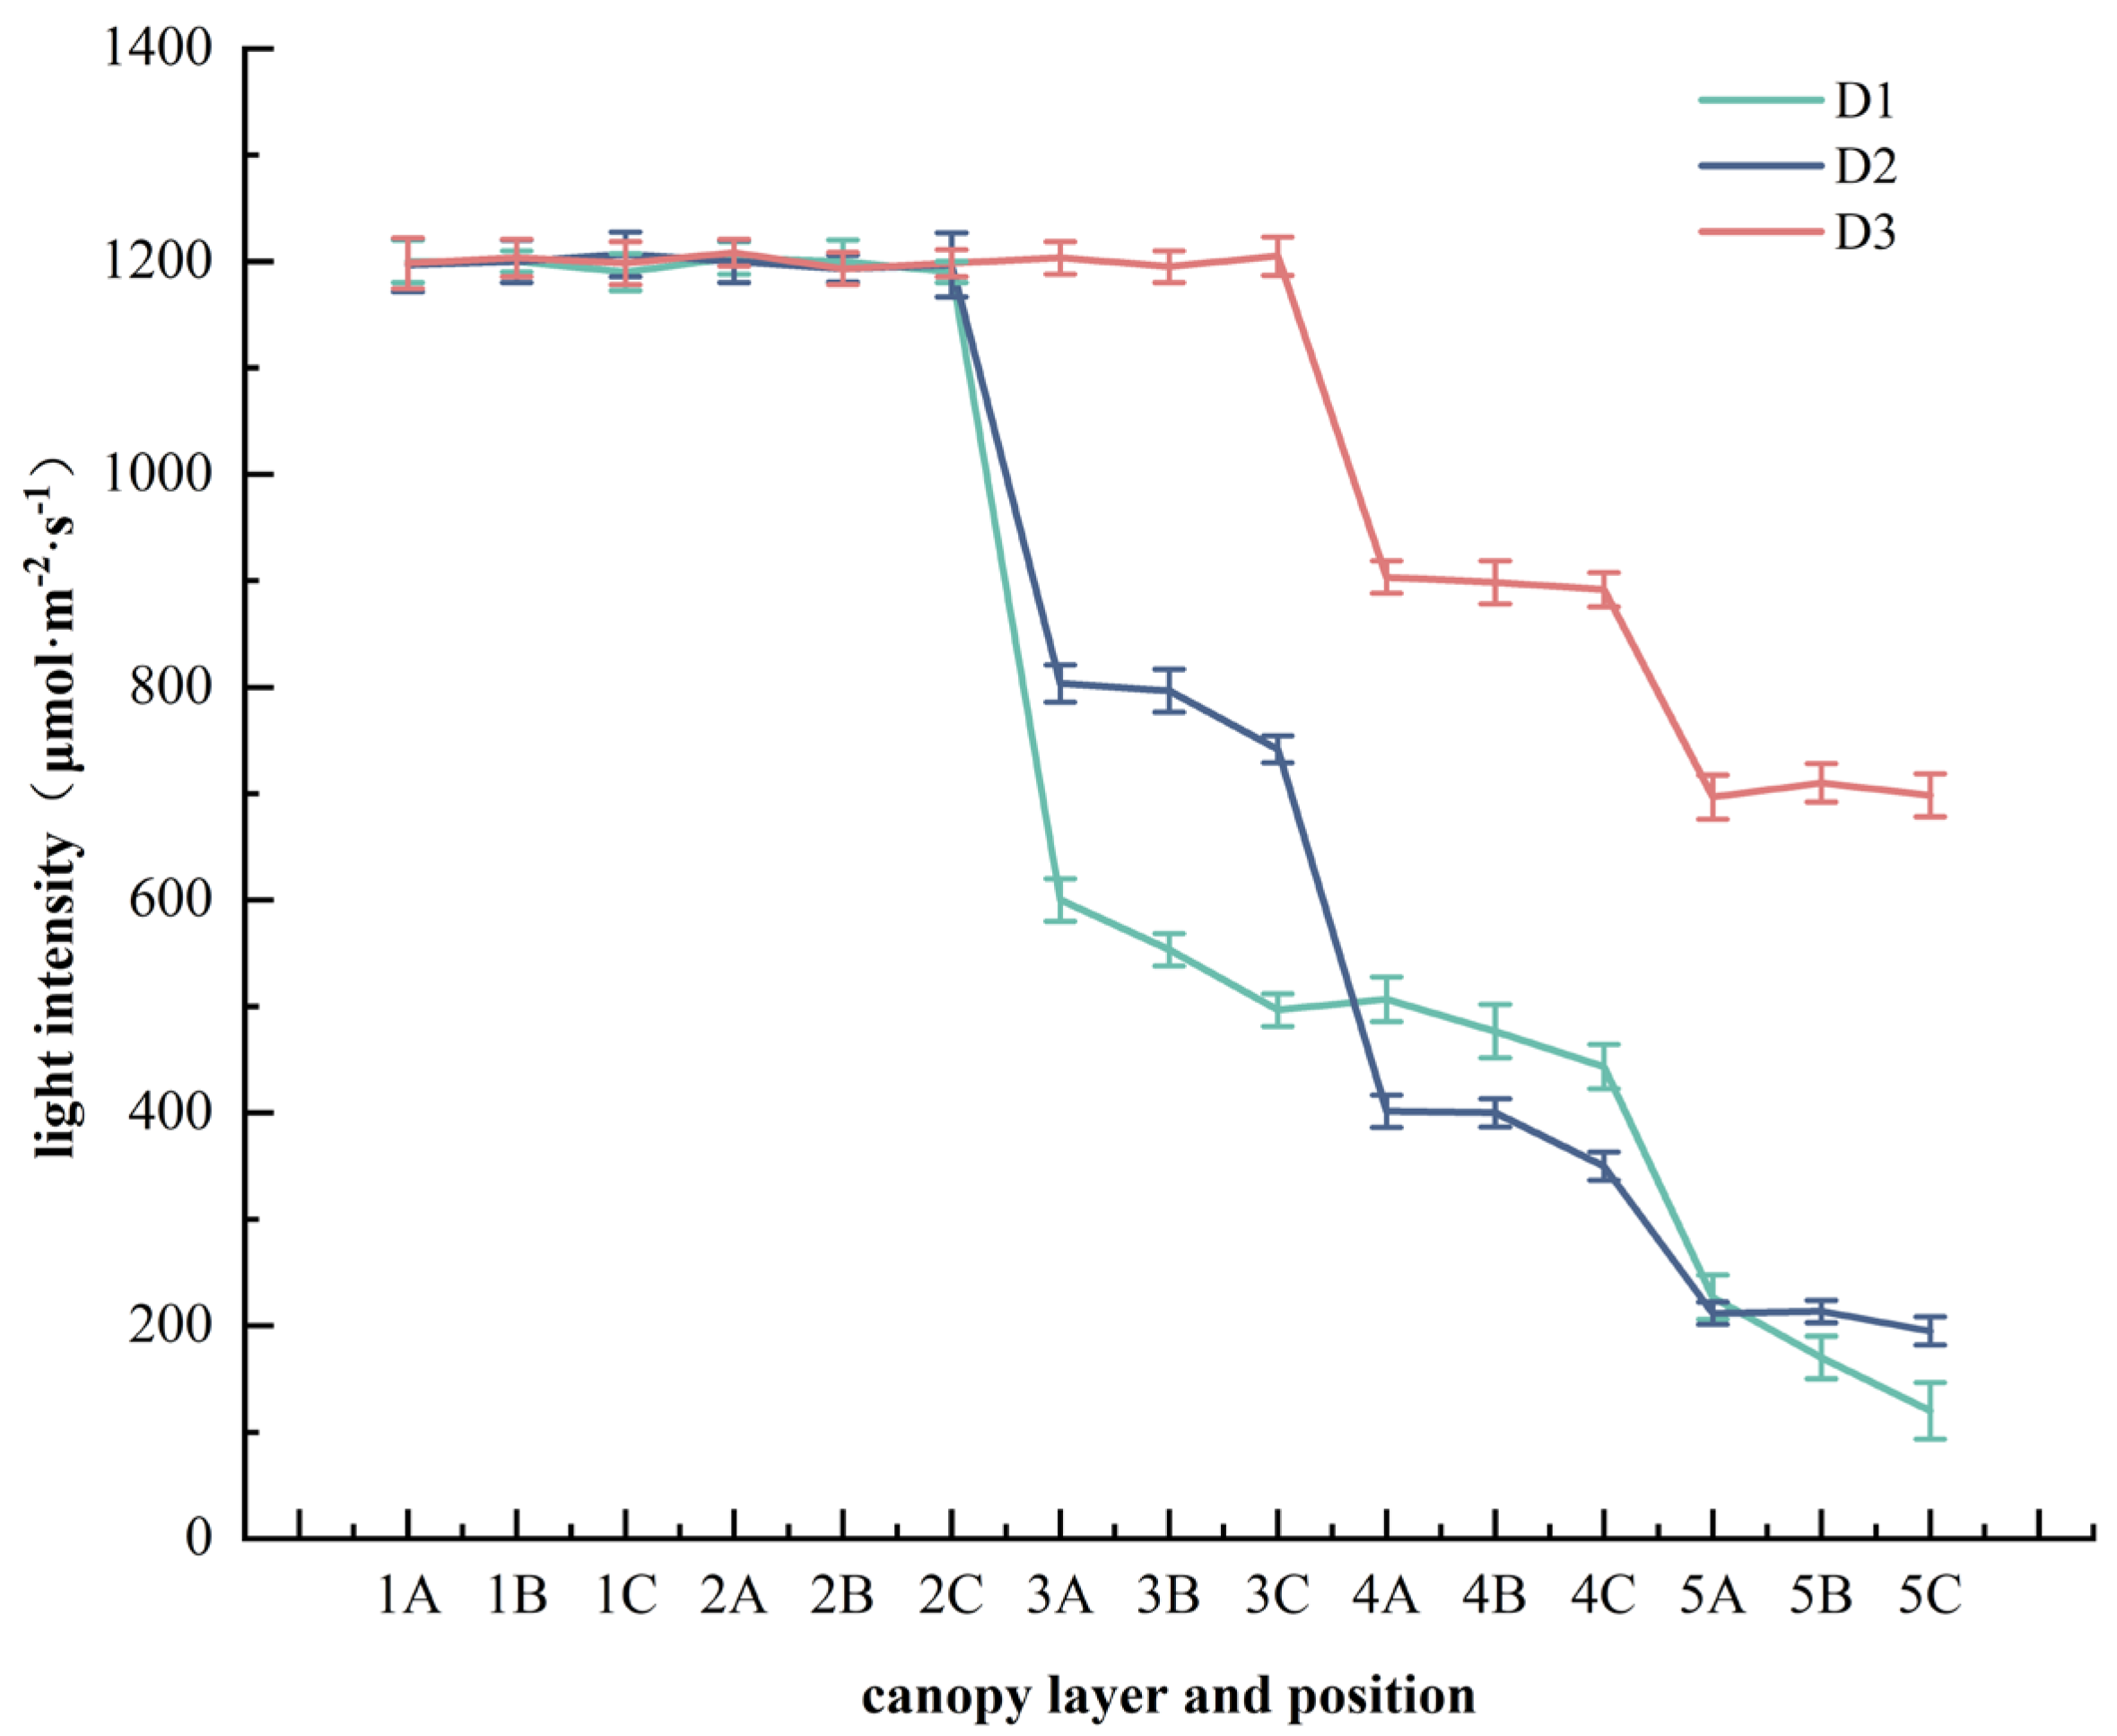
4.2. Study Design
4.3. Measurement of the Photosynthetic Index
4.4. Measurement of Leaf Phenotype
4.5. Data Analysis
5. Conclusions
Author Contributions
Funding
Data Availability Statement
Conflicts of Interest
References
- He, J.M.; Yu, X.P.; Liu, C.; Zhao, W.M. Stomatal and nonstomatal limitations of photosynthesis in Phaseolus radiatus leaves under the combination of enhanced UV-B radiation and NaCl stress. J. Plant Physiol. Mol. Biol. 2004, 30, 53–58. [Google Scholar]
- Leonel, L.V.; Reis, O.F.; Assis Figueiredo, F.A.M.M.; Ferraz, T.M.; Júnior, O.M.S.; Silva, P.C.; Andrade, J.R. Light intensity and hydrogel soil amendment differentially affect growth and photosynthesis of successional tree species. J. For. Res. 2023, 34, 257–268. [Google Scholar] [CrossRef]
- Aubuchon, R.R.; Thompson, D.R.; Hinckley, T.M. Environmental influences on photosynthesis within the crown of a white oak. Oecologia 1978, 35, 295–306. [Google Scholar] [CrossRef]
- Gao, G.L.; Feng, Q.; Zhang, X.Y.; Si, J.H.; Yu, T.F. An overview of stomatal and non-stomatal limitations to photosynthesis of plants. Arid Zone Study 2018, 35, 929–937. [Google Scholar]
- Yu, H.Y.; Shi, Y.Z.; Ma, L.F.; Yi, X.Y.; Ruan, J.Y. Leaf photosynthetic traits at different canopies of tea plants. J. Tea Sci. 2013, 33, 505–511. [Google Scholar]
- Zhao, J. Influence of Temperature and Light Intensity on Morphological and Structural Trait of Leaf of Seedings of Quercus variabilis and Q. mongolica. Master’s Thesis, Shandong University, Jinan, China, 2013. [Google Scholar]
- Gong, H.; Yang, M.; Wang, C.; Tian, C.L. Leaf phenotypic variation and its response to environmental factors in natural populations of Eucommia ulmoides. BMC Plant Biol. 2023, 23, 562. [Google Scholar] [CrossRef]
- Bai, D.X.; Liu, Q.; Dong, L.H.; Li, F.R. Determination and analysis of height to effective crown for planted Larix olgensis trees. J. Beijing For. Univ. 2019, 41, 76–87. [Google Scholar]
- Moller, C.M. The influence of pruning on the growth of conifers. Forestry 1962, 33, 37–53. [Google Scholar] [CrossRef]
- Li, X.N.; Wang, Y.H.; Yang, Z.H.; Liu, T.; Mu, C.C. Photosynthesis adaption in Korean pine to gap size and position within Populus davidiana forests in Xiaoxing’anling, China. J. For. Res. 2022, 33, 11. [Google Scholar] [CrossRef]
- Sha, Z.Z.; Fan, S.H.; Feng, S.Q.; Ye, D.Q.; Ma, X.Q.; He, Z.M. Effects of different pruning intensities on the growth of Cunninghamia lanceolata plantations. J. Northwest For. Univ. 2022, 37, 131–136. [Google Scholar]
- Ma, Y.C.; Fang, S.Z. Research on photosynthesis characteristics in different canopy layers of poplar clone 107 (Populus × euramericana cv.Neva). J. Nanjing For. Univ. Nat. Sci. Ed. 2011, 35, 39–42. [Google Scholar]
- Ma, X.M.; Liu, Q.; Zhang, Z.D.; Zhang, Z.W.; Lv, P.C.; Huang, X.R. Spatial heterogeneity of canopy photosynthesis of Larix principis-rupprechtii in Saihanba Mechanical Forest Farm. J. Cent. South Univ. For. Technol. 2023, 43, 113–122. [Google Scholar]
- Huang, L.S.; Han, H.R.; Niu, S.K.; Cheng, X.Q.; Zhou, W.S. Spatial heterogeneity of canopy photosynthesis in Larix principis-rupprechtii Mayr. Plantations. J. Nanjing For. Univ. Nat. Sci. Ed. 2017, 41, 5. [Google Scholar]
- Xia, G.W.; Chen, D.S.; Shun, X.M.; Zhang, S.G. Spatial heterogeneity of photosynthetic and physiological parameters in Larix kaempferi crown. For. Res. 2018, 31, 130–137. [Google Scholar]
- Dong, T.; Zhang, Y.; Zhang, Y.; Zhang, S. Continuous planting under a high density enhances the competition for nutrients among young Cunninghamia lanceolata saplings. Ann. For. Sci. 2016, 73, 331–339. [Google Scholar] [CrossRef]
- Wang, H.R. Analysis of the effect of afforestation density on forest growth. Mod. Agric. Sci. Technol. 2013, 6, 161. [Google Scholar]
- Che, H.; Quan, X.Q.; Wang, L.D.; Li, X.Y.; Xu, Q.L.; Li, H.Y.; Wang, Y.R.; Ma, X.Q.; Yan, X.L. Photosynthetic characteristics of leaves under different planting densities and canopies in young Cunninghamia lanceolata seedling. For. Sci. Res. 2023, 36, 151–161. [Google Scholar]
- Yang, N. Effects of Planting Density on Growth, Nutrient Accumulation, Yield and Its Component Factors of Sorghum. Master’s Thesis, Shanxi University, Taiyuan, China, 2014. [Google Scholar]
- Farque, L.; Sinoquet, H.; Colin, F. Canopy structure and light interception in Quercus petraea seedlings in relation to light regime and plant density. Tree Physiol. 2001, 21, 1257–1267. [Google Scholar] [CrossRef]
- Wang, F.S.; Li, J.; Li, S.S.; Guan, C.Y.; Wang, H.M.; Zhao, P.D. Breeding of Populus euramericana ‘N3016’ × Populus ussuriensis. J. Northeast For. Univ. 2014, 42, 6. [Google Scholar]
- Song, Y.P.; Chen, Q.Q.; Ci, D.; Shao, X.X.; Zhang, D.Q. Effects of high temperature on photosynthesis and related gene expression in poplar. BMC Plant Biol. 2014, 14, 111. [Google Scholar] [CrossRef]
- Zhou, J.X.; Song, F.Y.; He, Y.L.; Zhang, W.K.; Xiao, L.; Lu, W.J.; Li, P.; Quan, M.Y.; Zhang, D.Q.; Du, Q.Z. LncRNA evolution and DNA methylation variation participate in photosynthesis pathways of distinct lineages of Populus. For. Res. 2024, 3, 3. [Google Scholar] [CrossRef] [PubMed]
- Tang, H.; Hu, Y.Y.; Yu, W.W.; Song, L.L.; Wu, J.S. Growth, photosynthetic and physiological responses of Torreya grandis seedlings to varied light environments. Trees 2015, 29, 1011–1022. [Google Scholar] [CrossRef]
- Xia, J.B.; Lang, Y.; Zhao, Q.K.; Liu, P.; Su, L. Photosynthetic characteristics of Tamarix chinensis under different groundwater depths in freshwater habitats. Sci. Total Environ. 2020, 761, 143221. [Google Scholar] [CrossRef] [PubMed]
- Wang, S.X.; Li, Z.J.; Wang, X.Y.; Xia, S.T.; Wang, Y.; Kuang, F.C.; Xiao, L.T. Preliminary comparative research of the photosynthetic characteristics in tobacco plants of different varieties. Chin. Agric. Sci. Bull. 2005, 21, 245–247, 252. [Google Scholar]
- Huang, Z.J.; Liu, Q.Q.; An, B.; Wu, W.J.; Sun, L.J.; Wu, P.F.; Liu, B. Effects of planting density on morphological and photosynthetic characteristics of leaves in different positions on Cunninghamia lanceolata Saplings. Forests 2021, 12, 853. [Google Scholar] [CrossRef]
- Yao, S.Y. Studies on Terminal and Lateral Buds Protection and High Quality Stem Wood Cultivation in Paulownia. Master’s Thesis, Henan Agricultural University, Zhengzhou, China, 2014. [Google Scholar]
- Liu, Q.; Zhang, Z.D.; Wang, D.Z.; Li, F.R.; Xie, L.F. Main drivers of vertical and seasonal patterns of leaf photosynthetic characteristics of young planted Larix olgensis trees. For. Res. 2024, 4, e001. [Google Scholar] [CrossRef]
- Donald, O.R.; Merchant, S.S.; Alric, J.; Barkan, A.; Blankenship, R.E.; Bock, R.; Croce, R.; Hanson, M.R.; Hibberd, J.M.; Long, S.P.; et al. Redesigning photosynthesis to sustainably meet global food and bioenergy demand. Proc. Natl. Acad. Sci. USA 2015, 112, 8529–8536. [Google Scholar]
- Liu, M.L.; Wei, J.; Ren, Z.R.; Zhang, Y.L.; Wang, Y. Research progress of stomata: From guard cells to photosynthesis. Chin. Bull. Life Sci. 2024, 36, 1289–1304. [Google Scholar]
- Si, J.H.; Chang, Z.Q.; Shu, Y.H.; Xi, H.Y.; Feng, Q. Stomatal conductance characteristics of Populus euphratica leaves and response to environmental factors in the extreme arid region. Acta Bot. Boreali-Occident. Sin. 2008, 28, 125–130. [Google Scholar]
- Li, Y.C.; Ruan, S.Q.; Li, D.S.; Liu, J.; Hu, Q.Q.; Dian, Y.Y.; Yu, Z.Q.; Zhou, J.J. Photosynthetic difference of six poplar genotypes and estimation of photosynthetic capacities based on leaf hyperspectral reflectance. For. Res. 2024, 4, e037. [Google Scholar] [CrossRef]
- Li, M.A.; Ma, L.; Zhang, Z.H.; Yao, B.Q.; Ma, Z.; Huang, X.T.; Zhou, B.R.; Xu, M.H.; Guo, J.; Zhou, H.K. Effects of drought and heat on the productivity and photosynthetic characteristics of alpine meadow plants on the Qinghai-Tibetan Plateau. J. Mt. Sci. 2021, 18, 2079–2093. [Google Scholar]
- Khan, H.R.; Link, W.; Hocking, T.J.; Stoddard, F.L. Evaluation of physiological traits for improving drought tolerance in faba bean (Vicia faba L.). Plant Soil. 2007, 292, 205–217. [Google Scholar] [CrossRef]
- Huo, H.; Wang, C.K. Effects of canopy position and leaf age on photosynthesis and transpiration of Pinus koraiensis. J. Appl. Ecol. 2007, 18, 1181–1186. [Google Scholar]
- Liu, Y.H.; Jia, Z.K.; Han, Q.F.; Zeng, Q.F. Daily dynamics of photosynthesis in alfalfa varieties under dry farming conditions. Acta Ecol. Sin. 2006, 26, 1468–1477. [Google Scholar]
- Wang, T.; Xu, Q.; Zhang, B.B.; Gao, D.Q.; Zhang, Y.; Jiang, J.; Zuo, H.J. Effects of thinning and understory removal on water use efficiency of Pinus massoniana: Evidence from photosynthetic capacity and stable carbon isotope analyses. J. For. Res. 2024, 35, 41. [Google Scholar] [CrossRef]
- Han, Q.M.; Chiba, Y.K. Leaf photosynthetic responses and related nitrogen changes associated with crown reclosure after thinning in a young Chamaecyparis obtusa stand. J. For. Res. 2009, 14, 349–357. [Google Scholar] [CrossRef]
- Wu, X.L. Studies on p Physiological Characteristics of Different Alfalfa Varieties. Master’s Thesis, Northwest A&F University, Yangling, China, 2008. [Google Scholar]
- Liang, D.Y. Study on Genetic Variation of Parents and Progenies in Pinus koraiensis Seed Orchard. Master’s Thesis, Northeast Forestry University, Harbin, China, 2021. [Google Scholar]
- Xue, Z.J.; An, S.S.; Cheng, M.; Wang, W.Z. Plant functional traits and soil microbial biomass in different vegetation zones on the Loess Plateau. J. Plant Interact. 2014, 9, 889–900. [Google Scholar] [CrossRef]
- Pintado, A.; Valladares, F.; Sancho, L. Exploring phenotypic plasticity in the lichen Ramalina capitata: Morphology, water relations and chlorophyll content in north-and south-facing populations. Ann. Bot. 1997, 80, 345–353. [Google Scholar] [CrossRef]
- Liu, J.H.; Zeng, D.H.; Don, K.L. Leaf traits and their interrelationships of main plant species in southeast Horqin sandy land. Chin. J. Ecol. 2006, 25, 921–925. [Google Scholar]
- Matesanz, S.; BlancoSánchez, M.; RamosMuñoz, M.; Cruz, M.D.L.; Benavides, R.; Escudero, A. Phenotypic integration does not constrain phenotypic plasticity: Differential plasticity of traits is associated to their integration across environments. New Phytol. 2021, 231, 2359–2370. [Google Scholar] [CrossRef]
- Rapnouil, T.L.; Gallant, C.M.; Julien, F.; Céréghino, R.; Leroy, C. Light intensity mediates phenotypic plasticity and leaf trait regionalization in a tank bromeliad. Ann. Bot. 2023, 132, 443–454. [Google Scholar] [CrossRef] [PubMed]
- Legner, N.; Fleck, S.; Leuschner, C. Within-canopy variation in photosynthetic capacity, SLA and foliar N in temperate broad-leaved trees with contrasting shade tolerance. Trees 2014, 28, 263–280. [Google Scholar] [CrossRef]
- Wang, Y.P.; Tao, J.P.; Liu, J.X.; He, Z. Response of leaf functional traits to different light regimes in an evergreen broad-leaved forest in the Jinyun Mountain. Sci. Silvae Sin. 2012, 48, 23–29. [Google Scholar]
- Cornelissen, J.H.C.; Lavorel, S.; Garnier, E.; Díaz, S.; Buchmann, N.; Gurvich, D.E.; Reich, P.B.; Steege, H.T.; Morgan, H.D.; Heijden, M.G.A.V.D.; et al. A handbook of protocols for standardised and easy measurement of plant functional traits worldwide. Aust. J. Bot. 2003, 51, 335–380. [Google Scholar] [CrossRef]
- Evans, J.R.; Poorter, H. Photosynthetic acclimation of plants to growth irradiance: The relative importance of specific leaf area and nitrogen partitioning in maximizing carbon gain. Plant Cell Environ. 2001, 24, 755–767. [Google Scholar] [CrossRef]
- Ma, X.M. Photosynthetic Characteristics and Dynamic Simulation of Net Photosynthetic Rate on the Canopy of Individual Larix principis-rupprechtii Forest. Ph.D. Thesis, Hebei Agricultural University, Baoding, China, 2022. [Google Scholar]
- Cai, J.C.; Li, Z.J.; Zhou, G.Y.; Zhao, H.B.; Wang, X.; Qiu, Z.J.; Wu, Z.M. Effects and action mechanisms of increased light availability to understory Cinnamomum camphora seedlings. J. Cent. South Univ. For. Technol. 2024, 44, 36–46. [Google Scholar]
- Lv, C.Y.; Liu, Y.H. Provenance difference in growth traits and photosynthetic characteristics of Acer catalpifolium seedlings under different shading conditions. J. Appl. Ecol. 2018, 29, 2307–2314. [Google Scholar]
- Khan, M.N.I.; Khatun, S.; Azad, M.S.; Mollick, A.S. Leaf morphological and anatomical plasticity in Sundri (Heritiera fomes Buch.-Ham.) along different canopy light and salinity zones in the Sundarbans mangrove forest, Bangladesh. Glob. Ecol. Conserv. 2020, 23, e01127. [Google Scholar] [CrossRef]
- Zhang, Y.Q.; Guo, Q.Q.; Luo, S.Q.; Pan, J.W.; Yao, S.; Gao, C.; Guo, Y.Y. Leaf morphology, structure, and function of Camellia oleifera (Abel) under different light regimes. Eur. J. Hortic. Sci. 2022, 87, 1–17. [Google Scholar] [CrossRef]
- Wang, D.; Huang, X.L.; Chen, J.Z.; Li, L.X.; Cheng, J.; Wang, S.; Liu, J.M. Plasticity of leaf traits of Juglans regia L. f. luodianense Liu et Xu seedlings under different light conditions in karst habitat. Forests 2021, 12, 81. [Google Scholar] [CrossRef]
- Feng, X.Y.; Zhou, G.S. Relationship of leaf water content with photosynthesis and soil water content in summer maize. Acta Ecol. Sin. 2018, 38, 9. [Google Scholar]
- Zheng, M.; Zhao, G.H.; Shun, X.Y.; Zhang, Q.H.; Zhao, X.; Dong, L.H.; Li, F.R.; Zhao, X.Y. Comparative analysis of cold resistance ability of Larix olgensis clones. Bull. Bot. Res. 2018, 38, 682–687. [Google Scholar]
- Liu, X.T.; Lu, Z.M.; Wu, J.G.; Yang, Y.H.; Li, S.C.; Wu, L.; Xu, Q.S.; Yu, Q.; Zhao, L.; Shun, J. Comparison of genetic impact on growth and wood traits between seedlings and clones from the same plus trees of Pinus koraiensis. J. For. Res. 2023, 34, 469–480. [Google Scholar] [CrossRef]


| Categories | Traits | F-Value | ||||||
|---|---|---|---|---|---|---|---|---|
| Density | Canopy | Position | Density × Canopy | Density × Position | Canopy × Position | Density × Canopy × Position | ||
| Physiological traits | Pn | 315.676 ** | 1639.756 ** | 922.406 ** | 84.363 ** | 28.456 ** | 92.659 ** | 24.717 ** |
| Tr | 135.387 ** | 727.99 ** | 242.421 ** | 26.529 ** | 16.087 ** | 20.247 ** | 10.278 ** | |
| WUE | 545.108 ** | 197.844 ** | 111.491 ** | 49.769 ** | 21.673 ** | 23.073 ** | 15.601 ** | |
| Gs | 347.909 ** | 341.136 ** | 349.697 ** | 34.457 ** | 25.896 ** | 41.385 ** | 16.992 ** | |
| Ci | 579.216 ** | 192.267 ** | 21.605 ** | 24.267 ** | 3.759 ** | 5.657 ** | 13.169 ** | |
| Morphological traits | LL | 18.961 ** | 14.980 ** | 2.417 ns | 18.612 ** | 1.273 ns | 6.535 ** | 1.847 * |
| LW | 63.791 ** | 59.696 ** | 5.272 ** | 12.613 ** | 2.577 * | 5.587 ** | 2.124 ** | |
| LA | 83.041 ** | 62.832 ** | 8.020 ** | 15.960 ** | 2.150 ns | 6.322 ** | 3.641 ** | |
| Traits | Pn | Tr | WUE | Gs | Ci | LL | LW | LA |
|---|---|---|---|---|---|---|---|---|
| Tr | 0.717 ** | |||||||
| WUE | 0.784 ** | 0.154 ** | ||||||
| Gs | 0.586 ** | 0.906 ** | 0.025 | |||||
| Ci | −0.705 ** | −0.189 ** | −0.868 ** | 0.010 | ||||
| LL | −0.155 ** | −0.099 * | −0.171 ** | −0.043 | 0.195 ** | |||
| LW | −0.341 ** | −0.284 ** | −0.259 ** | −0.201 ** | 0.268 ** | 0.671 ** | ||
| LA | −0.529 ** | −0.345 ** | −0.532 ** | −0.209 ** | 0.545 ** | 0.400 ** | 0.471 ** | |
| LWC | −0.534 ** | −0.586 ** | −0.305 * | −0.422 ** | 0.266 | 0.236 | 0.444 ** | 0.368 * |
| Planting Density | DBH1 (CK) | DBH1 (35% Pruning) | Percentage of DBH Growth |
|---|---|---|---|
| D1 | 0.65 | 0.72 | 10.77% |
| D2 | 0.75 | 0.84 | 12.00% |
| D3 | 0.90 | 0.85 | −5.56% |
Disclaimer/Publisher’s Note: The statements, opinions and data contained in all publications are solely those of the individual author(s) and contributor(s) and not of MDPI and/or the editor(s). MDPI and/or the editor(s) disclaim responsibility for any injury to people or property resulting from any ideas, methods, instructions or products referred to in the content. |
© 2025 by the authors. Licensee MDPI, Basel, Switzerland. This article is an open access article distributed under the terms and conditions of the Creative Commons Attribution (CC BY) license (https://creativecommons.org/licenses/by/4.0/).
Share and Cite
Zhang, T.; Liu, X.; Zhang, Q.; Xiao, H.; Han, Y.; Xing, Z.; Wang, F.; Zhao, X. Novel Patterns of Photosynthetic Activity Within Canopies of Poplar Stands with Different Densities. Plants 2025, 14, 898. https://doi.org/10.3390/plants14060898
Zhang T, Liu X, Zhang Q, Xiao H, Han Y, Xing Z, Wang F, Zhao X. Novel Patterns of Photosynthetic Activity Within Canopies of Poplar Stands with Different Densities. Plants. 2025; 14(6):898. https://doi.org/10.3390/plants14060898
Chicago/Turabian StyleZhang, Taijin, Xiaoting Liu, Qinhui Zhang, Hui Xiao, Yunong Han, Zhenghua Xing, Fusen Wang, and Xiyang Zhao. 2025. "Novel Patterns of Photosynthetic Activity Within Canopies of Poplar Stands with Different Densities" Plants 14, no. 6: 898. https://doi.org/10.3390/plants14060898
APA StyleZhang, T., Liu, X., Zhang, Q., Xiao, H., Han, Y., Xing, Z., Wang, F., & Zhao, X. (2025). Novel Patterns of Photosynthetic Activity Within Canopies of Poplar Stands with Different Densities. Plants, 14(6), 898. https://doi.org/10.3390/plants14060898