Abstract
Climate change intensifies biotic and abiotic stresses, threatening global crop productivity. High-throughput phenotyping (HTP) technologies provide a non-destructive approach to monitor plant responses to environmental stresses, offering new opportunities for both crop stress resilience and breeding research. Innovations, such as hyperspectral imaging, unmanned aerial vehicles, and machine learning, enhance our ability to assess plant traits under various environmental stresses, including drought, salinity, extreme temperatures, and pest and disease infestations. These tools facilitate the identification of stress-tolerant genotypes within large segregating populations, improving selection efficiency for breeding programs. HTP can also play a vital role by accelerating genetic gain through precise trait evaluation for hybridization and genetic enhancement. However, challenges such as data standardization, phenotyping data management, high costs of HTP equipment, and the complexity of linking phenotypic observations to genetic improvements limit its broader application. Additionally, environmental variability and genotype-by-environment interactions complicate reliable trait selection. Despite these challenges, advancements in robotics, artificial intelligence, and automation are improving the precision and scalability of phenotypic data analyses. This review critically examines the dual role of HTP in assessment of plant stress tolerance and crop performance, highlighting both its transformative potential and existing limitations. By addressing key challenges and leveraging technological advancements, HTP can significantly enhance genetic research, including trait discovery, parental selection, and hybridization scheme optimization. While current methodologies still face constraints in fully translating phenotypic insights into practical breeding applications, continuous innovation in high-throughput precision phenotyping holds promise for revolutionizing crop resilience and ensuring sustainable agricultural production in a changing climate.
1. Introduction
High-throughput phenotyping (HTP) is an automated technique used for efficiently generating data on specific traits and attributes of large plant populations [1,2,3]. This approach integrates advanced imaging systems, sensors, and automated platforms to enable precise, rapid, and non-destructive trait measurements, facilitating comprehensive plant trait analyses. HTP platforms primarily utilize spectroscopy-based methods to assess phenotypic traits, while high-performance computing systems process large datasets to evaluate morphological, physiological, and biochemical responses, growth dynamics, and gas exchange rates in plants [4]. By allowing the simultaneous observation of plants at various growth stages under various environmental conditions and the collection of multiple trait datasets across large populations, HTP enhances the efficiency and accuracy of plant phenotyping [5]. However, when using HTP platforms to evaluate plant performance under field stress conditions, a major challenge is maintaining consistent uniform stress exposure to ensure experiment reproducibility across years [4,5]. The effectiveness of plant stress-responsive phenotyping is often influenced by variations in vegetative development and genotype-by-environment (G × E) interactions, which can confound the accurate assessment of plant stress responses. To address these challenges, controlled environments, such as growth chambers, greenhouses, and rainout shelters, are essential for ensuring comparability across genotypes. Experimental designs should also account for variations in stress intensity due to plant growth differences, enhancing the reliability of phenotypic assessments. Advanced HTP approaches, such as time-series imaging and high-throughput physiological measurements, further improve stress response tracking, while machine learning models aid in distinguishing true genetic differences from environmental variability, thereby increasing the accuracy of genotype evaluation under stress conditions [5,6]. Furthermore, HTP can play a vital role in integrating these technologies into crop breeding programs. Modern HTP platforms leverage high-resolution digital imaging, three-dimensional (3D) point cloud data, hyperspectral and multispectral imaging, and thermal imaging to enhance the phenotypic assessments of segregating plant populations under breeding programs. These systems also incorporate data modeling and geometric and radiometric correction to improve measurement precision [6]. As digital phenotyping technologies continue to evolve, their adoption is expected to expand globally, facilitating advancements in crop research and breeding efforts [6]. Despite their transformative potential, the adoption of HTP technologies remains limited, particularly in resource-constrained regions where traditional phenotyping methods continue to be widely utilized. Historically, plant phenotyping relied on manual, labor-intensive, and time-consuming techniques that often made the process expensive and inefficient [7,8,9,10,11,12,13]. Rather than replacing conventional approaches, HTP may serve as a complementary tool that enhances the efficiency and scalability of phenotyping. Usually, crop traits are quantified using destructive sampling methods, requiring multiple interventions throughout the growing season, which not only increases the risk of human errors but also hinders continuous monitoring [14,15,16,17]. For instance, biomass and grain yield assessments typically involve harvesting plant tissues at specific developmental stages, limiting the ability to track plant responses over time. In contrast, non-destructive HTP approaches allow for real-time, high-throughput data collection across diverse environmental conditions, significantly enhancing the precision and efficiency of traits measurement [18,19,20].
Climate change-driven factors are posing substantial challenges to modern agriculture [21,22,23,24]. The economic impact of these environmental pressures is projected to be significant, with estimates suggesting a potential decline of up to 18% in global gross domestic product by 2050, and even greater losses anticipated by the end of the century if effective mitigation strategies are not implemented [21,25]. Among the primary contributors to reduced agricultural productivity and economic losses are plant diseases, which can lead to yield reductions of 20–30%, depending on crop type and severity of infection [26,27]. Plant stress arises when crops encounter unfavorable environmental conditions, which can be broadly classified into abiotic and biotic stressors. Abiotic factors include drought, salinity, extreme temperatures, light limitations, nutrient deficiencies, heavy metal stress, wind stress, etc., while biotic stressors encompass insect infestations and pathogen attacks [28,29]. The emergence and recurrence of plant diseases are governed by intricate interactions among host plants, pathogens, and environmental conditions, making plant health management increasingly complex in the face of erratic climate patterns [29,30,31]. In responses to these stresses, plants activate a range of defense mechanisms involving morphological, physiological, biochemical, and molecular adaptations to mitigate stress-induced damage and enhance survival [32,33,34]. For instance, drought reduces water availability, limits net photosynthesis, and often shifts resource allocation towards root development at the expense of shoot growth to improve water and nutrient absorption. Similarly, salinity disrupts water uptake, induces ion imbalance, and damages cellular functions, typically leading to reduced shoot growth, while promoting root expansion as an adaptive response [35]. Heat stress can denature proteins and impair photosynthetic efficiency, while cold stress alters membrane fluidity and disrupts metabolic pathways critical for plant development [36,37,38]. The phenotyping of plant stress research the facilitates early detection and characterization of crop responses to abiotic and biotic stressors [20,32,33], providing valuable insights for breeding stress-resilient genotypes. Moreover, integrating HTP with genomic, ecological, and agronomic research has positioned modern phenotyping as a cornerstone of crop improvement programs, accelerating the development of stress resilient cultivars and sustainable agricultural practices [7,13]. The challenges of climate change highlight the urgent need to develop resilient crop varieties using advanced technologies to safeguard global food security.
This review provides a comprehensive synthesis of advancements in plant HTP technologies and their transformative role in plant stress research and crop improvement. The discussion is structured into (i) exploring cutting-edge HTP innovations, including non-invasive imaging techniques, spectroscopy, and automated sensor platforms, highlighting their role in enhancing the accuracy and efficiency of trait assessments; (ii) examining how HTP technologies facilitate the analyses of monogenic, oligogenic, and multigenic traits, enabling genomic predictions and marker-assisted selection strategies to enhance parental material selection and hybrid development; and (iii) addressing critical challenges in HTP research, including the management of large datasets, accessibility of HTP technologies, and scalability of HTP platforms. Additionally, this review underscores the growing importance of HTP technologies in plant stress research and their potential to drive innovations in crop breeding and sustainable agricultural management.
2. HTP in Plant Stress Response and Crop Improvement
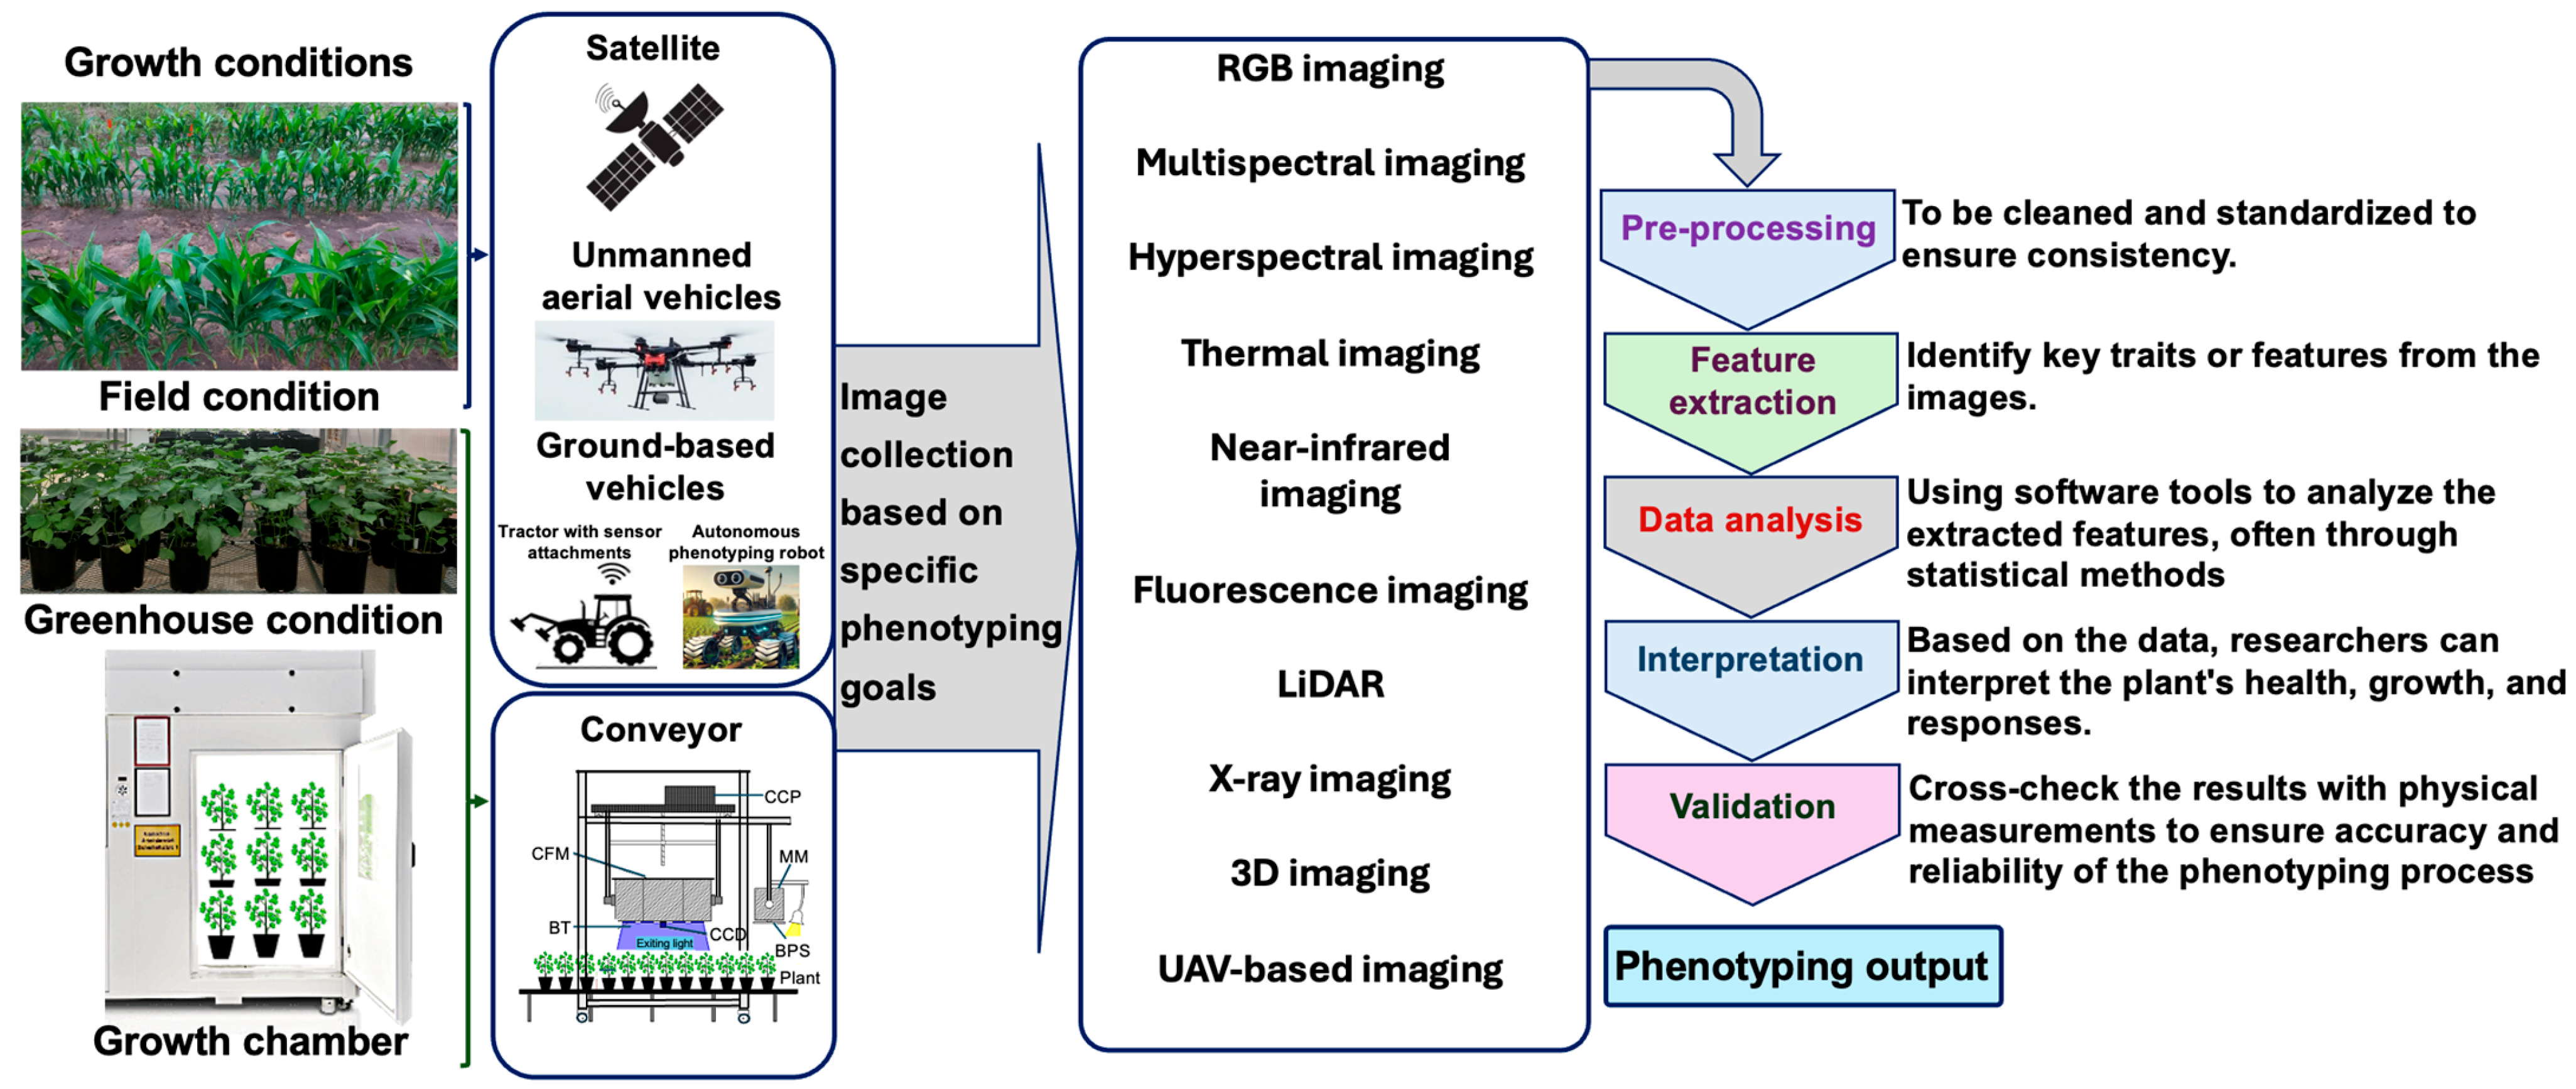
HTP enables the rapid and accurate evaluation of plant phenotypic characteristics such as growth stage, stress adaptation, disease resistance, pest susceptibility, physiology, nutrition, and yield [39]. Integrating HTP, trait-based data analysis, and artificial intelligence (AI)-driven automation has improved our understanding of plant–environment interactions [36,40,41,42,43]. One of the key advantages of HTP is its ability to efficiently measure plant traits across large populations under diverse environmental conditions [39,43,44]. HTP technologies allow researchers to collect data at various scales, ranging from whole plants to cellular and molecular levels, with unprecedented efficiency [39,45,46]. As a result, HTP has revolutionized plant breeding programs by enabling large-scale phenotyping, accelerating variety improvement, and refining our understanding of the dynamic interactions between plant genetics and environments [39]. Figure 1 illustrates a schematic representation of HTP, highlighting various phenotyping strategies and their contributions to advancing research in plant stress responses and variety improvement.
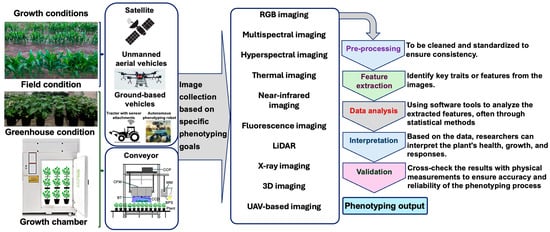
Figure 1.
A schematic illustration of high-throughput phenotyping, highlighting multiple phenotyping approaches to enable efficient and comprehensive analysis. The figure emphasizes the synergy among different techniques including imaging, sensor-based systems, and automated data collection to enhance the precision and scalability of phenotypic assessment. BPS, band-pass filter; BT, blue light-emitting diode tube; CFM, chlorophyll fluorescence module; CCD, charge-coupled device camera; CCP, circuit control panel; LiDAR, light detection and ranging; MM, multispectral module; RGB, red–green–blue; UAV, unmanned aerial vehicle; 3D, three-dimensional.
A fundamental technology in HTP is remote sensing, which employs aerial and satellite-based systems to capture detailed phenotypic data across large agricultural landscapes. The effectiveness of satellite-based remote sensing largely depends on image resolution, which can be influenced by environmental variability [44]. Remote sensing techniques provide a powerful tool for monitoring crop growth and development, detecting stress responses, identifying nutrient imbalance, and diagnosing disease outbreaks at early stage [39]. HTP platforms integrated with diverse imaging devices and sensors have been adopted to assess key agronomic traits, including vegetation indices (VIs) [47,48,49,50]. VIs are particularly valuable in HTP programs, offering non-destructive insights into plant phenotype, structure, stress levels, and biomass accumulation [51]. VIs are computed using multiple spectral bands to extract vegetation-related features and assess plant cover, vigor, and biomass on a per-pixel basis [52]. A range of spectral indices exists to evaluate different physiological and morphological characteristics from remote sensing imagery [53,54]. The selection of appropriate indices is vital for optimizing their application in specific phenotyping studies [55,56]. Near-infrared (NIR) and infrared (IR) wavelengths are commonly used to assess plant responses to biotic and abiotic stresses, as healthy vegetation typically reflects higher levels of IR light compared with stressed plants [57,58,59]. Table 1 lists several widely used VIs for phenotyping to assess plant stress responses.

Table 1.
Commonly employed vegetation indices for assessing plant stress responses.
2.1. UAV-Based HTP
Unmanned aerial vehicles (UAVs) have emerged as a powerful tool in HTP, revolutionizing plant breeding by generating extensive datasets on crop canopy spectral reflectance. Datasets serve as UAV-HTP-derived traits, providing integrated measurements of canopy architecture and photosynthetic performance based on light reflectance from crop canopies [68,69,70,71]. Among remote sensing platforms, UAV imaging is considered the most practical and cost-effective approach for large-scale HTP studies under field conditions. During flight, UAVs capture multiple images that cover specific portions of a field. Images are then stitched together to form an orthomosaic, georeferenced composite image that represents the entire study area. Several software programs including Pix4D (a photogrammetry and drone mapping software) and quantum geographic information system (QGIS) and OpenDroneMap are commonly used for orthomosaic generation and analysis [72]. Compared with satellites, UAVs fly at lower altitudes, enabling them to capture images with significantly higher spatial resolution often in the range of a few centimeters per pixel, as opposed to the meter-scale resolution of satellite imagery. Additionally, UAVs possess greater payload capacities, allowing them to carry sophisticated sensors that are typically mounted on satellite platforms [73]. While UAVs have a more limited coverage area due to constraints in flight duration and battery capacity, they offer unparalleled advantages in spatial resolution, data accuracy, and operational flexibility. UAVs characteristics make an ideal choice for targeted phenotyping applications in plant stress research and crop improvement programs [74,75]. Machine learning models offer a promising and efficient approach for phenotyping the stay-green trait in sorghum (Sorghum bicolor), enhancing breeding efforts but requiring further validation across diverse environments and genetic materials [75]. On the other hand, satellite-based platforms are subsequently analyzed using spectral indices to assess plant traits and stress responses [76,77,78]. Hyperspectral imaging enables the detection of a broad spectrum of spectral signatures from plants, providing valuable insights into their biochemical and physiological properties. In addition, 3D imaging facilitates the reconstruction of plant structures, allowing for precise measurements of structural traits such as leaf surface area, leaf orientation, and plant stature. The ability to collect high-resolution phenotypic data at a large scale is particularly crucial in addressing challenges posed by climate change, as it enhances the accuracy of crop productivity predictions and resilience assessments [6].
2.2. Non-UAV-Based HTP
Advancements in robotics and automation are also vital for enhancing non-UAV-based HTP, facilitating precise and efficient phenotyping assessments in both controlled greenhouse environments and large-scale field settings [79,80,81]. In greenhouse conditions, where environmental factors can be optimized, non-UAV-based HTP technologies offer reliable monitoring, enabling extensive data collection. Automated systems, including robotic arms, conveyors, and high-definition cameras, can autonomously perform tasks, such as irrigation, fertilization, and imaging, reducing the need for human intervention [77,82,83,84]. Although drones depend on solar radiation for imaging, robotic systems can operate independently of weather conditions by using artificial lighting for plant scenes [85,86]. Furthermore, the integration of computer vision with robotics plays a significant role in automating manufacturing processes and phenotyping tasks [87]. These approaches have shown great potential in facilitating real-time data collection and analysis, enabling large-scale crop screening. As a result, non-UAV-based HTP platforms accelerate crop breeding programs by improving trait selection and enhancing the efficiency of phenotypic assessments. Additionally, automation not only reduces labor costs but also ensures greater accuracy and consistency in phenotypic evaluations, making it an essential tool in crop improvement research [88].
2.3. Integration of Machine Learning and Deep Learning Potential with AI in HTP
The integration of machine learning, particularly deep learning approaches, has further revolutionized HTP by enabling the extraction of meaningful insights from complex datasets [89]. Machine learning-driven phenotyping plays a pivotal role in identifying genotype–phenotype relationships that were previously difficult to be elucidated. Among the deep learning techniques, convolutional neural networks (CNNs) have demonstrated high efficacy in image-based phenotyping, automating the measurement of plant traits, such as growth rates and stress responses [37]. HTP workflows incorporating deep learning technologies typically involve multiple stages, beginning with data collection, labeling, and curation to ensure high-quality input for analysis [90]. Data can be acquired from various sensors, including red–green–blue (RGB), hyperspectral, multispectral, near-infrared (NIR), fluorescence, and light detection and ranging (LiDAR) [91]. Following data acquisition, model selection and optimization strategies are applied to improve computational efficiency and accelerate model training. The development of deep learning models follows an iterative process, allowing for continuous refinement and task-specific adaptation [92]. Compared with conventional phenotyping methods, deep learning-based applications significantly streamline HTP workflows, making large-scale phenotypic analysis more accessible and efficient [76]. Ultimately, the HTP approach enables the transformation of large volumes of phenotypic data into actionable insights, driving advancements in the field of crop variety improvement and plant stress research [83]. Research on managing biotic and abiotic stressors in field crops using a variety of machine learning and deep learning techniques is summarized in Table 2.
Table 2.
Research on addressing the adverse effect of abiotic and biotic stresses in crops through the application of various machine learning and deep learning techniques.
While HTP technologies have demonstrated significant potential in plant research, many existing studies, including those referenced in Table 2, remain at the validation or calibration stage in real-world experiments. HTP studies primarily focus on refining measurement accuracy, optimizing analytical pipelines, and enhancing the reproducibility of phenotypic assessments under both controlled and field conditions. Despite this, the rapid advancements in sensor technology, imaging techniques, and data processing capabilities suggest that HTP approaches will soon transition from being used primarily for experimental validation to become a routine component of crop breeding programs. The integration of HTP in large-scale breeding efforts is expected to revolutionize plant selection by enabling precise, non-destructive, and high-throughput assessments of key agronomic traits. Images obtained from high-throughput imaging systems can also be processed and analyzed using AI algorithms, enabling the identification of key patterns and traits within the plant phenotypic data. The ability of AI to assess plant growth factors, distinguish leaf morphologies, and detect early signs of disease symptoms makes it a very useful tool in plant phenotyping [106]. Within the framework of HTP, AI algorithms utilize a range of data types, including environmental conditions, genomic information, and imaging data, to evaluate and better understand plant traits [39]. By integrating diverse datasets, AI methodologies can uncover complex relationships between the environment, phenotype, and genetics, facilitating deeper insights into plant development. Furthermore, AI-driven predictive models that correlate phenotypic data with other factors such as genotype and environmental conditions advance our capacity to predict and optimize plant growth and resilience in various agricultural contexts [107].
2.4. Integration of HTP-Derived Traits with Genomic
HTP platforms offer potential in connecting genotypes to phenotypes by enhancing data collection capabilities (beyond visual range, repeated measurements, and big data processing), boosting measurement precision, and reducing the time needed to assess field populations on a large scale [108]. HTP can be effectively implemented across multiple growth stages and diverse environmental conditions, significantly enhancing phenotypic datasets and increasing the accuracy of accession selection from segregating population in plant breeding programs [109,110]. The combination of HTP with advanced genomic techniques, such as genome-wide association studies (GWAS) and quantitative trait locus (QTL) mapping, has substantially advanced the understanding of the genetic architecture underlying complex quantitative traits in crops [5]. The integration of HTP-derived traits with genomic facilitates the accelerated development of high-yielding varieties with improved resilience to climate change-induced stresses [71]. Research has been dedicated to elucidating the genetic mechanisms of stress tolerance, including phosphorus deficiency in rapeseed (Brassica napus) [111], drought responses in barley (Hordeum vulgare) [109], salinity tolerance in rice (Oryza sativa) [112], and drought tolerance in both rice and maize (Zea mays) [72,113]. Advancements in plant phenomics and genomics have provided valuable insights into the genetic basis of stress tolerance, enabling more efficient plant breeding strategies for crop improvement.
3. Limitations and Challenges of HTP in Agricultural Applications
Advanced HTP methods in plant stress and crop improvement research face several limitations that hinder their efficiency in agricultural applications.
Data storage and real-time processing: A key obstacle for large-scale applications in precision agriculture lies in data storage and immediate data processing. Hyperspectral imaging produces large-scale volumes of data, which represents a major challenge presenting major contests for efficient data storage and analyses. Each hyperspectral image can encompass hundreds to thousands of spectral bands, resulting in large file sizes that demand substantial storage capacity [114]. The demand for the swift and efficient processing of these huge datasets to deliver immediate data-driven insights necessitates extensive computational capacity and optimized logic sequences. Additionally, handling and preserving the accuracy of these large datasets over time may pose further challenges, especially in isolated or resource-constrained agricultural areas [114].
Cost and accessibility: Another limitation for large-scale implementation is the cost and accessibility of advanced HTP technologies in individual and resource-poor agricultural areas. The substantial upfront cost of hyperspectral imaging equipment continues to be a major obstacle to extensive adoption, especially for small- to mid-scale agricultural enterprises. However, hyperspectral approaches have proven useful for advancing multispectral investigations by identifying the most relevant reflectance bands, which is essential for the further design of multispectral cameras and their applications.
Field conditions and environmental variability: Agricultural environments are inherently diverse, with varying soil types and unpredictable meteorological patterns, all of which can affect the precision of spectral reflectance measurements. For instance, fluctuations in solar intensity and angle may result in irregular spectral sensor measurements. Soil hydration, texture, and arrangement also affect plant spectral traits, making it difficult to ensure consistent data integrity throughout fields.
Incorporation with existing farming practices: The effortless incorporation of hyperspectral imaging techniques into prevailing agricultural practices can be challenging and possibly destabilizing. Agricultural researchers or farmers familiar with conventional practices may find that the introduction of new technologies requires adjustments in workflows and training. Integrating new farming technologies with digital phenotyping tools must be seamless, ensuring efficiency without disrupting agricultural processes.
Standardization and regulatory issues: A lack of standardized protocols is a significant barrier to the seamless integration and comparison of results across various studies and platforms. Without a common framework, researchers face challenges in replicating and validating findings, which hinders scientific progress and collaboration. Additionally, researchers and operators must follow regulations when using drones for agricultural research. In the United States, the Federal Aviation Administration (FAA)’s Part 107 rules require remote pilot certification or special approval for legally flying drones over field trials [115]. Furthermore, FAA rules also require UAV operator registration and pilot training. Globally, UAV operations must comply with diverse national and regional regulations, further complicating the widespread adoption of drone technology in agricultural practice [116]. By overcoming traditional phenotyping limitations, such as labor-intensive data collection and environmental variability, HTP can facilitate the more efficient screening of stress-tolerant genotypes. Future research should focus on standardizing data acquisition protocols, improving the cost-effectiveness of HTP platforms, and addressing challenges related to large-scale deployment in breeding trials. As HTP technologies continue to evolve, their incorporation into breeding pipelines will enhance selection efficiency and accelerate genetic gains in crop improvement programs.
4. Conclusions
As climate change intensifies and the need for resilient crops becomes more urgent, advanced phenotyping technologies are set to play a pivotal role in modern agriculture. Overcoming current limitations through interdisciplinary collaboration and investment in scalable, accessible solutions will be essential to fully harness the potential of HTP in ensuring a sustainable agriculture. The continued development of HTP tools holds a great promise for accelerating advancements in plant stress research, crop breeding, and phenotyping technologies. However, deployment in precision phenotyping may differ significantly in field applications, posing challenges for widespread implementation across diverse agricultural settings. To enable seamless integration, the design of high-performance, cost-effective HTP solutions must remain a priority, ensuring reliable, automated data collection from diverse environments. One of the most pressing challenges for future HTP applications is managing the vast amounts of sensor-generated data and imagery produced by multifunctional phenotyping platforms. The complexity of data handling, retention, and interpretation will continue to grow, influenced by sensor resolution and the number of variables measured. To facilitate broader adoption of HTP in crop improvement programs, the development of cost-effective and accessible data analysis infrastructure will be critical, enabling researchers and breeders to efficiently extract meaningful insights.
Author Contributions
Conceptualization, M.A.R.K., L.-S.P.T. and C.V.H.; validation, M.A.R.K., L.-S.P.T. and C.V.H.; investigation, M.A.R.K., L.-S.P.T. and C.V.H.; resources, M.A.R.K.; writing—original draft preparation, H.T.N., M.A.R.K. and C.V.H.; writing—review and editing, N.T.P., T.T.N., T.T.B.N., T.R.A., M.D.N., M.L., K.H.N., U.K.G., M.A.R.K., L.-S.P.T. and C.V.H. All authors have read and agreed to the published version of the manuscript.
Funding
This research received no external funding.
Data Availability Statement
All data generated or analyzed during this study are included in this published article.
Conflicts of Interest
The authors declare no conflicts of interest.
References
- Xiao, Q.; Bai, X.; Zhang, C.; He, Y. Advanced high-throughput plant phenotyping techniques for genome-wide association studies: A review. J. Adv. Res. 2022, 35, 215–230. [Google Scholar] [CrossRef] [PubMed]
- Kumari, P.; Gangwar, H.; Kumar, V.; Jaiswal, V.; Gahlaut, V. Crop Phenomics and High-Throughput Phenotyping. In Digital Agriculture: A Solution for Sustainable Food and Nutritional Security; Springer: Berlin/Heidelberg, Germany, 2024; pp. 391–423. [Google Scholar] [CrossRef]
- Yang, W.; Feng, H.; Hu, X.; Song, J.; Guo, J.; Lu, B. An Overview of High-Throughput Crop Phenotyping: Platform, Image Analysis, Data Mining, and Data Management. In Plant Functional Genomics; Methods in Molecular Biology Series; Maghuly, F., Ed.; Humana: New York, NY, USA, 2024; p. 2787. [Google Scholar] [CrossRef]
- Fu, X.; Jiang, D. High-throughput phenotyping: The latest research tool for sustainable crop production under global climate change scenarios. In Sustainable Crop Productivity and Quality Under Climate Change; Academic Press: Cambridge, MA, USA, 2022; pp. 313–381. [Google Scholar] [CrossRef]
- Yang, W.; Feng, H.; Zhang, X.; Zhang, J.; Doonan, J.H.; Batchelor, W.D.; Xiong, L.; Yan, J. Crop phenomics and high-throughput phenotyping: Past decades, current challenges, and future perspectives. Mol. Plant 2020, 13, 187–214. [Google Scholar] [CrossRef] [PubMed]
- Li, D.; Quan, C.; Song, Z.; Li, X.; Yu, G.; Li, C.; Muhammad, A. High-throughput plant phenotyping platform (HT3P) as a novel tool for estimating agronomic traits from the lab to the field. Front. Bioeng. Biotechnol. 2021, 8, 623705. [Google Scholar] [CrossRef]
- Li, Z.; Guo, R.; Li, M.; Chen, Y.; Li, G. A review of computer vision technologies for plant phenotyping. Comput. Electron. Agric. 2020, 176, 105672. [Google Scholar] [CrossRef]
- McMullen, M.D.; Kresovich, S.; Villeda, H.S.; Bradbury, P.; Li, H.; Sun, Q.; Flint-Garcia, S.; Thornsberry, J.; Acharya, C.; Bottoms, C.; et al. Genetic properties of the maize nested association mapping population. Science 2009, 325, 737–740. [Google Scholar] [CrossRef]
- Andrade-Sanchez, P.; Gore, M.A.; Heun, J.T.; Thorp, K.R.; Carmo-Silva, A.E.; French, A.N.; Salvucci, M.E.; White, J.W. Development and evaluation of a field-based high-throughput phenotyping platform. Funct. Plant Biol. 2013, 41, 68–79. [Google Scholar] [CrossRef]
- Fahlgren, N.; Feldman, M.; Gehan, M.A.; Wilson, M.S.; Shyu, C.; Bryant, D.W.; Hill, S.T.; McEntee, C.J.; Warnasooriya, S.N.; Kumar, I.; et al. A versatile phenotyping system and analytics platform reveals diverse temporal responses to water availability in Setaria. Mol. Plant 2015, 8, 1520–1535. [Google Scholar] [CrossRef]
- Vijayarangan, S.; Sodhi, P.; Kini, P.; Bourne, J.; Du, S.; Sun, H.; Poczos, B.; Dimitrios, A.; Wettergreen, D. High-throughput robotic phenotyping of energy sorghum crops. In Field and Service Robotics: Results of the 11th International Conference; Springer International Publishing: Berlin/Heidelberg, Germany, 2018; pp. 99–113. [Google Scholar]
- Ge, Y.; Atefi, A.; Zhang, H.; Miao, C.; Ramamurthy, R.K.; Sigmon, B.; Yang, J.; Schnable, J.C. High-throughput analysis of leaf physiological and chemical traits with VIS–NIR–SWIR spectroscopy: A case study with a maize diversity panel. Plant Methods 2019, 15, 1–12. [Google Scholar] [CrossRef]
- Hassanijalilian, O.; Igathinathane, C.; Bajwa, S.; Nowatzki, J. Rating iron deficiency in soybean using image processing and decision-tree based models. Remote Sens. 2020, 12, 4143. [Google Scholar] [CrossRef]
- Granier, C.; Tardieu, F. Multi-scale phenotyping of leaf expansion in response to environmental changes: The whole is more than the sum of parts. Plant Cell Environ. 2009, 32, 1175–1184. [Google Scholar] [CrossRef]
- Dhondt, S.; Wuyts, N.; Inzé, D. Cell to whole-plant phenotyping: The best is yet to come. Trends Plant Sci. 2013, 18, 428–439. [Google Scholar] [CrossRef] [PubMed]
- Li, L.; Zhang, Q.; Huang, D. A review of imaging techniques for plant phenotyping. Sensors 2014, 14, 20078–20111. [Google Scholar] [CrossRef] [PubMed]
- Bouguettaya, A.; Zarzour, H.; Kechida, A.; Taberkit, A.M. Deep learning techniques to classify agricultural crops through UAV imagery: A review. Neural Comput. Appl. 2022, 34, 9511–9536. [Google Scholar] [CrossRef]
- Richards, R.A.; Rebetzke, G.J.; Watt, M.; Condon, A.T.; Spielmeyer, W.; Dolferus, R. Breeding for improved water productivity in temperate cereals: Phenotyping, quantitative trait loci, markers and the selection environment. Funct. Plant Biol. 2010, 37, 85–97. [Google Scholar] [CrossRef]
- Furbank, R.T.; Tester, M. Phenomics–technologies to relieve the phenotyping bottleneck. Trends Plant Sci. 2011, 16, 635–644. [Google Scholar] [CrossRef]
- Atefi, A.; Ge, Y.; Pitla, S.; Schnable, J. Robotic technologies for high-throughput plant phenotyping: Contemporary reviews and future perspectives. Front. Plant Sci. 2021, 12, 611940. [Google Scholar] [CrossRef]
- Pineda, M.; Barón, M.; Pérez-Bueno, M.L. Thermal imaging for plant stress detection and phenotyping. Remote Sens. 2020, 13, 68. [Google Scholar] [CrossRef]
- Ghosh, U.K.; Islam, M.N.; Siddiqui, M.N.; Cao, X.; Khan, M.A.R. Proline, a multifaceted signalling molecule in plant responses to abiotic stress: Understanding the physiological mechanisms. Plant Biol. 2022, 24, 227–239. [Google Scholar] [CrossRef]
- Dixit, S.; Sivalingam, P.N.; Baskaran, R.K.M.; Senthil-Kumar, M.; Ghosh, P.K. Plant responses to concurrent abiotic and biotic stress: Unravelling physiological and morphological mechanisms. Plant Physiol. Rep. 2024, 29, 6–17. [Google Scholar] [CrossRef]
- Sharma, P.; Kumari, A. Approaches to Enhance Abiotic and Biotic Stress Tolerance in Leguminous Crops and Microgreens. In Recent Trends and Applications of Leguminous Microgreens as Functional Foods; Springer Nature: Cham, Switzerland, 2025; pp. 179–215. [Google Scholar] [CrossRef]
- Stevanović, M.; Popp, A.; Lotze-Campen, H.; Dietrich, J.P.; Müller, C.; Bonsch, M.; Weindl, I. The impact of high-end climate change on agricultural welfare. Sci. Adv. 2016, 2, e1501452. [Google Scholar] [CrossRef]
- Carvajal-Yepes, M.; Cardwell, K.; Nelson, A.; Garrett, K.A.; Giovani, B.; Saunders, D.G.; Tohme, J. A global surveillance system for crop diseases. Science 2019, 364, 1237–1239. [Google Scholar] [CrossRef] [PubMed]
- Zhan, J.; Thrall, P.H.; Papaïx, J.; Xie, L.; Burdon, J.J. Playing on a pathogen’s weakness: Using evolution to guide sustainable plant disease control strategies. Annu. Rev. Phytopathol. 2015, 53, 19–43. [Google Scholar] [CrossRef] [PubMed]
- Strange, R.N.; Scott, P.R. Plant disease: A threat to global food security. Annu. Rev. Phytopathol. 2005, 43, 83–116. [Google Scholar] [CrossRef] [PubMed]
- Singh, A.; Jones, S.; Ganapathysubramanian, B.; Sarkar, S.; Mueller, D.; Sandhu, K.; Nagasubramanian, K. Challenges and opportunities in machine-augmented plant stress phenotyping. Trends Plant Sci. 2021, 26, 53–69. [Google Scholar] [CrossRef]
- Anderson, P.K.; Cunningham, A.A.; Patel, N.G.; Morales, F.J.; Epstein, P.R.; Daszak, P. Emerging infectious diseases of plants: Pathogen pollution, climate change and agrotechnology drivers. Trends Ecol. Evol. 2004, 19, 535–544. [Google Scholar] [CrossRef]
- Evans, N.; Baierl, A.; Semenov, M.A.; Gladders, P.; Fitt, B.D. Range and severity of a plant disease increased by global warming. J. R. Soc. Interface 2008, 5, 525–531. [Google Scholar] [CrossRef]
- Berens, M.L.; Berry, H.M.; Mine, A.; Argueso, C.T.; Tsuda, K. Evolution of hormone signaling networks in plant defense. Annu. Rev. Phytopathol. 2017, 55, 401–425. [Google Scholar] [CrossRef]
- Lamaoui, M.; Jemo, M.; Datla, R.; Bekkaoui, F. Heat and drought stresses in crops and approaches for their mitigation. Front. Chem. 2018, 6, 26. [Google Scholar] [CrossRef]
- Seleiman, M.F.; Al-Suhaibani, N.; Ali, N.; Akmal, M.; Alotaibi, M.; Refay, Y.; Battaglia, M.L. Drought stress impacts on plants and different approaches to alleviate its adverse effects. Plants 2021, 10, 259. [Google Scholar] [CrossRef]
- Acosta-Motos, J.; Fernanda Ortuno, M.; Bernal-Vicente, A.; Diaz-Vivancos, P.; Jesus Sanchez-Blanco, M.; Antonio Hernandez, J. Plant responses to salt stress: Adaptive mechanisms. Agronomy 2017, 7, 18. [Google Scholar] [CrossRef]
- Hasanuzzaman, M.; Nahar, K.; Alam, M.M.; Roychowdhury, R.; Fujita, M. Physiological, biochemical, and molecular mechanisms of heat stress tolerance in plants. Int. J. Mol. Sci. 2013, 14, 9643–9684. [Google Scholar] [CrossRef] [PubMed]
- Jiang, Y.; Li, C. Convolutional neural networks for image-based high-throughput plant phenotyping: A review. Plant Phenomics 2020, 2020, 4152816. [Google Scholar] [CrossRef] [PubMed]
- Hemantaranjan, A. Plant Stress Tolerance Physiological & Molecular Strategies; Scientific Publishers: Stevenson Ranch, CA, USA, 2016. [Google Scholar]
- Sheikh, M.; Iqra, F.; Ambreen, H.; Pravin, K.A.; Ikra, M.; Chung, Y.S. Integrating artificial intelligence and high-throughput phenotyping for crop improvement. J. Integr. Agric. 2024, 23, 1787–1802. [Google Scholar] [CrossRef]
- Shakoor, N.; Lee, S.; Mockler, T.C. High throughput phenotyping to accelerate crop breeding and monitoring of diseases in the field. Curr. Opin. Plant Biol. 2017, 38, 184–192. [Google Scholar] [CrossRef] [PubMed]
- Mir, R.R.; Reynolds, M.; Pinto, F.; Khan, M.A.; Bhat, M.A. High-throughput phenotyping for crop improvement in the genomics era. Plant Sci. 2019, 282, 60–72. [Google Scholar] [CrossRef]
- Da Silva, E.E.; Baio, F.H.R.; Teodoro, L.P.R.; da Silva Junior, C.A.; Borges, R.S.; Teodoro, P.E. UAV-multispectral and vegetation indices in soybean grain yield prediction based on in situ observation. Remote Sens. Appl. Soc. Environ. 2020, 18, 100318. [Google Scholar] [CrossRef]
- Teodoro, P.E.; Teodoro, L.P.; Baio, F.H.; Silva Junior, C.A.; Santana, D.C.; Bhering, L.L. High-throughput phenotyping in maize and soybean genotypes using vegetation indices and computational intelligence. Plant Methods 2024, 20, 164. [Google Scholar] [CrossRef]
- Nguyen, C.; Sagan, V.; Bhadra, S.; Moose, S. UAV multisensory data fusion and multi-task deep learning for high-throughput maize phenotyping. Sensors 2023, 23, 1827. [Google Scholar] [CrossRef]
- Foix, S.; Alenyà, G.; Torras, C. Task-driven active sensing framework applied to leaf probing. Comput. Electron. Agric. 2018, 147, 166–175. [Google Scholar] [CrossRef]
- Fahlgren, N.; Gehan, M.A.; Baxter, I. Lights, camera, action: High-throughput plant phenotyping is ready for a close-up. Curr. Opin. Plant Biol. 2015, 24, 93–99. [Google Scholar] [CrossRef]
- Stewart, E.L.; Hagerty, C.H.; Mikaberidze, A.; Mundt, C.C.; Zhong, Z.; McDonald, B.A. An improved method for measuring quantitative resistance to the wheat pathogen Zymoseptoria tritici using high-throughput automated image analysis. Phytopathology 2016, 106, 782–788. [Google Scholar] [CrossRef] [PubMed]
- Jimenez-Berni, J.A.; Deery, D.M.; Rozas-Larraondo, P.; Condon, A.T.G.; Rebetzke, G.J.; James, R.A.; Bovill, W.D.; Furbank, R.T.; Sirault, X.R.R. High throughput determination of plant height, ground cover, and above-ground biomass in wheat with LiDAR. Front. Plant Sci. 2018, 9, 237. [Google Scholar] [CrossRef] [PubMed]
- Khan, Z.; Rahimi-Eichi, V.; Haefele, S.; Garnett, T.; Miklavcic, S.J. Estimation of vegetation indices for high-throughput phenotyping of wheat using aerial imaging. Plant Methods 2018, 14, 20. [Google Scholar] [CrossRef]
- Rincent, R.; Charpentier, J.P.; Faivre-Rampant, P.; Paux, E.; Le Gouis, J.; Bastien, C.; Segura, V. Phenomic selection is a low-cost and high-throughput method based on indirect predictions: Proof of concept on wheat and poplar. G3 Genes Genomes Genet. 2018, 8, 3961–3972. [Google Scholar] [CrossRef] [PubMed]
- Crain, J.; Wang, X.; Evers, B.; Poland, J. Evaluation of field-based single plant phenotyping for wheat breeding. Plant Phenome J. 2022, 5, e20045. [Google Scholar] [CrossRef]
- Huang, L.; Luo, R.; Liu, X.; Hao, X. Spectral imaging with deep learning. Light Sci. Appl. 2022, 11, 61. [Google Scholar] [CrossRef]
- Pasternak, M.; Pawluszek-Filipiak, K. The evaluation of spectral vegetation indexes and redundancy reduction on the accuracy of crop type detection. Appl. Sci. 2022, 12, 5067. [Google Scholar] [CrossRef]
- Giovos, R.; Tassopoulos, D.; Kalivas, D.; Lougkos, N.; Priovolou, A. Remote sensing vegetation indices in viticulture: A critical review. Agriculture 2021, 11, 457. [Google Scholar] [CrossRef]
- Feng, L.; Chen, S.; Zhang, C.; Zhang, Y.; He, Y. A comprehensive review on recent applications of unmanned aerial vehicle remote sensing with various sensors for high-throughput plant phenotyping. Comput. Electron. Agric. 2021, 182, 106033. [Google Scholar] [CrossRef]
- Tayade, R.; Yoon, J.; Lay, L.; Khan, A.L.; Yoon, Y.; Kim, Y. Utilization of spectral indices for high-throughput phenotyping. Plants 2022, 11, 1712. [Google Scholar] [CrossRef]
- Zahir, S.A.D.M.; Omar, A.F.; Jamlos, M.F.; Azmi, M.A.M.; Muncan, J. A review of visible and near-infrared (Vis-NIR) spectroscopy application in plant stress detection. Sens. Actuators A Phys. 2022, 338, 113468. [Google Scholar] [CrossRef]
- Sanaeifar, A.; Yang, C.; de la Guardia, M.; Zhang, W.; Li, X.; He, Y. Proximal hyperspectral sensing of abiotic stresses in plants. Sci. Total Environ. 2023, 861, 160652. [Google Scholar] [CrossRef] [PubMed]
- Dhaliwal, S.S.; Sharma, V.; Shivay, Y.S.; Gupta, R.K.; Verma, V.; Kaur, M.; Nisar, S.; Bhat, M.A.; Hossain, A. Assessment and detection of biotic and abiotic stresses in field crops through remote and proximal sensing techniques—Evidence from earlier findings. Arab. J. Geosci. 2024, 17, 188. [Google Scholar] [CrossRef]
- Tucker, C.J. Red and photographic infrared linear combinations for monitoring vegetation. Remote Sens. Environ. 1979, 8, 127–150. [Google Scholar] [CrossRef]
- Gitelson, A.A.; Kaufman, Y.J.; Stark, R.; Rundquist, D. Novel algorithms for remote estimation of vegetation fraction. Remote Sens. Environ. 2002, 80, 76–87. [Google Scholar] [CrossRef]
- Louhaichi, M.; Borman, M.M.; Johnson, D.E. Spatially located platform and aerial photography for documentation of grazing impacts on wheat. Geocarto Int. 2001, 16, 65–70. [Google Scholar] [CrossRef]
- Gitelson, A.A.; Kaufman, Y.J.; Merzlyak, M.N. Use of a green channel in remote sensing of global vegetation from EOS-MODIS. Remote Sens. Environ. 1996, 58, 289–298. [Google Scholar] [CrossRef]
- Hunt, E.R., Jr.; Daughtry, C.S.T.; Eitel, J.U.; Long, D.S. Remote sensing leaf chlorophyll content using a visible band index. Agron. J. 2011, 103, 1090–1099. [Google Scholar] [CrossRef]
- Dash, J.; Curran, P.J. The MERIS terrestrial chlorophyll index. Int. J. Remote Sens. 2004, 25, 5403–5413. [Google Scholar] [CrossRef]
- Vincini, M.; Frazzi, E.R.M.E.S.; D’Alessio, P.A.O.L.O. A broad-band leaf chlorophyll vegetation index at the canopy scale. Precis. Agric. 2008, 9, 303–319. [Google Scholar] [CrossRef]
- Gitelson, A.A.; Gritz, Y.; Merzlyak, M.N. Relationships between leaf chlorophyll content and spectral reflectance and algorithms for non-destructive chlorophyll assessment in higher plant leaves. J. Plant Physiol. 2003, 160, 271–282. [Google Scholar] [CrossRef]
- Huete, A.; Didan, K.; Miura, T.; Rodriguez, E.P.; Gao, X.; Ferreira, L.G. Overview of the radiometric and biophysical performance of the MODIS vegetation indices. Remote Sens. Environ. 2002, 83, 195–213. [Google Scholar] [CrossRef]
- Reynolds, M.; Langridge, P. Physiological breeding. Curr. Opin. Plant Biol. 2016, 31, 162–171. [Google Scholar] [CrossRef]
- Krause, M.R.; Mondal, S.; Crossa, J.; Singh, R.P.; Pinto, F.; Haghighattalab, A.; Shrestha, S.; Rutkoski, J.; Gore, M.A.; Sorrells, M.E.; et al. Aerial high-throughput phenotyping enables indirect selection for grain yield at the early generation, seed-limited stages in breeding programs. Crop Sci. 2020, 60, 3096–3114. [Google Scholar] [CrossRef]
- Kaushal, S.; Gill, H.S.; Billah, M.M.; Khan, S.N.; Halder, J.; Bernardo, A.; Amand, P.S.; Bai, G.; Glover, K.; Maimaitijiang, M.; et al. Enhancing the potential of phenomic and genomic prediction in winter wheat breeding using high-throughput phenotyping and deep learning. Front. Plant Sci. 2024, 15, 1410249. [Google Scholar] [CrossRef]
- Zhang, Z.; Qu, Y.; Ma, F.; Lv, Q.; Zhu, X.; Guo, G.; Li, M.; Yang, W.; Que, B.; Zhang, Y.; et al. Integrating high-throughput phenotyping and genome-wide association studies for enhanced drought resistance and yield prediction in wheat. New Phytol. 2024, 243, 1758–1775. [Google Scholar] [CrossRef]
- Rasmussen, J.; Azim, S.; Boldsen, S.K.; Nitschke, T.; Jensen, S.M.; Nielsen, J.; Christensen, S. The challenge of reproducing remote sensing data from satellites and unmanned aerial vehicles (UAVs) in the context of management zones and precision agriculture. Precis. Agric. 2021, 22, 834–851. [Google Scholar] [CrossRef]
- Mohsan, S.A.H.; Khan, M.A.; Noor, F.; Ullah, I.; Alsharif, M.H. Towards the unmanned aerial vehicles (UAVs): A comprehensive review. Drones 2022, 6, 147. [Google Scholar] [CrossRef]
- Pugh, N.A.; Young, A.; Emendack, Y.; Sanchez, J.; Xin, Z.; Hayes, C. High-throughput phenotyping of stay-green in a sorghum breeding program using unmanned aerial vehicles and machine learning. Plant Phenome J. 2025, 8, e70014. [Google Scholar] [CrossRef]
- Gill, T.; Gill, S.K.; Saini, D.K.; Chopra, Y.; de Koff, J.P.; Sandhu, K.S. A comprehensive review of high throughput phenotyping and machine learning for plant stress phenotyping. Phenomics 2022, 2, 156–183. [Google Scholar] [CrossRef]
- Ghimire, A.; Kim, S.-H.; Cho, A.; Jang, N.; Ahn, S.; Islam, M.S.; Mansoor, S.; Chung, Y.S.; Kim, Y. Automatic evaluation of soybean seed traits using RGB image data and a python algorithm. Plants 2023, 12, 3078. [Google Scholar] [CrossRef] [PubMed]
- Karunathilake, E.M.B.M.; Le, A.T.; Heo, S.; Chung, Y.S.; Mansoor, S. The path to smart farming: Innovations and opportunities in precision agriculture. Agriculture 2023, 13, 1593. [Google Scholar] [CrossRef]
- Liu, H.; Bruning, B.; Garnett, T.; Berger, B. Hyperspectral imaging and 3D technologies for plant phenotyping: From satellite to close-range sensing. Comput. Electron. Agric. 2020, 175, 105621. [Google Scholar] [CrossRef]
- Sarić, R.; Nguyen, V.D.; Burge, T.; Berkowitz, O.; Trtílek, M.; Whelan, J.; Lewsey, M.G.; Čustović, E. Applications of hyperspectral imaging in plant phenotyping. Trends Plant Sci. 2022, 27, 301–315. [Google Scholar] [CrossRef]
- Xu, R.; Li, C. A review of high-throughput field phenotyping systems: Focusing on ground robots. Plant Phenomics 2022, 2022, 9760269. [Google Scholar] [CrossRef]
- Fonteijn, H.; Afonso, M.; Lensink, D.; Mooij, M.; Faber, N.; Vroegop, A.; Polder, G.; Wehrens, R. Automatic phenotyping of tomatoes in production greenhouses using robotics and computer vision: From theory to practice. Agronomy 2021, 11, 1599. [Google Scholar] [CrossRef]
- Washington, P.; Park, N.; Srivastava, P.; Voss, C.; Kline, A.; Varma, M.; Tariq, Q.; Kalantarian, H.; Schwartz, J.; Patnaik, R.; et al. Data-driven diagnostics and the potential of mobile artificial intelligence for digital therapeutic phenotyping in computational psychiatry. Biol. Psychiatry Cogn. Neurosci. Neuroimaging 2020, 5, 759–769. [Google Scholar] [CrossRef]
- Chawade, A.; van Ham, J.; Blomquist, H.; Bagge, O.; Alexandersson, E.; Ortiz, R. High-throughput field-phenotyping tools for plant breeding and precision agriculture. Agronomy 2019, 9, 258. [Google Scholar] [CrossRef]
- Cudjoe, D.K.; Virlet, N.; Castle, M.; Riche, A.B.; Mhada, M.; Waine, T.W.; Mohareb, F.; Hawkesford, M.J. Field phenotyping for African crops: Overview and perspectives. Front. Plant Sci. 2023, 14, 1219673. [Google Scholar] [CrossRef]
- Wang, Y.H.; Su, W.H. Convolutional neural networks in computer vision for grain crop phenotyping: A review. Agronomy 2022, 12, 2659. [Google Scholar] [CrossRef]
- Arya, S.; Sandhu, K.S.; Singh, J.; Kumar, S. Deep learning: As the new frontier in high-throughput plant phenotyping. Euphytica 2022, 218, 47. [Google Scholar] [CrossRef]
- Fan, K.J.; Su, W.H. Applications of fluorescence spectroscopy, RGB-and multispectral imaging for quality determinations of white meat: A review. Biosensors 2022, 12, 76. [Google Scholar] [CrossRef] [PubMed]
- Bian, K.; Priyadarshi, R. Machine learning optimization techniques: A Survey, classification, challenges, and Future Research Issues. Arch. Comput. Methods Eng. 2024, 31, 4209–4233. [Google Scholar] [CrossRef]
- Mansoor, S.; Karunathilake, E.M.B.M.; Tuan, T.T.; Chung, Y.S. Genomics, Phenomics, and Machine Learning in Transforming Plant Research: Advancements and Challenges. Hortic. Plant J. 2024, 11, 486–503. [Google Scholar] [CrossRef]
- Bian, J.; Zhang, Z.; Chen, J.; Chen, H.; Cui, C.; Li, X.; Chen, S.; Fu, Q. Simplified evaluation of cotton water stress using high resolution unmanned aerial vehicle thermal imagery. Remote Sens. 2019, 11, 267. [Google Scholar] [CrossRef]
- Prabhakar, M.; Prasad, Y.G.; Vennila, S.; Thirupathi, M.; Sreedevi, G.; Rao, G.R.; Venkateswarlu, B. Hyperspectral indices for assessing damage by the solenopsis mealybug (Hemiptera: Pseudococcidae) in cotton. Comput. Electron. Agric. 2013, 97, 61–70. [Google Scholar] [CrossRef]
- Al-Tamimi, N.; Brien, C.; Oakey, H.; Berger, B.; Saade, S.; Ho, Y.S.; Schmöckel, S.M.; Tester, M.; Negrão, S. Salinity tolerance loci revealed in rice using high-throughput non-invasive phenotyping. Nat. Commun. 2016, 7, 13342. [Google Scholar] [CrossRef]
- Campbell, M.T.; Knecht, A.C.; Berger, B.; Brien, C.J.; Wang, D.; Walia, H. Integrating image-based phenomics and association analysis to dissect the genetic architecture of temporal salinity responses in rice. Plant Physiol. 2015, 168, 1476–1489. [Google Scholar] [CrossRef]
- Lu, Y.; Yi, S.; Zeng, N.; Liu, Y.; Zhang, Y. Identification of rice diseases using deep convolutional neural networks. Neurocomputing 2017, 267, 378–384. [Google Scholar] [CrossRef]
- Dangwal, N.; Patel, N.R.; Kumari, M.; Saha, S.K. Monitoring of water stress in wheat using multispectral indices derived from Landsat-TM. Geocarto Int. 2016, 31, 682–693. [Google Scholar] [CrossRef]
- Behmann, J.; Schmitter, P.; Steinrücken, J.; Plümer, L. Ordinal classification for efficient plant stress prediction in hyperspectral data. Int. Arch. Photogramm. Remote Sens. Spat. Inf. Sci. 2014, 40, 29–36. [Google Scholar] [CrossRef]
- Römer, C.; Wahabzada, M.; Ballvora, A.; Pinto, F.; Rossini, M.; Panigada, C.; Behmann, J.; Léon, J.; Thurau, C.; Bauckhage, C.; et al. Early drought stress detection in cereals: Simplex volume maximization for hyperspectral image analysis. Funct. Plant Biol. 2012, 39, 878–890. [Google Scholar] [CrossRef] [PubMed]
- Wahabzada, M.; Mahlein, A.K.; Bauckhage, C.; Steiner, U.; Oerke, E.C.; Kersting, K. Metro maps of plant disease dynamics—Automated mining of differences using hyperspectral images. PLoS ONE 2015, 10, e0116902. [Google Scholar] [CrossRef]
- Zhang, L.; Zhang, H.; Niu, Y.; Han, W. Mapping maize water stress based on UAV multispectral remote sensing. Remote Sens. 2019, 11, 605. [Google Scholar] [CrossRef]
- DeChant, C.; Wiesner-Hanks, T.; Chen, S.; Stewart, E.L.; Yosinski, J.; Gore, M.A.; Nelson, R.J.; Lipson, H. Automated identification of northern leaf blight-infected maize plants from field imagery using deep learning. Phytopathology 2017, 107, 1426–1432. [Google Scholar] [CrossRef]
- Guerrero, J.M.; Pajares, G.; Montalvo, M.; Romeo, J.; Guijarro, M. Support vector machines for crop/weeds identification in maize fields. Expert Syst. Appl. 2012, 39, 11149–11155. [Google Scholar] [CrossRef]
- Atieno, J.; Li, Y.; Langridge, P.; Dowling, K.; Brien, C.; Berger, B.; Varshney, R.K. Exploring genetic variation for salinity tolerance in chickpea using image-based phenotyping. Sci. Rep. 2017, 7, 1300. [Google Scholar] [CrossRef]
- Mo, C.; Kim, M.S.; Kim, G.; Cheong, E.J.; Yang, J.; Lim, J. Detecting drought stress in soybean plants using hyperspectral fluorescence imaging. J. Biosyst. Eng. 2015, 40, 335–344. [Google Scholar] [CrossRef]
- Adak, A.; Murray, S.C.; Anderson, S.L. Temporal phenomic predictions from unoccupied aerial systems can outperform genomic predictions. G3 Genes Genomes Genet. 2023, 13, jkac294. [Google Scholar] [CrossRef]
- Islam, S.; Reza, M.N.; Samsuzzaman, S.A.; Cho, Y.J.; Noh, D.H.; Chung, S.O.; Hong, S.J. Machine vision and artificial intelligence for plant growth stress detection and monitoring: A review. Precis. Agric. 2024, 6, 34. [Google Scholar] [CrossRef]
- Xu, Y.; Zhang, X.; Li, H.; Zheng, H.; Zhang, J.; Olsen, M.S.; Varshney, R.K.; Prasanna, B.M.; Qian, Q. Smart breeding driven by big data, artificial intelligence, and integrated genomic-enviromic prediction. Mol. Plant 2022, 15, 1664–1695. [Google Scholar] [CrossRef] [PubMed]
- Lopes, M.S.; Reynolds, M.P. Stay-green in spring wheat can be determined by spectral reflectance measurements (normalized difference vegetation index) independently from phenology. J. Exp. Bot. 2012, 63, 3789–3798. [Google Scholar] [CrossRef]
- Singh, A.; Ganapathysubramanian, B.; Kumar, A. Machine Learning for High-Throughput Stress Phenotyping in Plants. Trends Plant Sci. 2016, 21, 110–124. [Google Scholar] [CrossRef] [PubMed]
- Shi, T.; Li, R.; Zhao, Z.; Ding, G.; Long, Y.; Meng, J.; Xu, F.; Shi, L. QTL for yield traits and their association with functional genes in response to phosphorus deficiency in Brassica napus. PLoS ONE 2013, 8, e54559. [Google Scholar] [CrossRef]
- Honsdorf, N.; March, T.J.; Berger, B.; Tester, M.; Pillen, K. High-throughput phenotyping to detect drought tolerance QTL in wild barley introgression lines. PLoS ONE 2014, 9, e97047. [Google Scholar] [CrossRef]
- Guo, Z.; Yang, W.; Chang, Y.; Ma, X.; Tu, H.; Xiong, F.; Jiang, N.; Feng, H.; Huang, C.; Yang, P.; et al. Genome-wide association studies of image traits reveal genetic architecture of drought resistance in rice. Mol. Plant 2018, 11, 789–805. [Google Scholar] [CrossRef]
- Cousminer, D.L.; Wagley, Y.; Pippin, J.A.; Elhakeem, A.; Way, G.P.; Pahl, M.C.; McCormack, S.E.; Chesi, A.; Mitchell, J.A.; Kindler, J.M.; et al. Using high-throughput multiple optical phenotyping to decipher the genetic architecture of maize drought tolerance. Genome Biol. 2021, 22, 1. [Google Scholar] [CrossRef]
- Bongomin, O.; Lamo, J.; Guina, J.M.; Okello, C.; Ocen, G.G.; Obura, M.; Ojok, S. UAV image acquisition and processing for high-throughput phenotyping in agricultural research and breeding programs. Plant Phenome J. 2024, 7, e20096. [Google Scholar] [CrossRef]
- Shi, Y.; Thomasson, J.A.; Murray, S.C.; Pugh, N.A.; Rooney, W.L.; Shafian, S.; Yang, C. Unmanned aerial vehicles for high-throughput phenotyping and agronomic research. PLoS ONE 2016, 11, e0159781. [Google Scholar] [CrossRef]
- Munjal, R.; Benıwal, J.; Dhundwal, A.; Goyal, A.; Kumarı, A.; Behl, R.K. Accelerating Crop Breeding in the 21st Century: A Comprehensive Review of Next Generation Phenotyping Techniques and Strategies. Ekin J. Crop Breed. Genet. 2023, 9, 160–171. [Google Scholar]
Disclaimer/Publisher’s Note: The statements, opinions and data contained in all publications are solely those of the individual author(s) and contributor(s) and not of MDPI and/or the editor(s). MDPI and/or the editor(s) disclaim responsibility for any injury to people or property resulting from any ideas, methods, instructions or products referred to in the content. |
© 2025 by the authors. Licensee MDPI, Basel, Switzerland. This article is an open access article distributed under the terms and conditions of the Creative Commons Attribution (CC BY) license (https://creativecommons.org/licenses/by/4.0/).