Article

Characterization and Expression Analysis of the ALOG Gene Family in Rice (Oryza sativa L.)

1
Rice Research Institute, Fujian Academy of Agricultural Sciences, Fuzhou 350019, China
2
State Key Laboratory of Ecological Pest Control for Fujian and Taiwan’ Crops/Key Laboratory of Germplasm Innovation and Molecular Breeding of Hybrid Rice in South China/Fujian Engineering Laboratory of Crop Molecular Breeding/Fujian Key Laboratory of Rice Molecular Breeding/Fuzhou Branch, National Center of Rice Improvement of China/National Engineering Laboratory of Rice/South Base of National Key Laboratory of Hybrid Rice for China, Fuzhou 350003, China
*
Author to whom correspondence should be addressed.
These authors contributed equally to this work.
Plants 2025, 14(8), 1208; https://doi.org/10.3390/plants14081208
Submission received: 6 March 2025 / Revised: 4 April 2025 / Accepted: 10 April 2025 / Published: 14 April 2025
(This article belongs to the Section Plant Genetics, Genomics and Biotechnology)

Abstract

:
ALOG (Arabidopsis LSH1 and Oryza G1) proteins constitute a plant-specific family of transcription factors that play crucial roles in lateral organ development across land plants. Initially identified through forward genetic studies of Arabidopsis LSH1 and rice G1 proteins, ALOG family members have since been functionally characterized in various plant species. However, research focusing on the characteristics and expression patterns of all ALOG family members in rice remains relatively limited. In this study, we systematically characterized OsALOG family genes in rice. Compared to other genes in rice and Arabidopsis, the ALOG family genes have a relatively simple structure. The alignment of OsALOG amino acid sequences and analysis of disorder predictions reveal that all members possess conserved ALOG domains, while the conservation of intrinsically disordered regions (IDRs) is relatively low. Four amino acids—alanine, glycine, proline, and serine—are significantly enriched in the IDRs of each ALOG protein. Synteny analysis indicates that most OsALOG genes have undergone considerable divergence compared to their counterparts in Arabidopsis. Bioinformatic analysis of cis-regulatory elements predicts that OsALOG family genes contain elements responsive to ABA, light, and methyl jasmonate, although the abundance and composition of these elements vary among different members. The expression patterns associated with the rice floral development of OsALOG genes can be broadly categorized into two types; however, even within the same type, differences in expression levels, as well as the initiation time and duration of expression, were observed. These results provide a comprehensive understanding of the structural characteristics and expression patterns of OsALOG members in rice.

1. Introduction

In 2009, Yoshida et al. classified the Domains of Unknown Function 640 (DUF640) proteins in the Pfam protein family database as the ALOG (Arabidopsis LSH1 and Oryza G1) domain [1]. Research indicates that ALOG proteins exhibit characteristics such as sequence-specific DNA binding, transcriptional regulatory activity, and nuclear localization [2,3]. Specifically, ALOG proteins are a family of plant-specific transcription factors that play a crucial role in the development of lateral organs in land plants [4]. Increasing evidence suggests that ALOG proteins regulate inflorescence architecture and floral organ development through an inhibitory role. Currently, the functions of five OsALOG genes have been reported in rice. OsG1/ELE can repress the homeotic transformation of the sterile lemma to the lemma [5,6], while OsG1 can affect the expression of various phytohormone-related genes by regulating critical transcription factors [7]. OsG1L6/TH1/BLS1/BH1/AFD1 regulate the cell extension of the lemma and palea to determine grain shape and size, which may function as a transcription repressor and regulate downstream hormone signal transduction and starch/sucrose metabolism-related genes [8,9,10,11,12,13,14]. OsG1L5/TAW1 is a unique regulator of meristem activity in rice and regulates inflorescence development through the promotion of inflorescence meristem activity and the suppression of the phase change to spikelet meristem identity [15]; OsG1L1 and OsG1L2 are likely crucial in regulating inflorescence architecture, serving as positive regulators for the development of primary branches and secondary branches. Their role in these processes is indicated by their expression in the reproductive meristems, following a pattern similar to TAW1 [16].
In Arabidopsis, the functions of six AtALOG genes have been identified. AtLSH1 was the first ALOG gene identified in plants, initially cloned from a dominant Arabidopsis mutant (lsh1-D). This mutant exhibits hypersensitivity to continuous far-red, blue, and red light, resulting in shorter hypocotyls compared to wild-type plants. AtLSH1 plays a role in light regulation during seedling development, and its function relies on phytochromes [17]. Overexpression of AtLSH1 and AtLSH2 greatly inhibited hypocotyl elongation in a light-independent manner and reduced both vegetative and reproductive growth [18]. AtLSH4 and AtLSH3 are a pair of paralogous genes in Arabidopsis that can be directly activated and upregulated by the NAC family transcription factor CUP-SHAPED COTYLEDON1 (CUC1). Meanwhile, AtLSH4 and AtLSH3 play a role in inhibiting organ differentiation at the boundary region, a crucial function during plant development [19]. Additionally, AtLSH8 positively regulates ABA signaling by changing the expression pattern of ABA-responsive proteins [20]. The role of AtLSH10 suggests that the OTLD1-LSH10 complex acts as a co-repressor, potentially representing a general mechanism for the specific function of plant histone deubiquitinases at their target chromatin [21].
ALOG gene functions have also been reported in other species. In tomato, the ALOG gene TERMINATING FLOWER (TMF) controls flowering by preventing the precocious expression of the floral identity gene ANANTHA [22]. In sorghum (Sorghum bicolor), the ALOG gene DOMINANT AWN INHIBITOR (DAI) inhibits awn elongation by suppressing both cell proliferation and elongation [23].
In this study, we systematically characterized the OsALOG family genes in rice using bioinformatic approaches, including phylogenetic analysis, protein structure analysis, synteny analysis, and cis-regulatory element analysis. A notable aspect of this study is the enrichment analysis of residues within intrinsically disordered regions (IDRs). Intrinsically disordered proteins (IDPs) constitute approximately 30% of eukaryotic proteomes [24]. Recent studies have increasingly revealed that IDPs are involved in essential functions such as transcription factor regulation, cell signaling, and molecular chaperone activity [25,26]. Moreover, IDPs play a pivotal role in driving protein phase transitions, a concept that has emerged as a key focus in biological research for understanding cellular compartmentalization and the regulation of biochemical reactions [27]. Additionally, we performed RNA-Sequencing (RNA-Seq) on nine sampling points from young panicles and spikelet organs in rice. We obtained expression profiles for 10 OsALOG genes from different inflorescence stages and spikelet organs. These studies offer a comprehensive understanding of the characteristics and expression patterns of OsALOG genes from a global perspective. Moreover, our results establish a foundation for further exploration of the molecular mechanisms underlying rice flower development by presenting RNA-Seq data from various inflorescence stages and organs.

2. Materials and Methods

2.1. Selection of Plant Materials and RNA Sample Collection

Indica rice cv. Huanghuazhan was planted in a greenhouse at the Rice Research Institute, Fujian Academy of Agricultural Sciences in Fuzhou, China. The seeds were sown on 20 May 2019, with transplanting conducted on 17 June 2019. The trial employed a randomized complete block design (RCBD) with three replicates. Each experimental plot comprised 10 rows of 7 hills per row, planted at a uniform spacing of 20 cm (within rows) × 20 cm (between rows) using single-seedling transplantation. The rice seedlings were raised via wet nursery cultivation, and field management followed conventional agronomic practices for paddy rice. We sampled young panicles at four stages and five spikelet organs at the booting stage from Huanghuazhan for tissue used for RNA-Seq and qRT-PCR. Detailed sampling points are shown in Table 1. After sampling, the tissues were snap-frozen in liquid nitrogen and stored at −70 °C until RNA extraction. Three biological replicates were used for each of the sampling points.

2.2. Identification and Phylogenetic Analysis of the ALOG Genes in Rice

For the purpose of identifying ALOG genes, we downloaded the genomic data of Os.japonica, Os.indica, and Arabidopsis thaliana (the assembly titles, respectively, are Os-Nipponbare-Reference-IRGSP-1.0 for the Oryza sativa japonica Group, Minghui63-Mhv2.0 assembly for the Oryza sativa Indica Group, and TAIR10 assembly for Arabidopsis thaliana) from the EnsemblPlants website (https://plants.ensembl.org/index.html) (accessed on 1 July 2024), and the hidden Markov model (HMM) files corresponding to the ALOG domain (PF04852) were downloaded from the Pfam protein family database (http://pfam.xfam.org/) (accessed on 1 July 2024) [29]. HMMER 3.4 [30] was used to search the ALOG genes from the genomic data of rice and Arabidopsis. Next, we extracted the protein sequences of the candidate ALOG genes by seqkit-2.8.2 software [31], and then determined their ALOG domains through the batch CD-search of NCBI (https://www.ncbi.nlm.nih.gov/cdd/?term=) (accessed on 2 July 2024). Phylogenetic trees were constructed using the Neighbor-Joining (NJ) method in MEGA11 [32] with the Poisson model, pairwise deletion, and 1000 bootstrap replications. Based on the results of domain prediction and phylogenetic analysis, redundant and incomplete sequences were manually removed.

2.3. Analysis of the Characteristics of the ALOG Family

Alignment of the ALOG protein sequences was performed using the ‘Muscle’ function in MEGA, with the Max Iteration set to 100. The aligned file was then refined and visualized using Jalview 2.11 [33]. The structures of the 30 identified ALOG genes were visualized using TBtools II v2.210 [34] based on the genome and gene annotation files. Prediction of the intrinsically disordered regions (IDRs) was carried out using DISOPRED3, a tool from the PSIPRED Workbench (http://bioinf.cs.ucl.ac.uk/psipred/) (accessed on 3 July 2024) [35]. To analyze the protein sequences of OsALOG genes, we used SnapGene 4.1.9 software to calculate the proportion of amino acids located within their intrinsically disordered regions (IDRs). To determine the enrichment of specific amino acids within the IDRs of each OsALOG gene, we performed an enrichment analysis using the ‘Simple Enrich’ function in TBtools II. After performing the analysis, we organized the resulting data in Excel, and then visualized the amino acid enrichment patterns using the ‘Heatmap’ function in TBtools II to compare the IDR composition across OsALOG genes. Motif discovery for ALOG proteins was performed using the MEME online tool (https://meme-suite.org) (accessed on 3 July 2024), with the number of motifs set to ten. Sequence length, molecular weights, isoelectric points, and subcellular location predictions for the identified ALOG proteins were obtained using tools from the ExPasy website (http://web.expasy.org/protparam/) (accessed on 4 July 2024) [36]. Prediction of transmembrane helices in ALOG proteins was conducted using TMHMM 2.0 on the DTU Health Tech website (https://services.healthtech.dtu.dk/services/TMHMM-2.0/) (accessed on 4 July 2024) [37].

2.4. Synteny Analysis

Gene duplication events were analyzed using the Multiple Collinearity Scan toolkit (MCScanX) with default settings [38]. The synteny relationships of the ALOG genes were visualized with TBtools II. Non-synonymous (Ka) and synonymous (Ks) substitutions for each duplicated ALOG gene were determined using KaKs_Calculator 2.0 [39].

2.5. Analysis of the Cis-Regulatory Elements

To analyze the promoter regions of ALOG genes, first use seqkit-2.8.2 to extract the 2000 bp sequence upstream of each gene’s ATG start codon. Next, submit these extracted promoter sequences to the PlantCARE database (http://bioinformatics.psb.ugent.be/webtools/plantcare/html/) (accessed on 5 July 2024) to identify cis-acting elements, and export the results in tabular format [40]. To visualize the distribution of these elements, load the annotated sequences into TBtools II and use the ‘Simple Biosequence Viewer’ feature. Finally, quantify and plot the cis-element counts by generating a heatmap using the ‘tidyverse 2.0’ package in R, with rows representing ALOG genes and columns representing element types.

2.6. RNA Extraction, Library Construction and Sequencing

Total RNA was isolated from each of the samples listed in Table 1 (including three biological replicates per sample) using the TRIzol Kit (Promega, Madison, WI, USA) following the manufacturer’s instructions. Then, the total RNA was treated with RNase-free DNase I (Takara Bio, Kusatsu, Shiga, Japan) for 30 min at 37 °C to remove residual DNA. RNA quality was verified using a 2100 Bioanalyzer (Agilent Technologies, Santa Clara, CA, USA) and was also checked by RNA electrophoresis on RNase-free agarose gels. The library construction and sequencing were performed according to previously established methods [7].

2.7. Quantitative Reverse Transcription-PCR Analysis

Total RNA was reverse transcribed using the ReverTra Ace qPCR RT Master Mix with the gDNA Remover kit (Toyobo, Japan). The resulting cDNA was diluted 1:20 and served as the template for qPCR. PCR reactions were set up with FastStart Universal SYBR Green Master (ROX) (Roche, Indianapolis, IN, USA) and conducted on a LightCycler 480II instrument (Roche, https://www.roche.com.cn/). The data were quantified and normalized against the endogenous control gene UBQ5 using the 2−ΔΔCT method [41]. The primer sequences for OsALOG cDNAs are listed in Supplemental Table S5.

3. Results

3.1. Genome-Wide Identification and Phylogenetic Analysis of the ALOG Genes in Rice

Using the profile hidden Markov model of the ALOG gene family, we scanned the genomes of rice (Oryza sativa japonica and Oryza sativa indica) and Arabidopsis, identifying 10 genes containing the ALOG domain in each genome. We extracted the gene and amino acid sequences of the 30 ALOG genes for further analysis (Table S1).
We examined the evolutionary relationships among the ALOG family members in rice and Arabidopsis by constructing an unrooted phylogenetic tree using MEGA. The 30 ALOG members were clearly divided into three groups, with Group I further subdivided into two subgroups (Figure 1A). Group I includes seven OsALOG genes, OsG1, OsG1L1, OsG1L2, OsG1L3, OsG1L4, OsG1L5, and OsG1L6, and four AtALOG genes, AtLSH1, AtLSH2, AtLSH3, and AtLSH4. Previous studies have shown that OsG1 functions to suppress the overgrowth of sterile lemmas [1,5,6], while OsG1L1, OsG1L2, and OsG1L5 are involved in regulating the number of secondary branches [15,16], OsG1L6 is responsible for the development of lemmas and paleas in rice [9,10,11,12,13,14]. Additionally, overexpression of AtLSH1 and AtLSH2 greatly inhibited hypocotyl elongation in Arabidopsis [18]. AtLSH4 and AtLSH3 suppress organ differentiation in boundary regions, a critical regulatory mechanism for proper plant development [19]. The findings from these studies suggest that the ALOG genes in Group I share similar functions, particularly in suppressing the development of lateral organs. At present, the molecular functions of Group II ALOG genes remain unexplored. Additionally, Group III is specific to Arabidopsis. Taken together, the clustering results indicate that some ALOG family genes have retained ancestral features common to both monocots and dicots, while others have diverged to form species-specific gene structures.

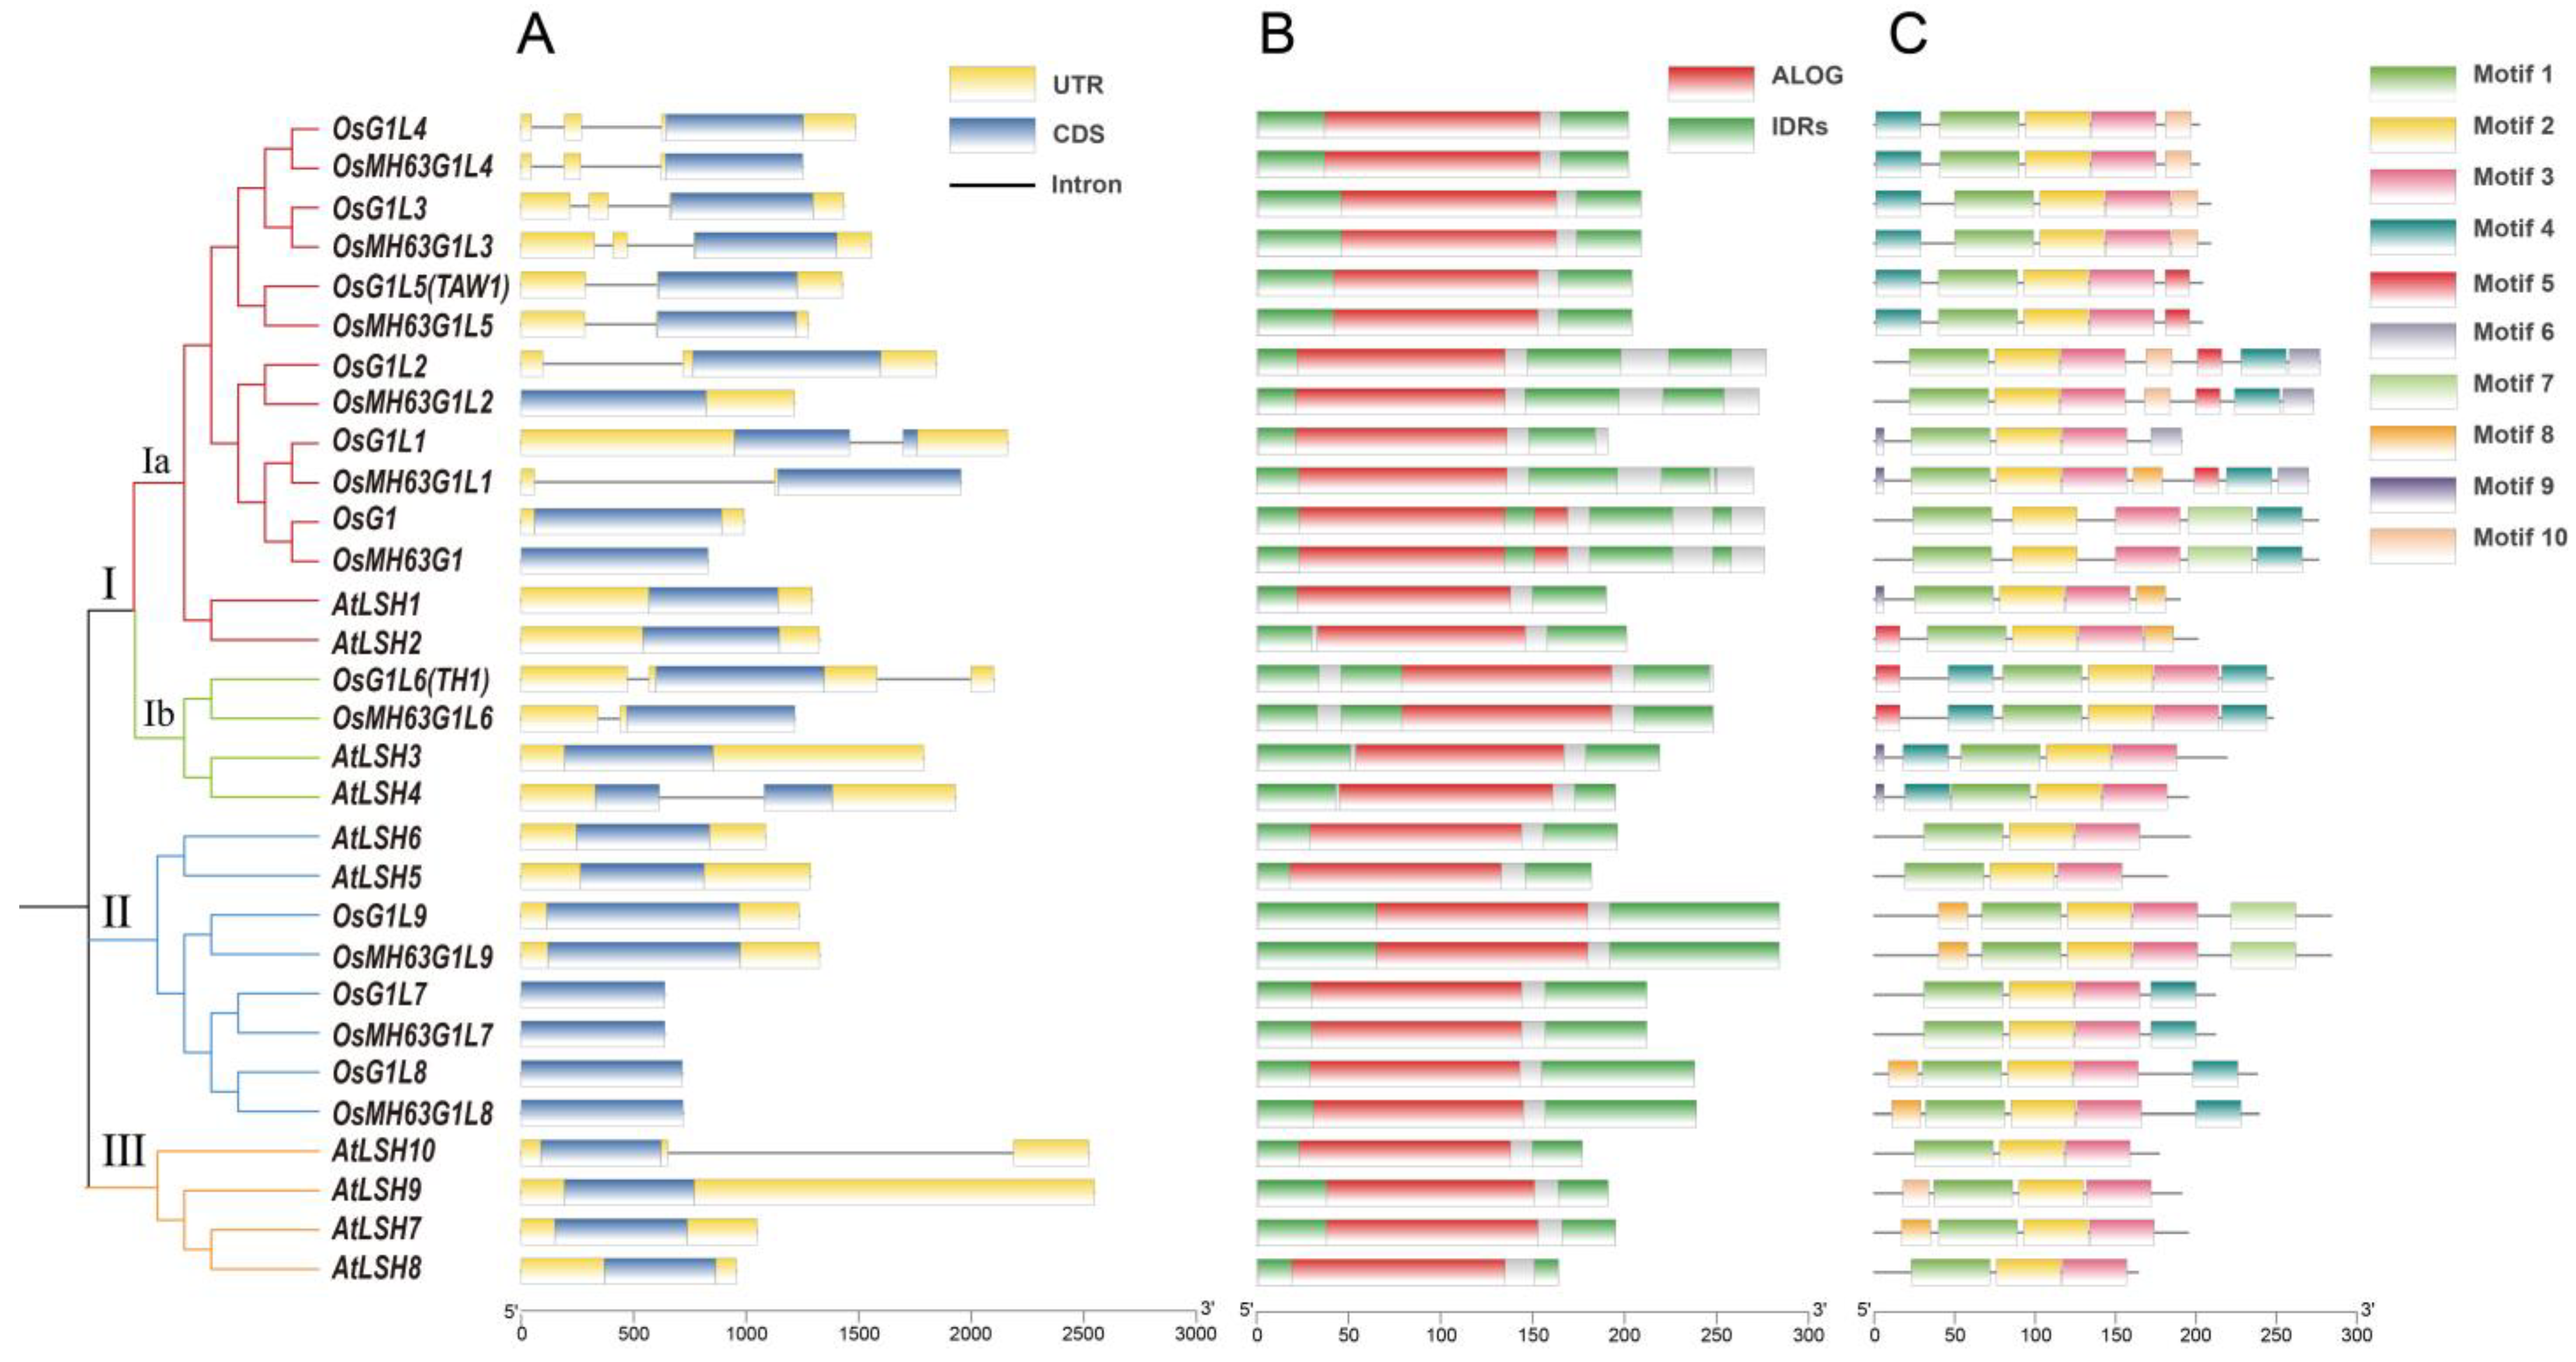
3.2. Gene Structures, Protein Domains, and Motif Compositions of the Rice ALOG Gene Family

We visualized the gene structures, protein domains, and motif compositions of ALOG family members according to the clustering group order (for detailed information, please refer to Table S2). Figure 1A shows that, with the exception of OsG1L1 and AtLSH4, other ALOG genes possess a single coding sequence exon. Seventeen ALOG genes lack introns, eight genes contain one intron, and five genes (all from rice) harbor two introns. Overall, ALOG genes display structural simplicity (fewer exons) compared to the 4–6 exon average in rice and 4–5 average in Arabidopsis genes. (Figure 1A). Next, we performed domain predictions on 30 ALOG proteins. The results indicated that the ALOG domains of these 30 proteins are relatively conserved, with intrinsically disordered regions (IDRs) distributed at both ends of the amino acid sequences (Figure 1B). Among the ten OsALOG proteins (Os. japonica), OsG1L1 has the shortest protein length (191 aa), while OsG1L9 has the longest protein length (284 aa) (Table S2). Amino acid sequence alignment of 30 ALOG family proteins also show a highly conserved ALOG and nuclear localization signal domains (Figure S1). However, we noticed that the protein of OsG1 or OsMH63G1 has two additional amino acid sequence regions in the ALOG domain compared to other ALOG family proteins in either rice or Arabidopsis (Figure S2). The variations in protein structure may lead to a distinct mechanism by which OsG1 regulates downstream genes to differ from other ALOG members.
In addition, we observed the insertion of a 237bp sequence in the coding region of OsMH63G1L1, which causes its protein sequence to be 79 amino acids longer than that of its homolog OsG1L1(Figure 1A, Table S2), while other Os.indica varieties, such as 9311, do not show this difference in their OsG1L1 homologous genes (Figure S3). This finding indicates that OsMH63G1L1 has undergone an insertion mutation, but it does not affect its ALOG domain (Figure 1B). Further research is needed to determine whether this sequence variant affects the gene’s function.
To gain a detailed understanding of ALOG protein structures, we performed MEME motif analysis (for detailed motif information, please refer to Figure S2). Our analysis revealed that all 30 ALOG proteins contain conserved regions known as motif1, motif2, and motif3 within the ALOG domain. When comparing two rice subspecies (Os.japonica and Os.indica), we found that, with the exception of OsG1L1 and OsMH63G1L1— which differ by three motifs— the remaining nine pairs of ALOG paralogous proteins in rice show no differences. The other seven motifs are located within the IDRs of the ALOG proteins in rice or Arabidopsis (Figure 1C). This distribution suggests that the various combinations of these motifs within the IDRs categorize different ALOG proteins, allowing them to perform distinct biological functions possibly.
We also analyzed the physicochemical properties of the ALOG proteins. Compared to Arabidopsis, the ALOG proteins in rice exhibit a higher average number of amino acids and a greater average molecular weight. The isoelectric point of OsALOG proteins is 9.35, which is slightly lower than the isoelectric point of AtALOG proteins, which is 9.81 (Table S2). Our predictions of subcellular localization indicate that all OsALOG proteins are localized in the nucleus. Additionally, we assessed the presence of transmembrane helices in ALOG proteins, and our results showed that these proteins do not contain any transmembrane helices (Table S2).

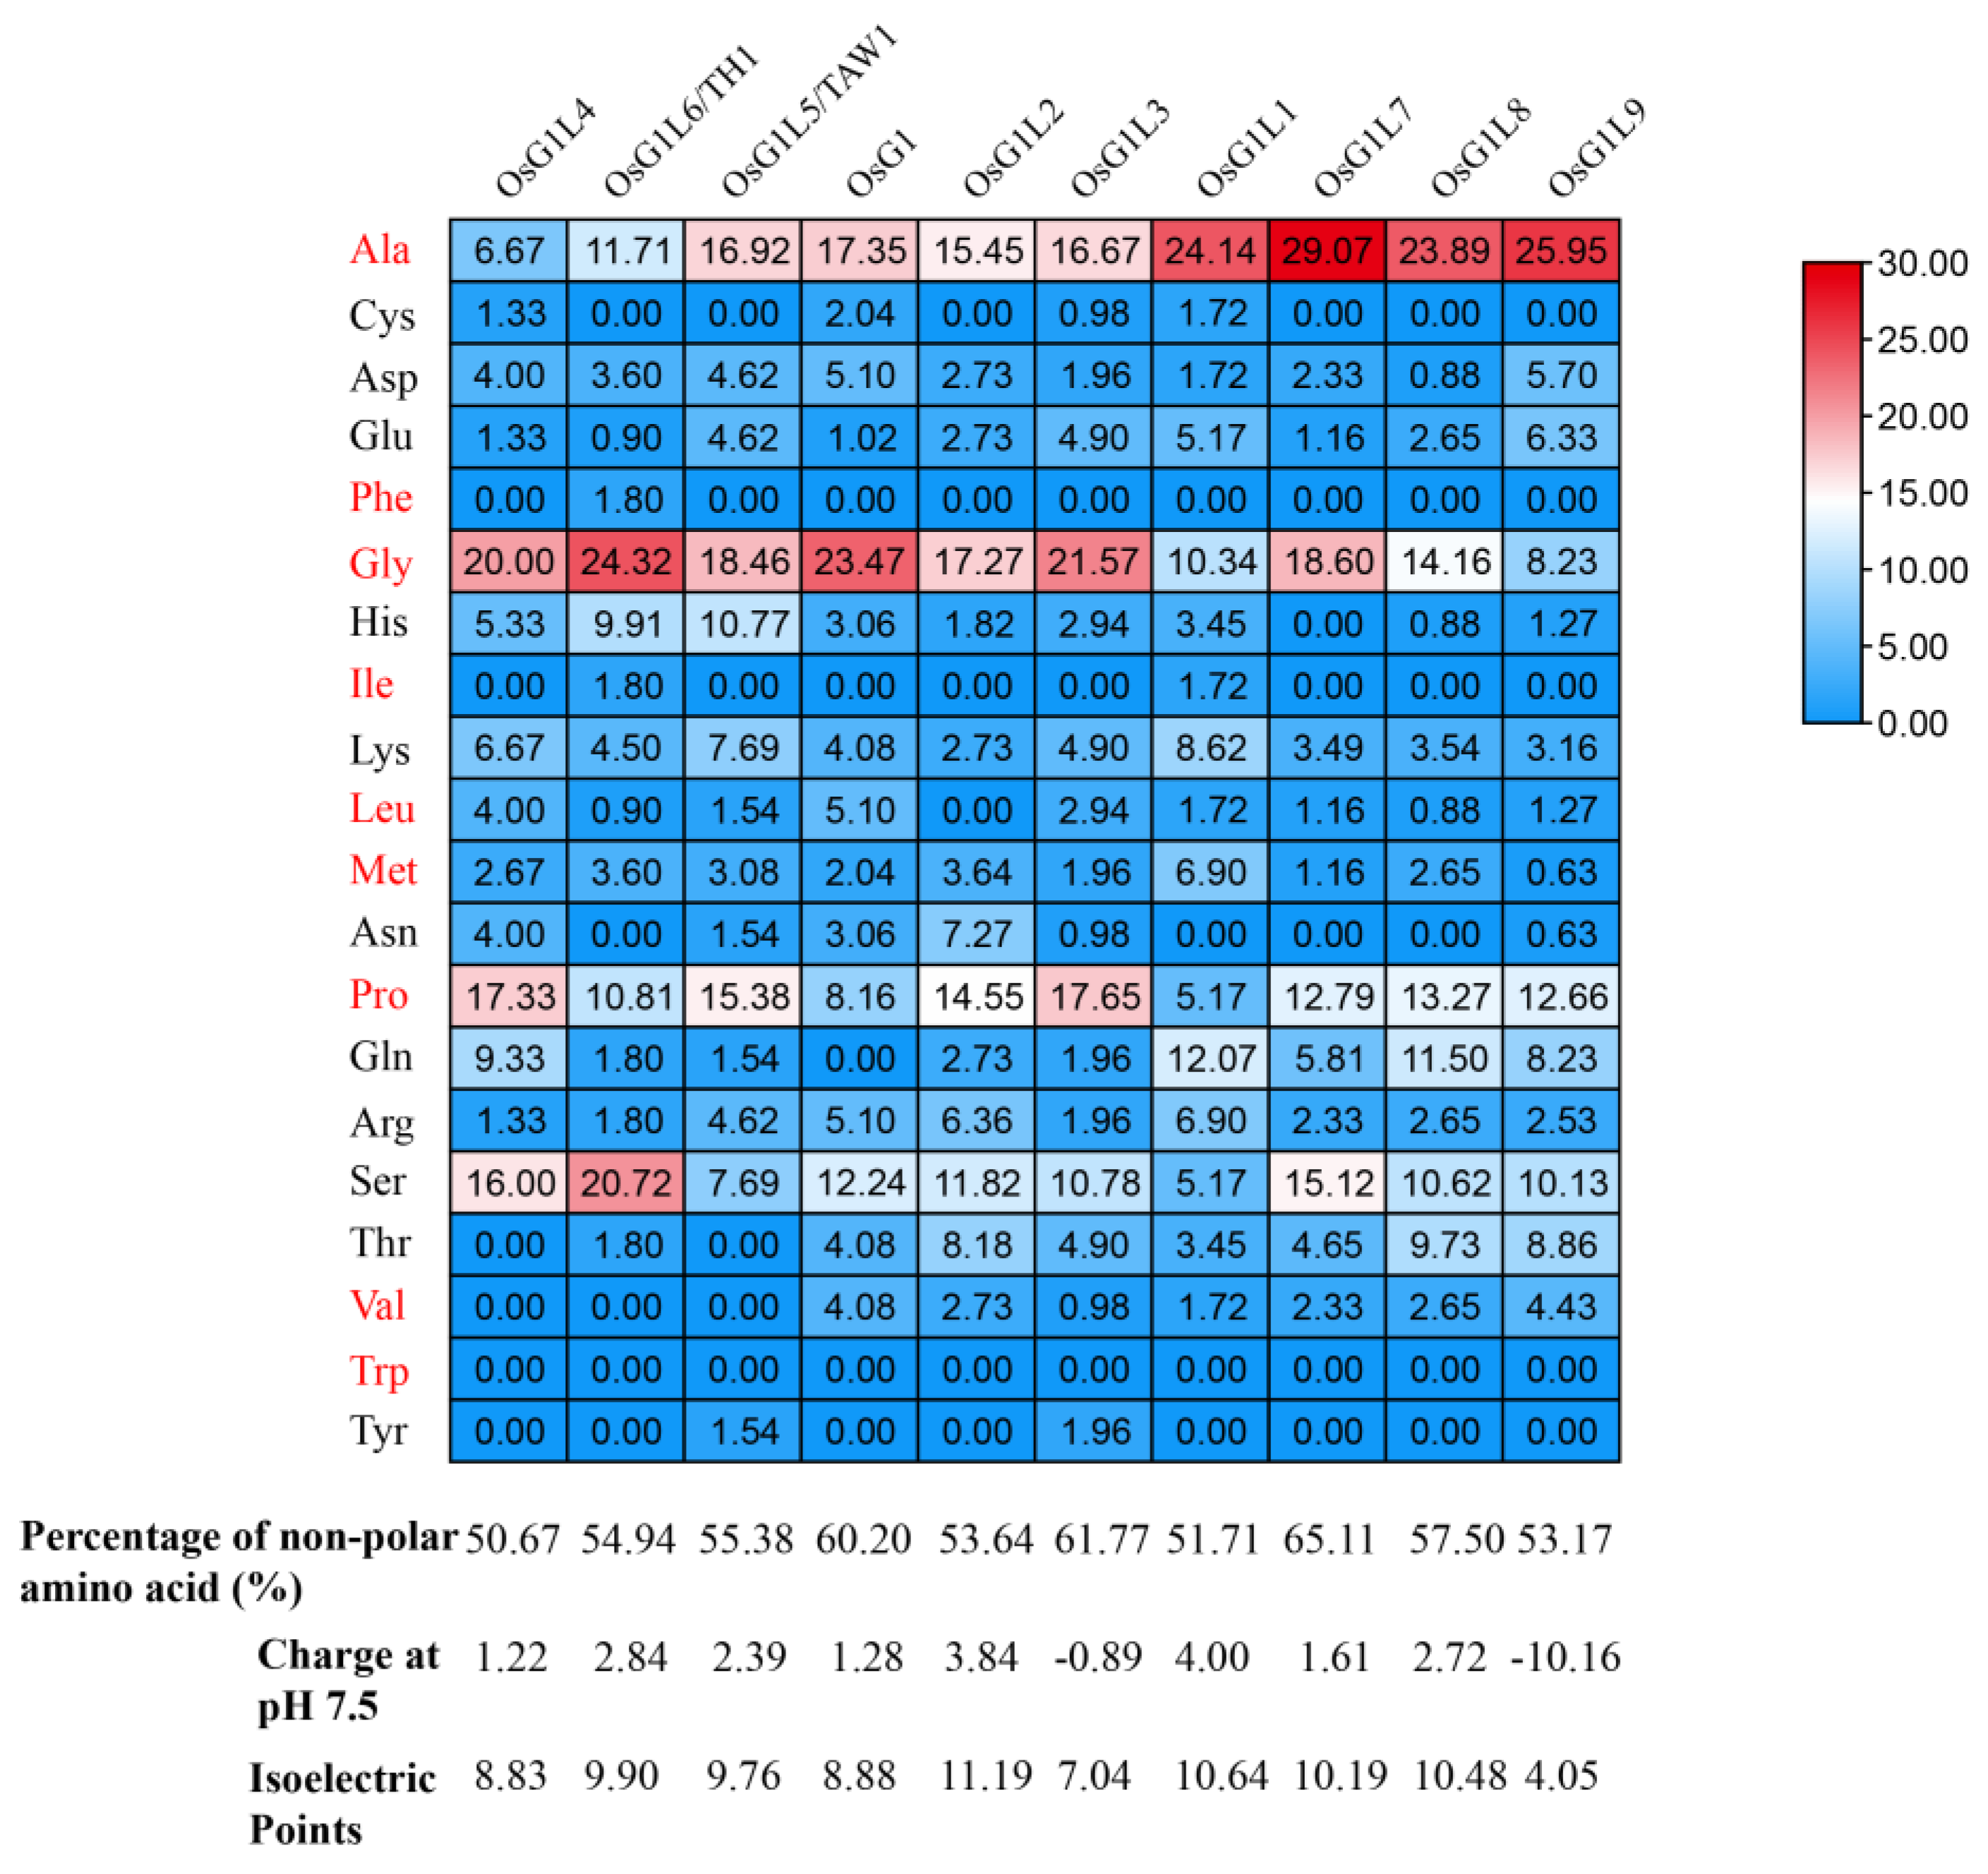
3.3. Enrichment Analysis of Residues in IDRs

Previous studies have found that tomato ALOG paralogous proteins can form transcriptional condensates through IDR-driven phase separation, thereby regulating the expression of floral identity genes [22]. Moreover, the composition of IDRs and phase separation capacity correspond to the transcriptional repression ability of ALOG proteins [22]. Therefore, we investigated whether the amino acid residues in the IDRs of rice ALOG proteins exhibit any bias patterns. To this end, we performed a statistical analysis of the proportions of each amino acid residue across ten OsALOG-IDRs of rice (Figure 2). The proportion of non-polar amino acid residues in the OsALOG-IDPs exceeded 50%. Specifically, OsG1L4 had the lowest proportion at 50.67%, while OsG1L7 had the highest at 65.11%. Four amino acid residues were notably abundant: three non-polar amino acids—alanine, glycine, and proline—and one polar amino acid—serine. These four amino acids were also significantly enriched relative to the total length of the OsALOG proteins (Figure S5). We also assessed the net charge of ALOG-IDRs at pH 7.5. All OsALOG-IDPs exhibited basic charges except for OsG1L3 and OsG1L9, which displayed acidic charges.

3.4. Synteny Analysis of OsALOG Genes

We analyzed the syntenic relationship of OsALOG genes. As shown in Figure 3A, there are five pairs of segmental duplication events, unevenly distributed across chromosomes 01, 02, 04, 05, 06, 07, and 10. These results imply that segmental duplication events could play a crucial role in the expansion of the ALOG gene family. However, no tandem duplication events were identified. Among the 10 OsALOG genes, no segmental duplication events were detected for OsG1, OsG1L6/TH1, or OsG1L9, indicating that these genes uniquely evolved in rice.
To further understand the evolutionary characteristics of the ALOG family, we constructed comparative syntenic maps of rice and Arabidopsis. As shown in Figure 3B, four orthologous gene pairs have been found between rice and Arabidopsis.
Next, we calculated the Ka/Ks ratios of the ALOG syntenic gene pairs. The results show that Ka/Ks < 1 of the orthologous gene pairs OsG1L7 and AtLSH6. This suggests that the function of OsG1L7 has undergone a more rigorous purifying selection during evolution. However, the other 3 ALOG syntenic gene pairs showed a high sequence divergence value (Table S3). This result suggests that, although these gene pairs are syntenic, they may have undergone significant structural and functional changes during the evolutionary divergence between rice and Arabidopsis.

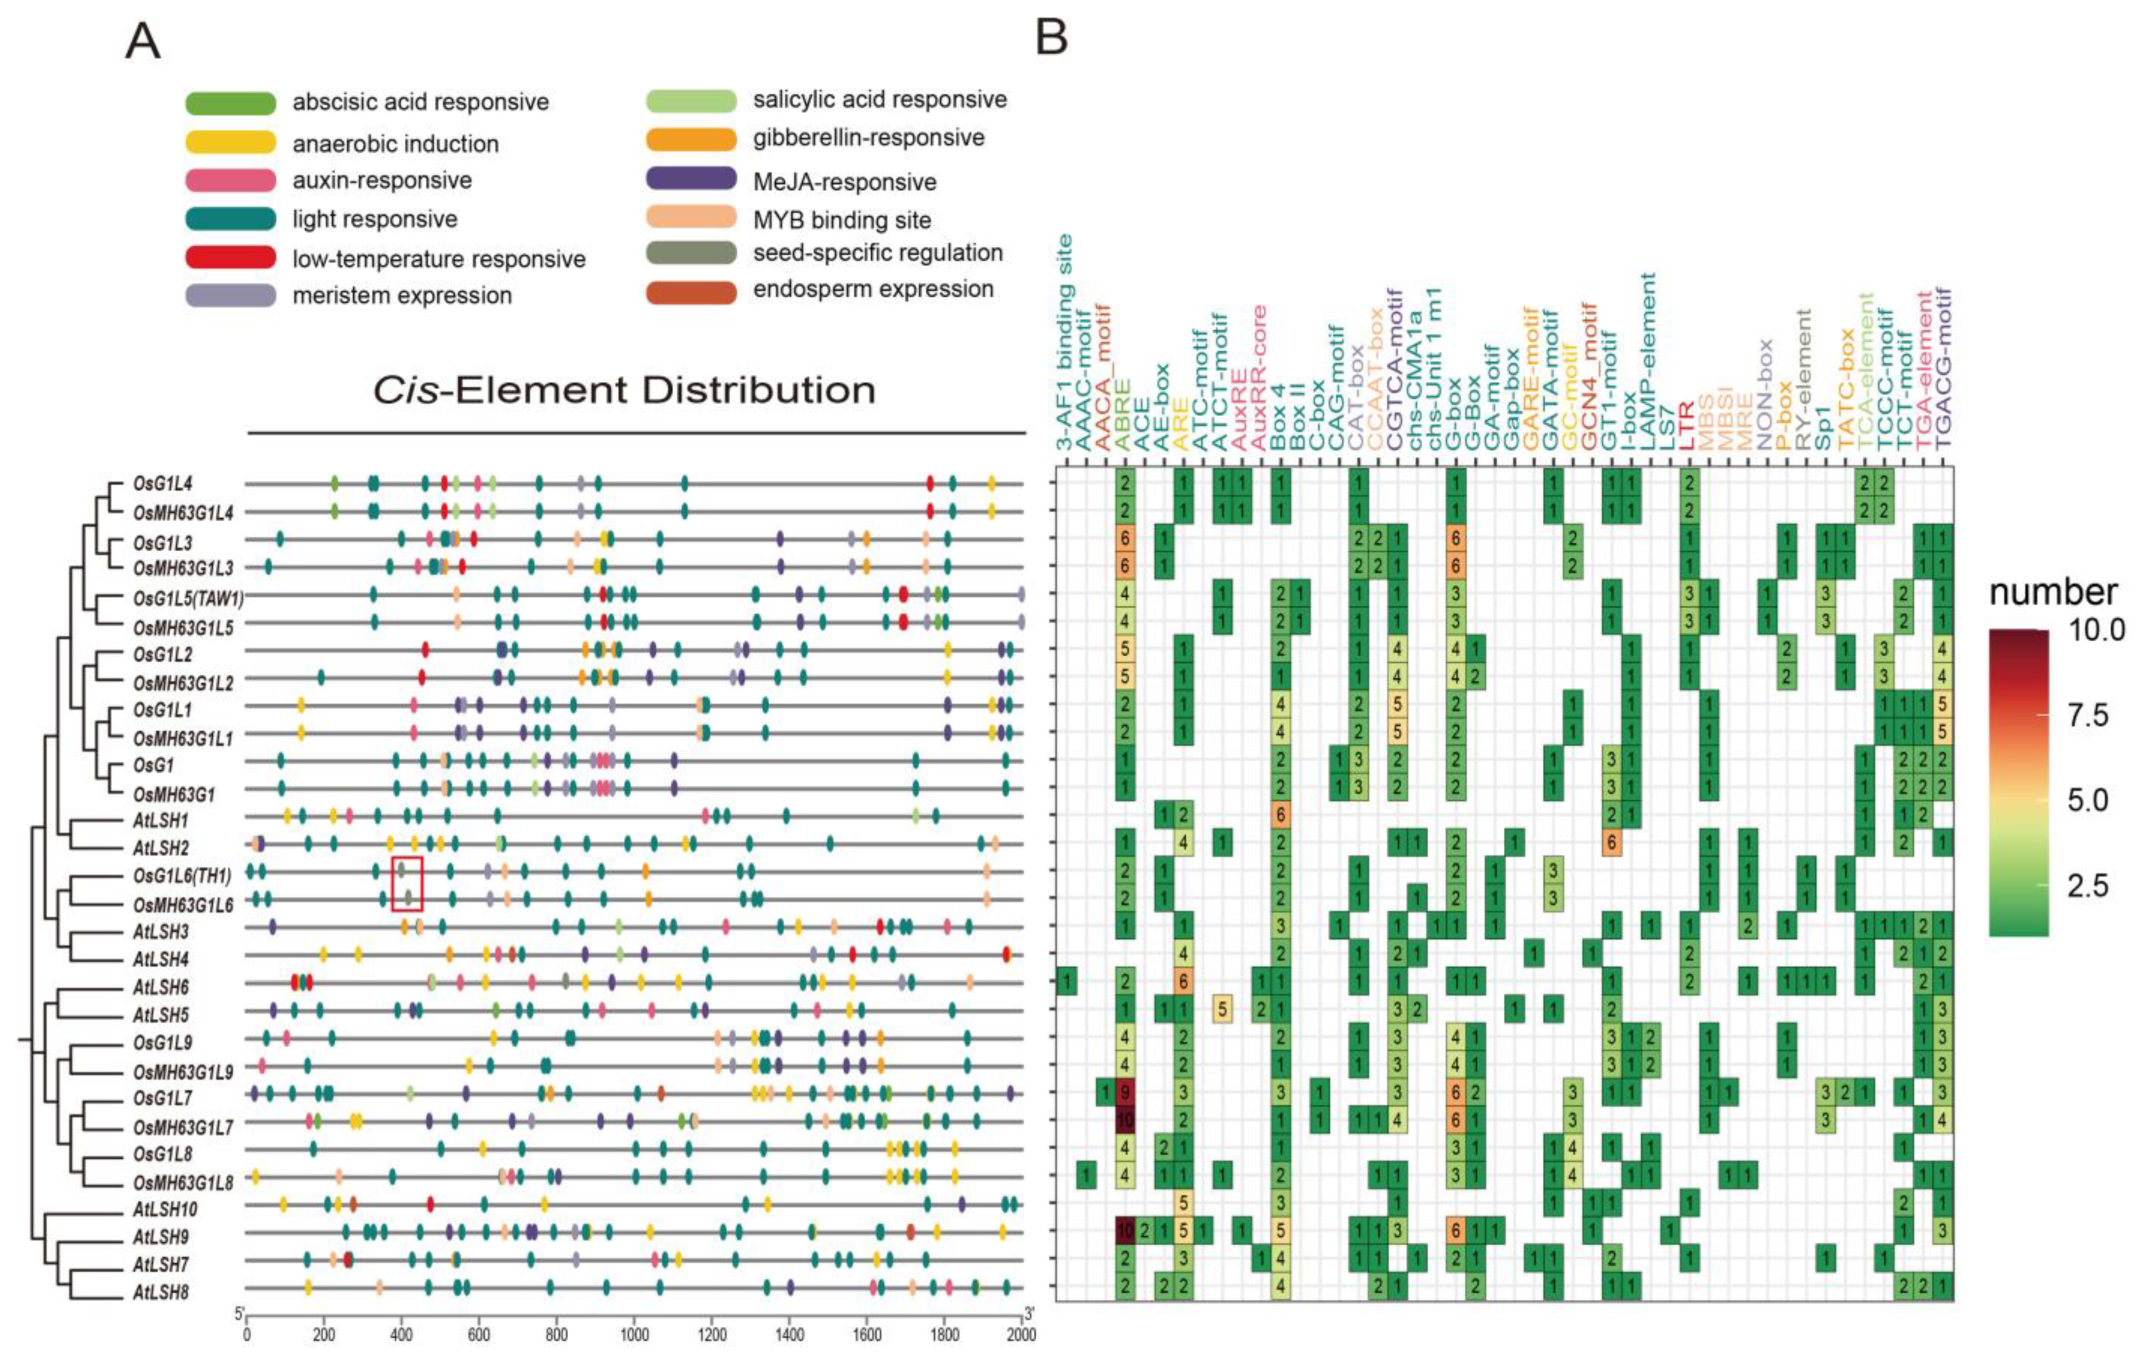
3.5. Cis-Regulatory Elements of OsALOG Genes Analysis

Bioinformatic analysis predicted that the promoter regions of OsALOG genes contain multiple potential cis-regulatory elements putatively associated with stress responses and hormone signaling (Figure 4A). We focused on identifying the cis-elements enriched in the promoter regions of rice ALOG genes. Most ALOG promoter regions show a significant presence of ABRE elements related to ABA responsiveness, as well as G-box elements linked to light responsiveness. Furthermore, they contain numerous MeJA-responsive elements, including the CGTCA motif and the TGACG motif. The composition of cis-elements in OsG1 differs from other ALOG members; it encompasses three CAT-box elements associated with meristem expression and three GT1-motif elements associated with light responsiveness. However, it contains only one ABRE element and two G-box elements. Additionally, the promoter region of OsG1L6 (TH1) harbors an RY-element related to seed-specific regulation, a characteristic not observed in other OsALOG genes (Figure 4A). Overall, the composition of cis-elements in OsALOG genes exhibits both commonalities and specificities, leading to distinct expression patterns depending on different internal or external environments.

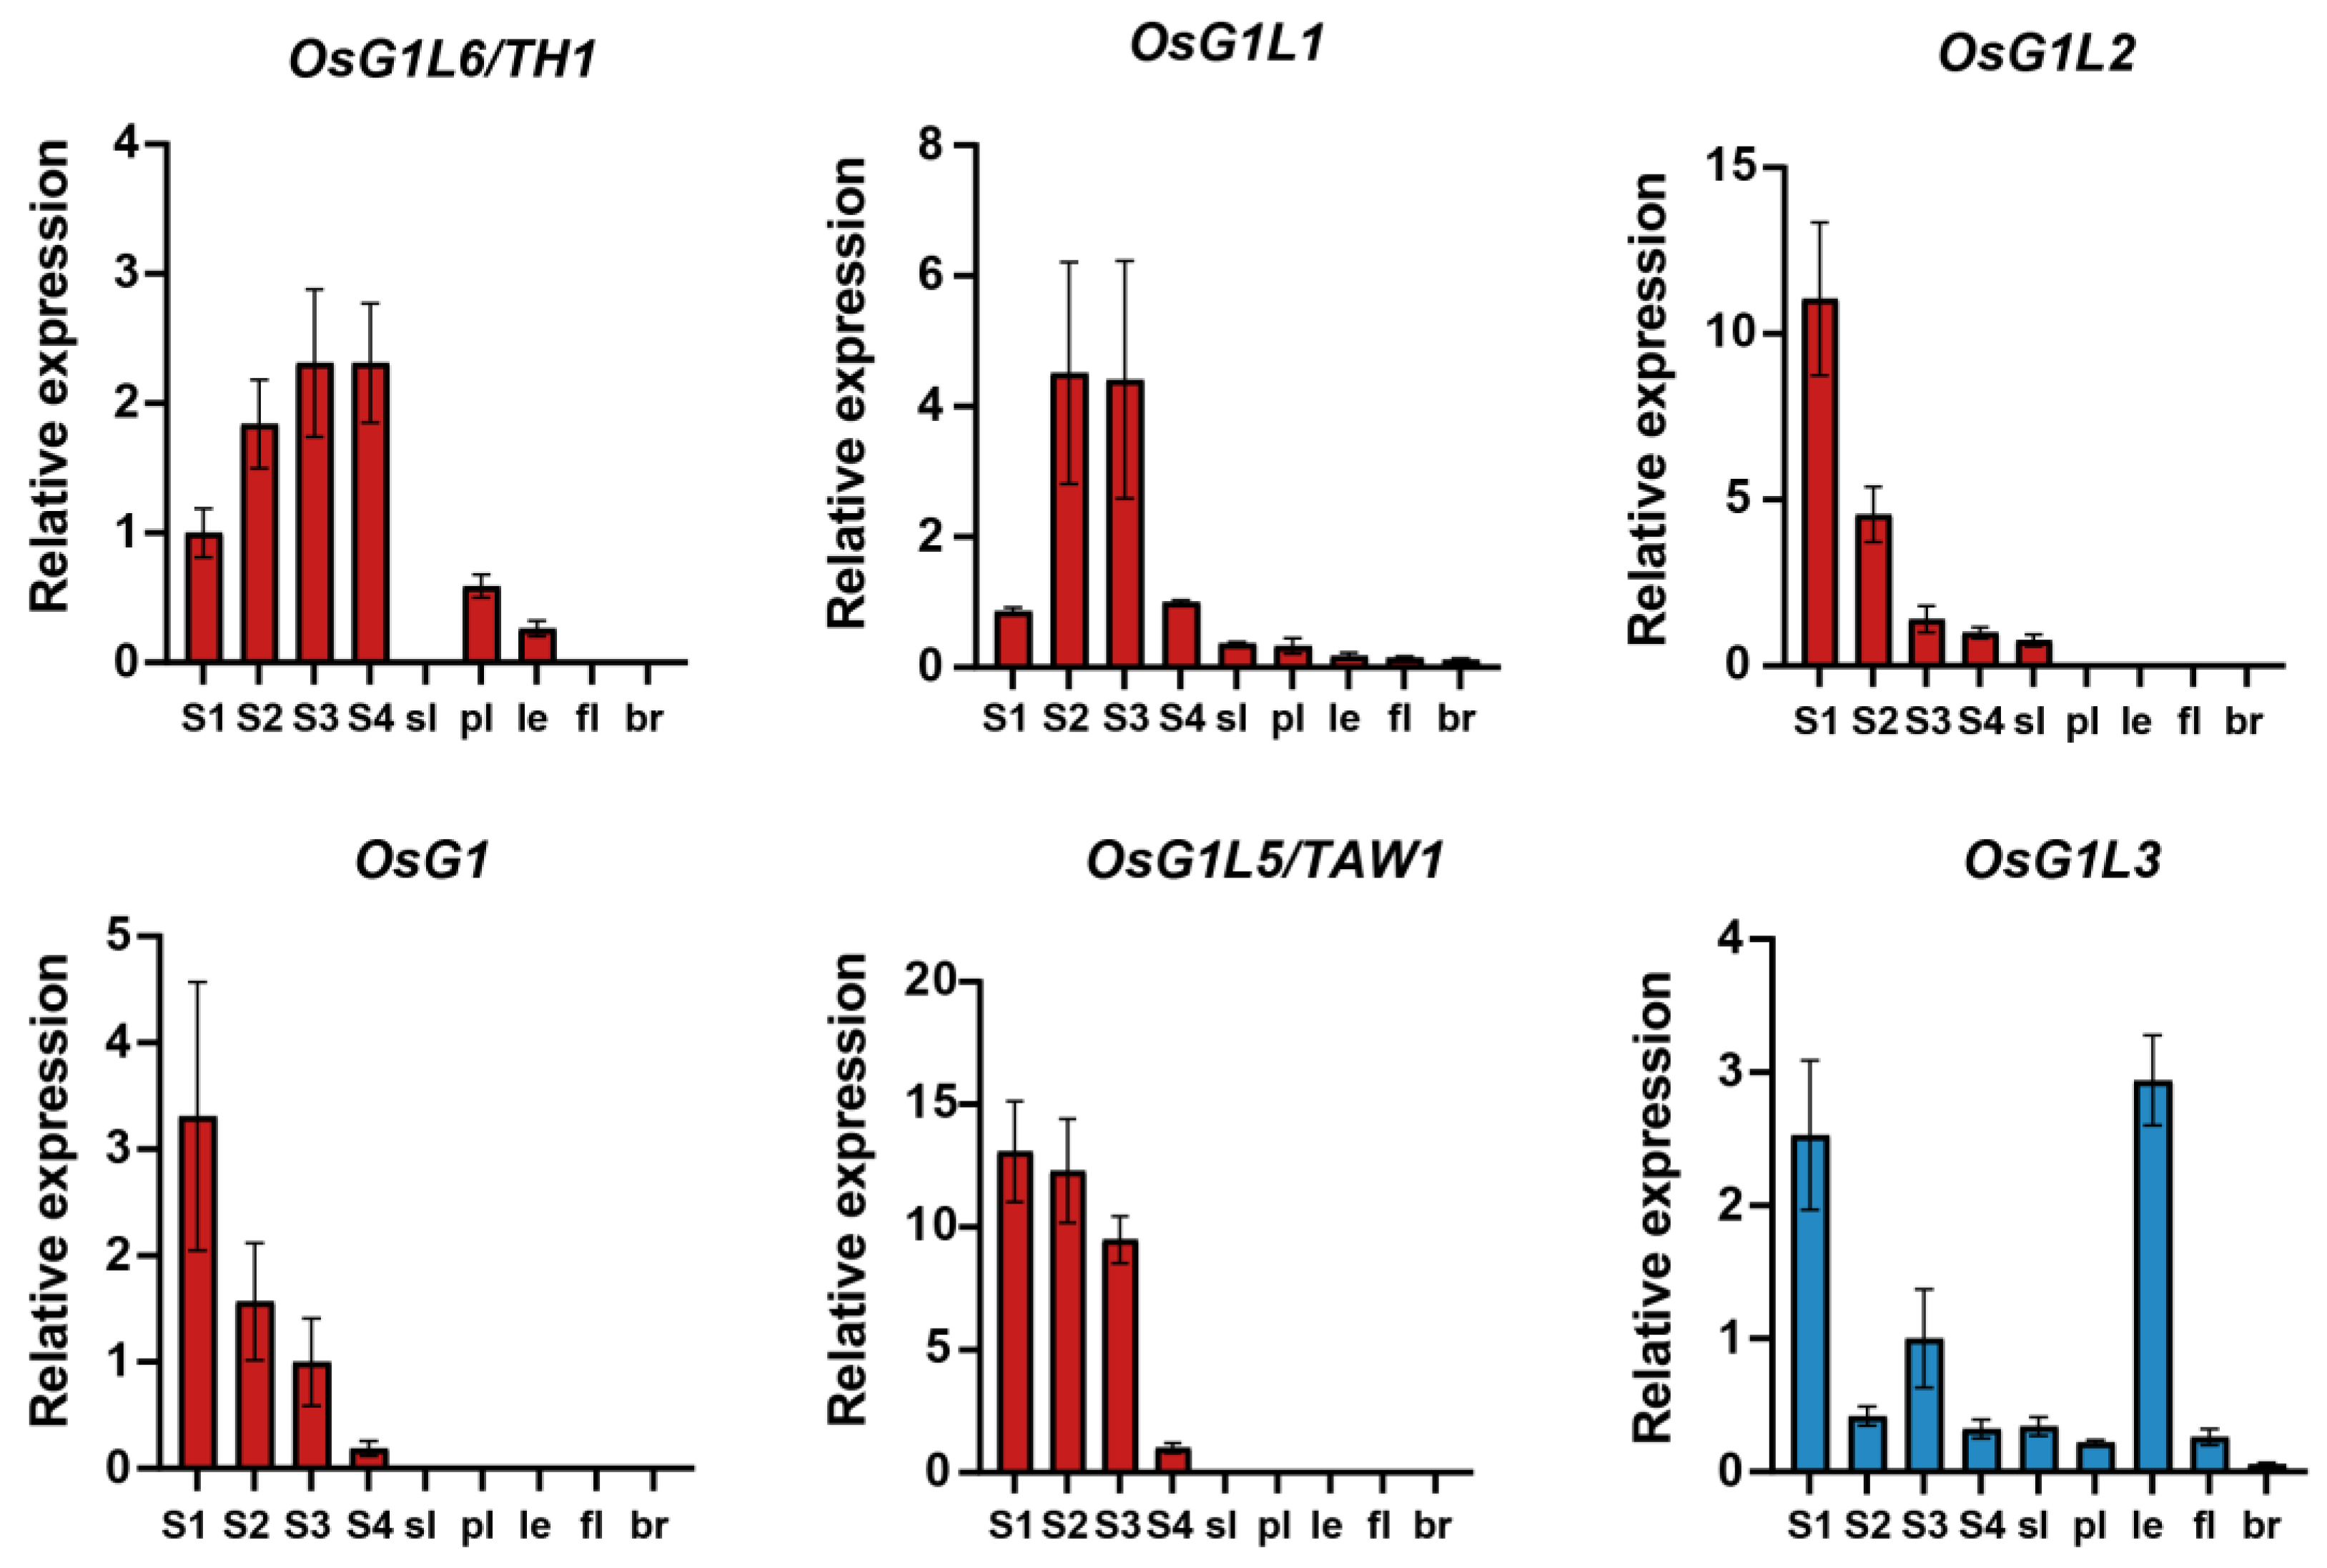
3.6. Expression Pattern of OsALOG Genes

To investigate the expression characteristics of OsALOG genes during different stages of rice panicle development, we performed RNA-Seq analysis on young panicles (four stages) and spikelet organs (five tissues) at the booting stage from the indica rice cultivar Huanghuazhan (Table 1). In total, 27 cDNA libraries were constructed and sequenced. The RNA-Seq data were uploaded to the Sequence Read Archive (SRA) of the National Center for Biotechnology Information (accession number PRJNA1148009).
The OsALOG expression profiles were generated using transcriptome data across nine sampling points, with quantitative reverse transcription PCR (qRT-PCR) validation confirming the reliability of the RNA-seq results (Figure 5 and Figure 6). The results indicate that the 10 OsALOG genes are distinctly divided into two major groups: group Ⅰ and group Ⅱ. Group Ⅰ includes OsG1, OsG1L1, OsG1L2, OsG1L5, and OsG1L6. These genes exhibit high expression levels during the stage of young panicle differentiation but low or no expression in the spikelet organs at the booting stage. Group Ⅱ includes OsG1L3, OsG1L4, OsG1L7, OsG1L8, and OsG1L9. Unlike group I, these genes are not specifically expressed during the young panicle stage, but are dispersedly expressed across each sampling point (Figure 5).
The results of qRT-PCR demonstrated that OsG1, OsG1L2, and OsG1L5 share a similar expression pattern, with their expression levels gradually decreasing from the S1 to S4 stages of young panicle differentiation. In contrast to the expression patterns of the three genes mentioned above, OsG1L6 exhibits a steady rise in expression from the S1 to S4 stages, while OsG1L1 shows an initial increase followed by a decrease (Figure 6). Based on FPKM (Fragments Per Kilobase Million) values (Table S4), the overall expression levels of the genes from group Ⅰ are ranked as OsG1 > OsG1L2 > OsG1L6 > OsG1L1 > OsG1L5.
Although most genes from group II exhibit relatively high expression levels in spikelet organs, each gene has a specific expression pattern. Specifically, OsG1L4 exhibits relatively high expression levels in the palea and inner floral organs; OsG1L3 shows relatively high expression levels in the S1 stage and the lemma; OsG1L9 has relatively high expression levels at the S1 stage or in the sterile lemma; OsG1L7 and OsG1L8 are expressed at all nine sampling points, with overall expression significantly higher in spikelet organs compared to the young panicle stage (Figure 6, Table S4). The expression patterns and biological functions of ALOG genes within Group II still require further investigation.

4. Discussion

Regarding the function of ALOG family proteins, they are generally considered to be transcription factors that regulate the development of floral organs in plants [2,3,4]. In this study, we compared the amino acid sequences of ALOG proteins and found that the ALOG domain is quite conserved, while the amino acid sequences in the IDRs show poor conservation across ALOG orthologs (Figure S6). Studies have shown that the sequence-ensemble relationships of IDPs directly influence their biological functions, and these relationships are governed by the amino acid composition and sequence patterns within the IDPs [42,43]. Therefore, we infer that the functions of ALOG family proteins have diverged and are influenced by IDPs. In fact, previous research suggests that the conserved serine bias in the IDRs of the yeast transcription factor MED1 is essential for its phase separation capacity [44]. Additionally, it has been suggested that the enrichment of polar amino acids indicates a protein’s potential for phase separation [45,46,47]. However, in this study, we found that non-polar amino acids are significantly enriched in OsALOG-IDRs, while polar amino acids are only significantly enriched in serine. These findings imply that the residue composition preferences of IDPs could differ across various proteins. Similarly, the residue composition preferences of ALOG-IDRs may differ across species. Therefore, further in-depth research on this topic will be needed in the future.
Currently, the functions and expressions of five OsALOG family genes have been studied: OsG1, OsG1L1, OsG1L2, OsG1L5, and OsG1L6. In this study, the transcript expression of ten rice ALOG family genes was analyzed. Coincidentally, the expression profiles of the five genes are classified into one group (group I). Generally, these genes are highly expressed during the differentiation stage of young panicles and are either weakly expressed or not expressed at all in the organs of spikelets during the booting stage. This expression pattern is largely consistent with previous studies. Existing research has shown that transcripts of OsG1 are preferentially accumulated in the sterile lemma during the stages of first and secondary rachis branch primordia emergence, continuing through to the stamen primordia formation stage. The expression decreases as the spikelets develop and eventually disappear in the sterile lemma of nearly mature flowers [6], and OsG1L5/TAW1 mRNA continued to accumulate in inflorescence meristem until the initiation of the primary branch primordia. TAW1 expression gradually disappeared [15], while OsG1L1 and OsG1L2 have a similar expression pattern to OsG1L5/TAW1 [16]. However, based on the RNA-seq and qPCR data from this study, there are still some differences in the expression forms of OsG1L1, OsG1L2, and OsG1L5/TAW1. To be specific, OsG1L2 shows significantly higher transcript levels than the other two genes during young panicle differentiation. Moreover, compared to other OsALOG genes, OsG1L2 maintains considerable expression abundance in spikelet organs at the booting stage. OsG1L1 shows low expression in the sterile lemma, palea, and lemma, with almost no expression in other spikelet organs. On the other hand, OsG1L5/TAW1 is expressed only during the young panicle stage and is almost not expressed in the spikelet organs (Table S4). OsG1L6 is also expressed during the young panicle differentiation stage. Unlike the other genes in Group I, OsG1L6 expression gradually increases across the four sample points. Additionally, OsG1L6 is expressed at lower levels in the palea and lemma during the booting stage, with no expression detected in other floral organs.
Based on this study and previous research, we have speculated the expression patterns of the five genes during the young panicle development stage as follows: OsG1L5 begins to express when the inflorescence primordium appears and ceases expression by the time the primary branch primordium emerges. Both OsG1L1 and OsG1L2 also start expressing when the inflorescence primordium appears, but their expression persists for a longer duration. OsG1L1 continues to show some expression in the spikelet meristem, while OsG1L2 even maintains some expression in the spikelet organs during the booting stage. OsG1 begins to express after the expression of the OsG1L5, OsG1L1, and OsG1L2, in other words, it starts when the primary branch primordium appears, and stops expressing after spikelet differentiation is complete. Currently, there is no evidence of OsG1L6 expression in the inflorescence meristem. Furthermore, existing studies have shown that OsG1L6 mutants exhibit no observable phenotypic alterations in branch formation or sterile lemma and rudimentary glume development [8,9,10,11,12,13,14]. Based on these observations, we suggest the possibility that OsG1L6 transcript accumulation follows OsG1 expression, terminating when spikelet differentiation is complete. Compared to group I, research on the biological functions of OsALOG genes in group II is limited. In this study, the expression profiles of OsALOG genes in group II display distinct characteristics. OsG1L3 and OsG1L4 exhibit significantly different expression patterns compared to OsG1L5. However, synteny analysis within the rice genome shows that OsG1L3, OsG1L4, and OsG1L5 are collinear gene pairs with each other. We suspect these differences result from upstream transcriptional regulation. Promoter region analysis reveals substantial differences in cis-elements associated with phytohormones between OsG1L5 and the other two genes, suggesting that their expression is regulated by transcription factors related to phytohormones. OsG1L7 and OsG1L8 show similar expression patterns and were identified as collinear pairs through synteny analysis. Additionally, the Ka/Ks ratio between OsG1L7 and AtLSH6 (Arabidopsis ortholog of OsG1L7) is less than 1, suggesting that OsG1L7 originated before the divergence of monocots and dicots, and plays a crucial role in the evolutionary history of ALOG genes.
In conclusion, our analysis reveals that the OsALOG gene family exhibits both conserved and divergent characteristics in rice. All members of the OsALOG gene family possess the conserved ALOG domain, demonstrating their evolutionary conservation, while the intrinsically disordered regions (IDRs) at both the N-terminal and C-terminal ends reflect the divergence among individual ALOG members. Detailed explanations are provided below. Sequence alignments demonstrate that all members contain conserved ALOG domains, which confer their fundamental function as transcriptional repressors regulating lateral organ development. However, divergence in promoter architectures and intrinsic disorder regions (IDRs) generates distinct expression patterns and functional specialization among family members. We propose that OsALOG genes operate through a coordinated regulatory network, where individual members exhibit either complementary or antagonistic expression profiles (e.g., some genes are highly expressed in early floral meristems while others are specifically activated in organ primordia). This spatiotemporal regulation precisely orchestrates the development of spikelets, glumes, and inner floral organs, ultimately contributing to morphological diversity both within and between rice species. For future investigations, we highlight two research priorities: (i) the functional implications of amino acid residue preferences in ALOG-IDRs, and (ii) the precise biological functions of group II OsALOG genes(classified in expression profiles) during flower development.

Supplementary Materials

The following supporting information can be downloaded at https://www.mdpi.com/article/10.3390/plants14081208/s1, Additional file 1: Figure S1. Conserved ALOG and nuclear localization signal domains of 30 ALOG family proteins; Figure S2. The specific regions of OsG1 and OsMH63G1 in the ALOG domain; Figure S3. The 237bp insertion in the coding region of the OsMH63G1L1; Figure S4. The ten motifs of ALOG proteins; Figure S5. Enrichment analysis of residues in IDRs; Figure S6. A complete alignment map of 30 ALOG amino acid sequences. Additional file 2: Table S1. List of the 10 OsALOG genes identified in this study; Table S2. Information list about ALOG gene family in rice (Os.japonica and Os.indica) and Arabidopsis; Table S3. Ka/Ks ratios of the ALOG syntenic gene pairs between rice and Arabidopsis; Table S4. FPKM values of the ALOG family genes in rice; Table S5. Primer for qRT-PCR analysis of the ALOG family genes in rice.

Author Contributions

J.Z. and H.X. (Huaan Xie) designed and conceived this study. H.W., Y.Z., and H.X. (Hongguang Xie) sampled for RNA-Seq. F.W. performed qRT-PCR analysis. X.L. and Y.W. performed bioinformatics analyses and drafted the manuscript. All authors have read and agreed to the published version of the manuscript.

Funding

This work was supported by the Natural Science Foundation of Fujian Province (grant no. 2022J01454), the National Rice Industry Technology System of Modern Agriculture for China (grant no. CARS-01-08), the “5511” Collaborative Innovation project for High-quality Development and Surpasses of Agriculture between Government of Fujian and Chinese Academy of Agricultural Sciences (grant no. XTCXGC2021001), and the Key program of Science and Technology in Fujian province, China (no. 2024NZ029027).

Data Availability Statement

The RNA-Seq datasets used in the current study are available in the PRJNA1148009 to SRA (Sequence Read Archive) repository (https://www.ncbi.nlm.nih.gov/bioproject/PRJNA1148009) (accessed on 5 July 2024).

Conflicts of Interest

The authors declare no conflict of interest..

Abbreviations

ALOG: Arabidopsis LSH1 and Oryza G1; IDR: intrinsically disordered region; IDP: intrinsically disordered protein; RNA-seq: RNA sequencing; qRT-PCR: quantitative real-time polymerase chain reaction; SRA: Sequence Read Archive.

References

  1. Yoshida, A.; Suzaki, T.; Tanaka, W.; Hirano, H.Y. The homeotic gene long sterile lemma (G1) specifies sterile lemma identity in the rice spikelet. Proc. Natl. Acad. Sci. USA 2009, 106, 20103–20108. [Google Scholar] [CrossRef] [PubMed]
  2. Rieu, P.; Beretta, V.M.; Caselli, F.; Thévénon, E.; Lucas, J.; Rizk, M.; Gregis, V. The ALOG domain defines a family of plant-specific transcription factors acting during Arabidopsis flower development. Proc. Natl. Acad. Sci. USA 2024, 121, e2310464121. [Google Scholar] [CrossRef]
  3. Iyer, L.M.; Aravind, L. ALOG domains, provenance of plant homeotic and developmental regulators from the DNA-binding domain of a novel class of DIRS1-type retroposons. Biol. Direct. 2012, 7, 39. [Google Scholar] [CrossRef] [PubMed]
  4. Naramoto, S.; Jones, V.A.S.; Trozzi, N.; Sato, M.; Toyooka, K.; Shimamura, M.; Kyozuka, J. A conserved regulatory mechanism mediates the convergent evolution of plant shoot lateral organs. PLoS Biol. 2019, 17, e3000560. [Google Scholar] [CrossRef]
  5. Hong, L.; Qian, Q.; Zhu, K.; Tang, D.; Huang, Z.; Gao, L.; Li, M.; Gu, M.; Cheng, Z. ELE restrains empty glumes from developing into lemmas. J. Genet. Genomics 2010, 37, 101–115. [Google Scholar] [CrossRef] [PubMed]
  6. Liu, M.; Li, H.; Su, Y.; Li, W.; Shi, C. G1/ELE functions in the development of rice lemmas in addition to determining identities of empty glumes. Front. Plant Sci. 2016, 7, 1006. [Google Scholar] [CrossRef]
  7. Luo, X.; Wei, Y.; Zheng, Y.; Wei, L.; Wu, F.; Cai, Q.; Xie, H.; Zhang, J. Analysis of co-expression and gene regulatory networks associated with sterile lemma development in rice. BMC Plant Biol. 2023, 23, 11. [Google Scholar] [CrossRef]
  8. Li, X.; Sun, L.; Tan, L.; Liu, F.; Zhu, Z.; Fu, Y.; Sun, X.; Sun, X.; Xie, D.; Sun, C. TH1, a DUF640 domain-like gene controls lemma and palea development in rice. Plant Mol. Biol. 2012, 78, 351–359. [Google Scholar] [CrossRef]
  9. Ma, X.; Cheng, Z.; Wu, F.; Jin, M.; Zhang, L.; Zhou, F.; Wan, J. BEAK LIKE SPIKELET1 is required for lateral development of lemma and palea in rice. Plant Mol. Biol. Rep. 2013, 31, 98–108. [Google Scholar] [CrossRef]
  10. Yan, D.; Zhou, Y.; Ye, S.; Zeng, L.; Zhang, X.; He, Z. BEAK-SHAPED GRAIN 1/TRIANGULAR HULL 1, a DUF640 gene, is associated with grain shape, size and weight in rice. Sci. China Life Sci. 2013, 56, 275–283. [Google Scholar] [CrossRef]
  11. Sato, D.S.; Ohmori, Y.; Nagashima, H.; Toriba, T.; Hirano, H.Y. A role for TRIANGULAR HULL1 in fine-tuning spikelet morphogenesis in rice. Genes. Genet. Syst. 2014, 89, 61–69. [Google Scholar] [CrossRef] [PubMed]
  12. Ren, D.; Rao, Y.; Wu, L.; Xu, Q.; Li, Z.; Yu, H.; Zhang, Y.; Leng, Y.; Hu, J.; Zhu, L.; et al. The pleiotropic ABNORMAL FLOWER AND DWARF1 affects plant height, floral development and grain yield in rice. J. Integr. Plant Biol. 2016, 58, 529–539. [Google Scholar] [CrossRef] [PubMed]
  13. Peng, P.; Liu, L.; Fang, J.; Zhao, J.; Yuan, S.; Li, X. The rice TRIANGULAR HULL1 protein acts as a transcriptional repressor in regulating lateral development of spikelet. Sci. Rep. 2017, 7, 13712. [Google Scholar] [CrossRef]
  14. Wang, J.; Zhang, Q.; Wang, Y.; Huang, J.; Luo, N.; Wei, S.; Jin, J. Analysing the rice young panicle transcriptome reveals the gene regulatory network controlled by TRIANGULAR HULL1. Rice 2019, 12, 6. [Google Scholar] [CrossRef] [PubMed]
  15. Yoshida, A.; Sasao, M.; Yasuno, N.; Takagi, K.; Daimon, Y.; Chen, R.; Kyozuka, J. TAWAWA1, a regulator of rice inflorescence architecture, functions through the suppression of meristem phase transition. Proc. Natl. Acad. Sci. USA 2013, 110, 767–772. [Google Scholar] [CrossRef]
  16. Beretta, V.M.; Franchini, E.; Din, I.U.; Lacchini, E.; Broeck, L.V.; Sozzani, R.; Orozco-Arroyo, G.; Caporali, E.; Adam, H.; Jouannic, S.; et al. The ALOG family members OsG1L1 and OsG1L2 regulate inflorescence branching in rice. Plant J. 2023, 115, 351–368. [Google Scholar] [CrossRef]
  17. Zhao, L.; Nakazawa, M.; Takase, T.; Manabe, K.; Kobayashi, M.; Seki, M.; Matsui, M. Overexpression of LSH1, a member of an uncharacterised gene family, causes enhanced light regulation of seedling development. Plant J. 2004, 37, 694–706. [Google Scholar] [CrossRef]
  18. Lee, M.; Dong, X.; Song, H.; Yang, J.Y.; Kim, S.; Hur, Y. Molecular characterization of Arabidopsis thaliana LSH1 and LSH2 genes. Genes Genomics 2020, 42, 1151–1162. [Google Scholar] [CrossRef]
  19. Takeda, S.; Hanano, K.; Kariya, A.; Shimizu, S.; Zhao, L.; Matsui, M.; Tasaka, M.; Aida, M. CUP-SHAPED COTYLEDON1 transcription factor activates the expression of LSH4 and LSH3, two members of the ALOG gene family, in shoot organ boundary cells. Plant J. 2011, 66, 1066–1077. [Google Scholar] [CrossRef]
  20. Zou, J.; Li, Z.; Tang, H.; Zhang, L.; Li, J.; Li, Y.; Yao, N.; Li, Y.; Yang, D.; Zuo, Z. Arabidopsis LSH8 positively regulates ABA signaling by changing the expression pattern of ABA-responsive proteins. Int. J. Mol. Sci. 2021, 22, 10314. [Google Scholar] [CrossRef]
  21. Vo Phan, M.S.; Keren, I.; Tran, P.T.; Lapidot, M.; Citovsky, V. Arabidopsis LSH10 transcription factor and OTLD1 histone deubiquitinase interact and transcriptionally regulate the same target genes. Commun. Biol. 2023, 6, 58. [Google Scholar] [CrossRef] [PubMed]
  22. Huang, X.; Xiao, N.; Zou, Y.; Xie, Y.; Tang, L.; Zhang, Y.; Yu, Y.; Li, Y.; Xu, C. Heterotypic transcriptional condensates formed by prion-like paralogous proteins canalize flowering transition in tomato. Genome Biol. 2022, 23, 78. [Google Scholar] [CrossRef]
  23. Takanashi, H.; Kajiya-Kanegae, H.; Nishimura, A.; Yamada, J.; Ishimori, M.; Kobayashi, M.; Sakamoto, W. DOMINANT AWN INHIBITOR encodes the ALOG protein originating from gene duplication and inhibits awn elongation by suppressing cell proliferation and elongation in sorghum. Plant Cell Physiol. 2022, 63, 901–918. [Google Scholar] [CrossRef] [PubMed]
  24. Pancsa, R.; Tompa, P. Structural disorder in eukaryotes. PLoS ONE 2012, 7, e34687. [Google Scholar] [CrossRef]
  25. Wright, P.E.; Dyson, H.J. Intrinsically disordered proteins in cellular signalling and regulation. Nat. Rev. Mol. Cell Biol. 2015, 16, 18–29. [Google Scholar] [CrossRef]
  26. Kovacs, D.; Tompa, P. Diverse functional manifestations of intrinsic structural disorder in molecular chaperones. Biochem. Soc. Trans. 2012, 40, 963–968. [Google Scholar] [CrossRef]
  27. Boeynaems, S.; Alberti, S.; Fawzi, N.L.; Mittag, T.; Polymenidou, M.; Rousseau, F.; Skeymkowitz, J.; Wolozin, B.; Bosch, L.V.D.; Tompa, P.; et al. Protein phase separation, a new phase in cell biology. Trends Cell Biol. 2018, 28, 420–435. [Google Scholar] [CrossRef] [PubMed]
  28. Ikeda, K.; Sunohara, H.; Nagato, Y. Developmental course of inflorescence and spikelet in rice. Breed. Sci. 2004, 54, 147–156. [Google Scholar] [CrossRef]
  29. Mistry, J.; Chuguransky, S.; Williams, L.; Qureshi, M.; Salazar, G.A.; Sonnhammer, E.L.; Bateman, A. Pfam, The protein families database in 2021. Nucleic Acids Res. 2021, 49, D412–D419. [Google Scholar] [CrossRef]
  30. Mistry, J.; Finn, R.D.; Eddy, S.R.; Bateman, A.; Punta, M. Challenges in homology search, HMMER3 and convergent evolution of coiled-coil regions. Nucleic Acids Res. 2013, 41, e121. [Google Scholar] [CrossRef]
  31. Shen, W.; Le, S.; Li, Y.; Hu, F. SeqKit, a cross-platform and ultrafast toolkit for FASTA/Q file manipulation. PLoS ONE 2016, 11, e0163962. [Google Scholar] [CrossRef] [PubMed]
  32. Tamura, K.; Dudley, J.; Nei, M.; Kumar, S. MEGA4, molecular evolutionary genetics analysis (MEGA) software version 4.0. Mol. Biol. Evol. 2007, 24, 1596–1599. [Google Scholar] [CrossRef]
  33. Waterhouse, A.M.; Procter, J.B.; Martin, D.M.; Clamp, M.; Barton, G.J. Jalview Version 2—A multiple sequence alignment editor and analysis workbench. Bioinformatics 2009, 25, 1189–1191. [Google Scholar] [CrossRef]
  34. Chen, C.; Wu, Y.; Li, J.; Wang, X.; Zeng, Z.; Xu, J.; Liu, Y.; Feng, J.; Chen, H.; He, Y.; et al. TBtools-II, A “one for all, all for one” bioinformatics platform for biological big-data mining. Mol. Plant 2023, 16, 1733–1742. [Google Scholar] [CrossRef] [PubMed]
  35. Jones, D.T.; Cozzetto, D. DISOPRED3, precise disordered region predictions with annotated protein-binding activity. Bioinformatics 2015, 31, 857–863. [Google Scholar] [CrossRef] [PubMed]
  36. Gasteiger, E.; Gattiker, A.; Hoogland, C.; Ivanyi, I.; Appel, R.D.; Bairoch, A. ExPASy, the proteomics server for in-depth protein knowledge and analysis. Nucleic Acids Res. 2003, 31, 3784–3788. [Google Scholar] [CrossRef]
  37. Krogh, A.; Larsson, B.; Von Heijne, G.; Sonnhammer, E.L. Predicting transmembrane protein topology with a hidden Markov model, application to complete genomes. J. Mol. Biol. 2001, 305, 567–580. [Google Scholar] [CrossRef]
  38. Wang, Y.; Tang, H.; DeBarry, J.D.; Tan, X.; Li, J.; Wang, X.; Paterson, A.H. MCScanX, a toolkit for detection and evolutionary analysis of gene synteny and collinearity. Nucleic Acids Res. 2012, 40, e49. [Google Scholar] [CrossRef]
  39. Wang, D.; Zhang, Y.; Zhang, Z.; Zhu, J.; Yu, J. KaKs_Calculator 2.0, a toolkit incorporating gamma-series methods and sliding window strategies. Genom. Proteom. Bioinf. 2010, 8, 77–80. [Google Scholar] [CrossRef]
  40. Lescot, M.; Déhais, P.; Thijs, G.; Marchal, K.; Moreau, Y.; Van de Peer, Y.; Rouzé, P.; Rombauts, S. PlantCARE, a database of plant cis-acting regulatory elements and a portal to tools for in silico analysis of promoter sequences. Nucleic Acids Res. 2002, 30, 325–327. [Google Scholar] [CrossRef]
  41. Schmittgen, T.D.; Livak, K.J. Analyzing real-time PCR data by the comparative CT method. Nat. Protoc. 2008, 3, 1101–1108. [Google Scholar] [CrossRef] [PubMed]
  42. Van Der Lee, R.; Buljan, M.; Lang, B.; Weatheritt, R.J.; Daughdrill, G.W.; Dunker, A.K.; Fuxreiter, M.; Gough, J.; Gsponer, J.; Jones, D.T.; et al. Classification of intrinsically disordered regions and proteins. Chem. Rev. 2014, 114, 6589–6631. [Google Scholar] [CrossRef] [PubMed]
  43. Das, R.K.; Ruff, K.M.; Pappu, R.V. Relating sequence encoded information to form and function of intrinsically disordered proteins. Curr. Opin. Struct. Biol. 2015, 32, 102–112. [Google Scholar] [CrossRef]
  44. Boija, A.; Klein, I.A.; Sabari, B.R.; Dall’Agnese, A.; Coffey, E.L.; Zamudio, A.V.; Li, C.H.; Shrinivas, K.; Manteiga, J.C.; Hannet, N.M.; et al. Transcription factors activate genes through the phase-separation capacity of their activation domains. Cell 2018, 175, 1842–1855. [Google Scholar] [CrossRef]
  45. Michelitsch, M.D.; Weissman, J.S. A census of glutamine/asparagine-rich regions, implications for their conserved function and the prediction of novel prions. Proc. Natl. Acad. Sci. USA 2000, 97, 11910–11915. [Google Scholar] [CrossRef] [PubMed]
  46. Alberti, S.; Halfmann, R.; King, O.; Kapila, A.; Lindquist, S. A systematic survey identifies prions and illuminates sequence features of prionogenic proteins. Cell 2009, 137, 146–158. [Google Scholar] [CrossRef]
  47. Franzmann, T.M.; Alberti, S. Prion-like low-complexity sequences, Key regulators of protein solubility and phase behavior. J. Biol. Chem. 2019, 294, 7128–7136. [Google Scholar] [CrossRef]
Figure 1. Characterization analysis of 30 ALOG family members in rice and Arabidopsis. (A) The phylogenetic tree of ALOG members and structures of ALOG genes. (B) Protein domains of ALOG members. (C) MEME motif analysis of ALOG proteins. Details of clusters are shown in different colors. Details of the motifs can be found in Figure S1. The length of genes and proteins can be estimated using the scale at the bottom.
Plants 14 01208 g001
Figure 2. The proportions of amino acid residue in OsALOG-IDRs. The red text represents non-polar residues.
Plants 14 01208 g002
Figure 3. Synteny analysis of OsALOG genes. (A) Synteny analysis and distribution of OsALOG genes in rice (Oryza sativa japonica). (B) Comparative syntenic maps of ALOG genes in rice (Oryza sativa japonica) and Arabidopsis. Red line indicates homologous gene pairs.
Plants 14 01208 g003
Figure 4. cis-regulatory elements of ALOG gene analysis. (A) Distribution of cis-regulatory elements in the promoter regions. (B) Heatmap showing the counts of cis-regulatory elements in the promoter regions. In Figure (A), the red box highlights the RY-element, while in Figure (B), different colored fonts of the elements indicate their corresponding annotations with Figure (A).
Plants 14 01208 g004
Figure 5. Expression profiles of the OsALOG genes in young panicles at four developmental stages and in five spikelet organs at the booting stage. The three data blocks below the black solid line represent three biological replicates. Details of the clusters are shown in different colors. FPKM values were normalized (Z-score) according to the row scale.
Plants 14 01208 g005
Figure 6. Expression analysis of 10 ALOG genes of nine sample points (three biological replicates) by qRT-PCR. Data were normalized to the UBQ5 gene, and vertical bars indicate standard deviation. The fill colors of the bar (red and blue) correspond to group Ⅰ and group Ⅱ in Figure 5, respectively. S1–S4, four stages of young panicle; sl, sterile lemma; pl, palea; le, lemma; fl, inner floral organs; br, branch.
Plants 14 01208 g006aPlants 14 01208 g006b
Table 1. Description of samples collected for RNA-Seq at different panicle development stages.
Sample IDSampling PointLength of InflorescenceApical Spikelet Development Stage
S1 Young panicle1~2 mmFormation of palea, elongation of Sterile lemma and lemma.
S2 Young panicle2~5 mmFormation of stamen and pistil primordia.
S3 Young panicle5~10 mmStamen and pistil begin to differentiate, Palea and lemma close up gradually.
S4 Young panicle10~15 mmFormation of pollen and ovule.
slSterile lemma-Booting stage
plPalea-Booting stage
leLemma-Booting stage
flInner floral organs-Booting stage
brBranch-Booting stage
Note: the determination of the apical spikelet development stage reference to previous research [28].
Disclaimer/Publisher’s Note: The statements, opinions and data contained in all publications are solely those of the individual author(s) and contributor(s) and not of MDPI and/or the editor(s). MDPI and/or the editor(s) disclaim responsibility for any injury to people or property resulting from any ideas, methods, instructions or products referred to in the content.

