
Response of Watermelon to Drought Stress and Its Drought-Resistance Evaluation

 ,
,
Abstract
1. Introduction
- Pot water control at the seedling stage (e.g., cassava (Manihot esculenta Crantz), watermelon, Gleditsia sinensis, herbaceous plants (Limonium bicolor, Agropyron mongolicum, Agropyron desertorum, Astragalus adsurgens, Mellilotus of ficinalis, Trifolium repens, Medicago sativa, Glycyrrhiza uralensis, Artemisia ordosica, Suaeda glauca, Althaea rosea, Agriophyllum squarrosum), wheat, Helleborus orientalis, chrysanthemum (Chrysanthemum)) [29,30,31,32,33,34,35],
2. Results
2.1. Drought Injury Index of 13 Watermelon Genotypes
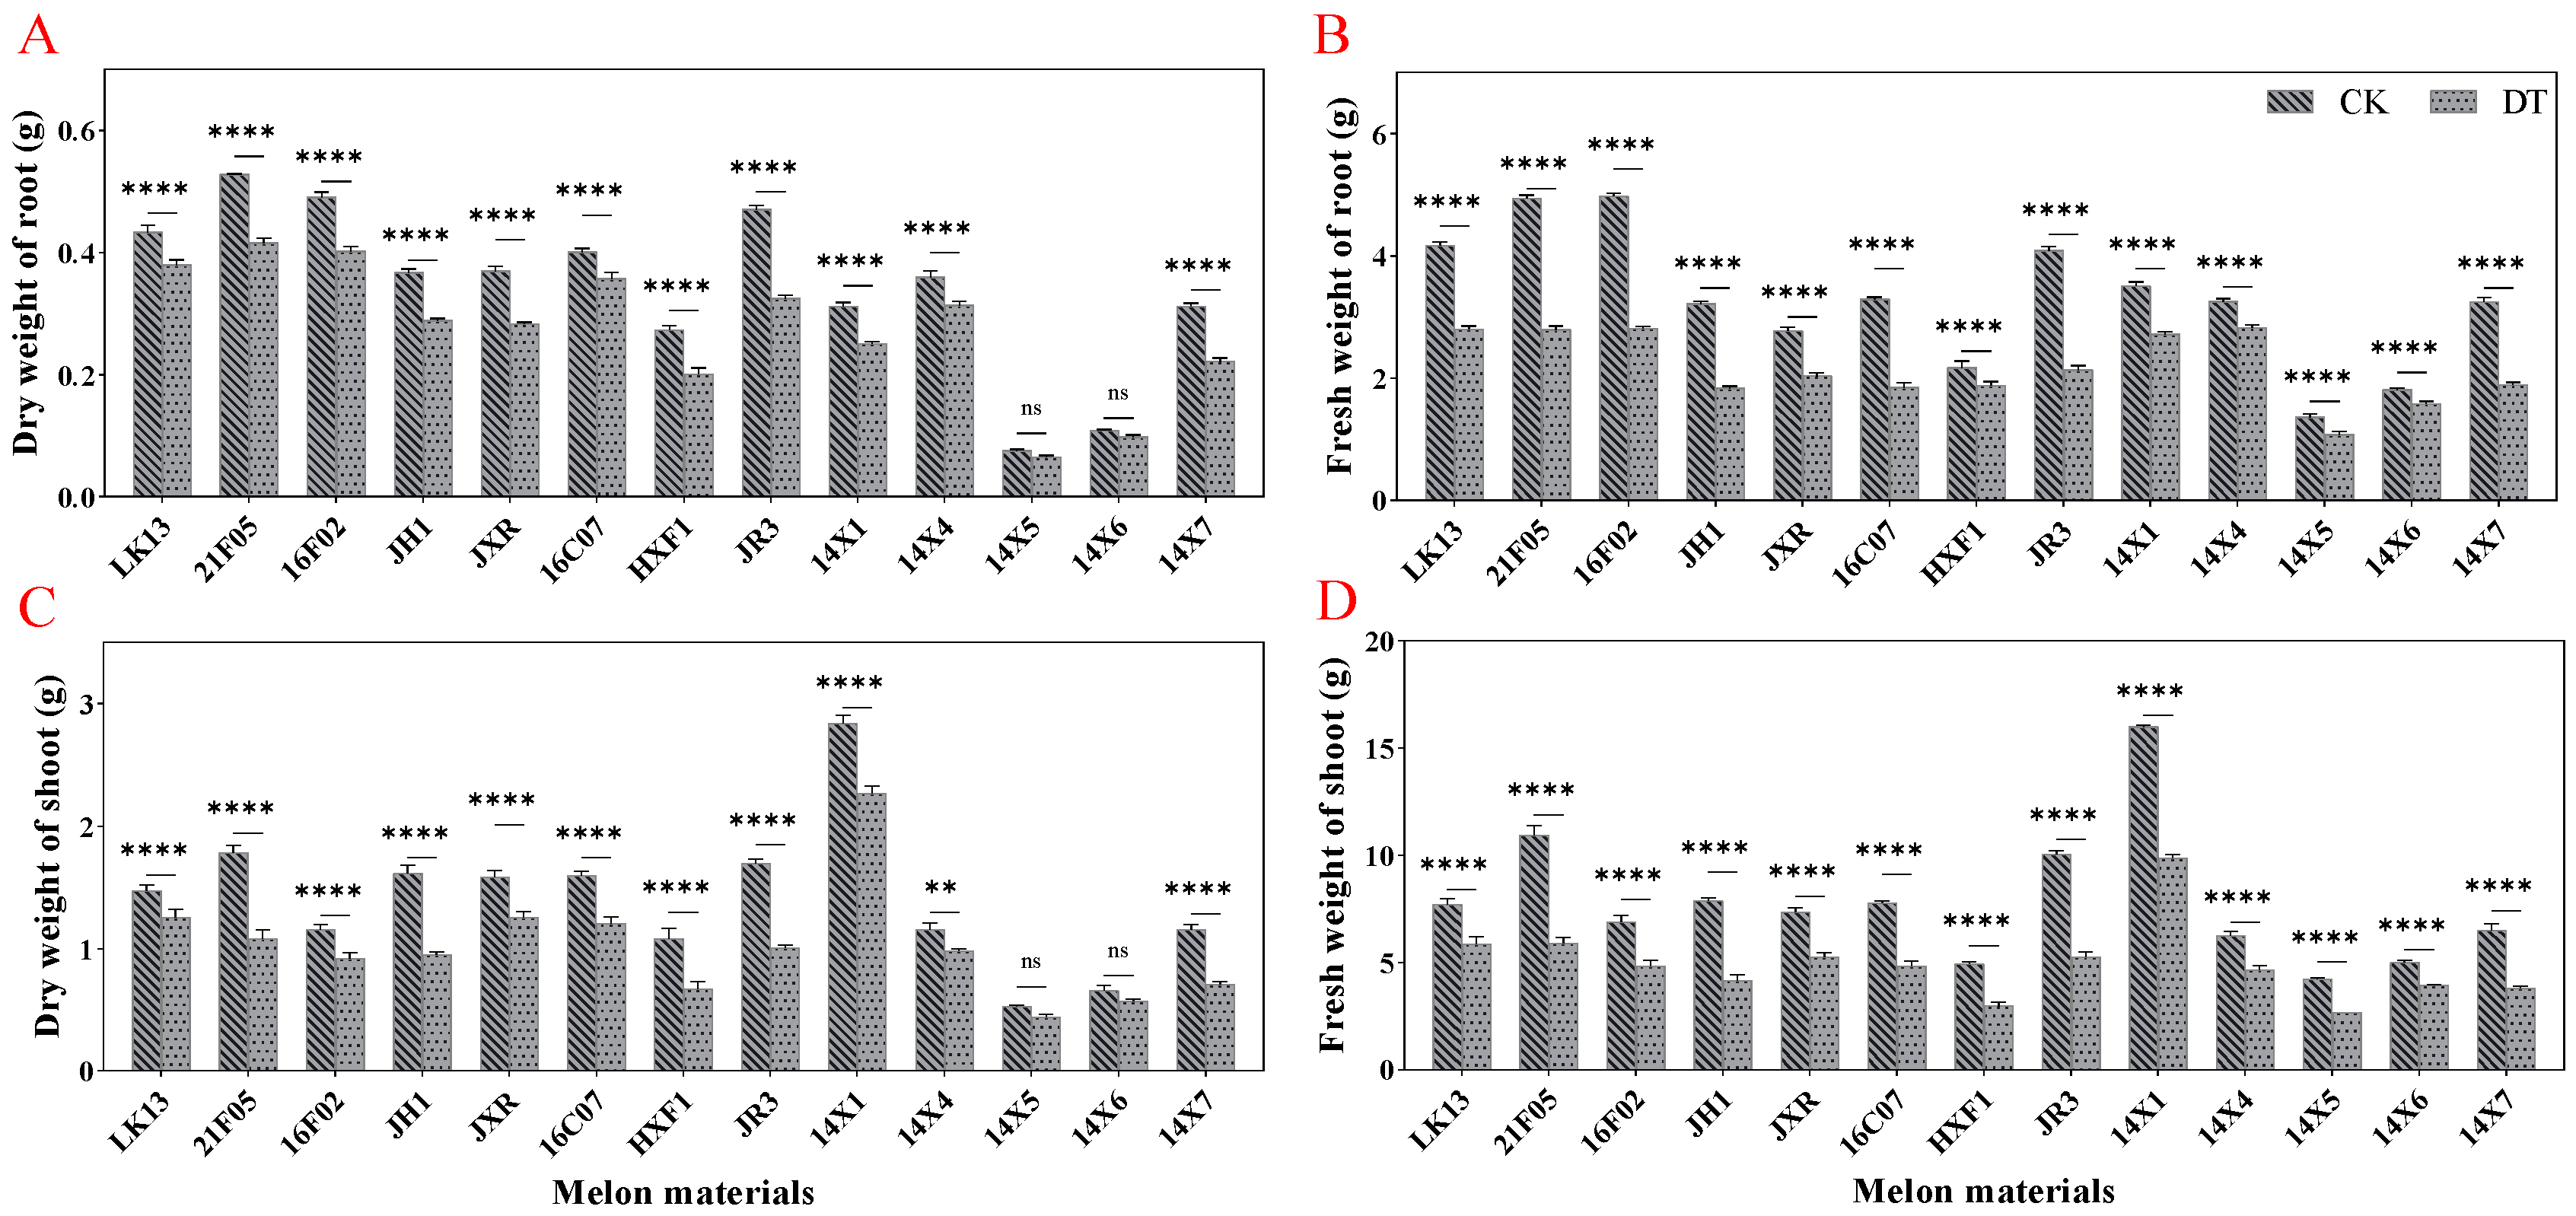
2.2. Effects of Drought Stress on Growth Parameters
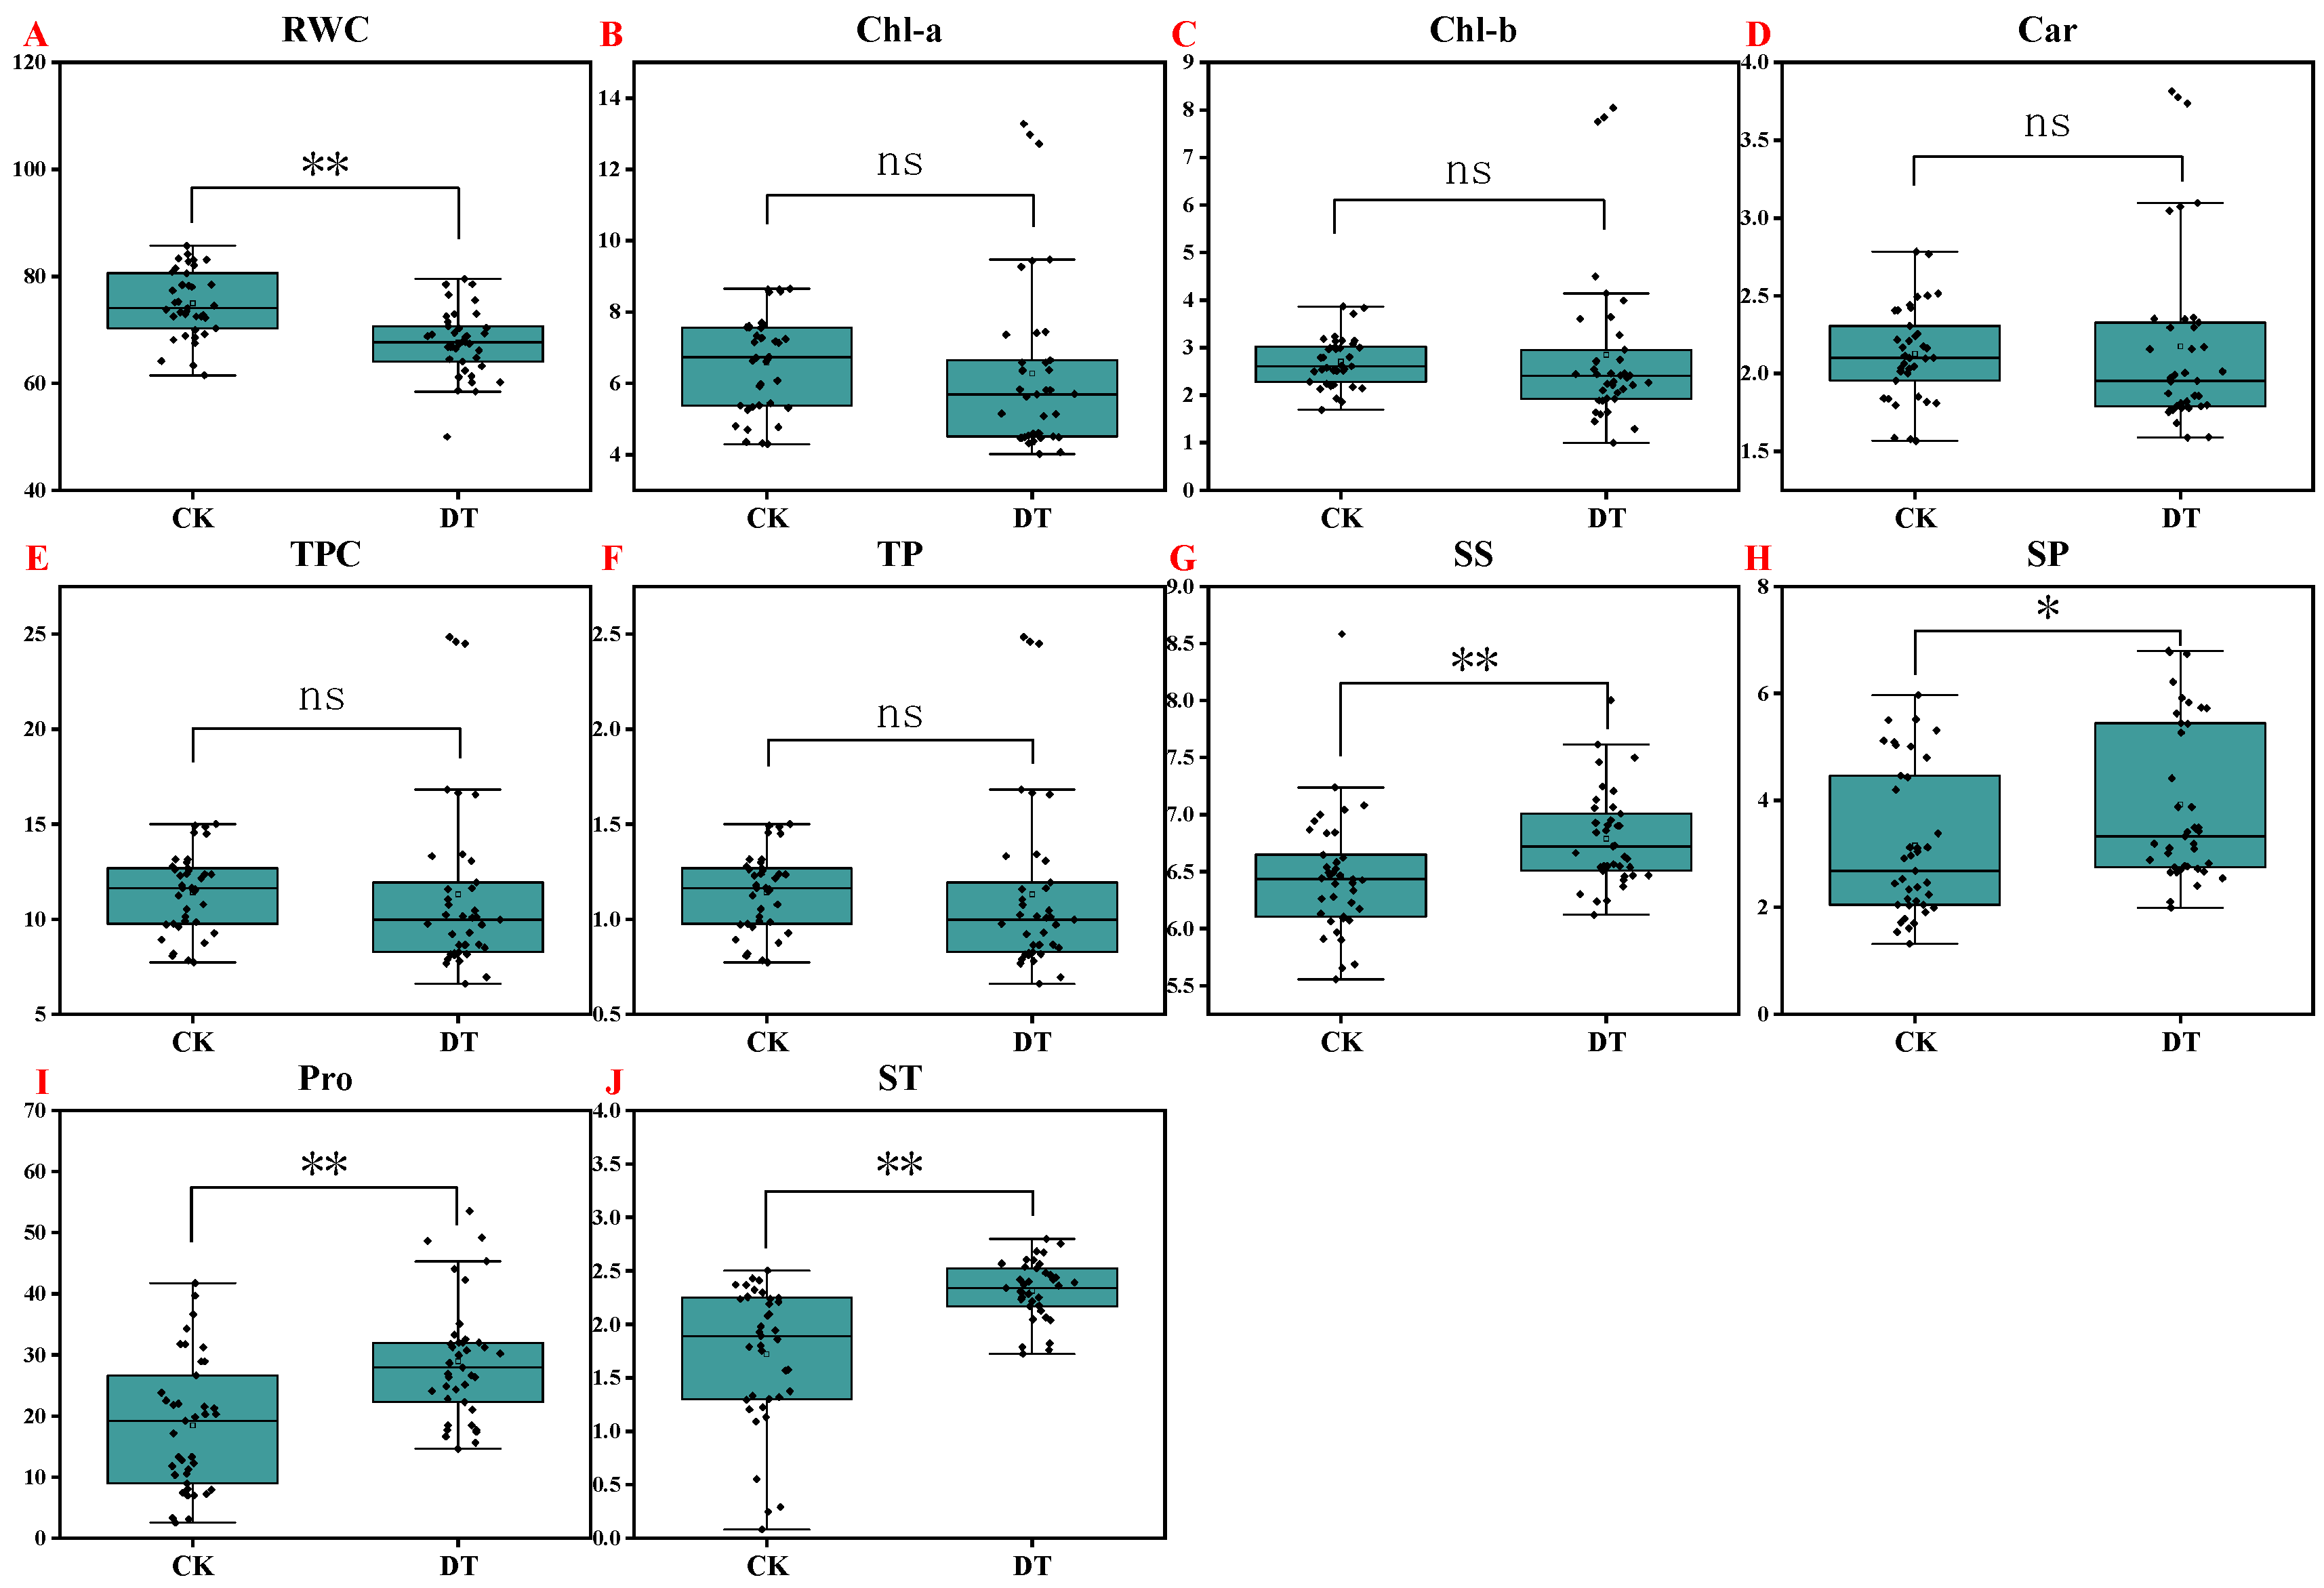
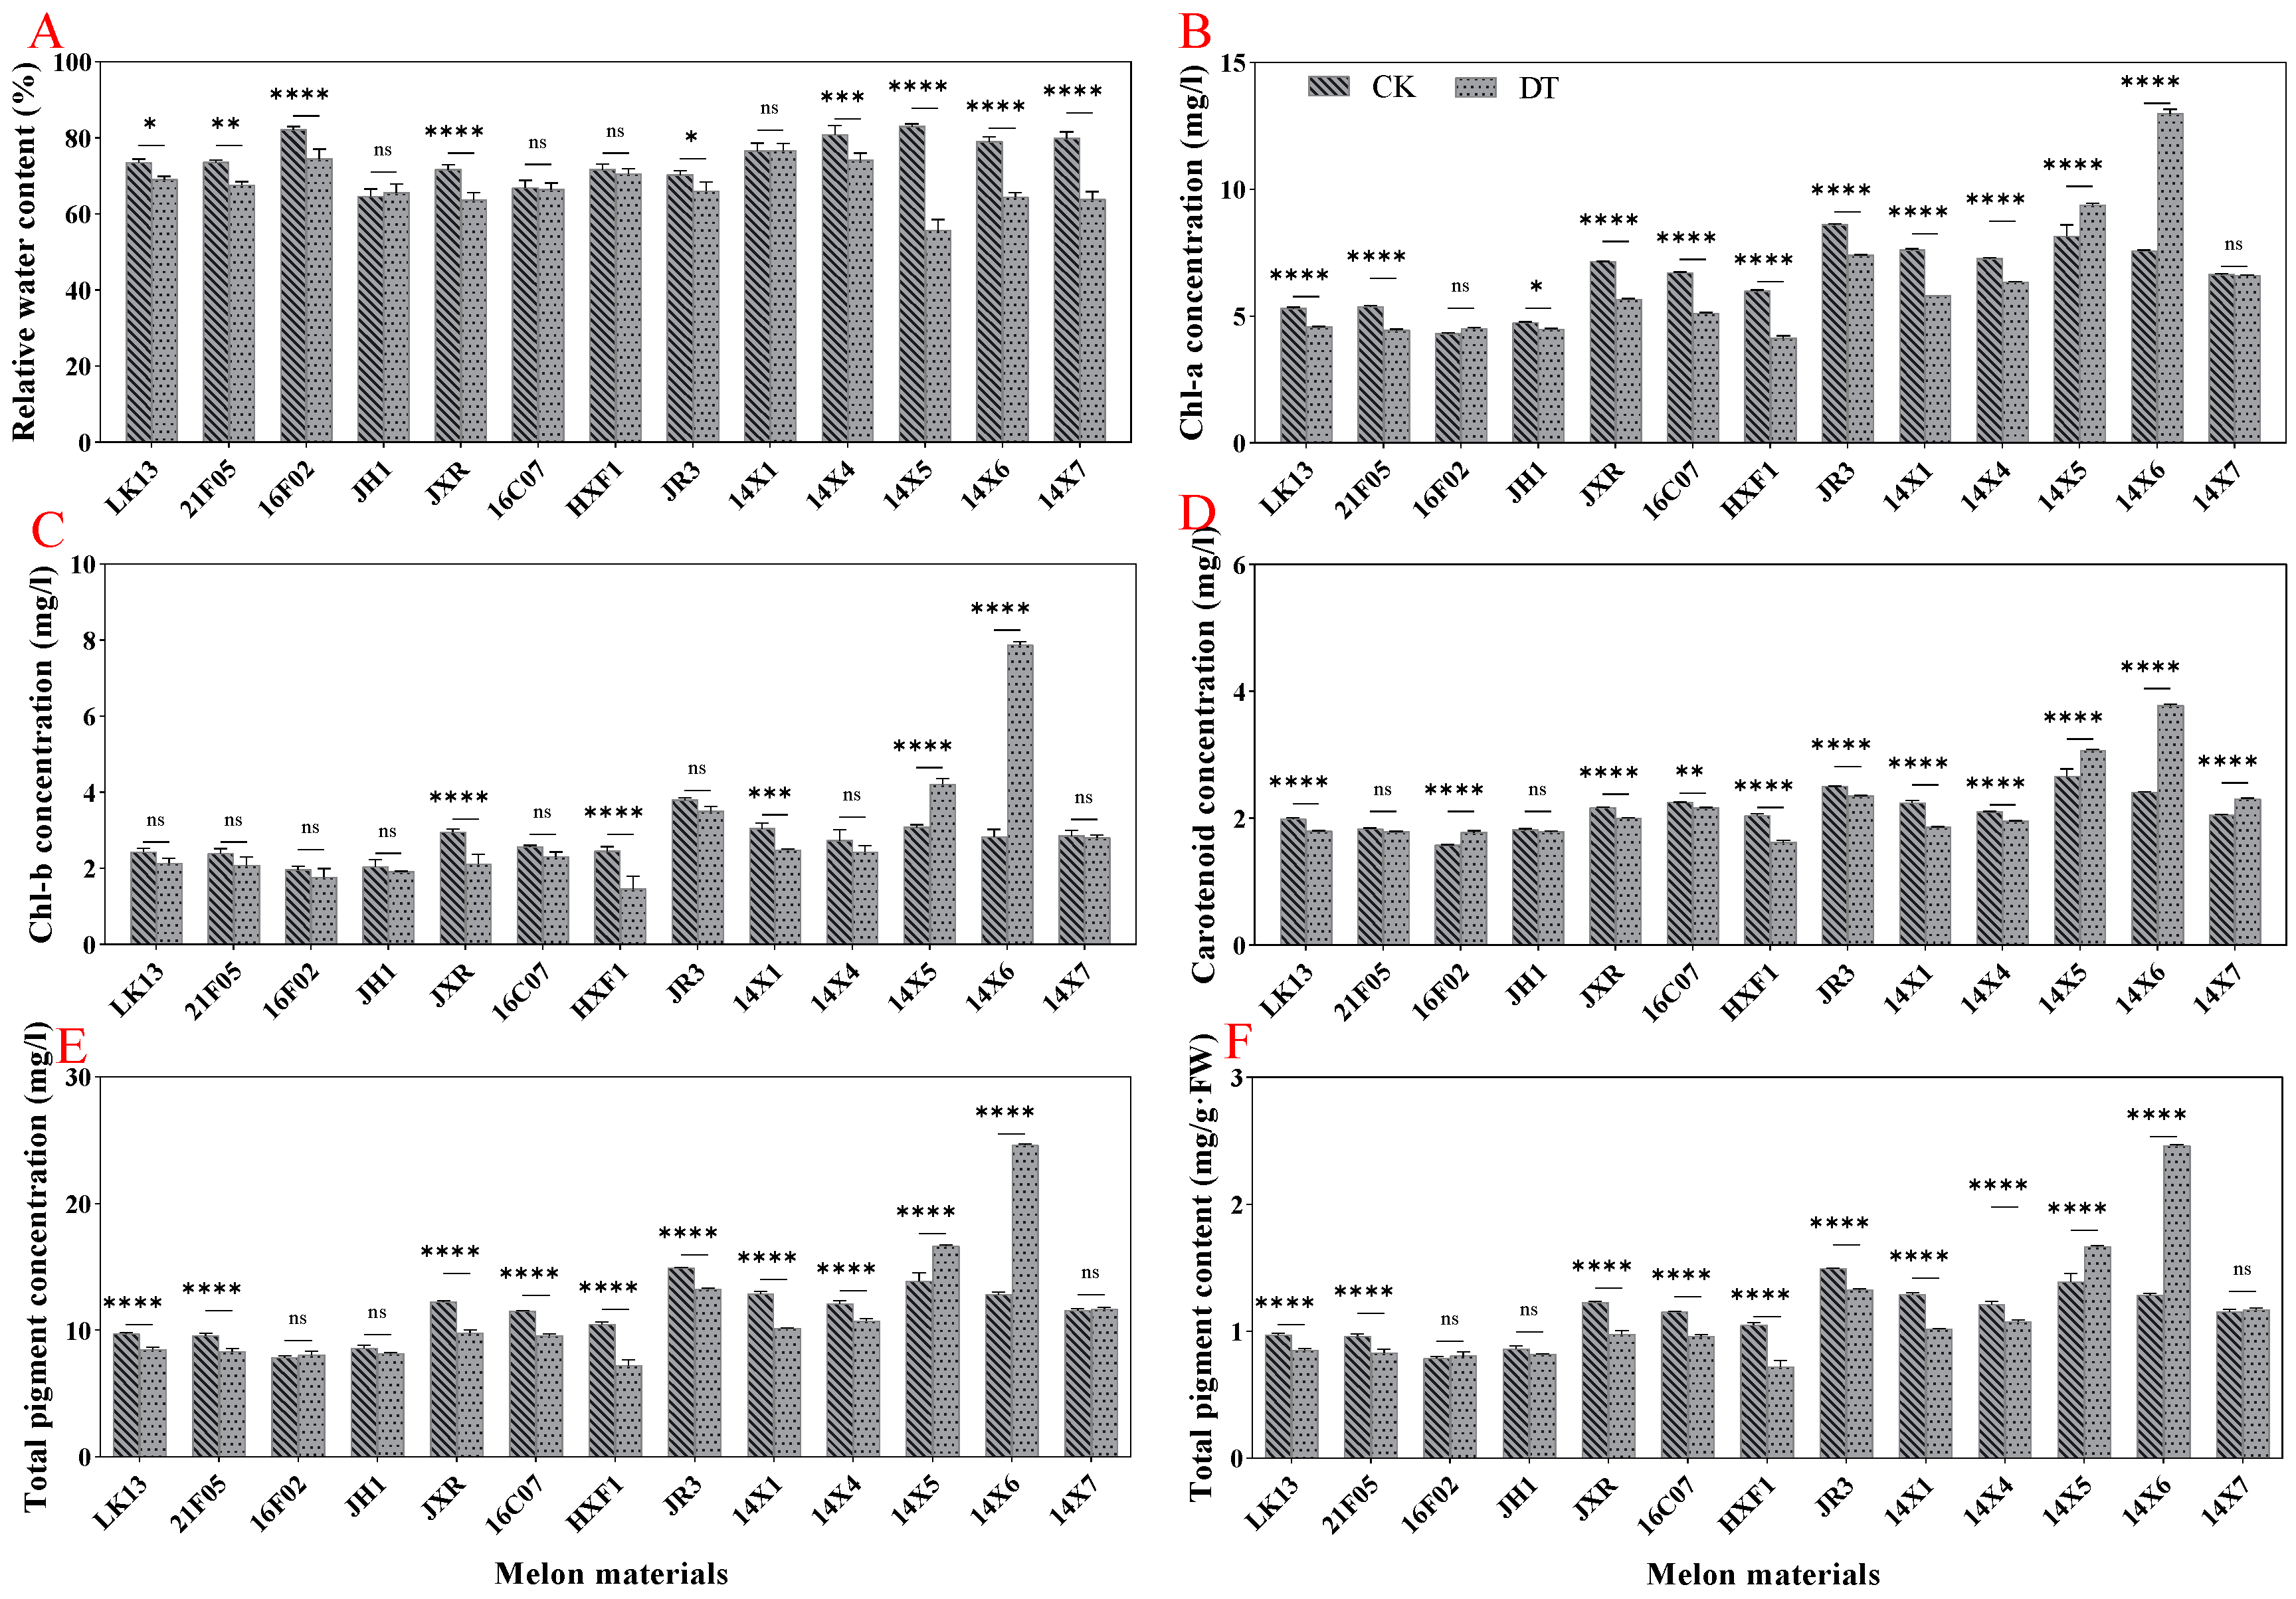
2.3. Effect of Drought Stress on Relative Water Content and Pigment Content
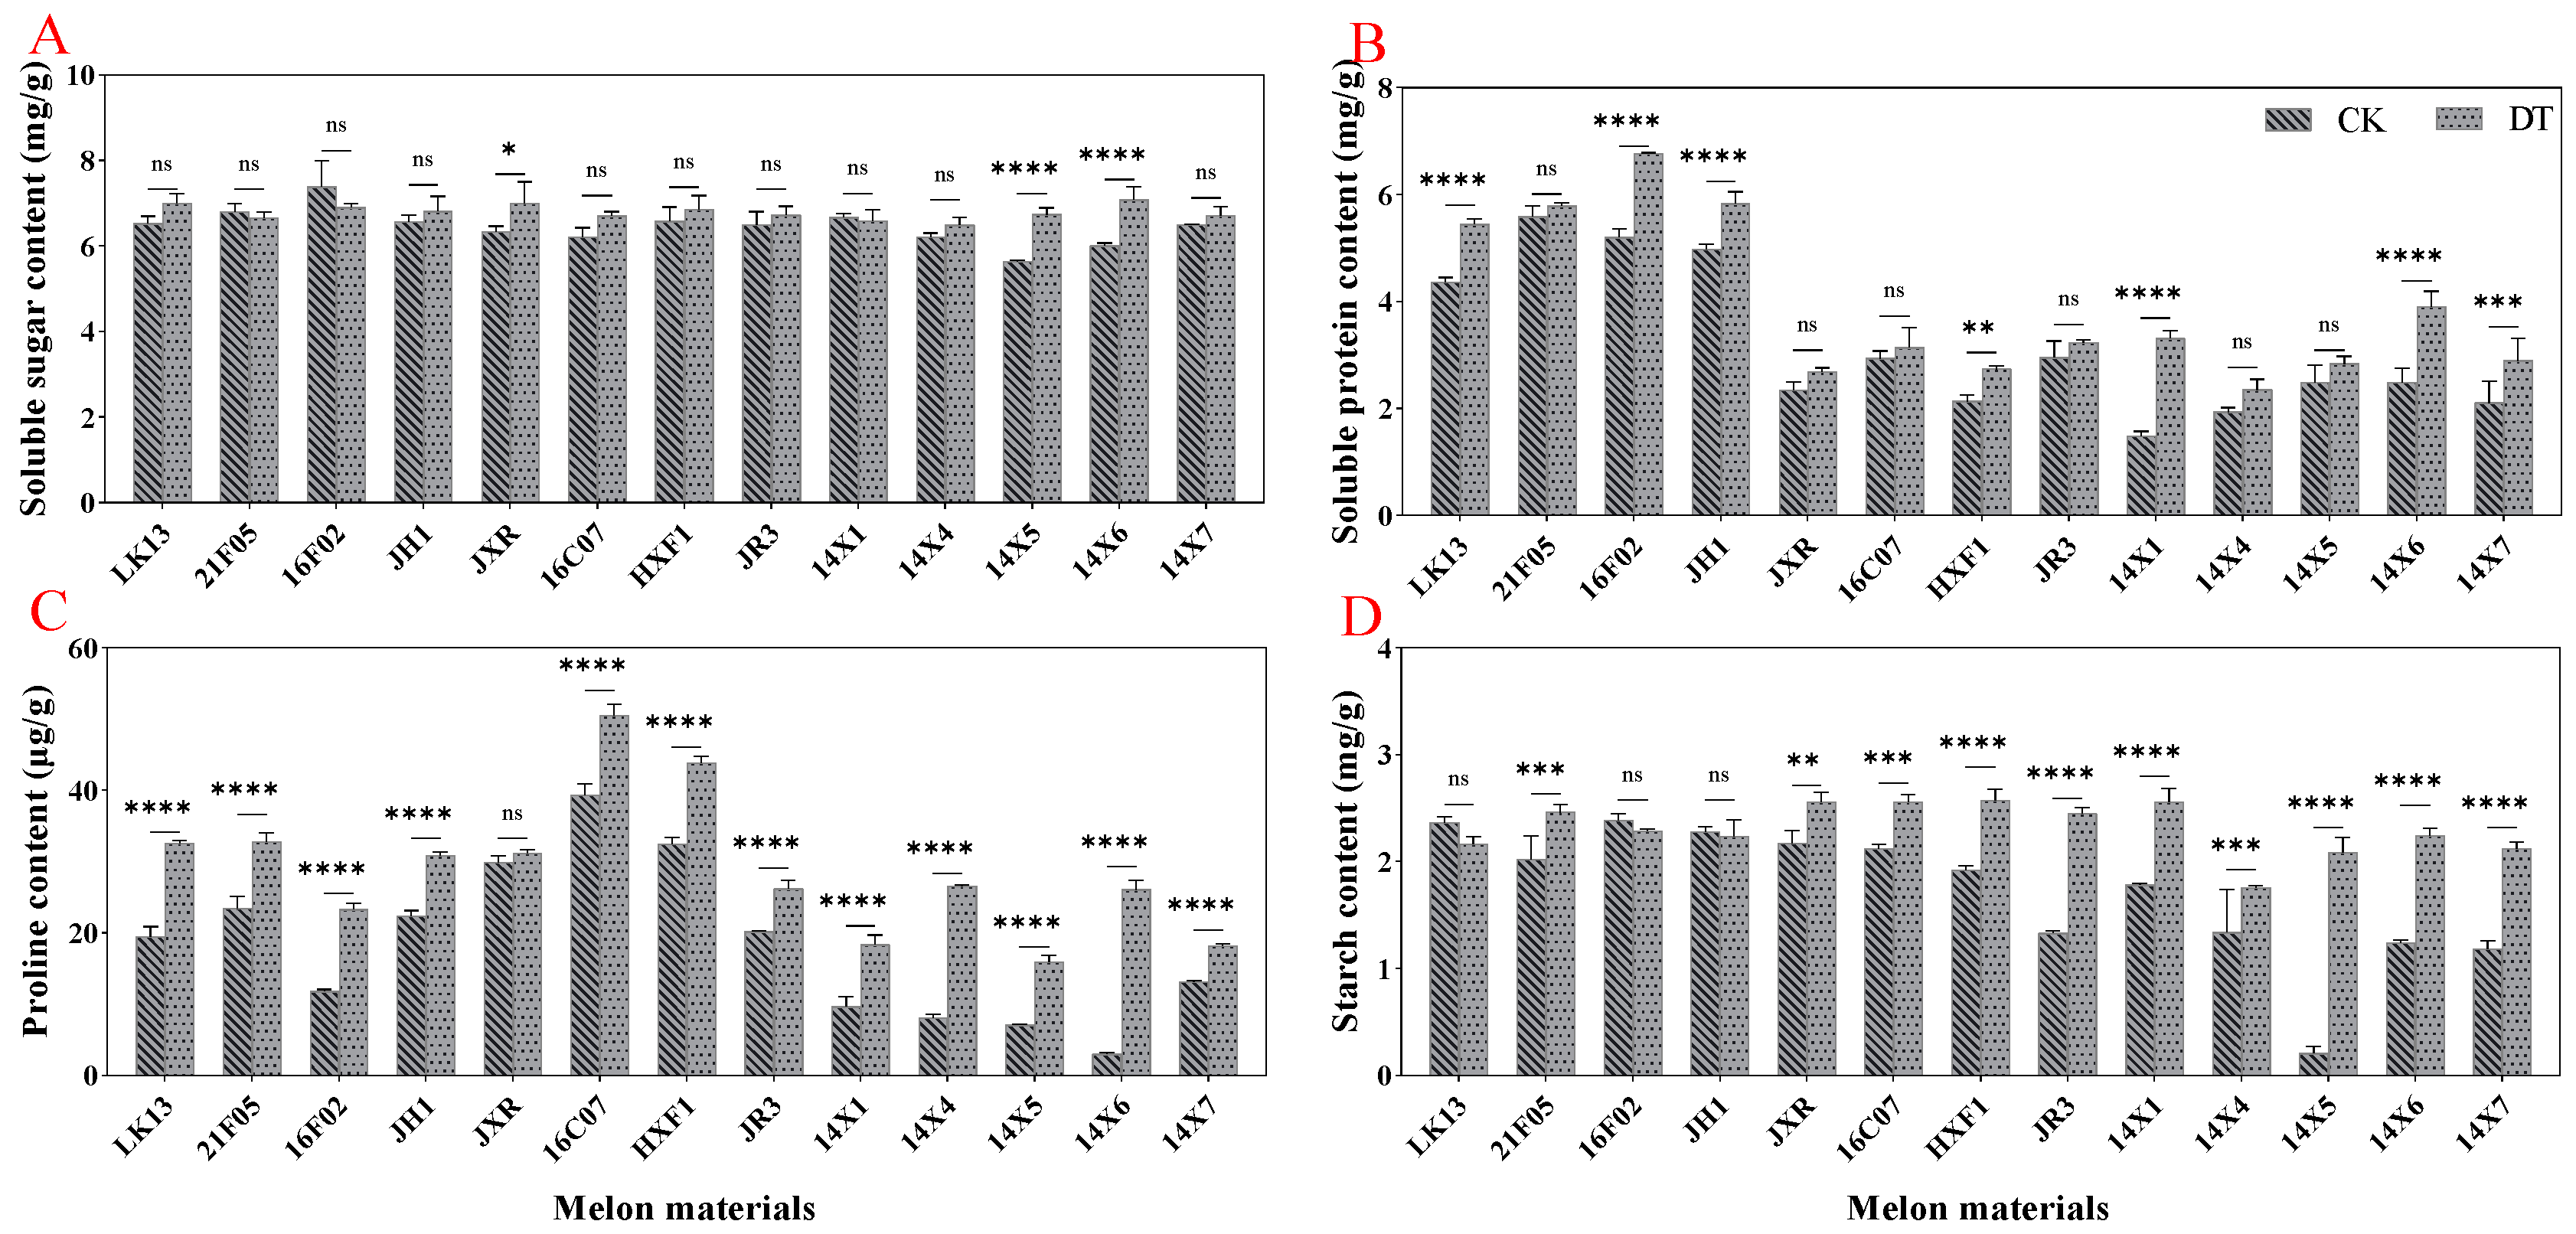
2.4. Effect of Drought Stress on the Contents of Osmotic Adjustment Substances
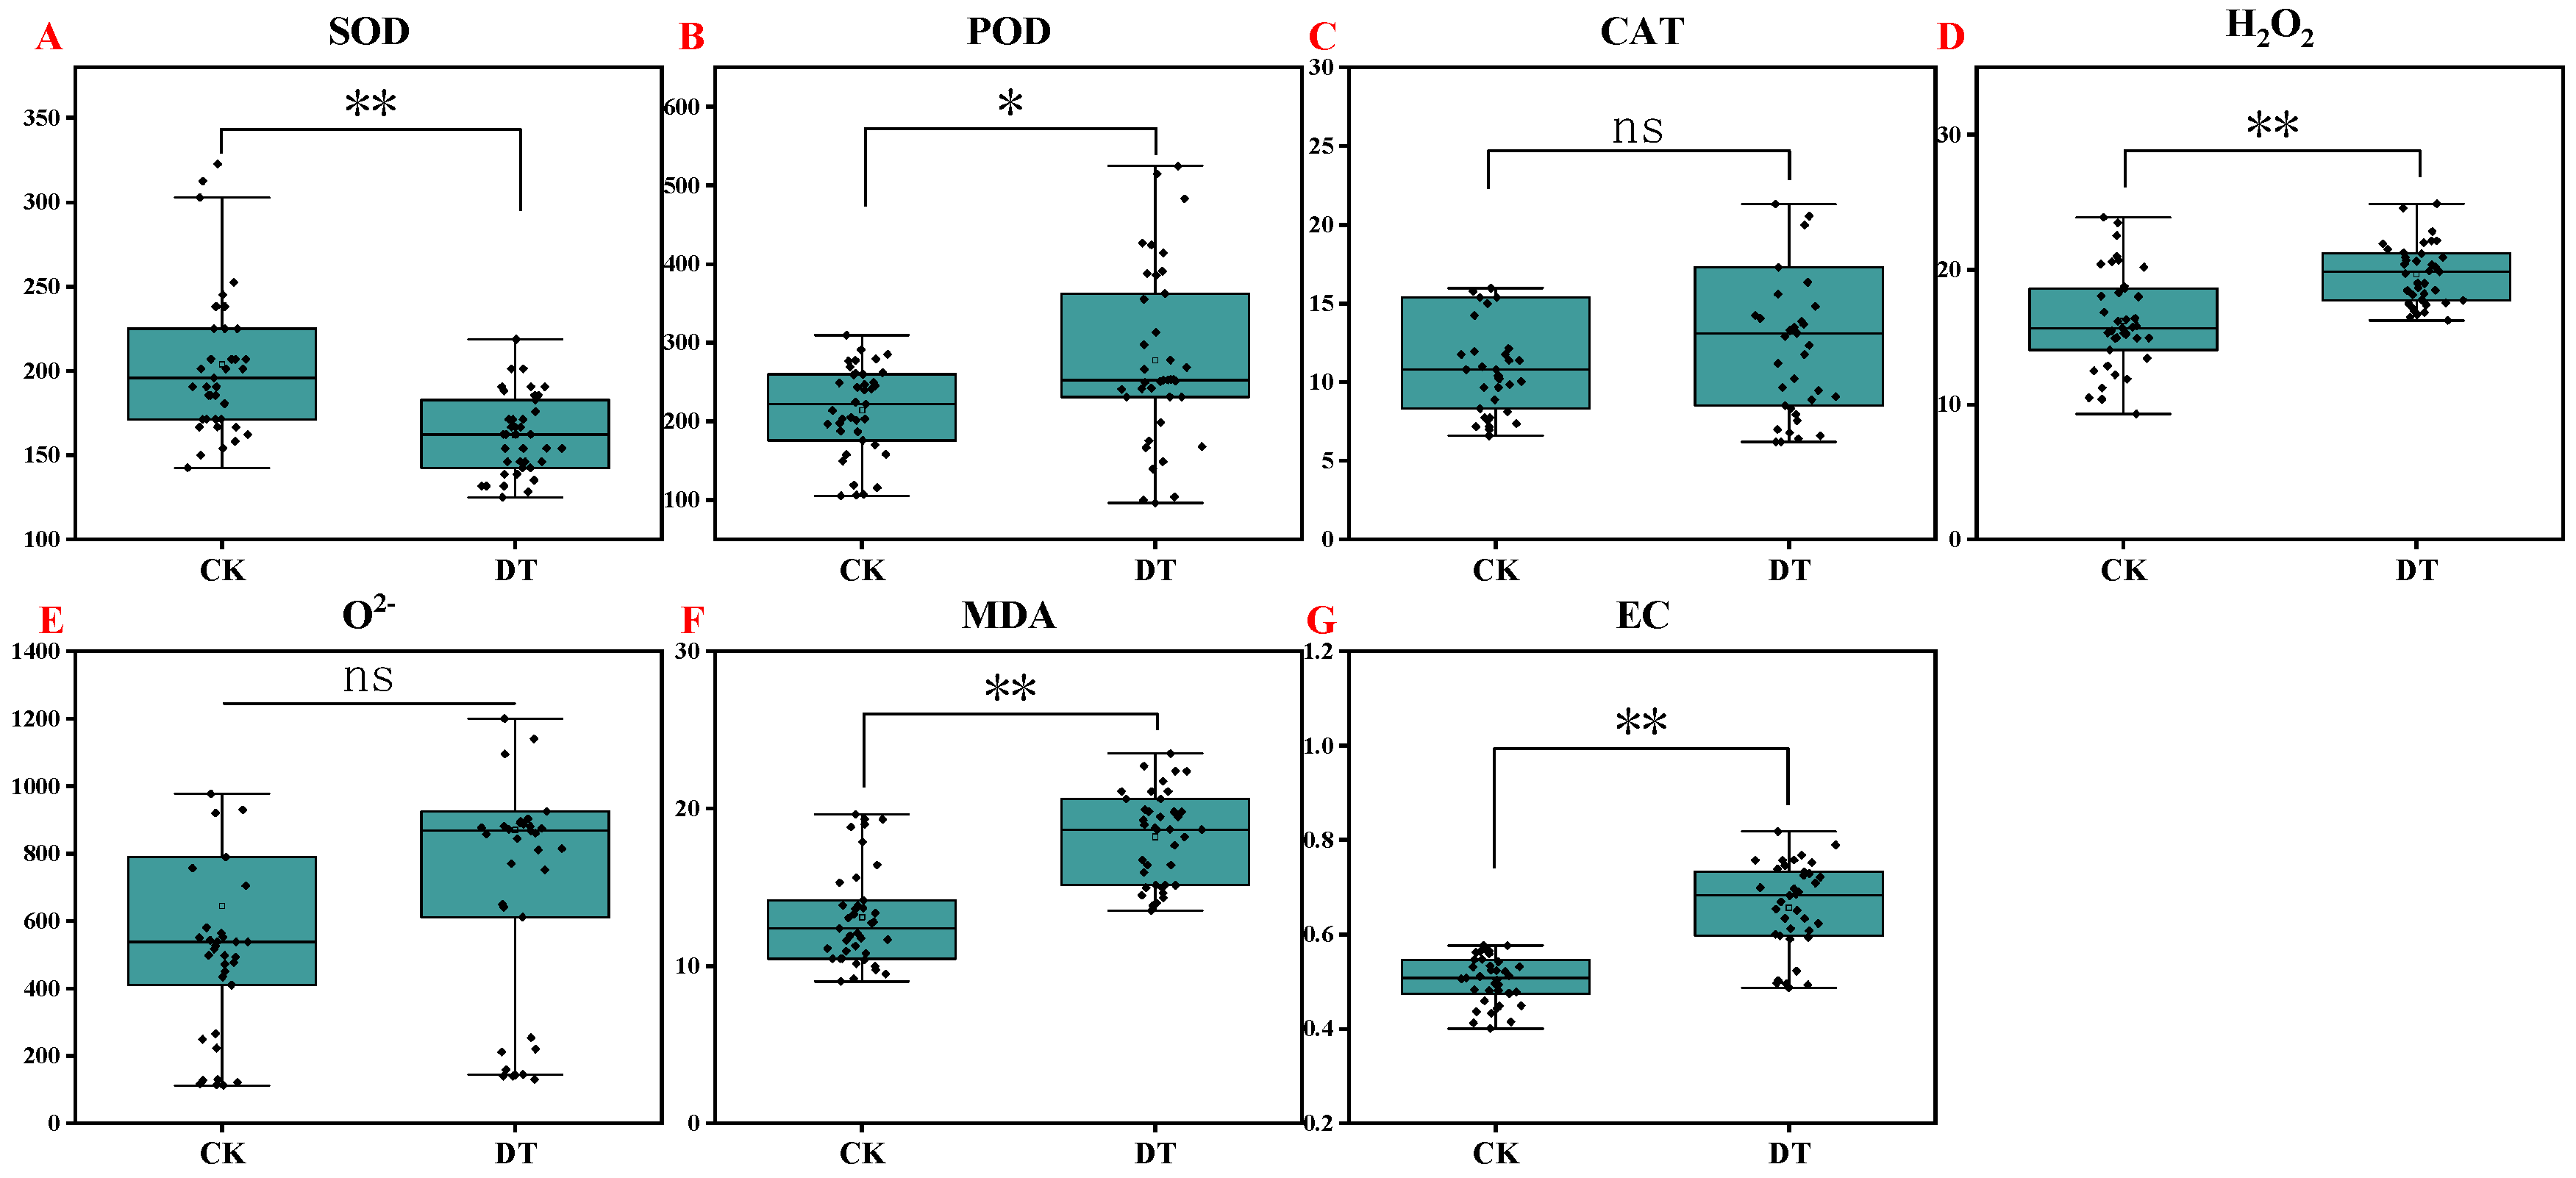
2.5. Antioxidant Enzyme Activities and Oxidative Stress
2.6. Membrane Damage
2.7. Drought Stress Index and Phenotypic Plasticity Index
2.8. Correlation Analysis
2.9. Principal Component Analysis
2.10. Comprehensive Evaluation of Drought Resistance
3. Discussion
3.1. Identification Method of Plant Drought Resistance
3.2. Response of Plants to Drought Stress
3.3. Comprehensive Evaluation of Plant Drought Resistance
4. Materials and Methods
4.1. Plant Materials
4.2. Material Planting and Drought Stress Treatment
4.3. Measuring Indicators and Methods
4.3.1. Drought Injury Grade and Drought Injury Index
4.3.2. Seedling Growth Index
4.3.3. Root Architecture
4.3.4. Physiologic and Biochemical Index
4.4. Comprehensive Evaluation of Drought Resistance
4.5. Statistics
5. Conclusions
- (1)
- This paper clarified the growth and physiological and biochemical responses of watermelon seedlings under drought stress. Compared to the control, drought stress significantly reduced the fresh and dry weights, root length, root area, root volume, root tips, and forks of watermelon seedlings. What is more, drought significantly reduced the relative water content of leaves and increased the levels of osmotic-adjustment substances (soluble sugars, soluble proteins, proline, and starch). Persistent drought also modulated the activities of antioxidant enzymes (SOD, POD, and CAT), leading to oxidative stress through the accumulation of H2O2, resulting in oxidative stress. Membrane damage, indicated by a significant increase in the MDA content and relative conductivity, was observed, adversely affecting seedling growth.
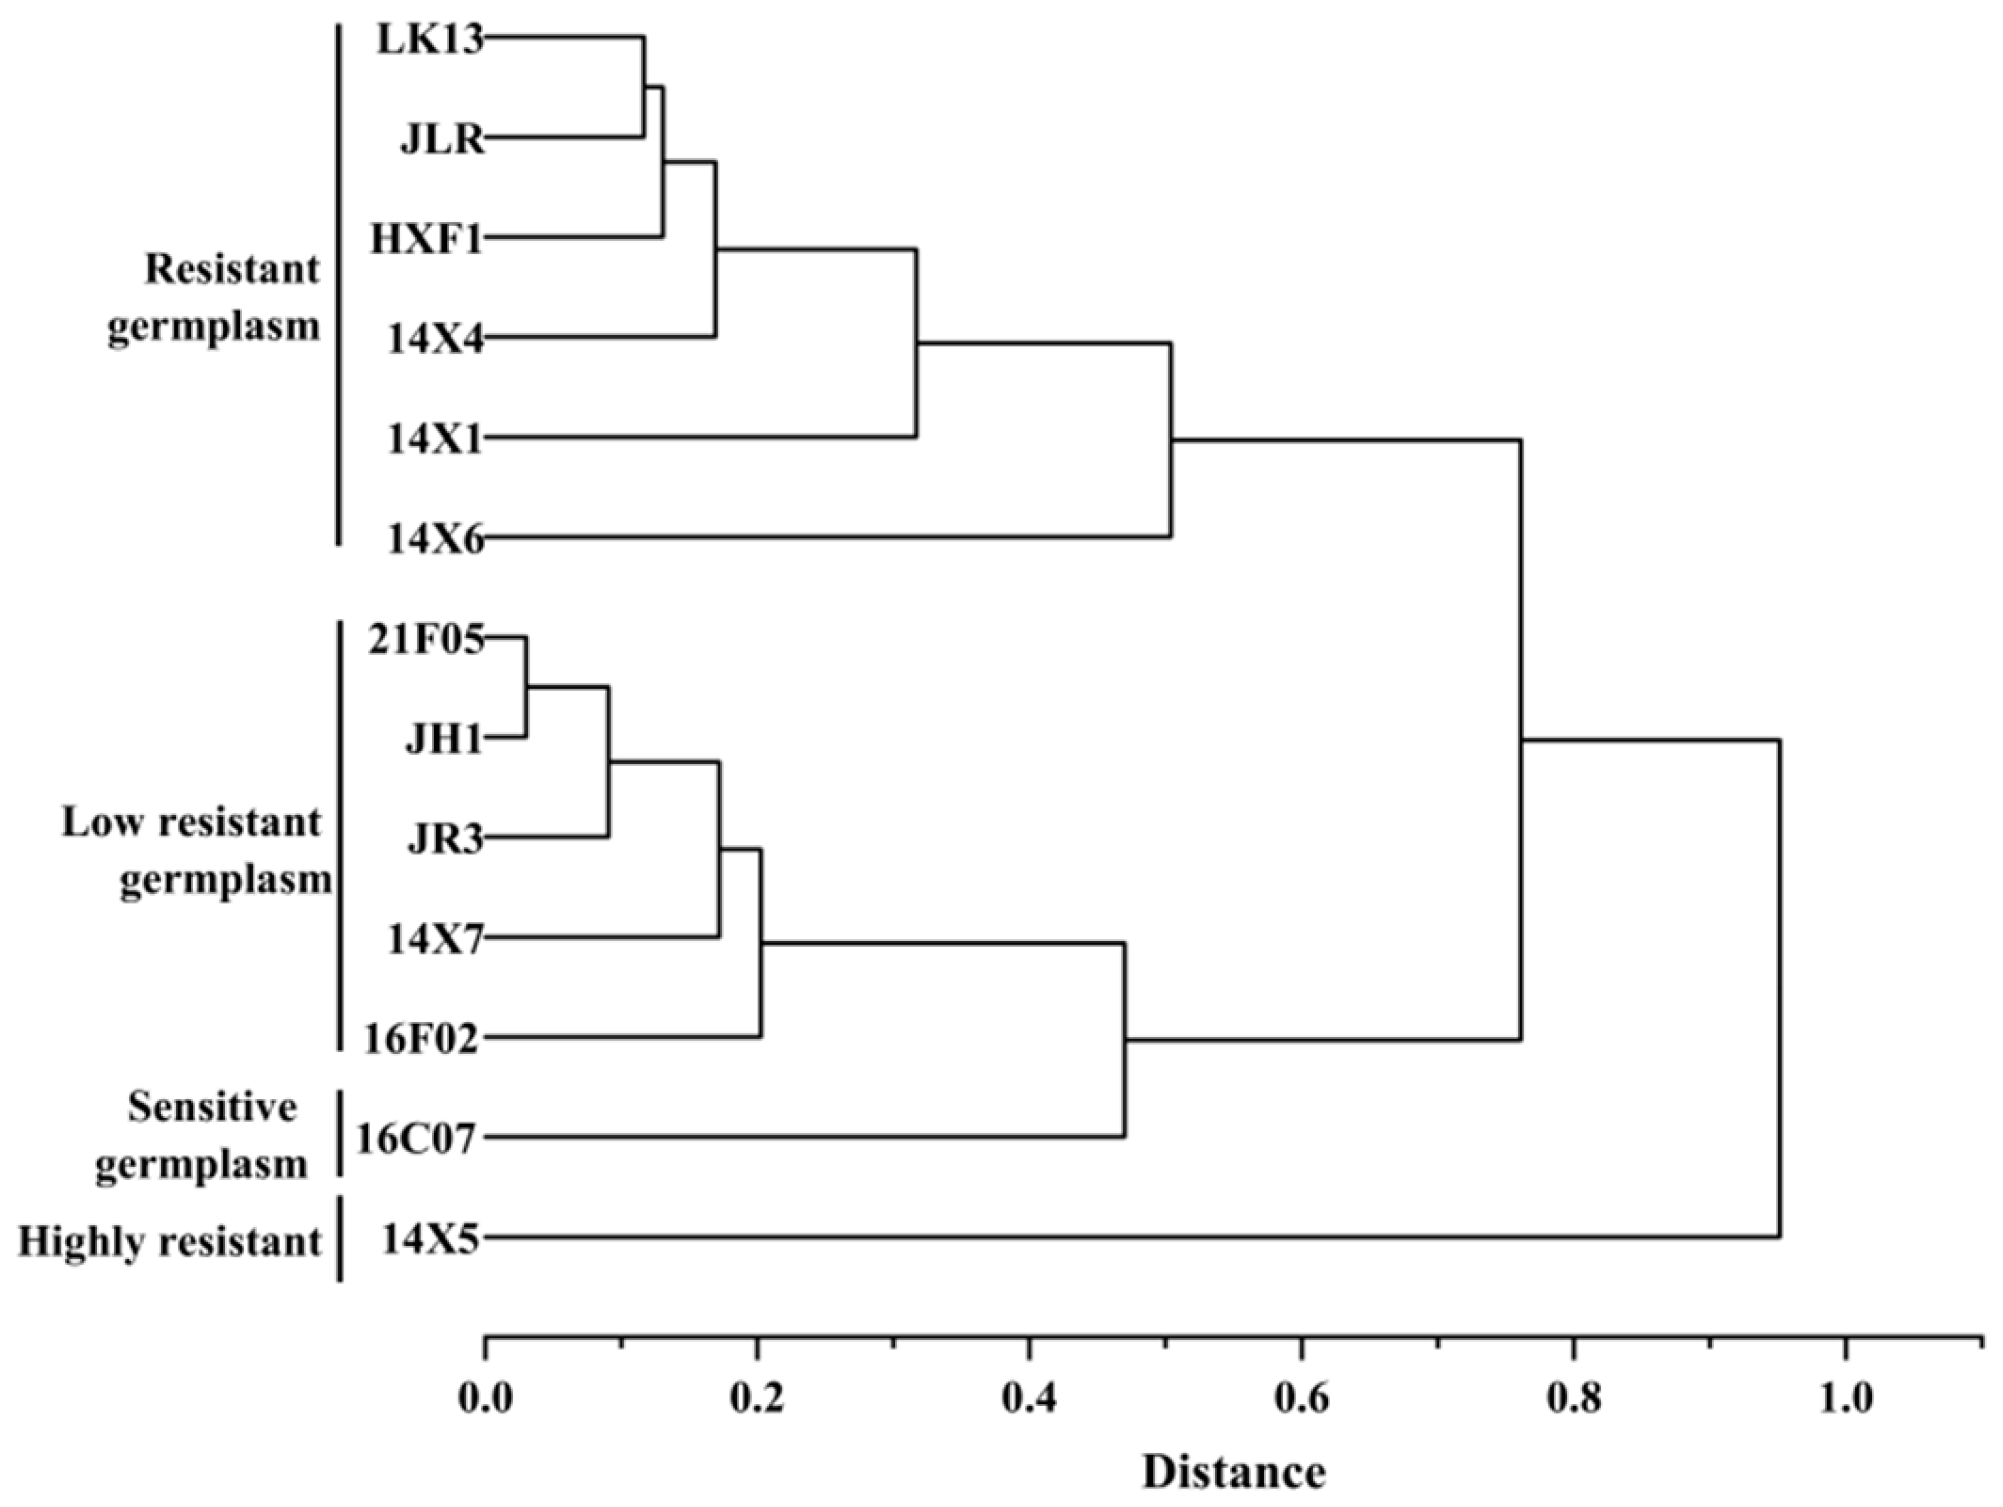
- (2)
- The 13 watermelon genotypes were clustered into 4 categories. The first category was a highly-drought-resistant germplasm, including 14X5; the second category was drought-resistant germplasms, including LK13, JLR, HXF1, 14X4, 14X1, and 14X6; the third category was low-drought-resistant germplasms, including 21F05, JH1, JR3, 14X7, and 16F02; the fourth category was a drought-sensitive germplasm, including 16C07. This study provides the material basis for watermelon drought resistance breeding.
Author Contributions
Funding
Data Availability Statement
Conflicts of Interest
References
- Zhu, Y.L.; Liu, Y.; Kong, X.H.; Wang, X.X.; Zhang, M.Q.; Hong, X.W.; Chen, H.P.; Sun, J.Q. Research progress and prospect on the drought, heatwave, and compound drought and heatwave events in China. Trans. Atmos. Sci. 2025, 48, 26–36. [Google Scholar] [CrossRef]
- Chen, Y.N.; Li, Z.; Fang, G.H.; Li, Y.P. Global drought variation and its adaptation. Sci. Technol. Rev. 2025, 1–6. Available online: http://kns.cnki.net/kcms/detail/11.1421.N.20241212.1623.006.html (accessed on 20 April 2025).
- Cao, Y.; Yang, W.; Ma, J.; Cheng, Z.; Zhang, X.; Liu, X.; Wu, X.; Zhang, J. An Integrated framework for drought stress in plants. Int. J. Mol. Sci. 2024, 25, 9347. [Google Scholar] [CrossRef] [PubMed]
- Hura, T.; Hura, K.; Ostrowska, A. Drought-stress induced physiological and molecular changes in plants. Int. J. Mol. Sci. 2022, 23, 4698. [Google Scholar] [CrossRef] [PubMed]
- Li, Y.Y.; Zhao, X.; Yue, L.; Qiu, Y. Research progress and prospect on the interaction between plant root exudates and rhizosphere microorganisms under drought stress. J. Arid Meteorol. 2024, 42, 325–337. [Google Scholar] [CrossRef]
- Mukherjee, A.; Dwivedi, S.; Bhagavatula, L.; Datta, S. Integration of light and ABA signaling pathways to combat drought stress in plants. Plant Cell Rep. 2023, 42, 829–841. [Google Scholar] [CrossRef]
- Zhang, C.Q.; Li, L.L. Citespace-based analysis of the effects of high temperature and drought on plant growth and metabolism. J. Mt. Agric. Biol. 2024, 43, 53–60. [Google Scholar] [CrossRef]
- Zhang, H.; Zhu, J.; Gong, Z.; Zhu, J.K. Abiotic stress responses in plants. Nat. Rev. Genet. 2022, 23, 104–119. [Google Scholar] [CrossRef]
- Gupta, A.; Rico-Medina, A.; Caño-Delgado, A.I. The physiology of plant responses to drought. Science 2020, 368, 266–269. [Google Scholar] [CrossRef]
- Hura, T.; Dziurka, M.; Hura, K.; Ostrowska, A.; Dziurka, K. Different allocation of carbohydrates and phenolics in dehydrated leaves of triticale. J. Plant Physiol. 2016, 202, 1–9. [Google Scholar] [CrossRef]
- Basu, S.; Ramegowda, V.; Kumar, A.; Pereira, A. Plant adaptation to drought stress. F1000Research 2016, 5, 1554. [Google Scholar] [CrossRef] [PubMed]
- FAOSTAT. Data/QCL. Available online: https://www.fao.org/faostat/en/ (accessed on 25 January 2025).
- Badr, A.; El-Shazly, H.H.; Tarawneh, R.A.; Börner, A. Screening for drought tolerance in maize (Zea mays L.) germplasm using germination and seedling traits under simulated drought conditions. Plants 2020, 9, 565. [Google Scholar] [CrossRef]
- Hou, S.; Qin, H.B.; Li, M.; Wang, H.G.; Mu, Z.X. Identification of agronomic traits and drought tolerance at germination stage of 44 local foxtail millet varieties from Shanxi Province. Agric. Res. Arid Areas 2024, 42, 26–32. [Google Scholar] [CrossRef]
- Huang, Y.X.; Liu, X.; Yan, S.J.; Li, N.; Zhang, X.W.; Liu, Z.; Wang, W.P. Evaluation and screening of rice germplasm resources for drought resistance in germination stage. Hybrid Rice 2024, 39, 27–35. [Google Scholar] [CrossRef]
- Li, L.; Shen, B.Y.; Zhang, T.J.; Yang, T.; Liu, R.; Zong, X.X. Evalation and screening of pea (Pisum Sativum) germplasm resources for drought resistance during germination stage. J. Plant Genet. Resour. 2017, 18, 778–785. [Google Scholar] [CrossRef]
- Xie, J.G.; Wang, M.L.; Zhang, Y.F.; Meng, F.F.; Zheng, Y.H.; Li, G.; Sun, X.M.; Fan, X.H.; Yang, Z.Y.; Wang, S.M.; et al. QTL mapping and related gene mining of drought tolerance at germination stage in soybean. Chin. J. Oil Crop Sci. 2025, 1–10. [Google Scholar] [CrossRef]
- Zhao, M.; Yang, S.; Jiang, H.W.; Xie, J.G.; Zhou, R.; Zheng, L.P.; Meng, F.F.; Wang, S.M. Identification and comprehensive evaluation of drought-tolerance soybean germplasm resources at bud stage. Soybean Sci. 2023, 42, 701–709. [Google Scholar]
- Zhao, X.; Liu, Z.; Li, H.; Zhang, Y.; Yu, L.; Qi, X.; Gao, H.; Li, Y.; Qiu, L. Identification of Drought-tolerance genes in the germination stage of soybean. Biology 2022, 11, 1812. [Google Scholar] [CrossRef]
- Long, J.; Dong, M.; Wang, C.; Miao, Y. Effects of drought and salt stress on seed germination and seedling growth of Elymus nutans. PeerJ 2023, 11, e15968. [Google Scholar] [CrossRef]
- Vuksanović, V.; Kovačević, B.; Kebert, M.; Pavlović, L.; Kesić, L.; Čukanović, J.; Orlović, S. In vitro selection of drought-tolerant white poplar clones based on antioxidant activities and osmoprotectant content. Front. Plant Sci. 2023, 14, 1280794. [Google Scholar] [CrossRef]
- Cai, K.; Chen, X.; Han, Z.; Wu, X.; Zhang, S.; Li, Q.; Nazir, M.M.; Zhang, G.; Zeng, F. Screening of worldwide barley collection for drought tolerance: The assessment of various physiological measures as the selection criteria. Front. Plant Sci. 2020, 11, 1159. [Google Scholar] [CrossRef] [PubMed]
- Hou, L.Y.; Chen, Y.H.; Wang, Y.C.; Hong, D.X.; Wang, Y.X.; Chen, Z.; Wu, S.J.; Dong, Y.H. Influence of drought stress duration on quinoa physiological characteristics and drought tolerance evaluation at seedling stage. J. Nucl. Agric. Sci. 2024, 38, 2237–2246. [Google Scholar]
- Wang, L.; Deng, J.; Zhang, Z.; Zhao, M.W.; Che, X.Y.; Wang, G.Y.; Guo, X.; Zhang, H.Y.; He, L.; Weng, J.F.; et al. Identification and evaluation of drought tolerant germplasm resources at seedling stage of maize under PEG stress. Crops 2024, 40, 43–53. Available online: http://zwzz.chinacrops.org/CN/10.16035/j.issn.1001-7283.2024.04.006 (accessed on 20 April 2025).
- Yang, D.D.; Han, X.; Kong, X.X.; Zhao, P.F.; Jin, J.M.; Zhao, G.X.; Su, Y.Z.; Zhao, G.J. Identification and screening of drought tolerance in 76 winter wheat varieties (lines) during seedling stage. China Seed Ind. 2024, 77–81. [Google Scholar] [CrossRef]
- Mohi-Ud-Din, M.; Hossain, M.A.; Rohman, M.M.; Uddin, M.N.; Haque, M.S.; Ahmed, J.U.; Hossain, A.; Hassan, M.M.; Mostofa, M.G. Multivariate analysis of morpho-physiological traits reveals differential drought tolerance potential of bread wheat genotypes at the seedling stage. Plants 2021, 10, 879. [Google Scholar] [CrossRef]
- Rida, S.; Maafi, O.; López-Malvar, A.; Revilla, P.; Riache, M.; Djemel, A. Genetics of germination and seedling traits under drought stress in a MAGIC population of maize. Plants 2021, 10, 1786. [Google Scholar] [CrossRef]
- Tan, W.; Li, W.; Li, J.; Liu, D.; Xing, W. Drought resistance evaluation of sugar beet germplasms by response of phenotypic indicators. Plant Signal Behav. 2023, 18, 2192570. [Google Scholar] [CrossRef]
- Chen, M.; Chen, L.; Li, S.J.; Xie, H.H.; Song, Y. Effects of drought stress on physiological characteristics and stomatal morphology of different cassava seedlings. J. Sichuan Agric. Univ. 2024, 42, 1049–1056+1084. [Google Scholar] [CrossRef]
- He, Y.P.; Yin, L.J.; Ding, X.L.; Wang, C.X.; Hou, Y.J.; Ma, Y.H.; Yu, R.; Yue, Z.; Yang, J.Q.; Zhang, X.; et al. Identification and screening of drought resistance indexes of 25 watermelon germplasms at seedling stage. J. Northwest A F Univ. Nat. Sci. Ed. 2023, 51, 49–59. [Google Scholar] [CrossRef]
- Liu, F.; Zhao, Y.; Wang, X.; Wang, B.; Xiao, F.; He, K. Physiological response and drought resistance evaluation of Gleditsia sinensis seedlings under drought-rehydration state. Sci. Rep. 2023, 13, 19963. [Google Scholar] [CrossRef]
- Xu, A.Y.; Cao, B.; Xie, Y. Physiological-ecological responses of twelve herbaceous plant species under drought stress and evaluation of their drought resistance when planted in coal producting basis in arid windy and sandy areas. Acta Prataculturae Sinica 2020, 29, 22–34. [Google Scholar] [CrossRef]
- Wang, J.; Zhang, X.; Han, Z.; Feng, H.; Wang, Y.; Kang, J.; Han, X.; Wang, L.; Wang, C.; Li, H.; et al. Analysis of physiological indicators associated with drought tolerance in wheat under drought and re-watering conditions. Antioxidants 2022, 11, 2266. [Google Scholar] [CrossRef] [PubMed]
- Zhao, L.; Jin, H.D.; Cao, X.Y.; Deng, W.H.; Du, L.J. Physiological response to drought stress and drought resistance of six Helleborus orientlis cultivars. Chin. J. Appl. Ecol. 2023, 34, 2644–2654. [Google Scholar] [CrossRef]
- Zhou, Y.X.; Li, P.T.; Su, J.S.; Wang, H.B.; Fang, W.M.; Chen, F.D.; Zhang, F. Evaluation of drought resistance in 37 accessions of chrysanthemum related species. J. Nanjing Agric. Univ. 2023, 46, 1060–1068. [Google Scholar] [CrossRef]
- Ahmed, S.F.; Ahmed, J.U.; Hasan, M.; Mohi-Ud-Din, M. Assessment of genetic variation among wheat genotypes for drought tolerance utilizing microsatellite markers and morpho-physiological characteristics. Heliyon 2023, 9, e21629. [Google Scholar] [CrossRef] [PubMed]
- Bao, X.; Hou, X.; Duan, W.; Yin, B.; Ren, J.; Wang, Y.; Liu, X.; Gu, L.; Zhen, W. Screening and evaluation of drought resistance traits of winter wheat in the North China Plain. Front. Plant Sci. 2023, 14, 1194759. [Google Scholar] [CrossRef]
- Martínez, I.; Muñoz, M.; Acuña, I.; Uribe, M. Evaluating the drought tolerance of seven potato varieties on volcanic ash soils in a medium-term trial. Front. Plant Sci. 2021, 12, 693060. [Google Scholar] [CrossRef]
- Shojaei, S.H.; Mostafavi, K.; Omrani, A.; Illés, Á.; Bojtor, C.; Omrani, S.; Mousavi, S.M.N.; Nagy, J. Comparison of maize genotypes using drought-tolerance indices and graphical analysis under normal and humidity stress conditions. Plants 2022, 11, 942. [Google Scholar] [CrossRef]
- Sun, F.; Chen, Q.; Chen, Q.; Jiang, M.; Gao, W.; Qu, Y. Screening of key drought tolerance indices for cotton at the flowering and boll setting stage using the dimension reduction method. Front. Plant Sci. 2021, 12, 619926. [Google Scholar] [CrossRef]
- Tiwari, P.N.; Tiwari, S.; Sapre, S.; Tripathi, N.; Payasi, D.K.; Singh, M.; Thakur, S.; Sharma, M.; Tiwari, S.; Tripathi, M.K. Prioritization of physio-biochemical selection indices and yield-attributing traits toward the acquisition of drought tolerance in chickpea (Cicer arietinum L.). Plants 2023, 12, 3175. [Google Scholar] [CrossRef]
- Yang, J.; Han, D.X.; Wang, Y.J.; Li, M.D.; Xi, H.J.; Abulati, A.; Liang, X.L. Drought Tolerance Identification and Evaluation of 26 Maize Inbred Lines under Natural Drought Condition in Xinjiang. Xinjiang Agric. Sci. 2019, 56, 1388–1396. [Google Scholar]
- Zhou, Y.Q.; Yang, Y.Z.; Zhou, W.Q.; Lian, X.R.; Zhang, Y.J.; Wang, X.R.; Kou, S.R.; He, H.J.; Liu, Z.X.; Wang, X.J. Evaluation and selection of drought resistance inbred lines of maize under drought stress. Agric. Res. Arid Areas 2020, 38, 211–217. [Google Scholar] [CrossRef]
- Zhao, X.Z.; Xu, J.Y.; Yu, L.L.; Gu, Y.Z.; Liu, W.X.; Qiu, L.J. Field drought tolerance evaluation and excellent germplasm identification of soybean germplasm. Soybean Sci. 2020, 39, 825–832. [Google Scholar] [CrossRef]
- Mahmood, T.; Iqbal, M.S.; Li, H.; Nazir, M.F.; Khalid, S.; Sarfraz, Z.; Hu, D.; Baojun, C.; Geng, X.; Tajo, S.M.; et al. Differential seedling growth and tolerance indices reflect drought tolerance in cotton. BMC Plant Biol. 2022, 22, 331. [Google Scholar] [CrossRef] [PubMed]
- Guo, C.; Zhu, L.; Sun, H.; Han, Q.; Wang, S.; Zhu, J.; Zhang, Y.; Zhang, K.; Bai, Z.; Li, A.; et al. Evaluation of drought-tolerant varieties based on root system architecture in cotton (Gossypium hirsutum L.). BMC Plant Biol. 2024, 24, 127. [Google Scholar] [CrossRef]
- Xiong, S.; Wang, Y.; Chen, Y.; Gao, M.; Zhao, Y.; Wu, L. Effects of drought stress and rehydration on physiological and biochemical properties of four oak species in China. Plants 2022, 11, 679. [Google Scholar] [CrossRef]
- Islam, M.J.; Kim, J.W.; Begum, M.K.; Sohel, M.A.T.; Lim, Y.S. Physiological and biochemical changes in sugar beet seedlings to confer stress adaptability under drought condition. Plants 2020, 9, 1511. [Google Scholar] [CrossRef]
- Wang, X.D. Evaluation of growth, physiological response, and drought resistance of different flue-cured tobacco varieties under drought stress. Front. Plant Sci. 2024, 15, 1442618. [Google Scholar] [CrossRef]
- Zhang, J.; Huang, D.; Zhao, X.; Zhang, M. Evaluation of drought resistance and transcriptome analysis for the identification of drought-responsive genes in Iris germanica. Sci. Rep. 2021, 11, 16308. [Google Scholar] [CrossRef]
- Li, J.; Abbas, K.; Wang, L.; Gong, B.; Hou, S.; Wang, W.; Dai, B.; Xia, H.; Wu, X.; Lü, G.; et al. Drought resistance index screening and evaluation of lettuce under water deficit conditions on the basis of morphological and physiological differences. Front. Plant Sci. 2023, 14, 1228084. [Google Scholar] [CrossRef]


| Germplasm | DI | Germplasm | DI |
|---|---|---|---|
| LK13 | 2.83 | JR3 | 3.65 |
| 21F05 | 3.18 | 14X1 | 2.21 |
| 16F02 | 2.86 | 14X4 | 1.68 |
| JH1 | 2.95 | 14X5 | 1.95 |
| JLR | 3.19 | 14X6 | 1.54 |
| 16C07 | 3.20 | 14X7 | 3.45 |
| HXF1 | 3.14 |
| Traits | Drought Stress Index | PPI | ||||
|---|---|---|---|---|---|---|
| Min | Max | AVE | SE | CV | ||
| DRW | 0.712 | 0.897 | 0.807 | 0.069 | 8.503 | 0.206 |
| FRW | 0.521 | 0.868 | 0.688 | 0.135 | 19.603 | 0.400 |
| DSW | 0.589 | 0.867 | 0.736 | 0.113 | 15.333 | 0.320 |
| FSW | 0.523 | 0.786 | 0.643 | 0.090 | 14.030 | 0.334 |
| RL | 0.315 | 0.943 | 0.632 | 0.195 | 30.880 | 0.666 |
| RD | 0.729 | 1.323 | 1.009 | 0.146 | 14.471 | 0.449 |
| RS | 0.288 | 0.819 | 0.559 | 0.161 | 28.783 | 0.648 |
| RV | 0.224 | 0.726 | 0.497 | 0.145 | 29.240 | 0.691 |
| RT | 0.221 | 1.045 | 0.630 | 0.243 | 38.586 | 0.788 |
| RF | 0.250 | 1.752 | 0.739 | 0.374 | 50.613 | 0.857 |
| RWC | 0.670 | 1.015 | 0.907 | 0.097 | 10.693 | 0.340 |
| Chl-a | 0.691 | 1.712 | 0.944 | 0.263 | 27.854 | 0.597 |
| Chl-b | 0.598 | 2.786 | 1.041 | 0.552 | 53.053 | 0.786 |
| Car | 0.793 | 1.566 | 1.016 | 0.198 | 19.481 | 0.493 |
| TPC | 0.689 | 1.921 | 0.979 | 0.311 | 31.729 | 0.641 |
| SS | 0.934 | 1.196 | 1.056 | 0.074 | 6.979 | 0.219 |
| SP | 1.035 | 2.224 | 1.297 | 0.313 | 24.105 | 0.534 |
| Pro | 1.043 | 8.649 | 2.219 | 2.017 | 90.911 | 0.879 |
| St | 0.916 | 10.033 | 2.001 | 2.434 | 121.634 | 0.909 |
| MDA | 1.011 | 1.943 | 1.440 | 0.315 | 21.853 | 0.479 |
| REC | 1.055 | 1.553 | 1.304 | 0.135 | 10.329 | 0.321 |
| SOD | 0.538 | 1.057 | 0.821 | 0.174 | 21.177 | 0.491 |
| POD | 0.710 | 3.204 | 1.379 | 0.752 | 54.520 | 0.778 |
| CAT | 0.448 | 2.876 | 1.176 | 0.692 | 58.828 | 0.844 |
| H2O2 | 0.954 | 1.708 | 1.256 | 0.238 | 18.976 | 0.441 |
| O2− | 0.929 | 1.956 | 1.378 | 0.324 | 23.548 | 0.525 |
| DI | 1.542 | 3.650 | 2.757 | 0.685 | 24.838 | 0.578 |
| Evaluation Traits | PC1 | PC2 | PC3 | PC4 | PC5 | |||||
|---|---|---|---|---|---|---|---|---|---|---|
| Load Capacity | Weight | Load Capacity | Weight | Load Capacity | Weight | Load Capacity | Weight | Load Capacity | Weight | |
| DRW | 0.686 | 0.075 | 0.092 | 0.014 | −0.217 | −0.062 | 0.446 | 0.19 | −0.394 | −0.21 |
| FRW | 0.72 | 0.079 | 0.489 | 0.072 | −0.147 | −0.042 | −0.276 | −0.118 | 0.064 | 0.034 |
| DSW | 0.767 | 0.084 | 0.271 | 0.04 | −0.24 | −0.068 | 0.214 | 0.091 | −0.219 | −0.117 |
| FSW | 0.708 | 0.077 | 0.128 | 0.019 | −0.226 | −0.064 | 0.169 | 0.072 | −0.401 | −0.214 |
| RL | 0.115 | 0.013 | 0.952 | 0.14 | 0.235 | 0.067 | 0.015 | 0.007 | −0.005 | −0.003 |
| RD | 0.368 | 0.04 | −0.626 | −0.092 | −0.055 | −0.016 | −0.416 | −0.178 | 0.086 | 0.046 |
| RS | 0.151 | 0.016 | 0.961 | 0.142 | 0.134 | 0.038 | −0.052 | −0.022 | 0.074 | 0.039 |
| RV | 0.219 | 0.024 | 0.922 | 0.136 | 0.014 | 0.004 | −0.138 | −0.059 | 0.111 | 0.059 |
| RT | −0.073 | −0.008 | 0.934 | 0.138 | 0.157 | 0.044 | 0.135 | 0.058 | −0.153 | −0.081 |
| RF | 0.409 | 0.045 | 0.768 | 0.113 | 0.4 | 0.113 | 0.066 | 0.028 | 0.251 | 0.134 |
| RWC | −0.549 | −0.06 | 0.088 | 0.013 | −0.529 | −0.15 | −0.12 | −0.051 | −0.427 | −0.227 |
| Chla | 0.788 | 0.086 | −0.541 | −0.08 | 0.168 | 0.048 | 0.096 | 0.041 | 0.124 | 0.066 |
| Chlb | 0.811 | 0.089 | −0.501 | −0.074 | 0.13 | 0.037 | 0.013 | 0.005 | 0.049 | 0.026 |
| Car | 0.71 | 0.078 | −0.647 | −0.095 | 0.239 | 0.068 | 0.065 | 0.028 | 0.063 | 0.033 |
| TPC | 0.797 | 0.087 | −0.545 | −0.08 | 0.164 | 0.047 | 0.063 | 0.027 | 0.089 | 0.047 |
| SS | 0.662 | 0.072 | 0.111 | 0.016 | 0.553 | 0.157 | 0.027 | 0.011 | 0.001 | 0 |
| SP | 0.286 | 0.031 | −0.018 | −0.003 | −0.705 | −0.2 | −0.336 | −0.143 | 0.391 | 0.208 |
| Pro | 0.862 | 0.094 | −0.376 | −0.055 | −0.095 | −0.027 | −0.074 | −0.031 | −0.068 | −0.036 |
| St | 0.411 | 0.045 | 0.315 | 0.046 | 0.559 | 0.158 | 0.158 | 0.067 | 0.509 | 0.271 |
| MDA | −0.763 | −0.083 | −0.169 | −0.025 | 0.139 | 0.039 | −0.119 | −0.051 | 0.443 | 0.236 |
| REC | −0.5 | −0.055 | −0.441 | −0.065 | 0.632 | 0.179 | −0.162 | −0.069 | −0.16 | −0.085 |
| SOD | −0.524 | −0.057 | −0.025 | −0.004 | −0.409 | −0.116 | 0.344 | 0.147 | 0.505 | 0.269 |
| POD | −0.309 | −0.034 | −0.035 | −0.005 | −0.304 | −0.086 | 0.847 | 0.361 | −0.048 | −0.026 |
| CAT | 0.048 | 0.005 | 0.201 | 0.03 | −0.673 | −0.191 | −0.472 | −0.201 | 0.096 | 0.051 |
| H2O2 | −0.631 | −0.069 | −0.298 | −0.044 | 0.201 | 0.057 | 0.526 | 0.224 | 0.055 | 0.029 |
| O2− | −0.349 | −0.038 | 0.036 | 0.005 | 0.549 | 0.156 | −0.468 | −0.2 | −0.514 | −0.274 |
| DI | −0.898 | −0.098 | −0.173 | −0.026 | 0.289 | 0.082 | −0.08 | −0.034 | −0.116 | −0.062 |
| Eigen values | 9.153 | 6.779 | 3.528 | 2.344 | 1.879 | |||||
| Variance contribution (%) | 33.900 | 25.108 | 13.067 | 8.681 | 6.959 | |||||
| Cumulative variance contribution (%) | 87.715 | |||||||||
| Germplasm | U(X1) | U(X2) | U(X3) | U(X4) | U(X5) | D-Value | Tolerance Rank |
|---|---|---|---|---|---|---|---|
| LK13 | 0.26 | 0.74 | 0.40 | 1.00 | −0.10 | 0.46 | 6 |
| 21F05 | 0.06 | 0.35 | 0.54 | 0.61 | 1.22 | 0.36 | 8 |
| 16F02 | 0.31 | 0.35 | 0.45 | 0.48 | −0.16 | 0.32 | 12 |
| JH1 | 0.10 | 0.33 | 0.56 | 0.55 | 0.97 | 0.35 | 9 |
| JLR | 0.26 | 0.75 | 0.75 | 0.12 | −0.38 | 0.41 | 7 |
| 16C07 | 0.22 | 0.46 | 0.66 | 0.26 | −2.29 | 0.16 | 13 |
| HXF1 | 0.19 | 1.00 | 0.66 | 0.00 | 0.29 | 0.48 | 5 |
| JR3 | 0.00 | 0.43 | 0.78 | 0.15 | 0.92 | 0.33 | 11 |
| 14X1 | 0.32 | 0.74 | 0.00 | 0.08 | 2.43 | 0.54 | 2 |
| 14X4 | 0.53 | 0.88 | 0.31 | 0.29 | −0.44 | 0.50 | 4 |
| 14X5 | 0.67 | 0.94 | 1.00 | 0.57 | 2.72 | 0.95 | 1 |
| 14X6 | 1.00 | 0.00 | 0.56 | 0.23 | 0.14 | 0.50 | 3 |
| 14X7 | 0.11 | 0.05 | 0.61 | 0.16 | 2.11 | 0.33 | 10 |
| Name | Fruit Shape | Peel Covering Type | Flesh Color | Seed Morphology | Type | Abbreviation |
|---|---|---|---|---|---|---|
| Long Ke 13 | Ellipse | Green peel | Red | Brown small seed | Big fruit size | LK13 |
| 2021F05 | Roundness | Green peel | Pink | dark brown middle seed | Small fruit type | 21F05 |
| 2016F02 | Roundness | Green peel | Red | dark brown middle seed | Small fruit type | 16F02 |
| Jin Hua 1 | Ellipse | Green peel | Red | Brown small seed | Big fruit size | JH1 |
| Jiao Li Ren | Roundness | Green peel | Yellow | Black small seed | Small fruit type | JLR |
| 2016C07 | Roundness | Green peel | Red | Black small seed | Small fruit type | 16C07 |
| Hua Xin F1 | Roundness | Green peel | Pink | Black small seed | Small fruit type | HXF1 |
| JR3 | Roundness | Black peel | Yellow | Black middle seed | Seed watermelon | JR3 |
| 2014X1 | Roundness | Green peel | Faint yellow | Red middle seed | Wild watermelon | 14X1 |
| 2014X4 | Roundness | Green peel | Faint yellow | Yellow medium seed | Wild watermelon | 14X4 |
| 2014X5 | Roundness | Green peel | White | White medium seed | Wild watermelon | 14X5 |
| 2014X6 | Roundness | Green peel | White | Yellow medium seed | Wild watermelon | 14X6 |
| 2014X7 | Roundness | Walnut peel | White | Yellow big seed | Wild watermelon | 14X7 |
Disclaimer/Publisher’s Note: The statements, opinions and data contained in all publications are solely those of the individual author(s) and contributor(s) and not of MDPI and/or the editor(s). MDPI and/or the editor(s) disclaim responsibility for any injury to people or property resulting from any ideas, methods, instructions or products referred to in the content. |
© 2025 by the authors. Licensee MDPI, Basel, Switzerland. This article is an open access article distributed under the terms and conditions of the Creative Commons Attribution (CC BY) license (https://creativecommons.org/licenses/by/4.0/).
Share and Cite
Ren, K.; Tang, T.; Kong, W.; Su, Y.; Wang, Y.; Cheng, H.; Yang, Y.; Zhao, X. Response of Watermelon to Drought Stress and Its Drought-Resistance Evaluation. Plants 2025, 14, 1289. https://doi.org/10.3390/plants14091289
Ren K, Tang T, Kong W, Su Y, Wang Y, Cheng H, Yang Y, Zhao X. Response of Watermelon to Drought Stress and Its Drought-Resistance Evaluation. Plants. 2025; 14(9):1289. https://doi.org/10.3390/plants14091289
Chicago/Turabian StyleRen, Kaili, Taoxia Tang, Weiping Kong, Yongquan Su, Yuping Wang, Hong Cheng, Yonggang Yang, and Xiaoqin Zhao. 2025. "Response of Watermelon to Drought Stress and Its Drought-Resistance Evaluation" Plants 14, no. 9: 1289. https://doi.org/10.3390/plants14091289
APA StyleRen, K., Tang, T., Kong, W., Su, Y., Wang, Y., Cheng, H., Yang, Y., & Zhao, X. (2025). Response of Watermelon to Drought Stress and Its Drought-Resistance Evaluation. Plants, 14(9), 1289. https://doi.org/10.3390/plants14091289