Article

The Effect of Abiotic Stress Conditions on Expression of Calmodulin (CaM) and Calmodulin-Like (CML) Genes in Wild-Growing Grapevine Vitis amurensis

by
Alexandra S. Dubrovina
1,*,
Olga A. Aleynova
1,
Zlata V. Ogneva
1,
Andrey R. Suprun
1,2,
Alexey A. Ananev
1,2 and
Konstantin V. Kiselev
1,2
1
Laboratory of Biotechnology, Federal Scientific Center of the East Asia Terrestrial Biodiversity, Far Eastern Branch of the Russian Academy of Sciences, 690022 Vladivostok, Russia
2
Department of Biodiversity, The School of Natural Sciences, Far Eastern Federal University, 690090 Vladivostok, Russia
*
Author to whom correspondence should be addressed.
Plants 2019, 8(12), 602; https://doi.org/10.3390/plants8120602
Submission received: 25 November 2019 / Revised: 7 December 2019 / Accepted: 10 December 2019 / Published: 13 December 2019

Abstract

:
Plant calmodulins (CaMs) and calmodulin-like proteins (CMLs) are important plant Ca2+-binding proteins that sense and decode changes in the intracellular Ca2+ concentration arising in response to environmental stimuli. Protein Ca2+ sensors are presented by complex gene families in plants and perform diverse biological functions. In this study, we cloned, sequenced, and characterized three CaM and 54 CML mRNA transcripts of Vitis amurensis Rupr., a wild-growing grapevine with a remarkable stress tolerance. Using real-time quantitative RT-PCR, we analyzed transcript abundance of the identified VaCaMs and VaCMLs in response to water deficit, high salinity, high mannitol, cold and heat stresses. Expression of VaCaMs and 32 VaCMLs actively responded to the abiotic stresses and exhibited both positive and negative regulation patterns. Other VaCML members showed slight transcriptional regulation, remained essentially unresponsive or responded only after one time interval of the treatments. The substantial alterations in the VaCaM and VaCML transcript levels revealed their involvement in the adaptation of wild-growing grapevine to environmental stresses.

Graphical Abstract

1. Introduction

Plants, as sessile organisms, have to develop multiple biochemical and physiological reactions in order to adapt to the constantly changing environmental conditions. Different abiotic stress stimuli, including unfavorable temperatures, drought, flooding, or soil salinity, affect plant growth and productivity. These and other abiotic stresses evoke spatially and temporally distinct alterations in the intracellular Ca2+ concentrations, i.e., “Ca2+ signatures”, which are perceived and decoded by Ca2+ binding proteins referred to as Ca2+ sensors [1,2]. The majority of Ca2+ sensor proteins contain several EF-hand motifs, conserved helix-loop-helix structures, in which the Ca2+ ions are coordinated within the acidic Ca2+-coordinating loop [3]. Furthermore, recent studies indicated that Ca2+ signals are implicated in the signal transmission at long distances or even at the organismic level [4,5]. The major plant EF-hand-containing Ca2+-binding proteins are divided into calmodulins (CaMs), calmodulin-like proteins (CML), Ca2+-dependent protein kinases (CDPKs), and calcineurin B-like proteins (CBLs) [1,6,7].
CaM is a functionally important and highly conserved Ca2+ sensor present in all eukaryotic organisms, while CMLs are Ca2+ sensors closely related to CaMs but present only in higher plants [8,9]. CaMs are small proteins containing four EF-hands; CMLs greatly vary in their length and EF-hand number containing from one to six EF-hand motifs. Plant CaMs and CMLs do not exhibit catalytic activity and act as sensor relays that transmit the information encoded by the Ca2+ signatures to downstream events, such as protein interaction, protein phosphorylation, metabolic changes, or gene regulation [8,10].
Plant CaMs and CMLs are known to function in plant developmental processes and in response to both biotic and abiotic stresses [2,11,12,13]. It is known that gene expression levels of plant CaMs and CMLs are regulated by a variety of abiotic stress stimuli, e.g., in tea, apple and soybean in response to cold, drought, flooding, or high salinity [14,15,16]. Transgenic plants overexpressing certain stress-responsive CaMs and CMLs showed greater tolerance to the respective or even multiple abiotic stress treatments [17,18,19,20] or, in turn, were rendered more sensitive to the applied abiotic stresses [21]. There is also evidence that some plant CaMs and CMLs interact with the protein targets that are known to regulate abiotic stress adaptation either positively or negatively [22,23,24].
A recent study has identified and characterized CaM and CML gene families in cultured grapevine Vitis vinifera L. based on the genome sequencing data and publicly available expression profiling datasets [25]. The purpose of the present study was to identify the CaM and CML genes actively expressed in wild-growing grape Vitis amurensis Rupr. in response to various abiotic stress stimuli and analyze their expression under these stress conditions. Wild-growing relatives of cultured plant species often exhibit higher tolerance to abiotic stresses, and genes of wild plant species represent an important source for improving abiotic stress tolerance of cultivated counterparts.

2. Results

2.1. Isolation, Molecular Cloning, and Sequencing of VaCaM and VaCML Transcripts

To clone and sequence the full-length coding sequences of CaMs and CMLs of V. amurensis, we designed specific primers to the 5′ and 3′ ends of the highly homologous CaMs and CMLs of V. vinifera (Table 1; Table S1). V. vinifera is a close species to V. amurensis, and its genome was sequenced [26,27]. To design the specific primers, we retrieved the predicted CaMs and CMLs of V. vinifera PN20024 genotype (V2 proteome prediction) present in the Grapevine Genome Centro Di Ricerca Interdipartimentale Per Le Biotecnologie Innovative (CRIBI) Biotech Centre database using the CaM and CML protein sequences of A. thaliana downloaded from the Arabidopsis Information Resource (TAIR) database as queries as described [25]. In addition, we downloaded all CaM and CML protein sequences of V. vinifera predicted by an automated computational analysis and deposited to the National Centre for Biotechnology Information (NCBI) GenBank. After the removal of all duplicate sequences and sequences containing functional domains other than EF-hands, we obtained a total of three VviCaMs and 68 VviCMLs.
We compared our results with the computational analysis of CaMs and CMLs of V. vinifera published by Vandelle et al. [25]. In addition to the three VviCaMs and 62 VviCMLs described previously for V. vinifera, our analysis of the V. vinifera CaMs and CMLs sequences available at the CRIBI and NCBI databases identified seven additional VviCMLs, including VviCML48, VviCML105, VviCML106, VviCML107, VviCML108, VviCML109, and VviCML110 (Table 1; Figure 1). The seven newly identified VviCMLs were named according to the procedure described by Vandelle et al. [25] following the instructions of the international Super-Nomenclature Committee for Grape Gene Annotation [28]. The deduced amino acid sequences of the newly identified VviCMLs did not contain functional domains other than EF-hands (Table 1). We also noted that nucleotide sequences of the previously identified VviCML90 and VviCML91 shared 100% identity with each other at the nucleotide level, and they should be treated as one VviCML.
Using RT-PCRs with the primers designed to the three VviCaMs and 68 VviCMLs (Table S1), we cloned and sequenced cDNAs containing full-length coding DNA sequences (CDS) of CaM and CML transcript variants from wild grape V. amurensis using RNA isolated from unstressed leaves and stems of V. amurensis. The analysis identified three VaCaMs and 54 VaCMLs expressed in the cuttings of V. amurensis. Table 1 shows a comparison of the cloned and sequenced VaCaMs and VaCMLs with those identified for V. vinifera. The deduced amino acid sequences of the cloned and sequenced VaCaMs and VaCMLs shared high identities (95–100%) with the homologous CaMs and CMLs of V. vinifera predicted by the automated computational analysis (Table 1).
A phylogenetic analysis was performed on the full-length amino acid sequences of the CaMs and CMLs from V. vinifera, V. amurensis, and A. thaliana (Figure 1). The proteins were categorized into nine subgroups based on sequence similarities and relationships of CaMs and CMLs of the analyzed plant species and taking into attention the described classification for V. vinifera proteins [25]. The deduced amino acid sequences of the newly identified VviCMLs clustered into the subgroup 2 (VviCML107, VviCML108), subgroup 4 (VviCML105, VviCML109), subgroup 6 (VviCML106, VviCML110), and subgroup 7 (VviCML48). The newly identified VviCMLs possessed from two to four putative EF-hand motifs (Table 1).
The identified three VaCaMs and 54 VaCMLs shared a common structure with other plant and V. vinifera CaMs and CMLs and possessed from one to five putative EF-hand motifs, except for VaCML71. The deduced amino acid sequence of VaCML71 did not contain any putative EF-hand motifs due to the presence of a premature stop codon after a 141 bp insertion, which resembled intron retention due to the presence of canonical 5′ and 3′ splice sites. Notably, the VaCML86 transcript contained a 210-bp insertion (no frameshift) and contained a higher number of putative EF-hands in comparison with the homologous VviCML86. Most of the VaCMLs were predicted to be myristoylated or palmitoylated proteins (Table 1), which indicates possible protein-membrane interactions of these CMLs.

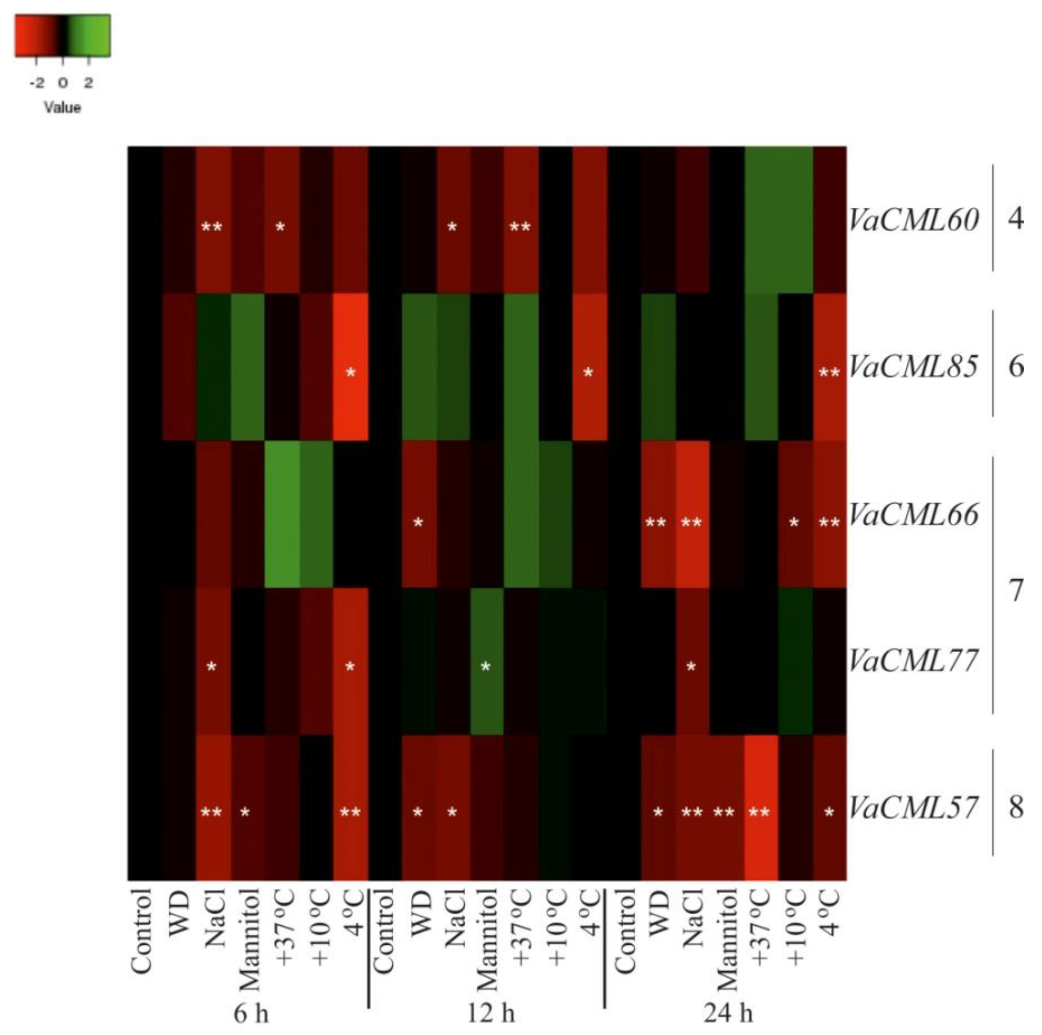
2.2. Expression of VaCaMs and VaCMLs in Response to Abiotic Stress Conditions

To test the involvement of VaCaM and VaCML genes in the responses of V. amurensis to the water deficit, high salt, high mannitol, cold, and heat abiotic stress conditions, we used the V. amurensis cuttings (excised young stems with one healthy leaf) for the control non-stress and abiotic stress treatments. Total RNA was isolated from the leaves of the treated cuttings of V. amurensis 6 h, 12 h, and 24 h post-treatments. The V. amurensis cuttings were placed in filtered water at +25 °C (non-stress treatment), on a paper towel at +25 °C (desiccation or water deficit stress), in 0.4 M NaCl at +25 °C (high salt stress) and 0.4 M mannitol at +25 °C (high mannitol stress). To apply cold and heat temperature stress, the cuttings were incubated in filtered water in a growth chamber at +4 °C, +10 °C, and +37 °C. We used a similar experimental design and chemical concentrations as in Chung et al. [30] and Dubrovina et al. [33] for studying CDPK gene expression in Capsicum annuum and V. amurensis, respectively. Then, we applied qRT-PCR for the analysis of VaCaM and VaCML gene expression.
The qRT-PCR data revealed that VaCaM8 transcript levels considerably increased under the high salt stress conditions in 1.4–1.8 times at all time intervals post-treatment (Figure 2 and Figure S1). Also, the VaCaM8 expression was affected under +37 °C, high mannitol, and +4 °C stress conditions but only at one time interval. The VaCaM9 gene was responsive to low temperature stress (+10 °C), with considerable increases in transcript levels detected after 6 h and 24 h of treatment (Figure 2 and Figure S1). However, incubation at +4 °C did not cause such elevation to the VaCaM9 expression. Transcript levels of VaCaM9 also responded to mannitol and heat but at one time interval after being exposed to the stresses (Figure 2 and Figure S1). The VaCaM10 gene responded to the abiotic stresses more actively than VaCaM8 and VaCaM9, but the detected alterations were considerable only after 6 h of treatments (Figure 2 and Figure S1).
Then, we analyzed transcript levels of the 54 identified VaCMLs in response to desiccation, high salt, high mannitol, cold, and heat stresses (Figure 3, Figure 4, Figure 5 and Figures S1–S6). The VaCMLs were divided into four groups based on their responsiveness to the abiotic stresses:
(1)
Thirteen VaCML genes were significantly up-regulated at a minimum of two time intervals after one or several abiotic stress treatments (Figure 3 and Figure S2);
(2)
Five VaCML genes were significantly down-regulated at a minimum of two time intervals after one or several abiotic stress treatments (Figure 4 and Figure S3);
(3)
Fourteen VaCML genes were differentially regulated displaying both up- and down-regulation at a minimum of two time intervals post-treatment (Figure 5 and Figure S4);
(4)
Expression levels of 22 VaCML genes showed slight effects or occasional regulation mainly at one time interval (Figure S5) or were not essentially changed (Figure S6).
Notably, expression levels of VaCML95, VaCML96, VaCML100, VaCML103, and VaCML104 (Figure S5; Table S2) were analyzed together using one primer pair due to a high identity among the corresponding nucleotide sequences.
Water deficit was one of the strongest stimuli for induction of VaCML expression with a marked elevation in 1.8–13.1 times in transcript levels of nine genes (VaCML62, VaCML72, VaCML79, VaCML83, VaCML92, VaCML93, VaCML105, VaCML106, and VaCML110) detected after 12 h and 24 h of treatment (Figure 3, Figure 5, Figures S2 and S4). In addition, incubation under water deficit resulted in a progressive and considerable down-regulation in 1.7–3.1 times of three CMLs, including VaCML57, VaCML66, and VaCML88, which was detected after two periods of treatment (Figure 4, Figure 5, Figures S3 and S4).
Similar to the effect of water deficit, high salt stress considerably affected VaCML expression with both up- and down-regulation. Transcript levels of VaCML44, VaCML61, VaCML78, VaCML82, VaCML86, and VaCML92 were significantly induced in 2.1–15 times at a minimum of two time intervals (Figure 3, Figure 5, Figures S2 and S4), while the transcript abundance of VaCML57, VaCML60, VaCML77, and VaCML89 was progressively suppressed in 1.8–2.8 times at a minimum of two time intervals (Figure 4, Figure 5, Figures S3 and S4). Notably, the VaCML44, VaCML61, and VaCML57 genes progressively and remarkably responded after 6 h, 12 h and 24 h of high salt exposure (Figure 3, Figure 4, Figures S2 and S3).
High mannitol stress had a weaker effect on VaCML gene expression in comparison with other abiotic stress treatments. We detected a considerable activation of only three CMLs (VaCML79, VaCML92, and VaCML105) in 1.9–5.9 times after two time periods of the high mannitol treatment (Figure 5 and Figure S4). As for negative regulation, only VaCML57 gene was progressively down-regulated under high mannitol conditions (Figure 4 and Figure S3). Other VaCML genes responded with considerable changes only at one time interval post-treatment or remained unresponsive to the high mannitol treatment (Figure 3, Figure 4, Figure 5 and Figures S2–S4).
Heat and cold stress conditions markedly affected VaCML expression. In response to heat stress, expression of VaCML1, VaCML21, VaCML22, VaCML52, VaCML107, and VaCML108 was distinctly modulated in 1.7–5.9 times at two time intervals post-treatment (Figure 3, Figure 5 and Figures S2 and S4), while expression of VaCML60, VaCML79, VaCML88, VaCML89, and VaCML105 was progressively repressed under the high temperature conditions 6 h and 12 h after the treatment in most cases (Figure 4, Figure 5 and Figures S3 and S4). Incubation at lowered temperatures (+4 °C or +10 °C) strongly induced transcript levels of six CML genes (VaCML21, VaCML44, VaCML61, VaCML78, VaCML86, and VaCML89) and suppressed eight CML genes (VaCML9a, VaCML48, VaCML57, VaCML75, VaCML82, VaCML85, VaCML92, and VaCML107) at a minimum of two incubation intervals post-treatment (Figure 3, Figure 4 and Figure 5 and Figures S2–S4). Notably, although these low temperature stresses are similar, expression of only VaCML61, VaCML75, and VaCML89 genes was significantly and progressively affected by both these incubation temperatures at least at two time periods of the cold treatments. Transcript levels of VaCML44 and VaCML92 markedly responded exclusively to the incubation at +10 °C, while transcript levels of VaCML9a, VaCML57, VaCML85, VaCML86, and VaCML107 were affected only at +4 °C (Figure 3, Figure 4, Figure 5 and Figures S2–S4).
The data obtained revealed that the detected changes in transcription levels of 16 CML genes were not consistent and exhibited rather slight effects (VaCML9b, VaCML41b, VaCML54, VaCML65, VaCML71, VaCML73, VaCML74, VaCML76, and VaCML90/91), or considerable effects were observed only 24 h after stress application (VaCML41a, VaCML81, VaCML95, VaCML96, VaCML100, VaCML103, and VaCML104) (Figure S5). Expression of six CML genes (VaCML51, VaCML53, VaCML80, VaCML87, VaCML94, VaCML109) remained unresponsive to the abiotic stress treatments (Figure S6). We also noted that some genes originating from the same subgroup of the phylogenetic tree (Figure 1) showed similar expression pattern under the abiotic stress treatments. For example, VaCML9a, VaCML79, VaCML107 (subgroup 2); VaCML92, VaCML93, VaCML105, VaCML110 (subgroup 4); VaCML83, VaCML84, VaCML89, VaCML106 (subgroup 6), VaCML48, and VaCML82 (subgroup 7) (Figure 3, Figure 5, Figures S2 and S4).

3. Discussion

Wild grape V. amurensis is known to exhibit a high resistance to abiotic stresses, especially to cold stress [34]. Therefore, it would be interesting to investigate transcriptional responses of V. amurensis genes to various abiotic stimuli. After completion of sequencing and annotation of various plant genomes, the presence of CaMs and large CML-encoding gene families has emerged as a typical feature of plant genomes. The grapevine genome was not an exception. Recently, based on the analysis of the available grapevine genome sequencing data, Vandelle et al. [25] determined the presence of three CaM and 62 CML genes in the genome of the commonly cultivated grapevine V. vinifera. Using the publicly available gene expression datasets of different organs and tissues of V. vinifera cv. Corvina (clone 48), Vandelle et al. [25] analyzed expression of VviCaMs and VviCMLs in detail in the different grape organs and after application of drought, shade, heat, glucose, ultraviolet-C, and abscisic acid. In our study, we treated the stem cuttings of wild grape V. amurensis with a number of abiotic stress factors, including desiccation, high salinity, high mannitol, heat and cold stresses. The full-length coding sequences of VaCaMs and VaCMLs were cloned and their transcript levels were analyzed by real-time qRT-PCR after 6 h, 12 h, and 24 h of treatments.
We revised the identified CaM and CML genes in the V. vinifera genome [25] and described seven additional VviCMLs increasing the family size to 68 VviCMLs in V. vinifera. Then, we identified the CaM and CML genes expressed in wild grape V. amurensis in response to desiccation, high salinity, high mannitol, and temperature stresses. The analysis allowed identification and characterization of three CaMs and 54 CMLs of V. amurensis expressed in non-stressed tissues of V. amurensis and under the analyzed abiotic stress conditions. The qRT-PCR analysis of the VaCaM expression profiles revealed that the genes were actively expressed under the high salinity, high mannitol, desiccation stress, heat, and low temperature stress conditions. The applied abiotic stress treatments positively regulated expression of CaM genes in V. amurensis, with the most persistent changes being observed for VaCaM8 in response to salt stress, but the alternations in VaCaM expression were not progressive and remarkable. The data suggest that CaMs are slightly implicated in the abiotic stress resistance of V. amurensis. In contrast to VaCaMs, most of the evaluated VaCMLs (32 CMLs out of 54 analyzed genes) were highly responsive to the analyzed abiotic stress conditions exhibiting both positive and negative regulation patterns. The results obtained indicated that the 32 VaCMLs play distinct positive and negative roles in responses of wild grape to abiotic stresses. The expression patterns of individual VaCMLs have been shown to be induced and/or repressed in response to particular stress stimuli and frequently varied temporally and in magnitude in response to the abiotic stresses, suggesting specificity in their roles in abiotic stress adaptation of V. amurensis. The expression patterns of some VaCMLs were similar under the analyzed stress conditions, which suggests that the genes could perform similar functions and/or are regulated by related molecular mechanisms. The other 22 VaCMLs displayed insensitive expression patterns, showed occasional regulation or were slightly affected, indicating that they are not implicated in V. amurensis abiotic stress responses.
The effects of heat stress on CaM and CML transcript levels were analyzed both V. amurensis in our study and for V. vinifera by Vandelle et al. [25]. The CaM and CML genes of V. amurensis and V. vinifera displayed similar regulation under heat application. For example, heat stress greatly increased expression of the VviCML55 in V. vinifera and the homologous VaCML55 gene in V. amurensis, while it negatively regulated CML60, CML79, and CML92 expression in both these grapevine species. In addition, we noted that both VaCML92 and VvCML92 were strongly induced by water deficit stress [25].
Recently, a number of studies demonstrated that overexpression of plant CaM and CML genes can improve plant resistance to abiotic stresses [17,18,19,20]. For example, overexpression of the ShCML44 gene isolated from cold tolerant wild tomato enhanced the tolerance of a stress-sensitive tomato to cold, drought, and salinity [18]. According to our data, a homologous VaCML44 gene shared 66% protein similarity to ShCML44 and was up-regulated under cold and salinity stress treatments (Figure 2). Overexpression of the CsCaM3 gene, which shared 100% protein similarity with VaCaM8 and VaCaM10, improved heat stress tolerance in cucumber [19]. Heat stress significantly increased transcript levels of the VaCaM8 and VaCaM10 genes after 6 h of treatment in our experiments (Figure 1).
Results obtained in the present study suggested that the VaCML44, VaCML61, VaCML86, and VaCML89 genes were strongly and progressively induced under salt and cold stresses and are promising candidates for use in overexpression experiments to obtain plants with increased tolerance to these abiotic stress stimuli. The VaCML21, VaCML22, and VaCML52 genes are in turn good candidates for increasing heat stress tolerance and VaCML79, VaCML83, VaCML93, 106, and VaCML110—for increasing water deficit tolerance. The assumptions need to be verified by establishing transgenic plants in future experiments.
In conclusion, our study revealed potential importance of a number of CaM/CML genes of V. amurensis in its adaptation to abiotic stresses and indicated that some VaCaM and VaCML genes (mainly presented in Figure 2 and Figure 4) are positive regulators of plant abiotic stress tolerance and can be used in plant biotechnology and molecular biology in overexpression experiments to obtain plants with increased resistance to water-deficit, salinity, osmoticum, and temperature stresses. The VaCML genes with negative responses to the abiotic stimuli may be blockers in the development of the wild grape stress signaling and need additional studies.

4. Materials and Methods

4.1. Plant Material and Treatments

For the abiotic stress treatments, we used young vines of wild-growing grapevine V. amurensis Rupr. (Vitaceae) sampled from a non-protected natural population near Vladivostok, Russia (Akademgorodok, the southern Primorsky region of the Russian Far East, longitude 43.2242327 and latitude 131.99112300). The vines were collected in August 2018 and identified at the Botany Department of the Federal Scientific Center of the East Asia Terrestrial Biodiversity. The V. amurensis vines were divided into cuttings (excised young stems 7–8 cm long with one healthy leaf) that were placed in individual beakers and used for the stress treatments. For the control non-stress treatment, the V. amurensis cuttings were placed in filtered water at 25 °C. To induce water deficit stress, the cuttings were laid on a paper towel at 25 °C. To induce osmotic stress, the cuttings were placed in 400 mМ NaCl and 400 mМ mannitol solutions at 25 °C. To apply cold and heat stress, the V. amurensis cuttings were placed in filtered water in the growth chamber (Sanyo MLR-352, Panasonic, Osaka, Japan) at +4 °C, +10 °C, and +37 °C. The V. amurensis cuttings were grown under a 16/8 h light/dark phoperiod. The freshly harvested cuttings were acclimated to the “non-stress” condition for 30 min before they were treated with the stress treatments. The experiments were repeated three times for each stress treatment time and for the control treatment.

4.2. RNA Isolation and cDNA Preparation

Leaf samples were harvested after 6 h, 12 h, and 24 h of the abiotic stress treatments and immediately used for RNA extraction. Total RNA extraction was performed using the cetyltrimethylammonium bromide (CTAB)-based extraction as described [35]. Complementary DNAs were synthesized using 1.5 µg of RNA by the Moloney Murine Leukemia Virus (MMLV) Reverse transcription PCR Kit (RT-PCR, Sileks M, Moscow, Russia) as described [36]. The reverse transcription products were amplified by PCR and verified on the absence for DNA contamination using primers for AtActin2 gene (NM_112764) listed in Table S1 (356 bp PCR product from cDNA and 442 bp from DNA).

4.3. Cloning and Sequencing of VaCaM and VaCML Transcripts

To clone and sequence cDNAs containing full-length CDS of the VaCaM and VaCML transcripts, we retrieved the predicted protein and mRNA sequences of V. vinifera CaMs and CMLs from the Grape Genome Database hosted at CRIBI [37]. For this purpose, the CaM and CML protein sequences of Arabidopsis thaliana were downloaded from the TAIR database [38] and used as queries for blastp (V2 gene prediction) search against the deduced proteome of the PN40024 V. vinifera genome as described [25]. For non-redundant protein sequences, we performed a domain analysis by PROSITE scan [29,39] and prediction of myristoylation and palmitoylation motif numbers with GPS-Lipid [31,40]. The coding nucleotide sequences of the selected V. vinifera CaMs and CMLs were downloaded from the CRIBI database using tblastn search with the VviCaMs and VviCMLs protein sequences as queries (V2 mRNA prediction). Specific primers for amplification of the full-length coding cDNA sequences of the VaCaM and VaCML transcripts (Table S1) were designed to the retrieved VviCaMs and VviCMLs.
The coding cDNA sequences of VaCaMs and VaCMLs were amplified using RNA extracted from unstressed leaves of V. amurensis. To clone the full-length cDNAs of the VaCaMs and VaCMLs, RT-PCRs were performed in a T100TM Thermal Cycler (Bio-Rad Laboratories, Inc., Hercules, CA, USA) in 20 µL aliquots of the reaction mixtures using Ta 50–56 °C, elongation time 40 s—1 min 30 s. For the PCR reactions, we used Pfu polymerase (Sileks M, Moscow, Russia) as described in Kiselev et al. [41].
The obtained PCR products of VaCaM and VaCML cDNAs were subcloned into a pJET1.2 using CloneJET PCR Cloninig Kit (ThermoFisher Scientific, Waltham, MA, USA) and sequenced using an ABI 3130 Genetic Analyzer (Applied Biosystems, Foster City, CA, USA) according to the manuphacturer’s instructions. The sequences of the V. amurensis VaCaM and VaCML transcripts were deposited to GenBank (Table 1).
Multiple sequence alignments were done with the ClustalX program [42]. For classification of the CaMs and CMLs into subfamilies, a phylogenetic tree was created with the Clustal Omega program [43]. The VaCaM and VaCML amino acid sequences were predicted using the Gene Runner 3.05 program. The following online websites were used to predict molecular weights, N-terminal myristoylation and palmitoylation motifs, and domain structure of the VaCaM and VaCML proteins: Compute pI/Mw tool [32], GPS-Lipid [31,40], and PROSITE [29].

4.4. Expression Analysis of VaCaMs and VaCMLs

Quantitative RT-PCR (qRT-PCR) was performed using Real-time PCR kit (Syntol, Moscow, Russia) and EvaGreen Real-time PCR dye (Biotium, Hayward, CA, USA) using cDNAs of VaCaMs and VaCMLs and two internal controls (VaGAPDH and VaActin1) as described [44,45]. The expression was calculated by the 2−ΔΔCT method [46]. The visualized heatmaps were generated using heatmapper.ca [47,48]. Primers used for qRT-PCRsare listed in Table S2. qRT-PCR data shown were obtained from three independent experiments.

4.5. Statistical Analysis

The statistical analysis was carried out using the Microsoft Office Excel 2007 program (Microsoft corporation, Redmond, WA, USA). The data are presented as mean ± standard error (SE) and were tested by paired Student’s t-test. The 0.05 level was selected as the point of minimal statistical significance in all analyses.

Supplementary Materials

The following are available online at https://www.mdpi.com/2223-7747/8/12/602/s1. Table S1: Primers used for amplification of full-length cDNA of calmodulin (CaM), calmodulin-like (CML) genes, and partial cDNA of house-keeping gene (AtActin2) in wild-growing grapevine Vitis amurensis; Table S2: Primers used for real-time PCR for calmodulin (CaM) and calmodulin-like (CML) genes in wild-growing grapevine Vitis amurensis; Figure S1. Expression of VaCaM8 (a), VaCaM9 (b), and VaCaM10 (c) genes 6 h, 12 h, and 24 h post-treatment in V. amurensis cuttings exposed to abiotic stress conditions. The VaCaM expression levels were determined by qRT-PCR. Control—non-stress conditions (filtered water, +25 °C); WD—water-deficit stress (cuttings laid on a paper towel, +25 °C); NaCl—salt stress (0.4 M NaCl, +25 °C); Mannitol—osmoticum (0.4 M mannitol, +25 °C); +37 °C—heat stress (filtered water, +37 °C); +10 °C and +4 °C—cold stress (filtered water, +10 °C and +4 °C). *, **—significantly different from the values of CaM expression in V. amurensis under the control conditions after 6 h, 12 h, or 24 h of treatments at P ≤ 0.05 and 0.01 according to the Student’s t-test; Figure S2. Expression of VaCML21 (a), VaCML22 (b), VaCML44 (c), VaCML52 (d), VaCML61 (e), VaCML62 (f), VaCML72 (g), VaCML83 (h), VaCML86 (i), VaCML93 (j), VaCML106 (k), VaCML108 (l), and VaCML110 (m) genes 6 h, 12 h, and 24 h post-treatment in V. amurensis cuttings exposed to abiotic stress conditions. The VaCaM expression levels were determined by qRT-PCR. Control—non-stress conditions (filtered water, +25 °C); WD—water-deficit stress (cuttings laid on a paper towel, +25 °C); NaCl—salt stress (0.4 M NaCl, +25 °C); Mannitol—osmoticum (0.4 M mannitol, +25 °C); +37 °C—heat stress (filtered water, +37 °C); +10 °C and +4 °C—cold stress (filtered water, +10 °C and +4 °C). *, **—significantly different from the values of CaM expression in V. amurensis under the control conditions after 6 h, 12 h, or 24 h of treatments at P ≤ 0.05 and 0.01 according to the Student’s t-test; Figure S3. Expression of VaCML57 (a), VaCML60 (b), VaCML66 (c), VaCML77 (d), and VaCML85 (e) genes 6 h, 12 h, and 24 h post-treatment in V. amurensis cuttings exposed to abiotic stress conditions. The VaCaM expression levels were determined by qRT-PCR. Control—non-stress conditions (filtered water, +25 °C); WD—water-deficit stress (cuttings laid on a paper towel, +25 °C); NaCl—salt stress (0.4 M NaCl, +25 °C); Mannitol—osmoticum (0.4 M mannitol, +25 °C); +37 °C—heat stress (filtered water, +37 °C); +10 °C and +4 °C—cold stress (filtered water, +10 °C and +4 °C). *, **—significantly different from the values of CaM expression in V. amurensis under the control conditions after 6 h, 12 h, or 24 h of treatments at P ≤ 0.05 and 0.01 according to the Student’s t-test; Figure S4. Expression of VaCML1 (a), VaCML9a (b), VaCML48 (c), VaCML55 (d), VaCML75 (e), VaCML78 (f), VaCML79 (g), VaCML82 (h), VaCML84 (i), VaCML88 (j), VaCML89 (k), VaCML92 (l), VaCML105 (m), and VaCML107 (n) genes 6 h, 12 h, and 24 h post-treatment in V. amurensis cuttings exposed to abiotic stress conditions. The VaCaM expression levels were determined by qRT-PCR. Control—non-stress conditions (filtered water, +25 °C); WD—water-deficit stress (cuttings laid on a paper towel, +25 °C); NaCl—salt stress (0.4 M NaCl, +25 °C); Mannitol—osmoticum (0.4 M mannitol, +25 °C); +37 °C—heat stress (filtered water, +37 °C); +10 °C and +4 °C—cold stress (filtered water, +10 °C and +4 °C). *, **—significantly different from the values of CaM expression in V. amurensis under the control conditions after 6 h, 12 h, or 24 h of treatments at P ≤ 0.05 and 0.01 according to the Student’s t-test; Figure S5. Expression of VaCML9b (a), VaCML41a (b), VaCML41b (c), VaCML54 (d), VaCML65 (e), VaCML71 (f), VaCML73 (g), VaCML74 (h), VaCML76 (i), VaCML81 (j), VaCML95, 95, 100, 103, 104 (k), and VaCML90, 91 (h) genes 6 h, 12 h, and 24 h post-treatment in V. amurensis cuttings exposed to abiotic stress conditions. The VaCaM expression levels were determined by qRT-PCR. Control—non-stress conditions (filtered water, +25 °C); WD—water-deficit stress (cuttings laid on a paper towel, +25 °C); NaCl—salt stress (0.4 M NaCl, +25 °C); Mannitol—osmoticum (0.4 M mannitol, +25 °C); +37 °C—heat stress (filtered water, +37 °C); +10 °C and +4 °C—cold stress (filtered water, +10 °C and +4 °C). *, **—significantly different from the values of CaM expression in V. amurensis under the control conditions after 6 h, 12 h, or 24 h of treatments at P ≤ 0.05 and 0.01 according to the Student’s t-test; Figure S6. Expression of VaCML51 (a), VaCML53 (b), VaCML80 (c), VaCML87 (d), VaCML94 (e), and VaCML109 (f) genes 6 h, 12 h, and 24 h post-treatment in V. amurensis cuttings exposed to abiotic stress conditions. The VaCaM expression levels were determined by qRT-PCR. Control—non-stress conditions (filtered water, +25 °C); WD—water-deficit stress (cuttings laid on a paper towel, +25 °C); NaCl—salt stress (0.4 M NaCl, +25 °C); Mannitol—osmoticum (0.4 M mannitol, +25 °C); +37 °C—heat stress (filtered water, +37 °C); +10 °C and +4 °C—cold stress (filtered water, +10 °C and +4 °C). *, **—significantly different from the values of CaM expression in V. amurensis under the control conditions after 6 h, 12 h, or 24 h of treatments at P ≤ 0.05 and 0.01 according to the Student’s t-test; Figure S7. DNA sequence alignment and partial nucleotide sequences of the VviCML61 (VIT_205s0077g00300.1) and partially sequenced VaCML61.

Author Contributions

A.S.D. and K.V.K. performed research design, RNA isolations, stress experiments, data analysis, and paper preparation. O.A.A., A.R.S., Z.V.O., and A.A.A. performed qRT-PCRs and data analysis. All authors have read and agreed to publish the version of the manuscript.

Funding

This work was supported by a Grant from the Russian Foundation for Basic Research (grant number 18-04-00284).

Conflicts of Interest

The authors declare no conflict of interest.

References

  1. Hashimoto, K.; Kudla, J. Calcium decoding mechanisms in plants. Biochimie 2011, 93, 2054–2059. [Google Scholar] [CrossRef] [PubMed]
  2. Ranty, B.; Aldon, D.; Cotelle, V.; Galaud, J.P.; Thuleau, P.; Mazars, C. Calcium sensors as key hubs in plant responses to biotic and abiotic stresses. Front. Plant Sci. 2016, 7, 327. [Google Scholar] [CrossRef] [PubMed] [Green Version]
  3. Halling, D.B.; Liebeskind, B.J.; Hall, A.W.; Aldrich, R.W. Conserved properties of individual Ca2+-binding sites in calmodulin. Proc. Natl. Acad. Sci. USA 2016, 113, E1216–E1225. [Google Scholar] [CrossRef] [PubMed] [Green Version]
  4. Choi, W.G.; Hilleary, R.; Swanson, S.J.; Kim, S.H.; Gilroy, S. Rapid, long-distance electrical and calcium signaling in plants. Annu. Rev. Plant Biol. 2016, 67, 287–307. [Google Scholar] [CrossRef]
  5. Kudla, J.; Becker, D.; Grill, E.; Hedrich, R.; Hippler, M.; Kummer, U.; Parniske, M.; Romeis, T.; Schumacher, K. Advances and current challenges in calcium signaling. New Phytol. 2018, 218, 414–431. [Google Scholar] [CrossRef]
  6. DeFalco, T.A.; Bender, K.W.; Snedden, W.A. Breaking the code: Ca2+ sensors in plant signaling. Biochem. J. 2010, 425, 27–40. [Google Scholar] [CrossRef] [Green Version]
  7. Mohanta, T.K.; Yadav, D.; Khan, A.L.; Hashem, A.; Abd Allah, E.F.; Al-Harrasi, A. Molecular players of EF-hand containing calcium signaling event in plants. Int. J. Mol. Sci. 2019, 20, 1476. [Google Scholar] [CrossRef] [Green Version]
  8. Perochon, A.; Aldon, D.; Galaud, J.P.; Ranty, B. Calmodulin and calmodulin-like proteins in plant calcium signaling. Biochimie 2011, 93, 2048–2053. [Google Scholar] [CrossRef]
  9. La Verde, V.; Dominici, P.; Astegno, A. Towards understanding plant calcium signaling through calmodulin-like proteins: A biochemical and structural perspective. Int. J. Mol. Sci. 2018, 19, 1331. [Google Scholar] [CrossRef] [Green Version]
  10. Virdi, A.S.; Singh, S.; Singh, P. Abiotic stress responses in plants: Roles of calmodulin-regulated proteins. Front. Plant Sci. 2015, 6, 809. [Google Scholar] [CrossRef] [Green Version]
  11. Zeng, H.; Xu, L.; Singh, A.; Wang, H.; Du, L.; Poovaiah, B.W. Involvement of calmodulin and calmodulin-like proteins in plant responses to abiotic stresses. Front. Plant Sci. 2015, 6, 600. [Google Scholar] [CrossRef] [PubMed] [Green Version]
  12. Aldon, D.; Mbengue, M.; Mazars, C.; Galaud, J.P. Calcium signalling in plant biotic interactions. Int. J. Mol. Sci. 2018, 19, 665. [Google Scholar] [CrossRef] [PubMed] [Green Version]
  13. Gao, Q.Y.; Xiong, T.T.; Li, X.P.; Chen, W.X.; Zhu, X.Y. Calcium and calcium sensors in fruit development and ripening. Sci. Hortic. 2019, 253, 412–421. [Google Scholar] [CrossRef]
  14. Zeng, H.; Zhang, Y.; Zhang, X.; Pi, E.; Zhu, Y. Analysis of EF-hand proteins in soybean genome suggests their potential roles in environmental and nutritional stress signaling. Front. Plant Sci. 2017, 8, 887. [Google Scholar] [CrossRef] [Green Version]
  15. Li, C.; Meng, D.; Zhang, J.; Cheng, L. Genome-wide identification and expression analysis of calmodulin and calmodulin-like genes in apple (Malus×domestica). Plant Physiol. Biochem. 2019, 139, 600–612. [Google Scholar] [CrossRef]
  16. Ma, Q.P.; Zhou, Q.Q.; Chen, C.M.; Cui, Q.Y.; Zhao, Y.X.; Wang, K.; Arkorful, E.; Chen, X.; Sun, K.; Li, X.H. Isolation and expression analysis of CsCML genes in response to abiotic stresses in the tea plant (Camellia sinensis). Sci. Rep. 2019, 9, 8211. [Google Scholar] [CrossRef]
  17. Rao, S.S.; El-Habbak, M.H.; Havens, W.M.; Singh, A.; Zheng, D.M.; Vaughn, L.; Haudenshield, J.S.; Hartman, G.L.; Korban, S.S.; Ghabrial, S.A. Overexpression of GmCaM4 in soybean enhances resistance to pathogens and tolerance to salt stress. Mol. Plant Pathol. 2014, 15, 145–160. [Google Scholar] [CrossRef]
  18. Munir, S.; Liu, H.; Xing, Y.; Hussain, S.; Ouyang, B.; Zhang, Y.; Li, H.; Ye, Z. Overexpression of calmodulin-like (ShCML44) stress-responsive gene from Solanum habrochaites enhances tolerance to multiple abiotic stresses. Sci. Rep. 2016, 6, 31772. [Google Scholar] [CrossRef]
  19. Yu, B.; Yan, S.; Zhou, H.; Dong, R.; Lei, J.; Chen, C.; Cao, B. Overexpression of CsCaM3 improves high temperature tolerance in cucumber. Front. Plant Sci. 2018, 9, 797. [Google Scholar] [CrossRef]
  20. Kalaipandian, S.; Xue, G.P.; Rae, A.L.; Glassop, D.; Bonnett, G.D.; McIntyre, L.C. Overexpression of TaCML20, a calmodulin-like gene, enhances water soluble carbohydrate accumulation and yield in wheat. Physiol. Plant. 2019, 165, 790–799. [Google Scholar] [CrossRef]
  21. Zhang, X.X.; Wang, T.Z.; Liu, M.; Sun, W.; Zhang, W.H. Calmodulin-like gene MtCML40 is involved in salt tolerance by regulating MtHKTs transporters in Medicago truncatula. Environ. Exp. Bot. 2019, 157, 79–90. [Google Scholar] [CrossRef]
  22. Yamaguchi, T.; Aharon, G.S.; Sottosanto, J.B.; Blumwald, E. Vacuolar Na+/H+ antiporter cation selectivity is regulated by calmodulin from within the vacuole in a Ca2+- and pH-dependent manner. Proc. Natl. Acad. Sci. USA 2005, 102, 16107–16112. [Google Scholar] [CrossRef] [PubMed] [Green Version]
  23. Zhou, S.; Jia, L.X.; Chu, H.Y.; Wu, D.; Peng, X.; Liu, X.; Zhang, J.J.; Zhao, J.F.; Chen, K.M.; Zhao, L.Q. Arabidopsis CaM1 and CaM4 promote nitric oxide production and salt resistance by Inhibiting S-Nitrosoglutathione reductase via girect binding. PLoS Genet. 2016, 12, e1006255. [Google Scholar] [CrossRef] [PubMed]
  24. Yoo, J.H.; Park, C.Y.; Kim, J.C.; Heo, W.D.; Cheong, M.S.; Park, H.C.; Kim, M.C.; Moon, B.C.; Choi, M.S.; Kang, Y.H.; et al. Direct interaction of a divergent CaM isoform and the transcription factor, MYB2, enhances salt tolerance in arabidopsis. J. Biol. Chem. 2005, 280, 3697–3706. [Google Scholar] [CrossRef] [Green Version]
  25. Vandelle, E.; Vannozzi, A.; Wong, D.; Danzi, D.; Digby, A.M.; Dal Santo, S.; Astegno, A. Identification, characterization, and expression analysis of calmodulin and calmodulin-like genes in grapevine (Vitis vinifera) reveal likely roles in stress responses. Plant Physiol. Biochem. 2018, 129, 221–237. [Google Scholar] [CrossRef] [PubMed]
  26. Jaillon, O.; Aury, J.M.; Noel, B.; Policriti, A.; Clepet, C.; Casagrande, A.; Choisne, N.; Aubourg, S.; Vitulo, N.; Jubin, C.; et al. The grapevine genome sequence suggests ancestral hexaploidization in major angiosperm phyla. Nature 2007, 449, 463–467. [Google Scholar]
  27. Velasco, R.; Zharkikh, A.; Troggio, M.; Cartwright, D.A.; Cestaro, A.; Pruss, D.; Pindo, M.; Fitzgerald, L.M.; Vezzulli, S.; Reid, J.; et al. A high quality draft consensus sequence of the genome of a heterozygous grapevine variety. PLoS ONE 2007, 2, e1326. [Google Scholar] [CrossRef] [Green Version]
  28. Grimplet, J.; Adam-Blondon, A.-F.; Bert, P.-F.; Bitz, O.; Cantu, D.; Davies, C.; Delrot, S.; Pezzotti, M.; Rombauts, S.; Cramer, G.R. The grapevine gene nomenclature system. BMC Genom. 2014, 15, 1077. [Google Scholar] [CrossRef] [Green Version]
  29. Database of Protein Domains, Families and Functional sites. Available online: http://prosite.expasy.org/ (accessed on 25 November 2019).
  30. Chung, E.; Park, J.M.; Oh, S.K.; Joung, Y.H.; Lee, S.; Choi, D. Molecular and biochemical characterization of the Capsicum annuum calcium-dependent protein kinase 3 (CaCDPK3) gene induced by abiotic and biotic stresses. Planta 2004, 220, 286–295. [Google Scholar] [CrossRef]
  31. Prediction of Lipid Modification Sites. Available online: http://lipid.biocuckoo.org/webserver.php (accessed on 25 November 2019).
  32. Compute pI/Mw Tool. Available online: http://web.expasy.org/compute_pi/ (accessed on 25 November 2019).
  33. Dubrovina, A.S.; Kiselev, K.V.; Khristenko, V.S. Expression of calcium-dependent protein kinase (CDPK) genes under abiotic stress conditions in wild-growing grapevine Vitis amurensis. J. Plant Physiol. 2013, 170, 1491–1500. [Google Scholar] [CrossRef]
  34. Liu, L.; Li, H. Review: Research progress in amur grape, Vitis amurensis Rupr. Can. J. Plant Sci. 2013, 93, 565–575. [Google Scholar] [CrossRef] [Green Version]
  35. Kiselev, K.V.; Dubrovina, A.S.; Shumakova, O.A.; Karetin, Y.A.; Manyakhin, A.Y. Structure and expression profiling of a novel calcium-dependent protein kinase gene, CDPK3a, in leaves, stems, grapes, and cell cultures of wild-growing grapevine Vitis amurensis Rupr. Plant Cell Rep. 2013, 32, 431–442. [Google Scholar] [CrossRef] [PubMed]
  36. Dubrovina, A.S.; Kiselev, K.V. The role of calcium-dependent protein kinase genes VaCPK1 and VaCPK26 in the response of Vitis amurensis (in vitro) and Arabidopsis thaliana (in vivo) to abiotic stresses. Russ. J. Genet. 2019, 55, 319–329. [Google Scholar] [CrossRef]
  37. Grape Genome Database. Available online: http://genomes.cribi.unipd.it/grape (accessed on 25 November 2019).
  38. The Arabidopsis Information Resource. Available online: https://www.arabidopsis.org (accessed on 25 November 2019).
  39. Falquet, L.; Pagni, M.; Bucher, P.; Hulo, N.; Sigrist, C.J.; Hofmann, K.; Bairoch, A. The PROSITE database, its status in 2002. Nucleic Acids Res. 2002, 30, 235–238. [Google Scholar] [CrossRef] [PubMed]
  40. Xie, Y.; Zheng, Y.; Li, H.; Luo, X.; He, Z.; Cao, S.; Shi, Y.; Zhao, Q.; Xue, Y.; Zuo, Z.; et al. GPS-Lipid: A robust tool for the prediction of multiple lipid modification sites. Sci Rep. 2016, 16, 28249. [Google Scholar] [CrossRef]
  41. Kiselev, K.V.; Tyunin, A.P.; Ogneva, Z.V.; Dubrovina, A.S. Age-associated alterations in somatic mutation level in Arabidopsis thaliana. Plant Growth Regul. 2015, 75, 493–501. [Google Scholar] [CrossRef]
  42. Altschul, S.F.; Gish, W.; Miller, W.; Myers, E.W.; Lipman, D.J. Basic local alignment search tool. J. Mol. Biol. 1990, 215, 403–410. [Google Scholar] [CrossRef]
  43. Sievers, F.; Wilm, A.; Dineen, D.; Gibson, T.J.; Karplus, K.; Li, W.; Lopez, R.; McWilliam, H.; Remmert, M.; Söding, J.; et al. Fast, scalable generation of high-quality protein multiple sequence alignments using Clustal Omega. Mol. Syst. Biol. 2011, 11, 539. [Google Scholar] [CrossRef]
  44. Dubrovina, A.S.; Aleynova, O.A.; Manyakhin, A.Y.; Kiselev, K.V. The role of calcium-dependent protein kinase genes CPK16, CPK25, CPK30, and CPK32 in stilbene biosynthesis and the stress resistance of grapevine Vitis amurensis Rupr. Appl. Biochem. Microbiol. 2018, 54, 410–417. [Google Scholar] [CrossRef]
  45. Kiselev, K.V.; Ogneva, Z.V.; Suprun, A.R.; Grigorchuk, V.P.; Dubrovina, A.S. Action of ultraviolet-C radiation and p-coumaric acid on stilbene accumulation and expression of stilbene biosynthesis-related genes in the grapevine Vitis amurensis Rupr. Acta Physiol Plant. 2019, 41, 28. [Google Scholar] [CrossRef]
  46. Livak, K.J.; Schmittgen, T.D. Analysis of relative gene expression data using real-time quantitative PCR and the 2(-Delta Delta C (T)) method. Methods 2001, 25, 402–408. [Google Scholar] [CrossRef] [PubMed]
  47. Babicki, S.; Arndt, D.; Marcu, A.; Liang, Y.; Grant, J.R.; Maciejewski, A.; Wishart, D.S. Heatmapper: Web-enabled heat mapping for all. Nucleic Acids Res. 2016, 44, W147–W153. [Google Scholar] [CrossRef] [PubMed]
  48. Heatmapper. Available online: http://heatmapper.ca (accessed on 25 November 2019).
Figure 1. Phylogenetic tree of plant calmodulins (CaMs) and calmodulin-like proteins (CMLs) of Vitis amurensis, Vitis vinifera, and Arabidopsis thaliana created using the full-length protein sequences. The phylogenetic tree was constructed using the MEGA-X program by the neighbor joining method with 1000 bootstrap replicates. The CaMs and CMLs were categorized into nine subgroups highlighted with different colors. Red asterisks denote CaMs and CMLs of V. amurensis identified in this study. Dark blue asterisks denote CaMs and CMLs of V. vinifera firstly described in this study.
Plants 08 00602 g001
Figure 2. Heatmap of VaCaM expression levels after 6 h, 12 h, and 24 h of treatments in Vitis amurensis cuttings exposed to abiotic stress conditions. The VaCaM expression levels were determined by quantitative RT-PCR. The color scale represents increased (green) and decreased (red) log2 fold changes of the expression values under abiotic stress treatments relative to the control. Control—non-stress conditions (filtered water, +25 °C); WD—water-deficit stress (cuttings laid on a paper towel, +25 °C); NaCl—salt stress (0.4 M NaCl, +25 °C); Mannitol—osmoticum (0.4 M mannitol, +25 °C); +37 °C—heat stress (filtered water, +37 °C); +10 °C, and +4 °C—cold stress (filtered water, +10 °C, and +4 °C). *, **—significantly different from the values of CaM expression in V. amurensis under the control conditions after 6 h, 12 h, or 24 h of treatments at p ≤ 0.05 and 0.01 according to the Student’s t-test.
Plants 08 00602 g002
Figure 3. Heatmap of expression levels of 13 VaCMLs significantly up-regulated at least at two time intervals after one or several abiotic stress treatments in Vitis amurensis cuttings. The VaCaM expression levels were determined by quantitative RT-PCR and analyzed after 6 h, 12 h, and 24 h of treatments. The color scale represents increased (green) and decreased (red) log2 fold changes of the expression values under abiotic stress treatments relative to the control. The VaCML genes were ordered by their subgroup numbers. Control—non-stress conditions (filtered water, +25 °C); WD—water-deficit stress (cuttings laid on a paper towel, +25 °C); NaCl—salt stress (0.4 M NaCl, +25 °C); Mannitol—osmoticum (0.4 M mannitol, +25 °C); +37 °C—heat stress (filtered water, +37 °C); +10 °C, and +4 °C—cold stress (filtered water, +10 °C, and +4 °C). *, **—significantly different from the values of CML expression in V. amurensis under the control conditions after 6 h, 12 h, or 24 h of treatments at p ≤ 0.05 and 0.01 according to the Student’s t-test.
Plants 08 00602 g003
Figure 4. Heatmap of expression levels of five VaCMLs significantly down-regulated at least at two time intervals after one or several abiotic stress treatments in Vitis amurensis cuttings. The VaCaM expression levels were determined by quantitative RT-PCR and analyzed after 6 h, 12 h, and 24 h of treatments. The color scale represents increased (green) and decreased (red) log2 fold changes of the expression values under abiotic stress treatments relative to the control. The VaCML genes were ordered by their subgroup numbers. Control—non-stress conditions (filtered water, +25 °C); WD—water-deficit stress (cuttings laid on a paper towel, +25 °C); NaCl—salt stress (0.4 M NaCl, +25 °C); Mannitol—osmoticum (0.4 M mannitol, +25 °C); +37 °C—heat stress (filtered water, +37 °C); +10 °C and +4 °C—cold stress (filtered water, +10 °C, and +4 °C). *, **—significantly different from the values of CML expression in V. amurensis under the control conditions after 6 h, 12 h, or 24 h of treatments at p ≤ 0.05 and 0.01 according to the Student’s t-test.
Plants 08 00602 g004
Figure 5. Heatmap of expression levels of 14 VaCMLs displaying both up- and down-regulation at least at two time intervals after one or several abiotic stress treatments in Vitis amurensis cuttings. The VaCaM expression levels were determined by quantitative RT-PCR and analyzed after 6 h, 12 h, and 24 h of treatments. The color scale represents increased (green) and decreased (red) log2 fold changes of the expression values under abiotic stress treatments relative to the control. The VaCML genes were ordered by their subgroup numbers. Control—non-stress conditions (filtered water, +25 °C); WD—water-deficit stress (cuttings laid on a paper towel, +25 °C); NaCl—salt stress (0.4 M NaCl, +25 °C); Mannitol—osmoticum (0.4 M mannitol, +25 °C); +37 °C—heat stress (filtered water, +37 °C); +10 °C and +4 °C—cold stress (filtered water, +10 °C and +4 °C). *, **—significantly different from the values of CML expression in V. amurensis under the control conditions after 6 h, 12 h, or 24 h of treatments at p ≤ 0.05 and 0.01 according to the Student’s t-test.
Plants 08 00602 g005
Table 1. Characteristics of CaM and CML transcripts and deduced amino acid sequences of Vitis amurensis and Vitis vinifera.
Vitis amurensis
cDNA Clone
Vitis vinifera
Gene Prediction
Protein I/S (%)No. of EF HandsN-MyristN-PalmitMW (kDa)Group
Transcript NameID GeneBankCDS (bp)Amino AcidsGene NameGene IDCDS (bp)Amino Acids
VaCaM8MN515154450149VviCaM8VIT_208s0040g00470.6450149100/1004--16.81
VaCaM9MN478368450149VviCaM9VIT_217s0000g00580.1450149100/1004--16.91
VaCaM10MN515156450149VviCaM10VIT_206s0009g01910.1462153100/1004--16.81
VaCML9aMN515159462153VviCML9aVIT_214s0030g02150.146215397/984--17.52
VaCML9bMN515160450149VviCML9bVIT_200s0179g00280.1450149100/1004-Yes17.02
VaCML79MN515161450149VviCML79VIT_205s0020g04420.1450149100/1004--17.02
VaCML80MN515162444147VviCML80VIT_202s0241g00140.1444147100/1003Yes-16.62
VaCML107MN562253438145VviCML107VIT_207s0031g00700.343814599/983-Yes16.82
VaCML108MN562252522173VviCML108VIT_205s0094g01240.352217399/994--19.92
VaCML72MN515163483160VviCML72VIT_217s0000g04460.148316099/994Yes-17.63
VaCML73MN515164489162VviCML73VIT_201s0011g02470.1489162100/1004--17.83
VaCML74MN537892492163VviCML74VIT_216s0039g01880.1492163100/1004--18.23
VaCML75MN537893492163VviCML75VIT_202s0012g02060.1492163100/1004--18.13
VaCML1MN537894552183VviCML1VIT_203s0063g00530.154918298/984--21.04
VaCML41aMN537895561186VviCML41aVIT_204s0023g01100.155818597/983Yes-21.04
VaCML41bMN537896576191VviCML41bVIT_218s0001g11830.157619198/983--21.24
VaCML44MN537897489162VviCML44VIT_218s0001g01630.148916299/994--18.34
VaCML60MN537898669222VviCML60VIT_208s0007g05790.166922298/994--24.34
VaCML86MN540577492163VviCML86VIT_217s0000g02480.12829398/98 a4--18.14
VaCML88MN540578579192VviCML88VIT_208s0056g00290.1579192100/1003Yes-21.44
VaCML89MN540579663220VviCML89VIT_211s0016g05740.177125699/1004-Yes24.54
VaCML90MN540580465154VviCML90VIT_207s0289g00040.1465154100/1004-Yes17.54
VaCML91VviCML91VIT_207s0141g00300.1
VaCML92MN540581507168VviCML92VIT_218s0122g00180.1507168100/1004-Yes18.44
VaCML93MN540582429142VviCML93VIT_214s0171g00150.142914299/994--15.94
VaCML94MN540583432143VviCML94VIT_217s0000g01630.143214399/1004--16.14
VaCML105MN562248453150VviCML105VIT_214s0006g01400.1453150100/1004-Yes16.54
VaCML106MN56225425584VviCML106VIT_208s0007g08830.125584100/1002--9.54
VaCML109MN562249615204VviCML109VIT_215s0048g00790.161520499/994-Yes22.94
VaCML110MN562246648215VviCML110VIT_205s0102g00450.164521499/994-Yes24.64
VaCML95MN540584423140VviCML95VIT_201s0010g03000.142314098/994-Yes16.15
VaCML96MN540585423140VviCML96VIT_201s0010g02990.142314096/974-Yes16.15
nd VviCML97VIT_201s0010g02940.1423 --16.15
nd VviCML98VIT_201s0010g02970.1423 --16.15
nd VviCML99VIT_201s0010g03010.1423 --16.15
VaCML100MN540586423140VviCML100VIT_201s0010g02980.142314096/974-Yes16.15
nd VviCML101VIT_201s0010g02930.1423 --16.15
nd VviCML102VIT_201s0010g02950.1423 --16.15
VaCML103MN540587423140VviCML103VIT_201s0010g03040.142314095/964-Yes16.15
VaCML104MN540588423140VviCML104VIT_201s0010g03020.142314096/974-Yes16.15
VaCML55MN54058929497VviCML55VIT_218s0001g10670.129497100/1002-Yes11.46 a
VaCML83MN540590543180VviCML83VIT_201s0026g02590.154318098/982-Yes20.56 a
VaCML84MN540591471156VviCML84VIT_214s0108g01000.147115699/992-Yes18.36 a
VaCML85MN540592591196VviCML85VIT_217s0000g06325.159119699/992-Yes22.06 a
VaCML87MN54059329497VviCML87VIT_207s0031g00760.12949799/982-Yes11.56 a
VaCML51MN54059428895VviCML51VIT_218s0001g10605.12889596/982--10.66 b
VaCML52MN54059527992VviCML52VIT_218s0001g10600.127992100/1002--10.66 b
VaCML53MN54059627089VviCML53VIT_218s0001g10595.12708998/1002--10.66 b
VaCML54MN54059727089VviCML54VIT_218s0001g10645.12708998/982-Yes10.36 b
nd VviCML56VIT_218s0001g10630.1 6 b
VaCML57MN54059829497VviCML57VIT_218s0001g10620.12859497/962--11.26 b
nd VviCML58VIT_218s0001g10640.1435 6 b
nd VviCML59VIT_218s0001g10610.1300 6 b
nd VviCML21v.1VIT_219s0015g01200.1708
VaCML21v.2MN540599699232VviCML21v.2VIT_219s0015g01200.269923299/994YesYes26.47 a
VaCML22MN540602729242VviCML22VIT_205s0029g00070.174724897/974YesYes27.37 a
VaCML62MN540605414 VviCML62VIT_212s0059g00360.1414 97/982Yes-15.57 a
nd VviCML63VIT_212s0059g00320.1414 7 a
nd VviCML64VIT_212s0059g00370.1414 7 a
VaCML65MN540606414137VviCML65VIT_212s0059g00430.141413799/992Yes-15.67 a
VaCML66MN540607420139VviCML66VIT_213s0156g00120.1420139100/1002Yes-15.57 a
nd VviCML67VIT_212s0059g00340.1414 7 a
nd VviCML68VIT_212s0059g00420.1414 7 a
nd VviCML69VIT_212s0059g00400.1414 7 a
nd VviCML70VIT_212s0059g00350.1414 7 a
VaCML48MN562247678225VviCML48VIT_206s0080g00450.1678225100/1002--25.37 b
VaCML61p.s.b VviCML61VIT_205s0077g00300.1909302100/1002Yes-33.57 b
nd VviCML77v.1VIT_200s0252g00130.1711 7 b
VaCML77v.2MN540608831276VviCML77v.2VIT_200s0252g00130.283127698/982Yes-29.7
VaCML78MN5406101119372VviCML78VIT_210s0071g00670.1111937298/995Yes-43.47 b
VaCML81MN5406111425474VviCML81VIT_204s0008g06280.1142547499/994-Yes54.27 b
VaCML82MN5406121065354VviCML82VIT_211s0118g00540.1106535499/1005--40.67 b
VaCML71MN54877159472VviCML71VIT_219s0014g04650.1453150100/100 a0--8.08
VaCML76MN540595363120VviCML76VIT_202s0012g00660.136312099/991Yes-13.58
Note: No. of EF hands—the number of EF hands predicted by PROSITE scan [28,29]; N-Myrist and N-Palmit—the number of myristoylation and palmitoylation motifs identified with GPS-Lipid [30,31]; CDS—coding DNA sequences; MW (kDa)—molecular mass calculated using the Compute pI/Mw tool [32]; I and S—identities and similarities of the deduced V. amurensis and V. vinifera amino acid sequences. a the protein I and S were obtained without taking into account insertions; b partially sequenced (Figure S7).

