Article

Genome Size Evolution and Dynamics in Iris, with Special Focus on the Section Oncocyclus

by
Nour Abdel Samad
1,2,†,
Oriane Hidalgo
3,4,*,†,
Elie Saliba
1,
Sonja Siljak-Yakovlev
2,
Kit Strange
3,
Ilia J. Leitch
3 and
Magda Bou Dagher-Kharrat
1,*
1
Laboratoire Biodiversité et Génomique Fonctionnelle, Faculté des Sciences, Campus Sciences et Technologies, Université Saint-Joseph, Mar Roukos, Mkalles, BP: 1514 Riad el Solh, Beirut 1107 2050, Lebanon
2
Ecologie Systématique Evolution, Université Paris-Saclay, CNRS, AgroParisTech, 91400 Orsay, France
3
Royal Botanic Gardens, Kew, Richmond, Surrey TW9 3AB, UK
4
Institut Botànic de Barcelona (IBB, CSIC-Ajuntament de Barcelona), Passeig del Migdia s.n., 08038 Barcelona, Spain
*
Authors to whom correspondence should be addressed.
Joint first authors.
Plants 2020, 9(12), 1687; https://doi.org/10.3390/plants9121687
Submission received: 29 October 2020 / Revised: 21 November 2020 / Accepted: 26 November 2020 / Published: 1 December 2020
(This article belongs to the Section Plant Genetics, Genomics and Biotechnology)

Abstract

:
Insights into genome size dynamics and its evolutionary impact remain limited by the lack of data for many plant groups. One of these is the genus Iris, of which only 53 out of c. 260 species have available genome sizes. In this study, we estimated the C-values for 41 species and subspecies of Iris mainly from the Eastern Mediterranean region. We constructed a phylogenetic framework to shed light on the distribution of genome sizes across subgenera and sections of Iris. Finally, we tested evolutionary models to explore the mode and tempo of genome size evolution during the radiation of section Oncocyclus. Iris as a whole displayed a great variety of C-values; however, they were unequally distributed across the subgenera and sections, suggesting that lineage-specific patterns of genome size diversification have taken place within the genus. The evolutionary model that best fitted our data was the speciational model, as changes in genome size appeared to be mainly associated with speciation events. These results suggest that genome size dynamics may have contributed to the radiation of Oncocyclus irises. In addition, our phylogenetic analysis provided evidence that supports the segregation of the Lebanese population currently attributed to Iris persica as a distinct species.

Graphical Abstract

1. Introduction

The royal irises (Iris L. subgenus Iris, section Oncocyclus (Siemssen) Baker) have experienced a remarkable radiation across the rocky hillsides, steppes, and deserts of the Middle East (incl. the Eastern Mediterranean and Western Asia regions), giving rise to c. 33 species [1]. These irises exhibit a highly distinctive morphology with a short stem, small falcate leaves arranged in a fan-shaped structure, and, in proportion to the rest of the plant, an oversized solitary flower of varied and complex colour patterns. Flowers of usually dark colour harvest solar energy, a floral heat tightly linked to the night-sheltering bee pollination system which occurs in most species [2,3,4,5]. Shelter mimicry is a rare strategy otherwise restricted to orchids in the Euro-Mediterranean region [4]. A few Oncocyclus species (such as Iris paradoxa Steven) are pollinated through sexual deception—an even more specialised strategy—which is, like shelter mimicry, exclusive to orchids and royal irises in the Euro-Mediterranean region. Within the Oncocyclus irises, it has been suggested that sexual deception evolved from shelter mimicry [4]. The pollinator-mediated selection of floral traits is considered a major factor driving diversification in this group, although the extent to which it does is still debated [5,6].
Species of section Oncocyclus are generally strict endemics, typically occurring in a small number of scattered, disjunct populations, whose geographical isolation is enhanced by their pollination strategy and myrmecochory seed dispersal. Morphological divergence between populations usually follows a cline reflecting local adaptation to environment conditions; furthermore, this largely overlaps divergence between species, making it difficult to identify discrete species boundaries in these irises [7]. The magnitude of the problem has been highlighted by a recent molecular phylogeny of royal irises, wherein none of the five species represented by two or three subspecific entities were recovered as monophyletic [8]. Given that many royal irises are now threatened in the wild [9,10], this makes the need to better document the biodiversity of this Iris section an urgent priority for optimising conservation strategies.
While the genus Iris is typically reported to exhibit considerable karyotype diversity (e.g., in chromosome numbers and frequency of polyploidy and dysploidy [11]), section Oncocyclus is distinctive as it appears karyotypically stable, with all species presenting a strikingly similar, bimodal, asymmetric chromosome complement of 2n = 20 [12]. Available cytogenetic data for Oncocyclus irises also support this view, as shown by a recent study [13], which highlighted the presence of three 35S rDNA loci in the royal irises, which is one more locus than reported for other Iris species from the Eastern Mediterranean region.
To our knowledge, there are currently only three genome size estimates reported for species belonging to section Oncocyclus [14]: I. lortetii Barbey ex Boiss. (2C = 15.46 pg), I. sofarana Foster (2C = 11.5 pg) and I. sofarana subsp. kasruwana (Dinsm.) Chaubhary, G.Kirkw. & C.Weymouth (2C = 16.36 pg). These values rank average to low compared with the C-value estimates for 39 Iris species (c. 15%) reported in the Plant DNA C-values database release 7.1. [15,16] which range from 2.1 to 56.4 pg/2C, with a mean of 18.11 pg/2C (calculated with the “prime estimate” search option that gives one value per species and cytotype). The growing pool of evidence aiming to link changes in genome size to speciation and speciation rate (see [17] for an overview) and to species radiation [18,19,20,21] makes a closer study of genome size dynamics within section Oncocylus worthwhile.
In this study, we have undertaken a survey of C-values across Iris species, with a special emphasis on subgenus Iris and particularly on section Oncocyclus which is placed within this subgenus. The aims of the study were to (i) assess the extent of genome size diversity in these taxa, and (ii) provide insights into genome size evolution in section Oncocyclus.

2. Results

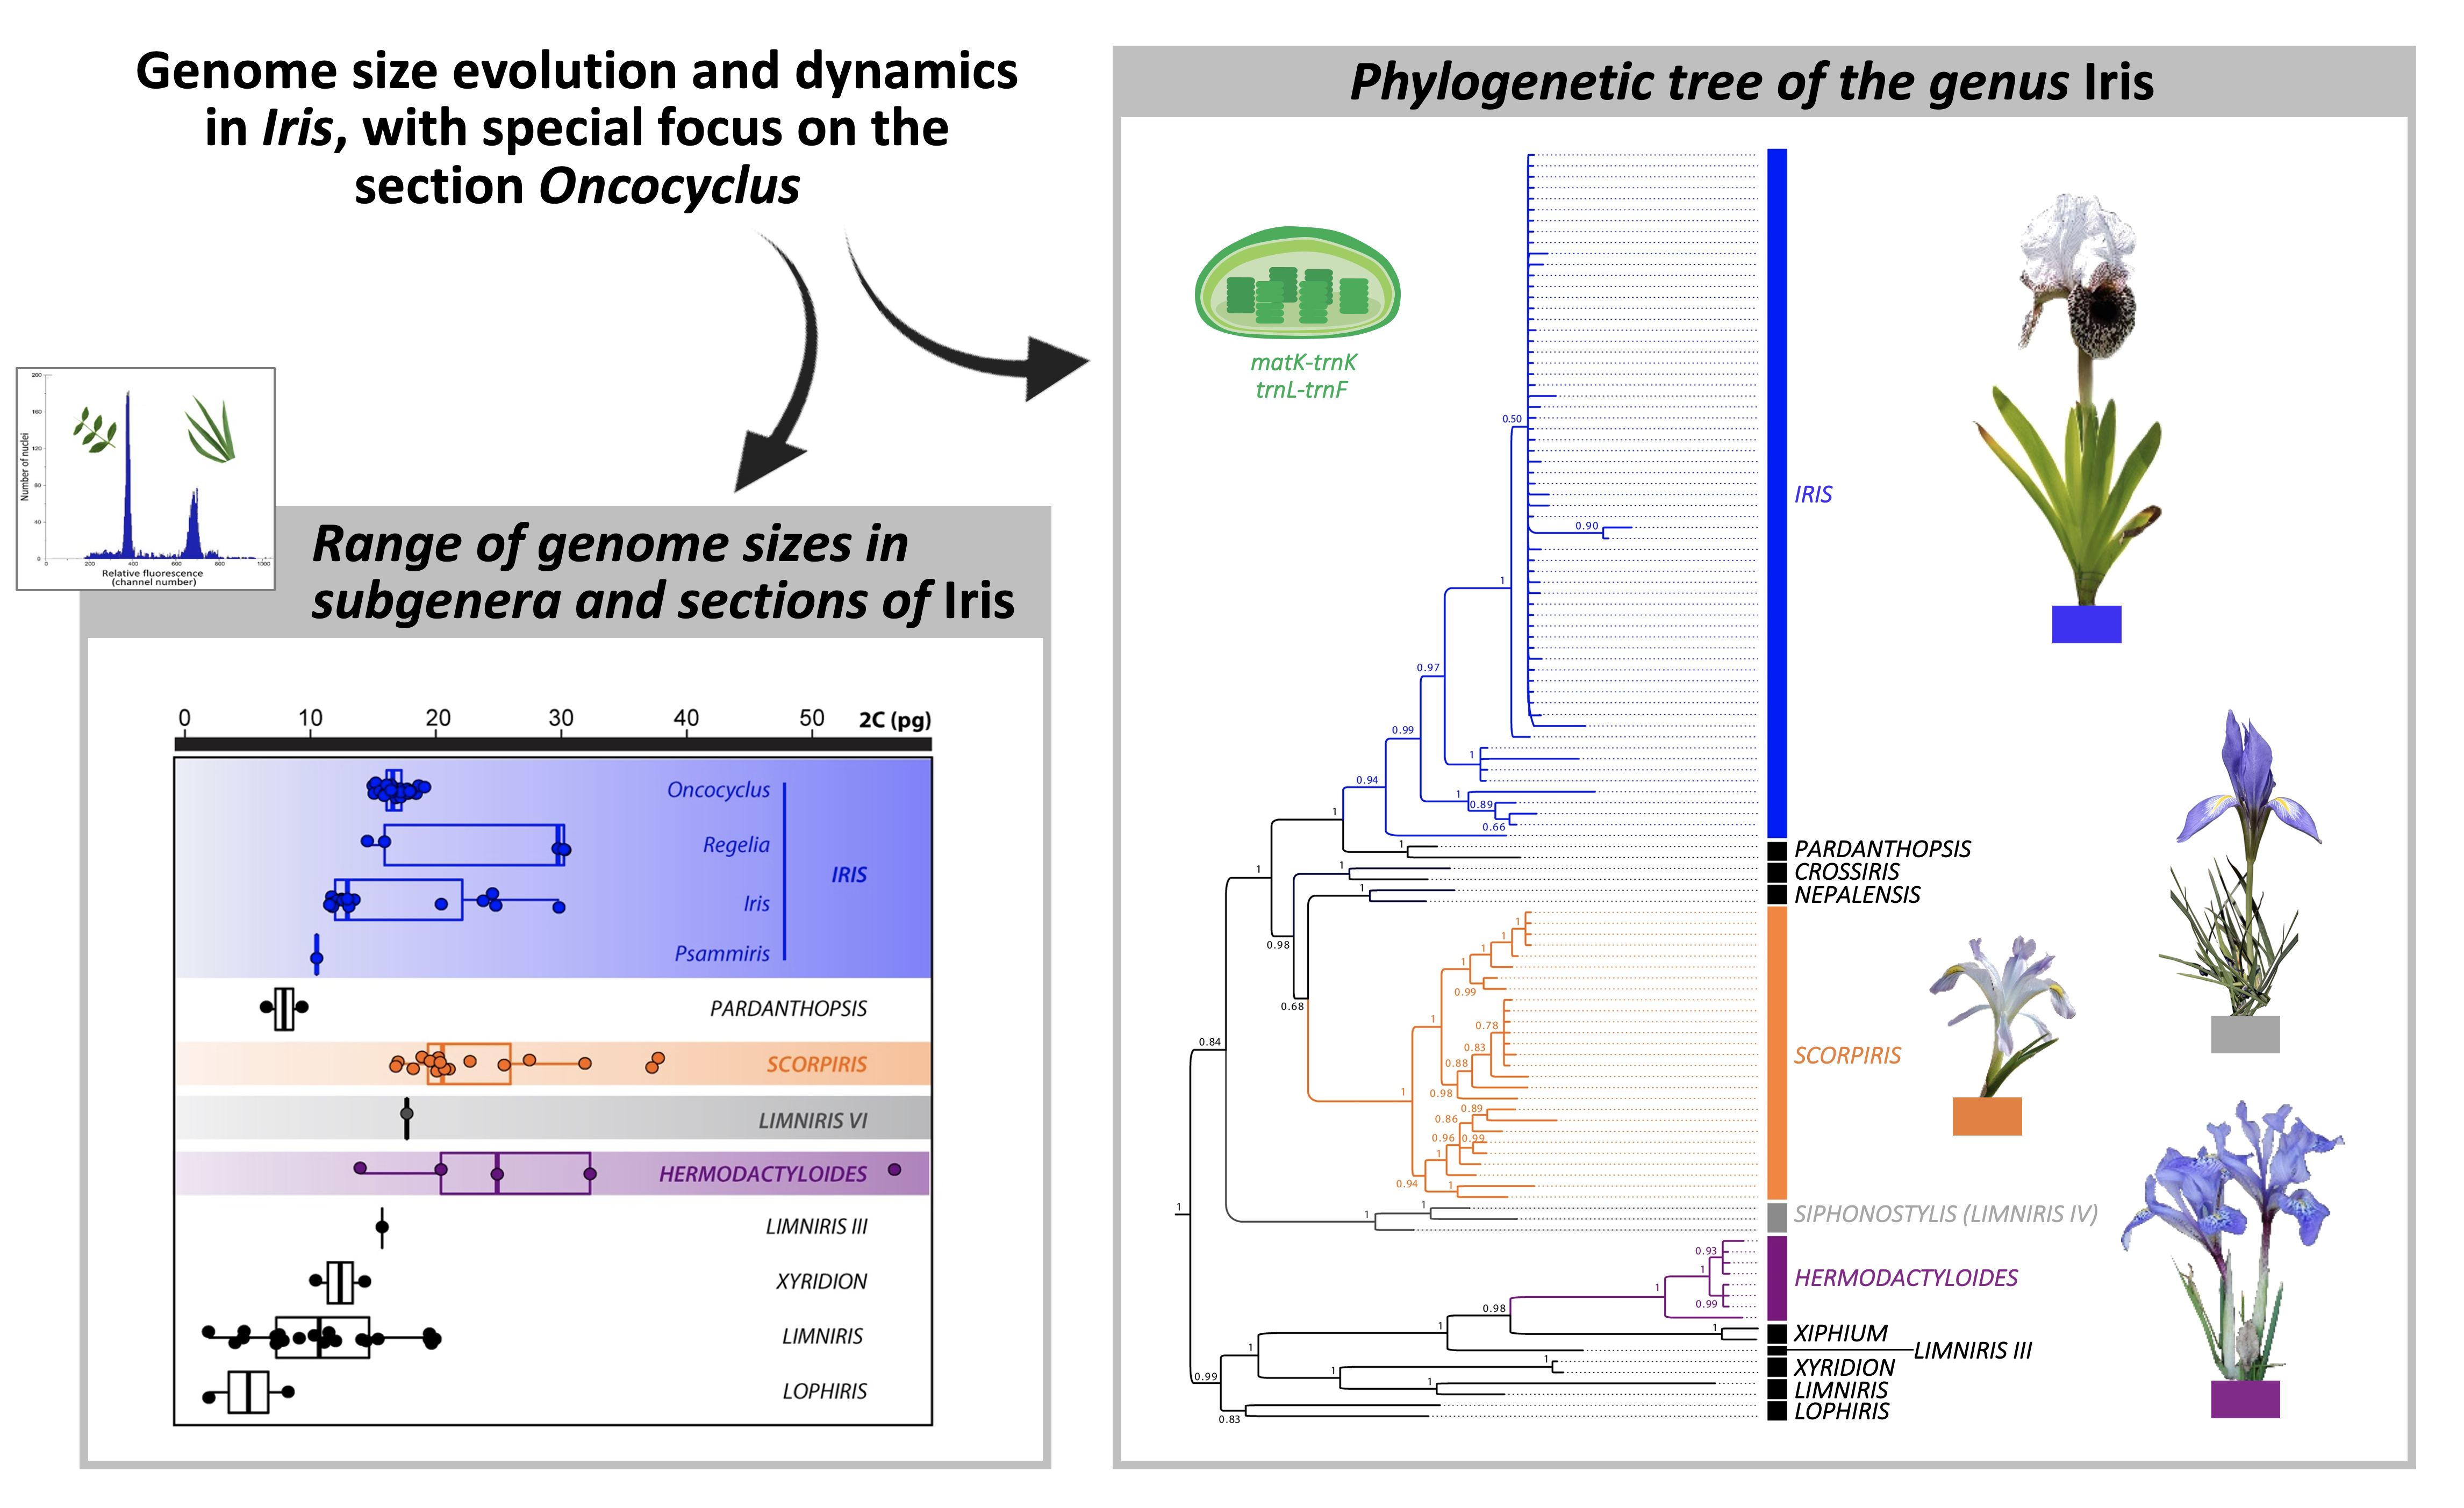
2.1. Iris Phylogenetic Reconstruction

Nucleotide sequence data for 20 Iris species and subspecies have been deposited in the DDBJ/EMBL/GenBank (accessions MW110365–MW110415 for trnL-trnF, MW110416–MW110469 for matK-trnK; Table S1). The phylogenetic tree resulting from the Bayesian analysis of the combined dataset is presented in Figure 1. Separate analyses of the different markers (data not shown) did not reveal any incongruences with branch support. Our results are consistent with the subgeneric and sectional divisions of the genus Iris, although in subgenus Iris most accessions fell in an unresolved polytomy (Figure 1). The analysis of multiple accessions per species yielded no conflict, except for the Lebanese populations from Yammouneh and Quaa attributed to Iris persica L. These appeared more closely related to I. regis-uzziae Feinbrun, I. aucheri (Baker) Sealy, I. nusairiensis Mouterde and I. galatica Siehe than to the two Turkish accessions of Iris persica (accessions “Usta T02-15”, [22]; “Chase 13045”, [23]; Figure 1).

2.2. Genome Size Diversity across Iris Subgenera and Sections

We estimated C-values for 50 accessions of 41 Iris species and subspecies, mostly from the Eastern Mediterranean region, including 37 populations of taxa belonging to section Oncocyclus (27 species, three of them with two subspecies; Table 1). Since the genome size of I. sofarana Foster published in [14] appeared much smaller (2C = 11.5 pg) than any other Iris from section Oncocyclus, we reassessed this value measuring the exact same population of Dahr El-Baydar with the same calibration standard and extraction buffer, and obtained 2C = 16.22 pg. With this new value, the genome size in section Oncocyclus varied only 1.27-fold, ranging from 2C = 15.13 pg in I. camillae Grossh. to 2C = 19.24 pg in I. bismarckiana Damman & Sprenger. We confirmed the overall genome size variation of Oncocyclus irises by co-processing leaves from two individuals with genome sizes that cover nearly the full range of C-values estimated for this section (Figure 2).
In addition to the 50 populations whose genome sizes were assessed in this study, we gathered published data for 53 species ([14,33,34,35,36,37,38,39,40,41,42] from the Plant DNA C-values database release 7.1. [15], and more recently published estimates [43,44]; Table S2). We did not include two accessions of imprecise species identification, I. aff. maracandica (Vved.) Wendelbo and I. aff. orchioides Carrière, nor the I. sofarana accession from [14] that has been reassessed in the present study (see above). The distribution of genome sizes throughout Iris subgenera and sections is depicted in Figure 1.

2.3. Genome Size Evolution in Oncocyclus Section

Ancestral genome size reconstruction suggested that both increases and decreases in genome size have taken place during the evolutionary history of section Oncocyclus (Figure 3), indicating a certain degree of lability of this trait within the 1.27-fold range of variation encountered. Pagel’s λ estimate is close to zero (λ = 5.73 × 10⁻⁵) with a p-value of 1, suggesting that there is essentially no phylogenetic signal in genome size among Oncocyclus irises. Blomberg’s K estimate of <1 indicates that the genome sizes of species are less similar than expected under a random drift model (K = 0.43, p = 0.207). Taken together, these data indicate that the trends in genome size evolution within section Oncocyclus appear largely unrelated to phylogeny, and are also unlikely to be accounted for by random processes alone. The evolutionary model that best fitted our data was the speciational model (pure phylogenetic/equal model; Table 2), where changes in genome size appear to occur most frequently during speciation events.

3. Discussion

3.1. Iris Displays a Great Diversity of C-Values but They Are Unequally Distributed across Subgenera and Sections

This study increased the number of species with available genome size data from 53 to 89, raising the coverage from c. 20% up to c. 34% of species. Despite nearly doubling the number of species with C-value data, the overall range in C-values remained unchanged (2.1–56.4 pg/2C; i.e., 26.86-fold). Yet this study has highlighted, for the first time, the very unequal distribution of genome size diversity across the different Iris subgenera and sections which currently have genome size data (Figure 1). Such findings suggest that lineage-specific patterns of genome size diversification have taken place within Iris. Unfortunately, the available phylogenetic and genome size data are still too fragmentary to precisely characterise these patterns and draw any firm conclusion as to their impact on the evolution of Iris as a whole. Nevertheless, we have provided novel insights into this by focusing on section Oncocyclus, given the new genome size estimates provided here and the recent phylogenetic and cytogenetic data of [8,13].
Taken together, Oncocyclus irises are currently the most extensively studied of the Iris sections from a genome size perspective, with data for c. 82% of recognised species, yet they present an extremely narrow C-value range (1.27-fold, 27 out of c. 33 recognised species with genome size), less than half the range encountered in two closely related sections: Regelia (2.84-fold, 5 out of 8 recognised species with genome size) and Iris (2.68-fold, 13 out of c. 42 recognised species with genome size) from the same subgenus. There is currently only one genome size estimate for section Psammiris, and no genome size data for species belonging to the other two sections in subgenus Iris (i.e., Pseudoregelia and Hexapogon), and so insights into genome size diversity in these sections are currently unclear.

3.2. Genome Size Dynamics Could Have Contributed to the Radiation of Oncocyclus Irises

Previous studies have highlighted a very stable karyotype and ribosomal DNA loci number in section Oncocyclus, and postulated karyological and cytogenetic stasis in this group [12,13]. Consistent with this assumption, we uncovered a particularly narrow range of C-values in section Oncocyclus (from 15.13 to 19.24 pg/2C; Table 1). Yet even though the genome size variation is of modest magnitude, the ancestral genome size reconstruction analysis does suggest that there is a certain degree of lability in this trait (as indicated by changes in the colour of the branches in the phylogeny shown in Figure 3), with evidence of increases in 10 species and decreases in 8 species from an ancestral genome size of 17.29 pg/2C (Figure 3).
Furthermore, the fact that the speciational model of trait evolution was the best fit to our data (Table 2) indicates that genome size dynamics have likely participated in the radiation of section Oncocyclus. This may seem surprising at first, given the limited genome size range; however, recent studies have suggested that it is the rate of variation in genome size rather than the absolute genome size value that may play a role in lineage diversification, shifting the emphasis to the importance of genome size lability—or evolvability—as a potential driver contributing to plant evolution [45,46]. The fit of a speciational model for the evolution of a functional trait is usually interpreted in terms of the adaptive value for the trait in question (e.g., spur length [47]). Genome size influences plants in myriad ways, at the nuclear, cellular, whole plant, and community levels. It impacts their phenotypic and ecological spectrums, and hence potentially also affects their evolvability and resilience to environmental change (reviewed in [17]). Such a diversity of effects on traits potentially subject to selection makes it difficult to address the functional outcomes of changes in genome size (with the notable exception of the largest genomes [48]). It is only by gaining insights into different aspects of the radiation of the Oncocyclus irises (at the genetic, genomic, phenotypic, and ecological levels) and by integrating all this information that we will be able to improve our understanding of how genome size has contributed to the diversification of the group.

3.3. Lebanese Populations Attributed to Iris persica (Subgenus Scorpiris) Should Be Segregated into a Distinct Species

This study has brought the first molecular phylogenetic insights into the current debate on the taxonomic status of Lebanese populations previously assigned to I. persica. The phylogenetic data (Figure 1) show that the sample from Turkey falls into a separate, yet well-supported, clade from the Lebanese individuals analysed here, and hence clearly support the consideration of the Lebanese populations as taxonomically distinct from I. persica. This consideration was until now mainly based on differences in chromosome numbers between populations, with 2n = 24 reported for the Lebanese population of Quaa [13], while I. persica from Syria and Turkey presented 2n = 20 and 36, respectively [31,32]. We also found differences in genome size, with 18.89 and 19.05 pg/2C for the two Lebanese populations and 20.99 pg/2C for the Turkish one (Table 1).
It has yet to be determined whether these Lebanese irises correspond to a new species or if they belong to I. wallisiae, as hypothesised by some authors [31]. Unfortunately, I. wallisiae has not been sequenced so far, and its genome size has not been measured either; however, the difference in chromosome numbers observed between the Lebanese irises (2n = 24, [13]) and I. wallisiae (2n = 22, [31]) tends to suggest the existence of a new species.
In order to better understand the evolutionary history of these irises and to clarify their taxonomic status, it is necessary to carry out additional studies on an extended sampling and to consider the possibility of gene flow and hybridisation, which have been reported in other sections of Iris [49,50]. This is not possible with the data presented here, as our phylogeny is based exclusively on plastid markers.

4. Materials and Methods

4.1. Material

Plants studied were collected from natural populations in different regions of Lebanon. Additional accessions were obtained from the living collections and the DNA Bank held at the Royal Botanic Gardens, Kew (RBGK), and from the private collection of Frédéric Dépalle. Table 1 gives the provenance of the 50 Iris populations sampled for genome size, and Table S1 the provenance of the 23 Iris populations sampled for the molecular phylogenetic analyses.

4.2. Molecular Phylogenetic Reconstruction

DNA was isolated from 50–170 mg of frozen or fresh leaves using a modified cetyltrimethyl ammonium bromide (CTAB) method [51]. Plastid trnL-trnF and matK-trnK regions were amplified using the primers trnL-c (5′-CGAAATCGGTAGACGCTACG-3′) and trnL-f (5′-ATTTGAACTGGTGACACGAG-3’) [52], matK19F (5′-CGTTCTGACCATATTGCACTATG-3′) [53], and trnK-2R (5′-AACTAGTCGGATGGAGTAG-3′) [54]. PCR reactions were performed in a volume of 50 µL containing 10 µL of 5× Phire Reaction Buffer, 10 mM of each dNTP, 100 µM primers, 20–50 ng genomic DNA template, and 1 µL Phire Hot Start II DNA Polymerase (F122-S, Thermo Fisher Scientific Inc., Waltham, MA, USA). The PCR program had an initial strand separation step at 98 °C for 30 s, followed by 35 cycles of denaturation at 98 °C for 5 s, annealing at 57 °C for 5 s, and elongation at 72 °C for 15 s; the final step was at 72 °C for 1 min. Purified PCR products were sequenced by Eurofins MWG, France using the Sanger method on an ABI 3730xL platform.
The dataset, comprising the new sequences generated here together with sequences obtained from GenBank, was aligned using the default settings on the Guidance webserver [55] and manually adjusted with BioEdit software [56]. It comprises the matK-trnK region for 117 accessions (representing 1842 characters) and the trnL-trnF region for 94 accessions (1028 characters). Dietes robinsoniana (F.Muell.) Klatt was included in the analysis as an outgroup species. Bayesian inference (BI) was carried out using MrBayes version 3.1.2 [57] on the CIPRES server [58] with partitions by region (trnL-trnF, matK, and trnK) and, when applicable, by codon position. The best-fit model of nucleotide substitutions selected with jModelTest 0.1 [59,60] using the Akaike Information Criterion (AIC) was GTR + I + G for all region partitions. For each analysis, four Markov chains were run simultaneously for 30 × 106 generations, and these were sampled every 700 generations. Analyses were checked for convergence in Tracer v.1.6 [61]. Data from the first 10,000 generations were discarded as the burn-in period in each analysis, and the remaining pooled samples were used to build the 50% majority rule consensus trees and to calculate the posterior probability (PP) of nodes.

4.3. DNA Content Assessment

Genome size was measured using the one-step flow cytometry procedure [62] with modifications as described in [14], or, for RBGK accessions, as described in [63], with a Partec Cyflow SL3 flow cytometer (Partec GmbH, Münster, Germany). For each species studied, Table 1 gives information on the specific plant species used as the calibration standard and the specific extraction buffer. Only estimates where the peak quality, expressed as a coefficient of variation (CV%), was less than 5% were considered acceptable.

4.4. Tempo and Mode of Character Evolution

Box-plots showing the distribution of genome size values in the nine subgenera of Iris and four sections within subgenus Iris were generated with the package ggplot2 [64] implemented in R v.3.2.2 [65] using the new genome size assessments together with previously published data (Table S2).
Analyses focused on section Oncocyclus were conducted using the phylogenetic inference of [8], pruned with BayesTrees v.1.3 [66] to the set of species with available genome sizes, and made ultrametric using the chronos function in the package ape [67] implemented in R v.3.2.2 [65]. Subspecies of I. iberica Steven and I. sofarana were kept in the pruned tree since they do not group with their conspecifics in the phylogeny of [8]. Ancestral character states were reconstructed with the Phytools package of R [68] implemented in R v.3.2.2 [65] under ML using the fastAnc and contMap commands. The strength of the phylogenetic signal for genome size was estimated using Pagel’s λ and Blomberg’s K (phylosig function of Phytools). The Pagel’s λ method is used to transform the original phylogeny (using the λ parameter) so that it best predicts the distribution of a given trait on the phylogeny under a Brownian Motion model of trait evolution [69]. The null hypothesis is λ = 0, indicating no phylogenetic signal. Blomberg’s K method quantifies the degree to which variation in a trait is predicted by the structure of a given phylogeny under a Brownian Motion model of trait evolution [69]. The continuous-character model evaluation and testing (CoMET) module [70] implemented in MESQUITE V. 3.61 [71] was used with default parameters to determine which model of evolution best fitted our data.

5. Conclusions

This study provides new insights into genome size evolution in Iris at different taxonomic levels (i.e., genus and section), and advocates for continuing the effort to complete the coverage of C-value data within the genus. As our understanding of genome size dynamics grows, it is increasingly clear that genome size is an essential trait that should be taken into account in the study of evolutionary processes [17,21,72].

Supplementary Materials

The following are available online at https://www.mdpi.com/2223-7747/9/12/1687/s1, Table S1, GenBank accession numbers of the Iris sequenced in this study. Table S2, compendium of genome size data (2C-values) currently available for Iris, together with information on the subgeneric and sectional assignments of each species.

Author Contributions

Conceptualisation, M.B.D.-K.; methodology, N.A.S., O.H., E.S., and S.S.-Y.; formal analysis, O.H.; investigation, N.A.S., O.H., E.S., S.S.-Y., I.J.L., and M.B.D.-K.; resources: M.B.D.-K, K.S.; writing—original draft preparation, O.H.; writing—review and editing, O.H., S.S.-Y., I.J.L., and M.B.D.-K.; project administration, M.B.D.-K.; funding acquisition, M.B.D.-K. All authors have read and agreed to the published version of the manuscript.

Funding

This work was subsidised by the National Council for Scientific Research Lebanon under Grant [01-06-08] and the Research Council of Saint Joseph University under Grant FS 56. O.H. was supported by a Marie Skłodowska-Curie Action Individual Fellowship (grant agreement n°657918) and a Ramón y Cajal Fellowship (RYC-2016-21176).

Acknowledgments

We thank Frédéric Dépalle for providing materials, Georges Tohmé and Nasser Chreif for their help in field collection, Mickael Bourge and Mario Gomez Pacheco for technical support in flow cytometry, and Benjamin Coquillas for help in figure processing. The DNA bank and the living collections of the Royal Botanic Gardens, Kew, are also acknowledged. We thank the reviewers for their comments and suggestions.

Conflicts of Interest

The authors declare no conflict of interest.

References

  1. Rix, M. Section Oncocyclus. In A Guide to Species Irises; The Species Group of the British Iris Society; Cambridge Press: London, UK, 1997. [Google Scholar]
  2. Sapir, Y.; Shmida, A.; Ne’eman, G. Pollination of Oncocyclus irises (Iris: Iridaceeae) by night-sheltering male bees. Plant Biol. 2005, 7, 417–424. [Google Scholar] [CrossRef] [PubMed]
  3. Sapir, Y.; Shmida, A.; Ne’eman, G. Morning floral heat as a reward to the pollinators of the Oncocyclus irises. Oecologia 2006, 147, 53–59. [Google Scholar] [CrossRef] [PubMed]
  4. Vereecken, N.J.; Wilson, C.A.; Hötling, S.; Schulz, S.; Banketov, S.A.; Mardulyn, P. Pre-adaptations and the evolution of pollination by sexual deception: Cope’s rule of specialization revisited. Proc. R. Soc. B Biol. Sci. 2012, 279, 4786–4794. [Google Scholar] [CrossRef] [PubMed] [Green Version]
  5. Lavi, R.; Sapir, Y. Are pollinators the agents of selection for the extreme large size and dark color in Oncocyclus irises? New Phytol. 2015, 205, 369–377. [Google Scholar] [CrossRef] [PubMed]
  6. Vereecken, N.J.; Dorchin, A.; Dafni, A. Reply to Lavi & Sapir (2015): Floral colour and pollinator-mediated selection in Oncocyclus irises (Iridaceae). New Phytol. 2015, 207, 948–949. [Google Scholar] [PubMed] [Green Version]
  7. Sapir, Y.; Shmida, A. Species concepts and ecogeographical divergence of Oncocyclus irises. Isr. J. Plant Sci. 2002, 50, 119–127. [Google Scholar] [CrossRef]
  8. Wilson, C.A.; Padiernos, J.; Sapir, Y. The royal irises (Iris subg. Iris sect. Oncocyclus): Plastid and low-copy nuclear data contribute to an understanding of their phylogenetic relationships. Taxon 2016, 65, 35–46. [Google Scholar] [CrossRef] [Green Version]
  9. Cohen, O.; Avishai, M. The irises still exist: The conservation status of species Iris section Oncocyclus in Israel, a century after their description. Ann. Bot. 2000, 58, 145–160. [Google Scholar] [CrossRef]
  10. Saad, L.; Talhouk, S.N.; Mahy, G. Decline of endemic Oncocyclus irises (Iridaceae) of Lebanon: Survey and conservation needs. Oryx 2009, 43, 91–96. [Google Scholar] [CrossRef] [Green Version]
  11. Goldblatt, P.; Takei, M. Chromosome cytology of Iridaceae-patterns of variation, determination of ancestral base numbers, and mode of karyotype change. Ann. Mo. Bot. Gard. 1997, 84, 285–304. [Google Scholar] [CrossRef]
  12. Avishai, M.; Zohary, D. Chromosome in the Oncocyclus irises. Bot. Gaz. 1977, 138, 502–511. [Google Scholar] [CrossRef]
  13. Abdel Samad, N.; Bou Dagher-Kharrat, M.; Hidalgo, O.; El Zein, R.; Douaihy, B.; Siljak-Yakovlev, S. Unlocking the karyological and cytogenetic diversity of Iris from Lebanon: Oncocyclus section shows a distinctive profile and relative stasis during its continental radiation. PLoS ONE 2016, 11, e0160816. [Google Scholar] [CrossRef] [PubMed]
  14. Bou Dagher-Kharrat, M.; Abdel Samad, N.; Douaihy, B.; Bourge, M.; Fridlender, A.; Siljak-Yakovlev, S.; Brown, S.C. Nuclear DNA C-values for biodiversity screening: Case of the Lebanese flora. Plant Biosyst. 2013, 147, 1228–1237. [Google Scholar] [CrossRef]
  15. Leitch, I.J.; Johnston, E.; Pellicer, J.; Hidalgo, O.; Bennett, M.D. Plant DNA C-values Database, Release 7.1. 2019. Available online: https://cvalues.science.kew.org (accessed on 9 September 2020).
  16. Pellicer, J.; Leitch, I.J. The Plant DNA C-values database (release 7.1): An updated online repository of plant genome size data for comparative studies. New Phytol. 2019, 226, 301–305. [Google Scholar] [CrossRef] [PubMed] [Green Version]
  17. Pellicer, J.; Hidalgo, O.; Dodsworth, S.; Leitch, I.J. Genome size diversity and its impact on the evolution of land plants. Genes 2018, 9, 88. [Google Scholar] [CrossRef] [Green Version]
  18. Kapralov, M.V.; Stift, M.; Filatov, D.A. Evolution of genome size in Hawaiian endemic genus Schiedea (Caryophyllaceae). Trop. Plant Biol. 2009, 2, 77–83. [Google Scholar] [CrossRef]
  19. Garnatje, T.; Hidalgo, O.; Vitales, D.; Pellicer, J.; Vallès, J.; Robin, O.; Garcia, S.; Siljak-Yakovlev, S. Swarm of terminal 35S in Cheirolophus (Asteraceae, Centaureinae). Genome 2012, 55, 529–535. [Google Scholar] [CrossRef]
  20. Hidalgo, O.; Vitales, D.; Vallès, J.; Garnatje, T.; Siljak-Yakovlev, S.; Leitch, I.J.; Pellicer, J. Cytogenetic insights into an oceanic island radiation: The dramatic evolution of pre-existing traits in Cheirolophus (Asteraceae, Cardueae-Centaureinae). Taxon 2017, 66, 146–157. [Google Scholar] [CrossRef]
  21. Naciri, Y.; Linder, H.P. The genetics of evolutionary radiations. Biol. Rev. 2020, 95, 1055–1072. [Google Scholar] [CrossRef]
  22. Guo, J.; Wilson, C.A. Molecular phylogeny of crested Iris based on five plastid markers (Iridaceae). Syst. Bot. 2013, 38, 987–995. [Google Scholar] [CrossRef]
  23. Ikinci, N.; Hall, T.; Lledo, M.D.; Clarkson, J.J.; Tillie, N.; Seisums, A.; Saito, T.; Harley, M.; Chase, M.W. Molecular phylogenetics of the juno irises, Iris subgenus Scorpiris (Iridaceae), based on six plastid markers. Bot. J. Linn. Soc. 2011, 167, 281–300. [Google Scholar] [CrossRef]
  24. Wilson, C.A. 2011. Subgeneric classification in Iris re-examined using chloroplast sequence data. Taxon 2011, 60, 27–35. [Google Scholar] [CrossRef]
  25. Doležel, J.; Greilhuber, J.; Lucretti, S.; Meister, A.; Lysák, M.A.; Nardi, L.; Obermayer, R. Plant genome size estimation by flow cytometry: Inter-laboratory comparison. Ann. Bot. 1998, 82, 17–26. [Google Scholar] [CrossRef] [Green Version]
  26. Garcia, S.; Garnatje, T.; Twibell, J.D.; Vallès, J. Genome size variation in the Artemisia arborescens complex (Asteraceae, Anthemideae) and its cultivars. Genome 2006, 49, 244–253. [Google Scholar] [CrossRef] [Green Version]
  27. Marie, D.; Brown, S.C. A cytometric exercise in plant DNA histograms, with 2C values for 70 species. Biol. Cell 1993, 78, 41–51. [Google Scholar] [CrossRef]
  28. Loureiro, J.; Rodriguez, E.; Doležel, J.; Santos, C. Two new nuclear isolation buffers for plant DNA flow cytometry: A test with 37 species. Ann. Bot. 2007, 100, 875–888. [Google Scholar] [CrossRef] [PubMed] [Green Version]
  29. Galbraith, D.W.; Harkins, K.R.; Maddox, J.M.; Ayres, N.M.; Sharma, D.P.; Firoozabady, E. Rapid flow cytometry analysis of the cell cycle in intact plant tissues. Science 1993, 220, 1049–1051. [Google Scholar] [CrossRef] [PubMed]
  30. Rice, A.; Glick, L.; Abadi, S.; Einhorn, M.; Kopelman, N.M.; Salman-Minkov, A.; Mayzel, J.; Chay, O.; Mayrose, I. The Chromosome Counts Database (CCDB)-a community resource of plant chromosome numbers. New Phytol. 2015, 206, 19–26. [Google Scholar] [CrossRef]
  31. Hall, T.; Seisums, A. 793. Iris wallisiae: Iridaceae. Curtis’s Bot. Mag. 2014, 31, 238–248. [Google Scholar] [CrossRef]
  32. Jozghasemi, S.; Rabiei, V.; Soleymani, A.; Khalighi, A. Karyotype analysis of seven Iris species native to Iran. Caryologia 2016, 69, 351–361. [Google Scholar] [CrossRef] [Green Version]
  33. Bai, C.; Alverson, W.S.; Follansbee, A.; Waller, D.M. New reports of nuclear DNA content for 407 vascular plant taxa from the United States. Ann. Bot. 2012, 110, 1623–1629. [Google Scholar] [CrossRef] [PubMed]
  34. Goldblatt, P.; Walbot, V.; Zimmer, E.A. Estimation of genome size (C-value) in Iridaceae by cytophotometry. Ann. Mo. Bot. Gard. 1984, 71, 176–180. [Google Scholar] [CrossRef]
  35. Kentner, E.K.; Arnold, M.L.; Wessler, S.R. Characterization of high-copy-number retrotransposons from the large genomes of the Louisiana iris species and their use as molecular markers. Genetics 2003, 164, 685–697. [Google Scholar] [PubMed]
  36. Olszewska, M.J.; Osiecka, R. The relationship between 2C DNA content, life cycle type, systematic position, and the level of DNA endoreplication in nuclei of parenchyma cells during growth and differentiation of roots in some monocotyledonous species. Biochem. Physiol. Pflanz. 1982, 177, 319–336. [Google Scholar] [CrossRef]
  37. Pustahija, F.; Brown, S.C.; Bogunić, F.; Bašić, N.; Muratović, E.; Ollier, S.; Hidalgo, O.; Bourge, M.; Stevanović, V.; Siljak-Yakovlev, S. Small genomes dominate in plants growing on serpentine soils in West Balkans, an exhaustive study of 8 habitats covering 308 taxa. Plant Soil 2013, 373, 427–453. [Google Scholar] [CrossRef]
  38. Siljak-Yakovlev, S.; Pustahija, F.; Šolić, E.M.; Bogunić, F.; Muratović, E.; Bašić, N.; Catrice, O.; Brown, C.S. Towards a database of genome size and chromosome number of Balkan flora: C-values in 343 taxa with novel values for 252. Adv. Sci. Lett. 2010, 3, 190–213. [Google Scholar] [CrossRef]
  39. Šmarda, P.; Bureš, P.; Horová, L.; Leitch, I.J.; Mucina, L.; Pacini, E.; Tichý, L.; Grulich, V.; Rotreklová, O. Ecological and evolutionary significance of genomic GC content diversity in monocots. Proc. Natl. Acad. Sci. USA 2014, 111, E4096–E4102. [Google Scholar] [CrossRef] [Green Version]
  40. Veselý, P.; Bureš, P.; Šmarda, P.; Pavlíček, T. Genome size and DNA base composition of geophytes: The mirror of phenology and ecology? Ann. Bot. 2012, 109, 65–75. [Google Scholar] [CrossRef] [Green Version]
  41. Zhang, L.; Cao, B.; Bai, C. New reports of nuclear DNA content for 66 traditional Chinese medicinal plant taxa in China. Caryologia 2013, 66, 375–383. [Google Scholar] [CrossRef]
  42. Zonneveld, B.J.; Leitch, I.J.; Bennett, M.D. First nuclear DNA amounts in more than 300 angiosperms. Ann. Bot. 2005, 96, 229–244. [Google Scholar] [CrossRef] [Green Version]
  43. Choi, B.; Weiss-Schneeweiss, H.; Temsch, E.M.; So, S.; Myeong, H.H.; Jang, T.S. Genome size and chromosome number evolution in Korean Iris L. species (Iridaceae Juss.). Plants 2020, 9, 1284. [Google Scholar] [CrossRef] [PubMed]
  44. Weber, T.; Jakše, J.; Sladonja, B.; Hruševar, D.; Landeka, N.; Brana, S.; Bohanec, B.; Milović, M.; Vladović, D.; Mitić, B.; et al. Molecular study of selected taxonomically critical taxa of the genus Iris L. from the broader Alpine-Dinaric area. Plants 2020, 9, 1229. [Google Scholar] [CrossRef] [PubMed]
  45. Puttick, M.N.; Clark, J.; Donoghue, P.C. Size is not everything: Rates of genome size evolution, not C-value, correlate with speciation in angiosperms. Proc. R. Soc. B Biol. Sci. 2015, 282, 20152289. [Google Scholar] [CrossRef] [PubMed] [Green Version]
  46. Igea, J.; Miller, E.F.; Papadopulos, A.S.; Tanentzap, A.J. Seed size and its rate of evolution correlate with species diversification across angiosperms. PLoS Biol. 2017, 15, e2002792. [Google Scholar] [CrossRef] [Green Version]
  47. Fernández-Mazuecos, M.; Blanco-Pastor, J.L.; Juan, A.; Carnicero, P.; Forrest, A.; Alarcón, M.; Vargas, P.; Glover, B.J. Macroevolutionary dynamics of nectar spurs, a key evolutionary innovation. New Phytol. 2019, 222, 1123–1138. [Google Scholar] [CrossRef]
  48. Hidalgo, O.; Pellicer, J.; Christenhusz, M.; Schneider, H.; Leitch, A.R.; Leitch, I.J. Is there an upper limit to genome size? Trends Plant Sci. 2017, 22, 567–573. [Google Scholar] [CrossRef]
  49. Wang, H.; Talavera, M.; Min, Y.; Flaven, E.; Imbert, E. Neutral processes contribute to patterns of spatial variation for flower colour in the Mediterranean Iris lutescens (Iridaceae). Ann. Bot. 2016, 117, 995–1007. [Google Scholar] [CrossRef] [Green Version]
  50. Sung, C.J.; Bell, K.L.; Nice, C.C.; Martin, N.H. Integrating Bayesian genomic cline analyses and association mapping of morphological and ecological traits to dissect reproductive isolation and introgression in a Louisiana Iris hybrid zone. Mol. Ecol. 2018, 27, 959–978. [Google Scholar] [CrossRef]
  51. Doyle, J.J.; Doyle, J.L. Genomic plant DNA preparation from fresh tissue-CTAB method. Phytochem. Bull. 1987, 19, 11–15. [Google Scholar]
  52. Taberlet, P.; Gielly, L.; Pautou, G.; Bouvet, J. Universal primers for amplification of three non-coding regions of chloroplast DNA. Plant Mol. Biol. 1991, 17, 1105–1109. [Google Scholar] [CrossRef]
  53. Gravendeel, B.; Chase, M.W.; de Vogel, E.F.; Roos, M.C.; Mes, T.H.; Bachmann, K. Molecular phylogeny of Coelogyne (Epidendroideae; Orchidaceae) based on plastid RFLPs, matK, and nuclear ribosomal ITS sequences: Evidence for polyphyly. Am. J. Bot. 2001, 88, 1915–1927. [Google Scholar] [CrossRef] [PubMed]
  54. Johnson, L.A.; Soltis, D.E. matK DNA sequences and phylogenetic reconstruction in Saxifragaceae s. str. Syst. Bot. 1994, 19, 143–156. [Google Scholar] [CrossRef]
  55. Penn, O.; Privman, E.; Ashkenazy, H.; Landan, G.; Graur, D.; Pupko, T. GUIDANCE: A web server for assessing alignment confidence scores. Nucleic Acids Res. 2010, 38, W23–W28. [Google Scholar] [CrossRef] [PubMed] [Green Version]
  56. Hall, T.A. BioEdit Software, Version 5.0.9; North Carolina State University: Raleigh, NC, USA, 1999. [Google Scholar]
  57. Ronquist, F.; Huelsenbeck, J.P. MrBayes 3: Bayesian phylogenetic inference under mixed models. Bioinformatics 2003, 19, 1572–1574. [Google Scholar] [CrossRef] [PubMed] [Green Version]
  58. Miller, M.A.; Pfeiffer, W.; Schwartz, T. Creating the CIPRES Science Gateway for inference of large phylogenetic trees. In Proceedings of the 2010 Gateway Computing Environments Workshop (GCE), New Orleans, LA, USA, 14 November 2010; pp. 1–8. [Google Scholar] [CrossRef] [Green Version]
  59. Posada, D. jModelTest: Phylogenetic model averaging. Mol. Biol. Evol. 2008, 25, 1253–1256. [Google Scholar] [CrossRef] [PubMed]
  60. Guindon, S.; Gascuel, O. A simple, fast, and accurate algorithm to estimate large phylogenies by maximum likelihood. Syst. Biol. 2003, 52, 696–704. [Google Scholar] [CrossRef] [Green Version]
  61. Rambaut, A.; Drummond, A.J. Tracer v1.4. 2007. Available online: http://beast.bio.ed.ac.uk/Tracer (accessed on 1 October 2014).
  62. Doležel, J.; Greilhuber, J.; Suda, J. Estimation of nuclear DNA content in plants using flow cytometry. Nat. Protoc. 2007, 2, 2233. [Google Scholar] [CrossRef]
  63. Clark, J.; Hidalgo, O.; Pellicer, J.; Liu, H.; Marquardt, J.; Robert, Y.; Christenhusz, M.; Zhang, S.; Gibby, M.; Leitch, I.J.; et al. Genome evolution of ferns: Evidence for relative stasis of genome size across the fern phylogeny. New Phytol. 2016, 210, 1072–1082. [Google Scholar] [CrossRef] [Green Version]
  64. Wickham, H. ggplot2: Elegant Graphics for Data Analysis; Springer-Verlag: New York, NY, USA, 2016. [Google Scholar]
  65. R Core Team. R: A language and Environment for Statistical Computing; Foundation for Statistical Computing: Vienna, Austria, 2016. [Google Scholar]
  66. Meade, A. BayesTrees v. 1.3. School of Biological Science; University of Reading: Reading, UK, 2011. [Google Scholar]
  67. Paradis, E.; Claude, J.; Strimmer, K. APE: An R package for analyses of phylogenetics and evolution. Bioinformatics 2004, 20, 289–290. [Google Scholar] [CrossRef] [Green Version]
  68. Revell, L.J. phytools: An R package for phylogenetic comparative biology (and other things). Methods Ecol. Evol. 2012, 3, 217–223. [Google Scholar] [CrossRef]
  69. Swenson, N.G. Comparative methods and phylogenetic signal. In Functional and Phylogenetic Ecology in R; Springer: New York, NY, USA, 2014. [Google Scholar]
  70. Lee, C.; Blay, S.; Mooers, A.Ø.; Singh, A.; Oakley, T.H. CoMET: A Mesquite package for comparing models of continuous character evolution on phylogenies. Evol. Bioinform. 2006, 2, 183–186. [Google Scholar] [CrossRef] [Green Version]
  71. Maddison, W.P.; Maddison, D.R. Mesquite: A Modular System for Evolutionary Analysis; 2011; Available online: http://mesquiteproject.org (accessed on 13 October 2013).
  72. Mitchell, N.; Campbell, L.G.; Ahern, J.R.; Paine, K.C.; Giroldo, A.B.; Witney, K.D. Correlates of hybridization in plants. Evol. Lett. 2019, 3, 570–585. [Google Scholar] [CrossRef] [PubMed] [Green Version]
Figure 1. Majority-rule consensus phylogeny of post-burn trees of Iris resulting from the analysis of the matK-trnK and trnL-trnF combined dataset. Posterior probabilities > 0.50 are indicated on nodes. For sequences gathered from GenBank, the voucher reference is given in brackets after the species name. Infrageneric classification follows [24]. Upper left: boxplots with individual jitter values for genome size accessions, depicting the distribution of mean 2C-values per species (and cytotypes when genome size data suggest different ploidy levels) throughout the Iris subgenera and sections which have genome size data available (Table S2).
Plants 09 01687 g001
Figure 2. Examples of flow histograms obtained from estimating genome sizes in Iris. (A) Flow histogram obtained from analysing I. korolkovii (16.03 pg/2C, peak 2) using Pisum sativum (9.09 pg/2C, peak 1) as the calibration standard. (B) Flow histogram obtained from co-processing I. acutiloba subsp. linolata (16.73 pg/2C, peak 1) and I. sprengeri (19.20 pg/2C, peak 2).
Plants 09 01687 g002
Figure 3. Reconstruction of ancestral genome sizes across the phylogeny of section Oncocyclus together with the geographical locations of the populations studied (left) and pictures illustrating the floral phenotype diversity amongst royal irises (right). Geographical locations of I. iberica subsp. iberica and I. sari accessions, of unknown origin, were taken from the literature. (A) I. antilibanotica. (B) I. atropurpurea (credit: Mat Knight and Zachi Evenor). (C) I. cedretii. (D) I. mariae (credit: חדוה שנדרוביץ). (E) I. paradoxa (credit: C.T. Johansson). (F) I. sari (credit: Zeynel Cebeci). (G) I. sprengeri (credit: Kohran1923). (H) I. westii.
Plants 09 01687 g003
Table 1. Genome size data for the 50 Iris accessions studied in the current work. Where available, chromosome counts and ecological data are given.
Iris (Subgenus, Section, Species)2C in pg (SD) 1St 2Bu 32n 4P 5Origin
Subgenus Iris
Section Oncocyclus
I. acutiloba subsp. acutiloba16.72 (0.17)22201Azerbaijan: Jeyrankechmaz, Leg. F. Dépalle
I. acutiloba subsp. lineolata16.73 (0.10)11201Armenia (RBGK 2012-1109)
I. acutiloba subsp. lineolata15.94 *22201Armenia: Gandja, Leg. F. Dépalle
I. antilibanotica16.83 (0.54)3220 *1Lebanon: Kheibeh-Baalbeck, 1337 m
I. antilibanotica17.05 (0.54)3220 *1Lebanon: Kheibeh-Baalbeck, 1337 m
I. assadiana17.44 (0.56)32201Syria: Sadad, Leg. F. Dépalle
I. atropurpurea18.53 (0.14)11201Israel (RBGK 1998-2808)
I. barnumiae x I. paradoxa f. choschab17.31(0.05)11201Unknown Leg. Ray Drew (RBGK s.n.)
I. bismarckiana18.24 (0.59)3220 *1Lebanon: Sarada, 435 m
I. bismarckiana19.24 (0.54)22201Jordania: Ajloun, Leg. F. Dépalle
I. camillae15.13 (0.49)32201Azerbaijan: Tovuz, Leg. F. Dépalle
I. cedretii16.83 (0.5)3220 *1Lebanon: Bcharre, 1900 m
I. damascene16.44 (0.04)32201Syria: Damas, Leg. F. Dépalle
I. haynei var. jordana16.20 (0.52)32201Jordania: Umm Qais, Leg. F. Dépalle
I. iberica subsp. elegantissima17.89 (0.18)11201Turkey: 2200 m (RBGK 1999-4347)
I. iberica subsp. iberica17.25 (0.05)11201Unknown (RBGK 2002-2632)
I. kirkwoodiae subsp. kirkwoodiae17.83 (0.06)11201Turkey (RBGK 1994-2407)
I. kirkwoodiae17.25 (0.15)22201Syria: St. Simeon, Leg. F. Dépalle
I. lortetii16.53 (0.19)3220 *1Lebanon: Mays el Jabal, 640 m
I. lortetii16.38 (0.29)2,32201Israel: Ayelet-Hashahar, Leg. F. Dépalle
I. mariae15.34 (0.5)32201Israel: Sede Boker, Leg. F. Dépalle
I. meda15.21 (0.49)32201Iran: Baqloujeh Sardar, Leg. F. Dépalle
I. mirabilis15.69 (0.10)22202Iran: Ayerandibi, Leg. F. Dépalle
I. nigricans16.68 *32201Palestine: Bani Naim, Leg. Dr. Khalid Sawalha
I. paradoxa17.32 (0.08)11202Armenia (RBGK 1977-4470)
I. petrana18.17 (0.11)11201Unknown (RBGK 1990-3180)
I. petrana18.01 (0.48)22201Jordania: Shawbak, Leg. F. Dépalle
I. samariae16.56 (0.04)32201Israel: Majdal, Leg. F. Dépalle
I. sari18.03 (0.11)11201Unknown (RBGK 2011-1955)
I. schelkovnikowii16.11 (0.04)22-1Azerbaijan: Mingachevir, Leg. F. Dépalle
I. sofarana subsp. kasruwana16.68 (0.53)3220 *1Lebanon: Ehmej, 1217 m
I. sofarana subsp. sofarana16.22 (0.37)3220 *1Lebanon: Dahr El-Baydar, 1640 m
I. sofarana subsp. sofarana16.90 (0.49)3220 *1Lebanon: Hazzerta, 1530 m
I. sprengeri19.20 (0.16)11-1Turkey: 1000 m (RBGK 2011-1958)
I. westii16.00 (0.75)3220 *1Lebanon: Tawmet Jezzine, 1300 m
I. yeruchamensis16.54 (0.05)32-1Israel: Yerocham, Leg. F. Dépalle
I. yebrudii subsp. yebrudii16.20 (0.11)32201Syria: Yebrud, Leg. F. Dépalle
Section Regelia
I. afghanica14.67 (0.47)32223Afghanistan, Leg. F. Dépalle
I. hoogiana30.31 (0.13)11-3Tajikistan (RBGK 2010-2098)
I. korolkovii16.03 (0.03)41-3Unknown (RBGK 2010-2101)
I. lineata29.77 (0.04)11-3Tajikistan (RBGK 1993-3285)
I. stolonifera30.24 (0.11)11-3Pamir (RBGK 1984-91)
Section Iris
I. albicans24.84 (0.65)3244–483Lebanon: Aley, 880 m
I. scariosa13.09 (0.18)11-3Kazakhstan (RBGK 2014-643)
Section Psammiris
I. bloudovii10.66 (0.13)1116, 263Siberia (RBGK 2004-2257)
Subgenus Limniris
I. longipetala15.84 (0.19)22-3Iran: Jazvanaq, Leg. F. Dépalle
Subgenus Scorpiris
I. persica20.99 (0.05)1120, 363Turkey: 1200 m (RBGK 2014-1875)
I. persica18.89 (0.32)3224 *3Lebanon: Quaa, 700 m
I. persica19.05 *32-3Lebanon: Yammouneh
I. regis-uzziae22.80 (0.03)11203Israel: 500 m (RBGK 1987-2212)
1 Genome size: asterisk indicates when a single measurement has been done. 2 Calibration standard: (1) Allium cepa 2C = 34.89 pg [25], (2) Artemisia arborescens 2C = 11.43 pg [26], (3) Triticum aestivum 2C = 30.90 pg [27], (4) Pisum sativum ‘Ctirad’ 2C = 9.09 pg [25]. 3 Buffer: (1) GPB [28] with 3% PVP-40 and 8% Triton added, (2) Galbraith’s buffer [29]. 4 Chromosome number: asterisk indicates data determined in [13] on the same individuals measured for genome size; other data are from the Chromosome counts database [30], and, for I. persica, from [31,32]. 5 Pollination strategy: (1) shelter mimicry, (2) sexual deception, (3) other pollination strategy, from [4].
Table 2. Evaluation of evolutionary models for genome size in section Oncocyclus by the CoMET module. The best-fitting model (lowest Akaike Information Criterion; AIC) is indicated in bold.
Model
Phylogenetic SignalTempo of Trait ChangeAIC
Distance27.922
Non phylogeneticEqual22.243
Free165.507
Distance25.527
Pure phylogeneticEqual19.454
Free165.702
Distance110.326
PunctuatedEqual32.232
Free142.326
Publisher’s Note: MDPI stays neutral with regard to jurisdictional claims in published maps and institutional affiliations.

