Excess Copper-Induced Alterations of Protein Profiles and Related Physiological Parameters in Citrus Leaves

 ,
, 
Abstract
:1. Introduction
2. Results
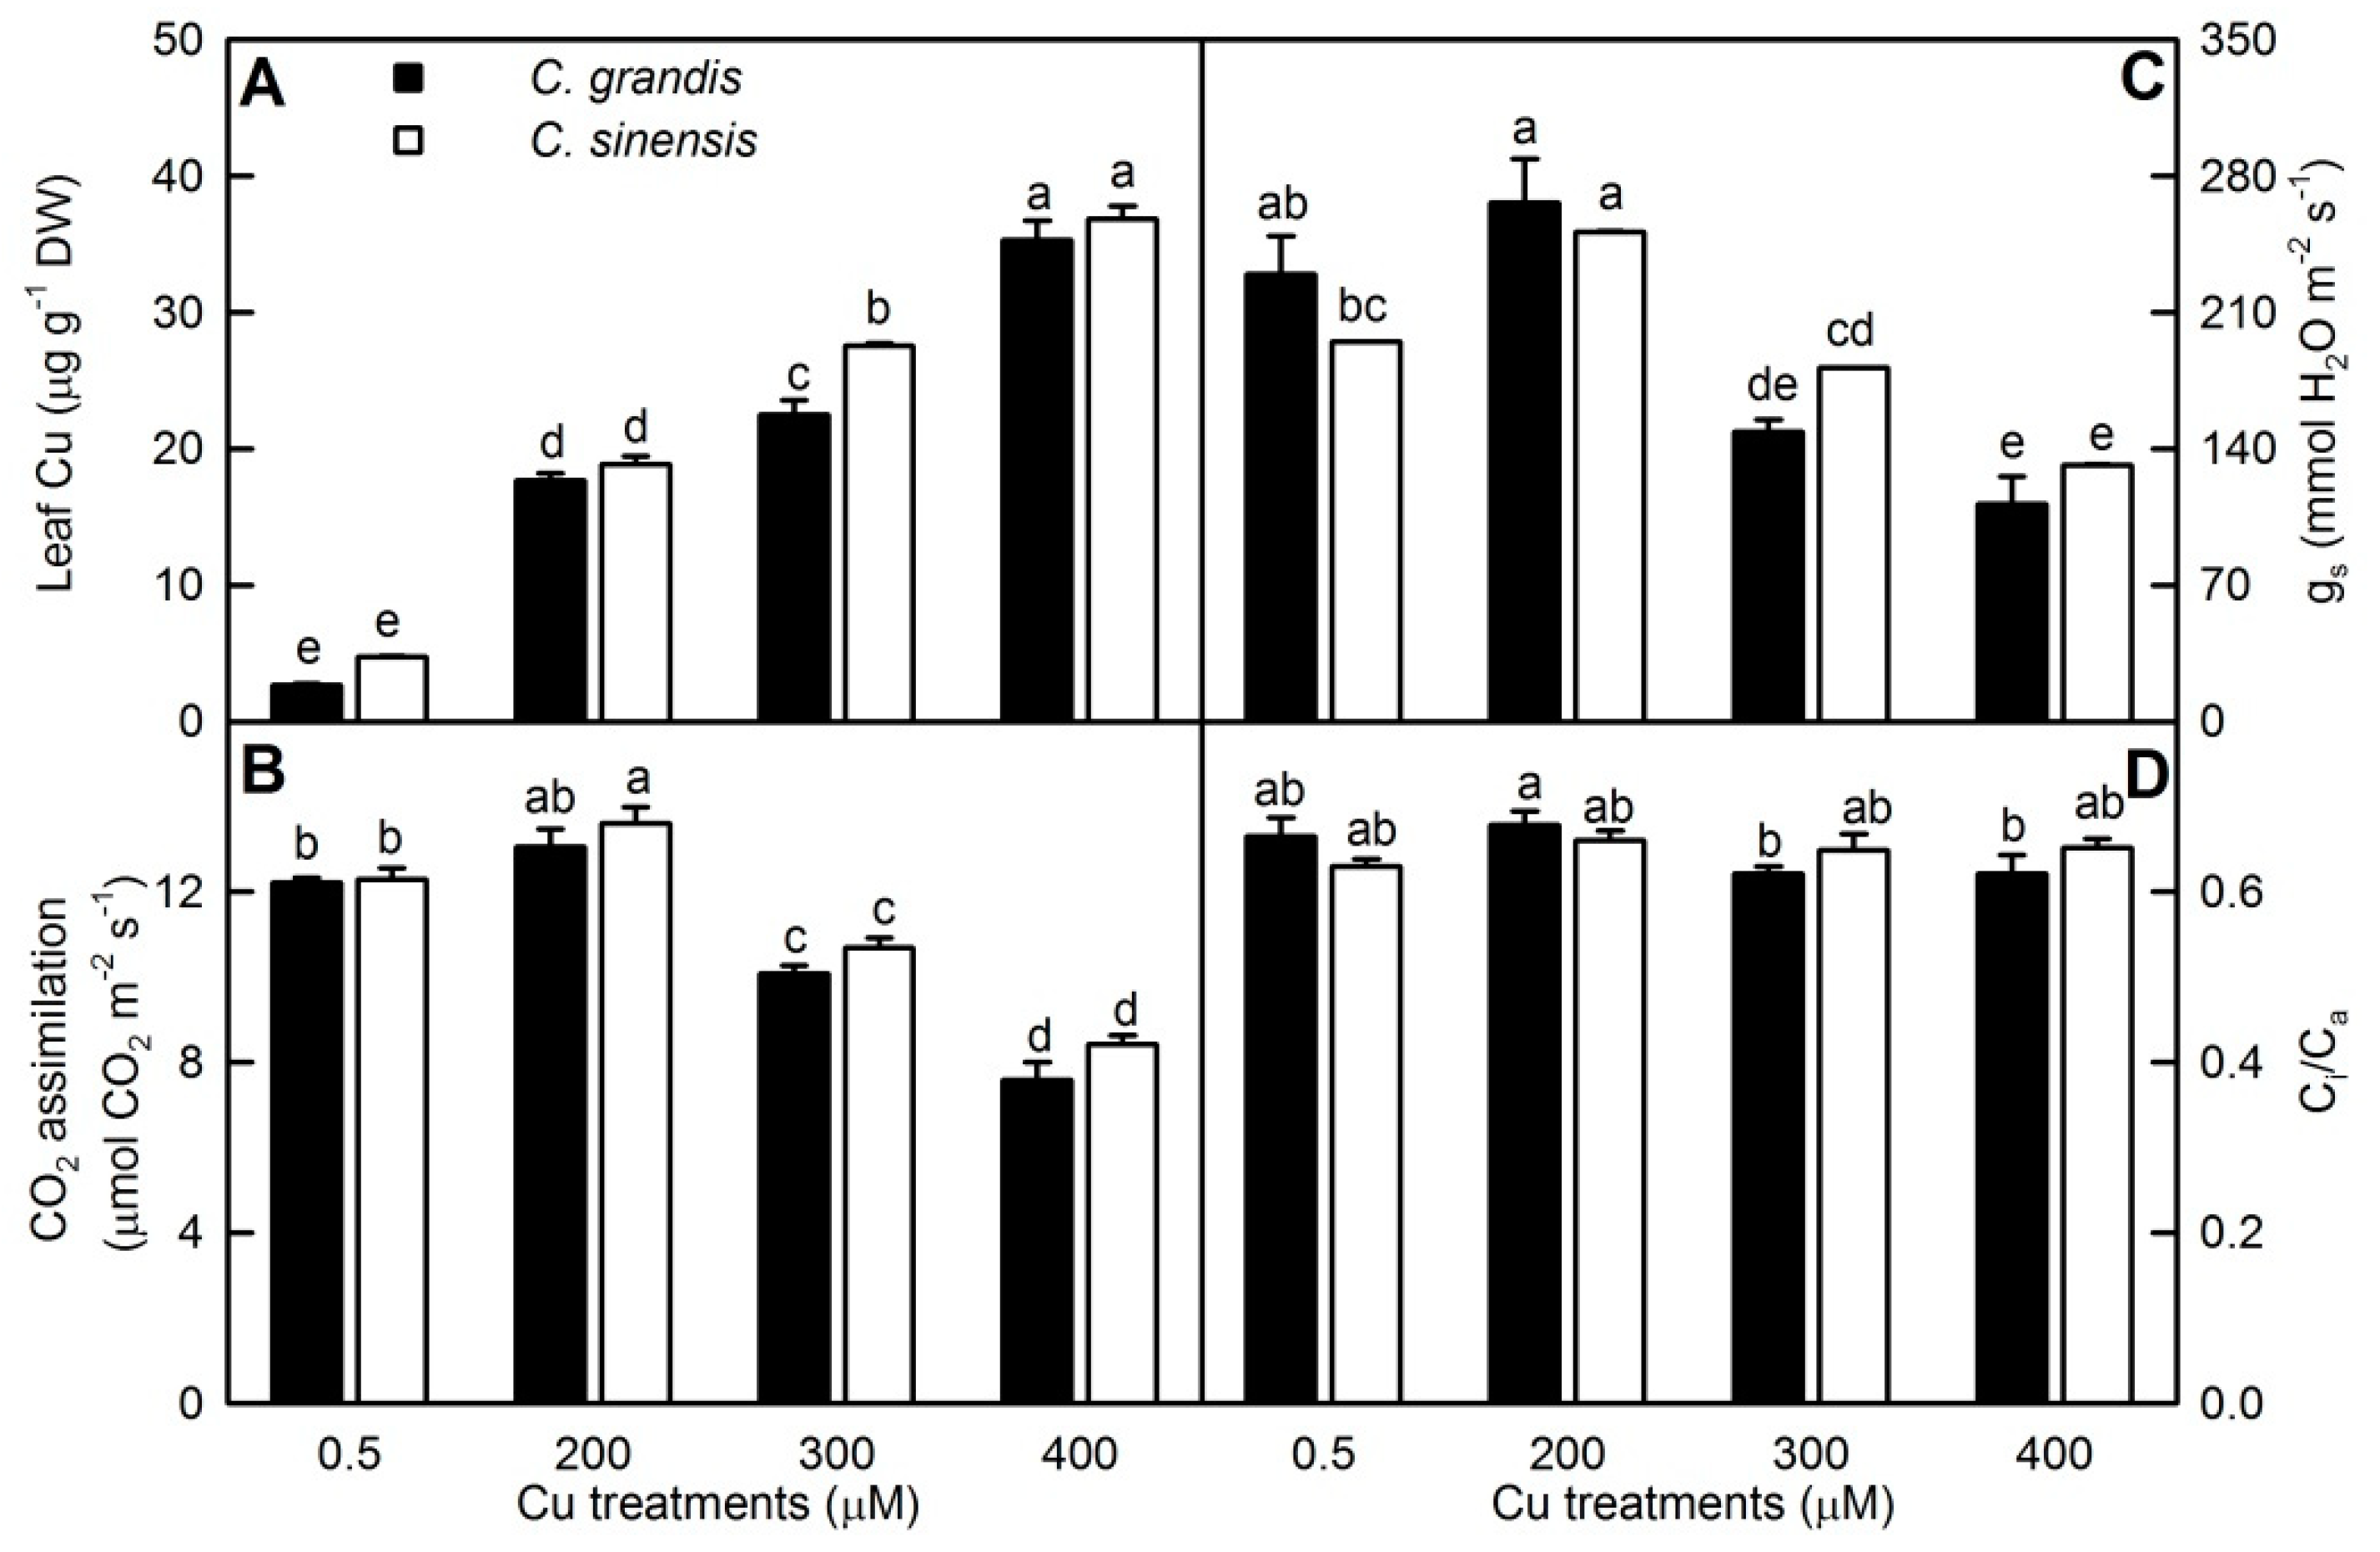
2.1. Excess Cu-Effects on Seedling Growth, Leaf Cu and Gas Exchange
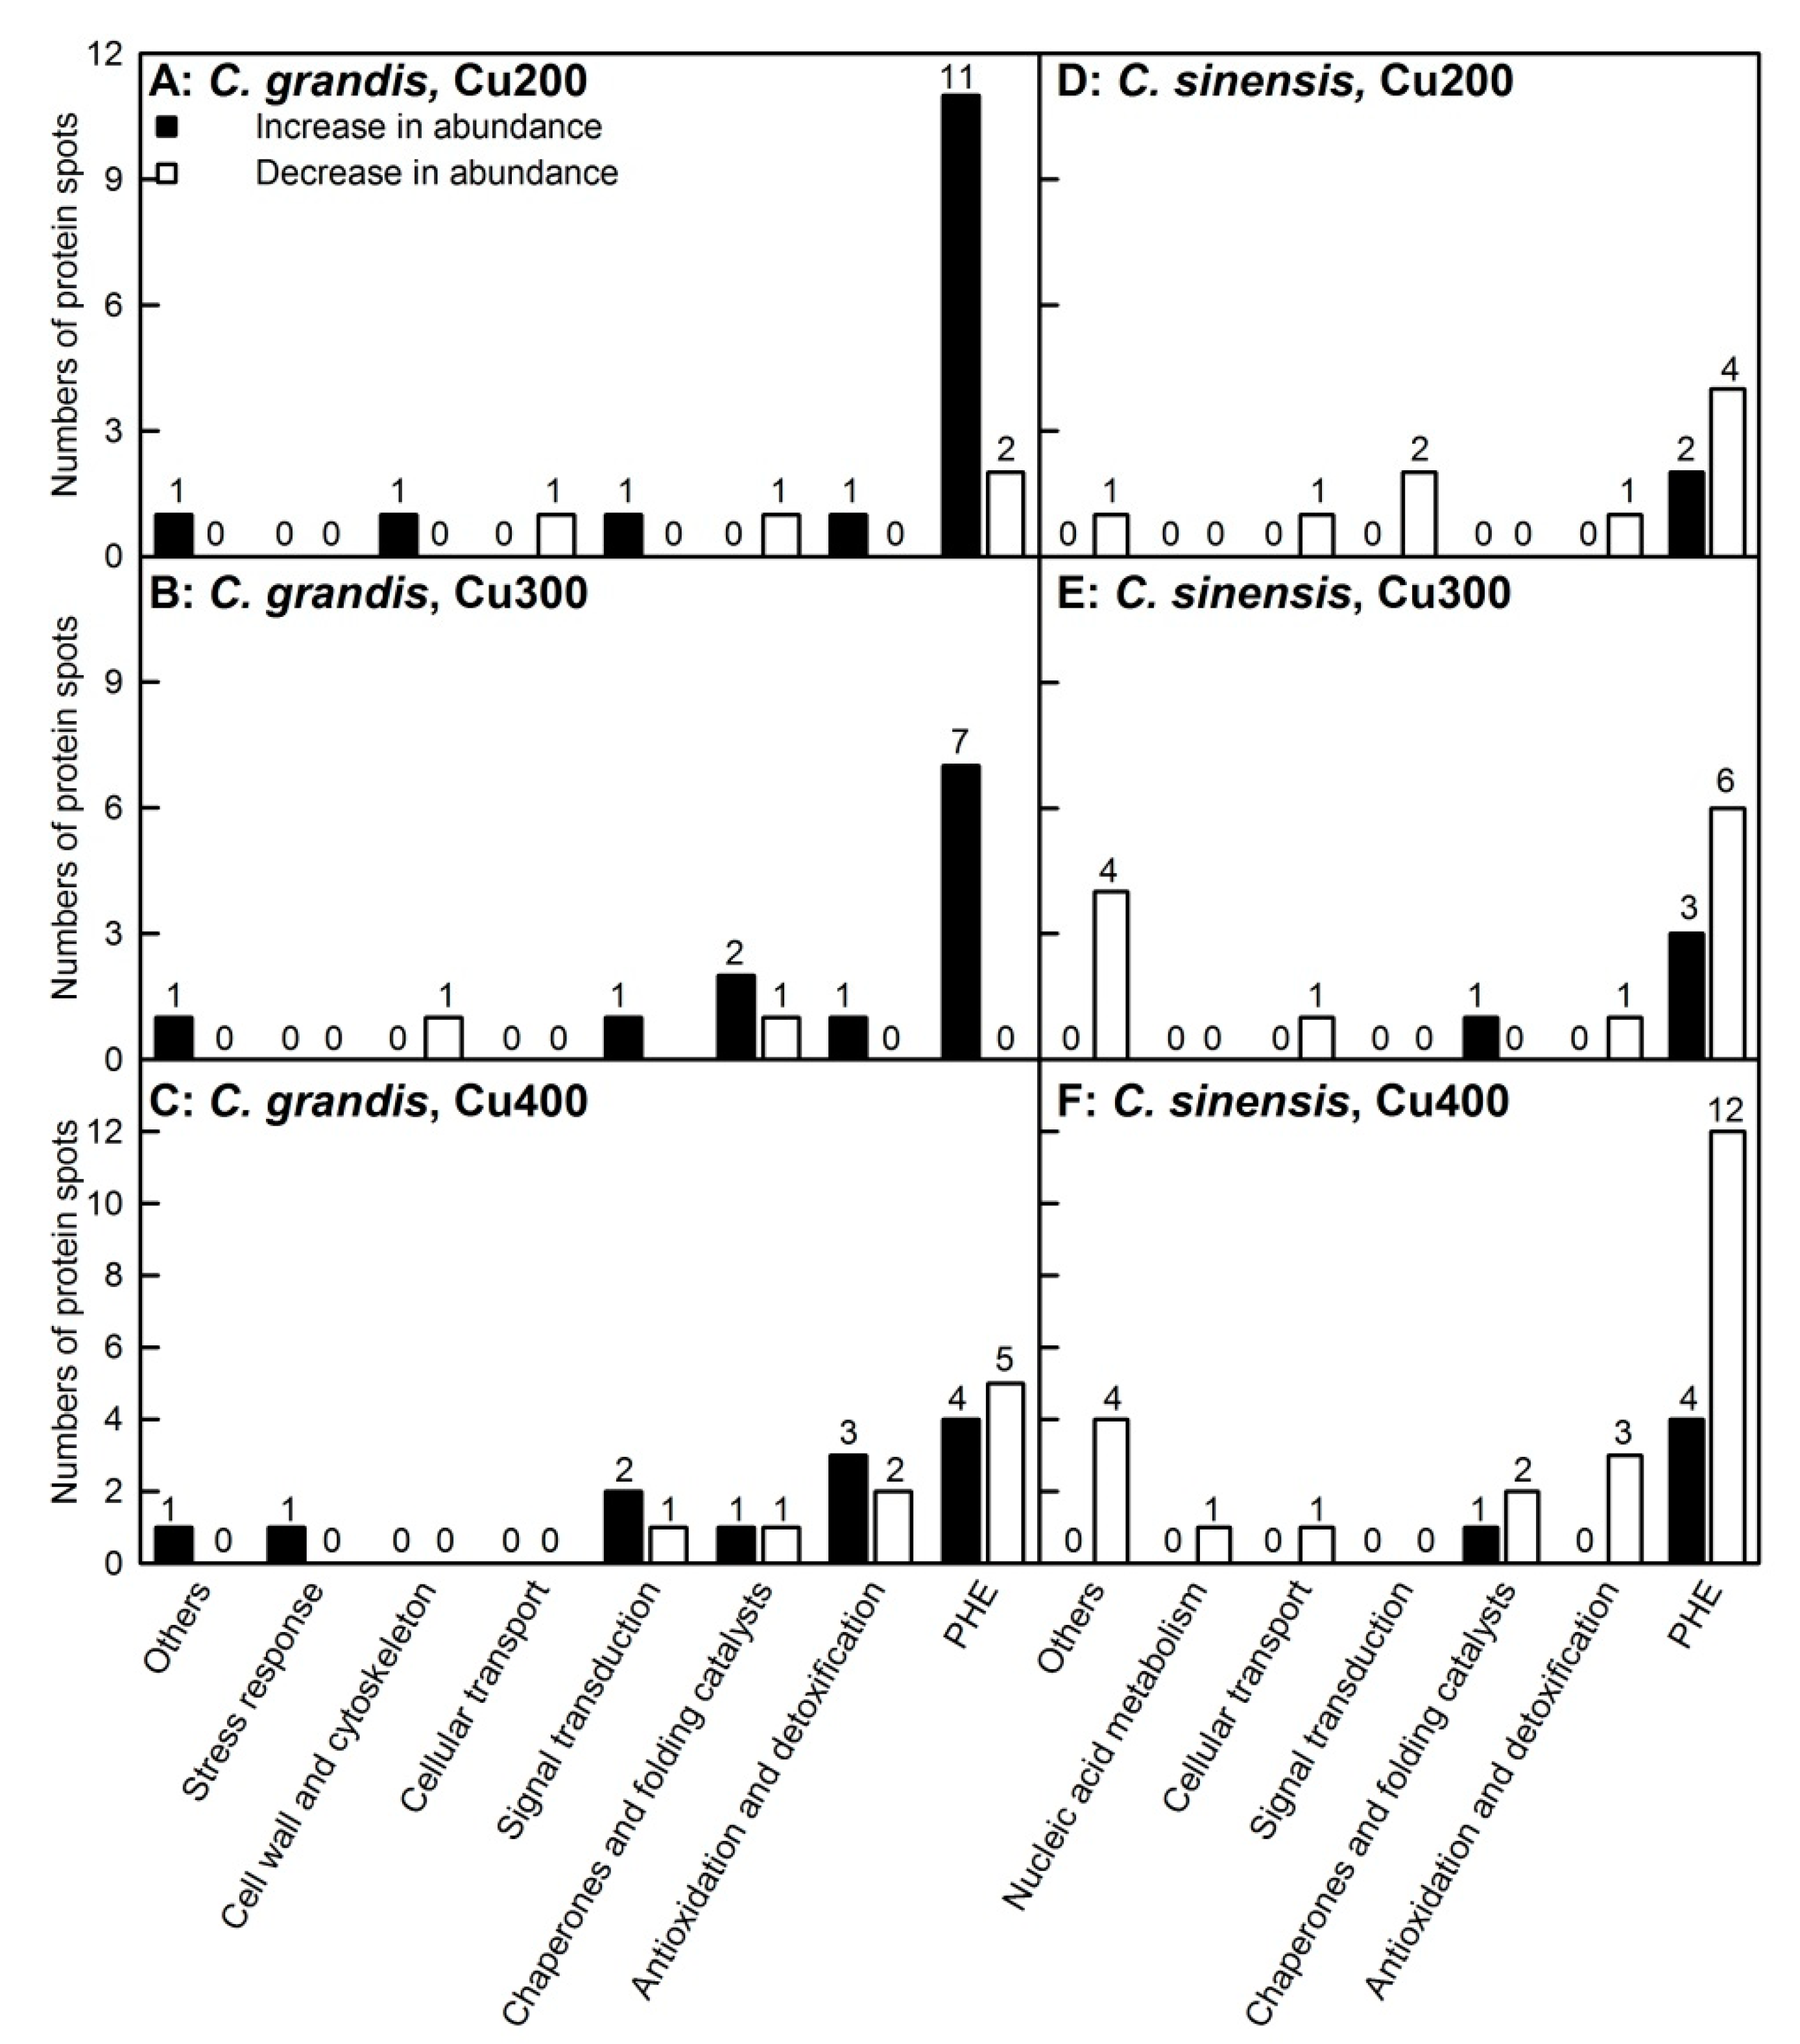
2.2. Protein Yield and Cu-responsive Proteins in Leaves
2.3. KEGG Pathway Analysis of DAPs
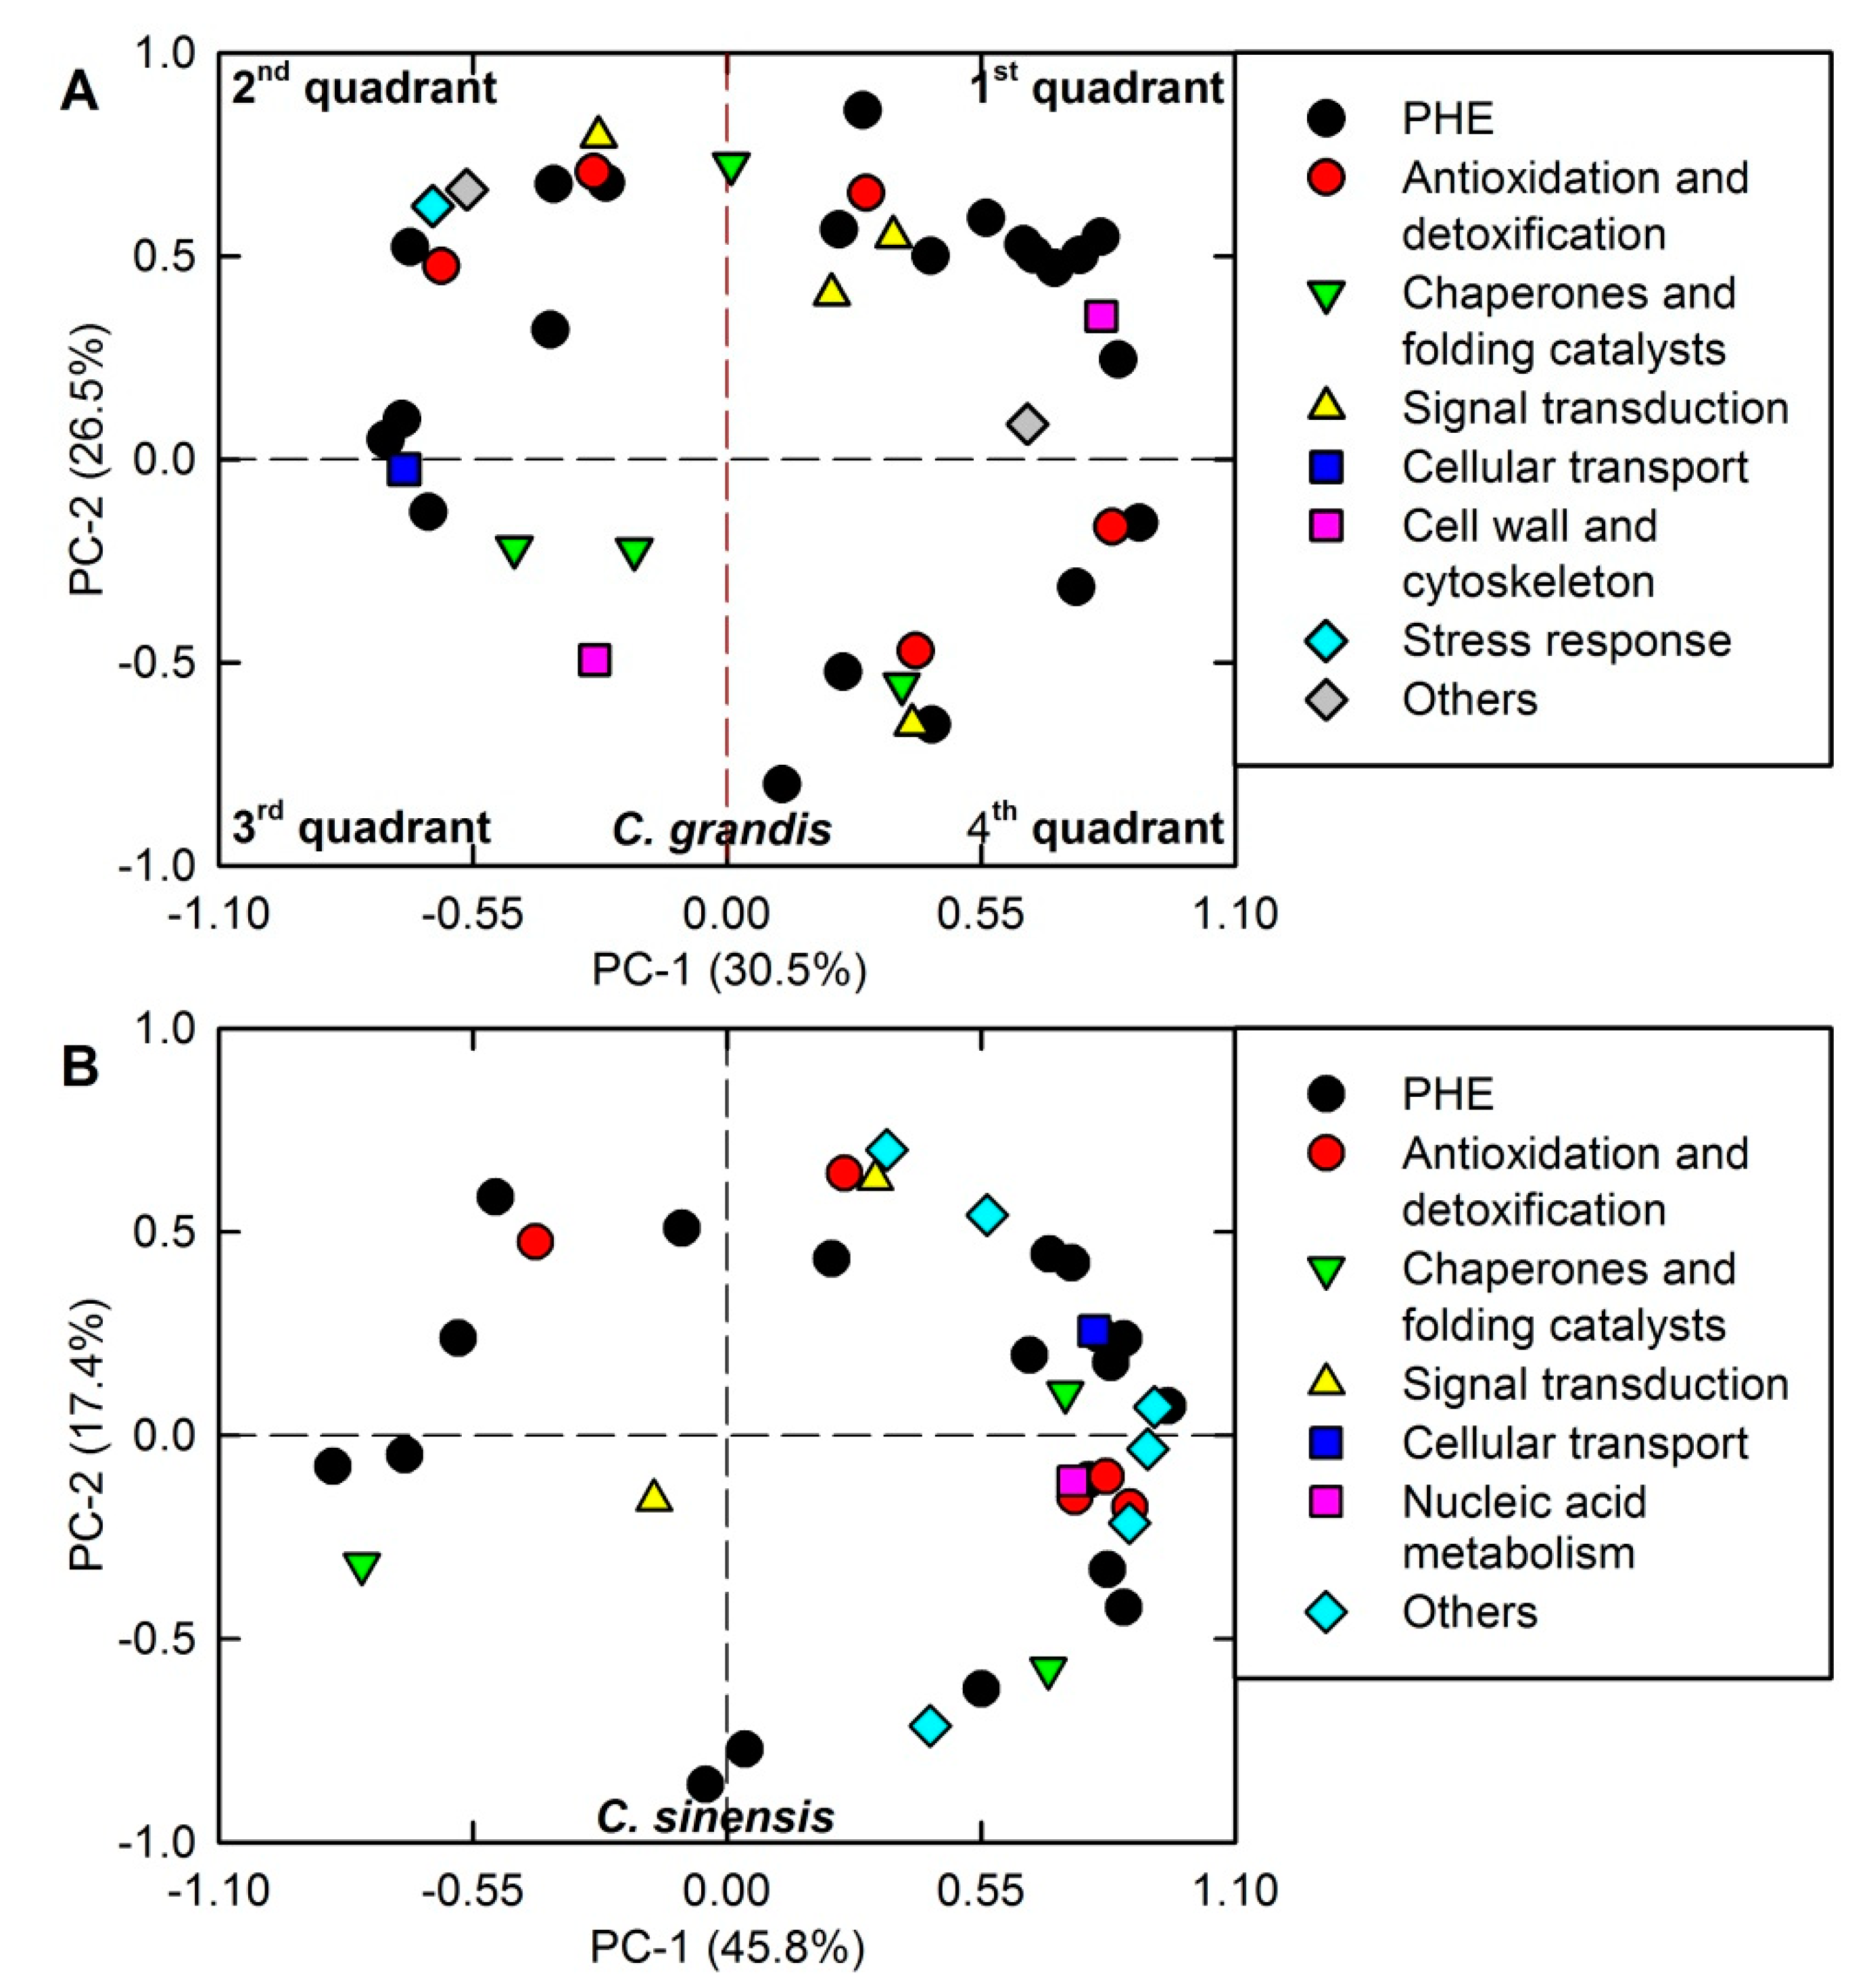
2.4. PCA Loading Plots and Correlation Matrices of DAPs
2.5. qRT-PCR Analysis of Genes for DAPs
3. Discussion
3.1. DAPs Related to Photosynthesis, Carbohydrate and Energy Metabolism
3.2. DAPs Related to Antioxidation and Detoxification
3.3. Chaperones and Folding Catalysts
3.4. DAPs Related to Signal Transduction
3.5. DAPs Related to Cellular Transport, Nucleic Acid and Cell Wall Metabolisms, and Cytoskeleton
3.6. Other DAPs
4. Materials and Methods
4.1. Plant Materials
4.2. Measurements of Plant DW, and Leaf Gas Exchange and Cu Concentration
4.3. Leaf Protein Extraction, 2-DE and Image Analysis
4.4. MALDI-TOF/TOF-MS-Based Protein Identification and Bioinformatic Analysis
4.5. KEGG Pathway Analysis of DAPs
4.6. qRT-PCR Analysis
4.7. Data Analysis
4.8. Data Deposit
5. Conclusions
Supplementary Materials
Author Contributions
Funding
Conflicts of Interest
References
- Adrees, M.; Ali, S.; Rizwan, M.; Ibrahim, M.; Abbas, F.; Farid, M.; Zia-ur-Rehman, M.; Irshad, M.K.; Bharwana, S.A. The effect of excess copper on growth and physiology of important food crops: A review. Environ. Sci. Pollut. Res. 2015, 22, 8148–8162. [Google Scholar] [CrossRef]
- Fan, J.; He, Z.; Ma, L.Q.; Stoffella, P.J. Accumulation and availability of copper in Citrus grove soils as affected by fungicide application. J. Soils Sediments 2011, 11, 639–648. [Google Scholar] [CrossRef]
- Mozaffari, M.; Alva, A.K.; Chen, E.Q. Relation of copper extractable from soil and pH to copper content and growth of two Citrus rootstocks. Soil Sci. 1996, 161, 786–792. [Google Scholar] [CrossRef]
- Yuan, M.; Li, Y.; Zhang, C.; Wang, J.; Li, S.; Fu, X.; Ling, L.; Cao, L.; Peng, L. Review of research on copper stress in Citrus. J. Fruit Sci. 2018, 35, 347–357. [Google Scholar]
- Li, Q.; Chen, H.-H.; Qi, Y.P.; Ye, X.; Yang, L.T.; Huang, Z.R.; Chen, L.S. Excess copper effects on growth, uptake of water and nutrients, carbohydrates, and PSII photochemistry revealed by OJIP transients in Citrus seedlings. Environ. Sci. Pollut. Res. 2019, 26, 30188–30205. [Google Scholar] [CrossRef] [PubMed]
- Burkhead, J.L.; Reynolds, K.A.G.; Abdel-Ghany, S.E.; Cohu, C.M.; Pilon, M. Copper homeostasis. New Phytol. 2009, 182, 799–816. [Google Scholar] [CrossRef]
- Ambrosini, V.G.; Rosa, D.J.; Basso, A.; Borghezan, M.; Pescador, R.; Miotto, A.; George de Melo, W.B.; de Sousa Soares, C.R.F.; Comin, J.J.; Brunetto, G. Liming as an ameliorator of copper toxicity in black oat (Avena strigosa Schreb.). J. Plant Nutr. 2017, 40, 404–416. [Google Scholar] [CrossRef]
- Hippler, F.W.R.; Boaretto, R.M.; Dovis, V.L.; Quaggio, J.A.; Azevedo, R.A.; Mattos, D., Jr. Oxidative stress induced by Cu nutritional disorders in Citrus depends on nitrogen and calcium availability. Sci. Rep. 2018, 8, 1641. [Google Scholar] [CrossRef]
- Zhang, L.L.; He, X.J.; Chen, M.; An, R.D.; An, X.L.; Li, J. Responses of nitrogen metabolism to copper stress in Luffa cylindrica roots. J. Soil Sci. Plant Nutr. 2014, 14, 616–624. [Google Scholar] [CrossRef]
- Fürtig, K.; Pavelic, D.; Brunold, C.; Brändle, R. Copper-and iron-induced injuries in roots and rhizomes of reed (Phragmites australis). Limnologica 1999, 29, 60–63. [Google Scholar] [CrossRef] [Green Version]
- Lequeux, H.; Hermans, C.; Lutts, S.; Verbruggen, N. Response to copper excess in Arabidopsis thaliana: Impact on the root system architecture, hormone distribution, lignin accumulation and mineral profile. Plant Physiol. Biochem. 2010, 48, 673–682. [Google Scholar] [CrossRef]
- Colzi, I.; Doumett, S.; Del Bubba, M.; Fornaini, J.; Arnetoli, M.; Gabbrielli, R.; Gonnelli, C. On the role of the cell wall in the phenomenon of copper tolerance in Silene paradoxa L. Environ. Exp. Bot. 2011, 72, 77–83. [Google Scholar] [CrossRef]
- Kováčik, J.; Klejdus, B.; Hedbavny, J.; Štork, F.; Bačkor, M. Comparison of cadmium and copper effect on phenolic metabolism, mineral nutrients and stress-related parameters in Matricaria chamomilla plants. Plant Soil 2009, 320, 231–242. [Google Scholar] [CrossRef]
- Yruela, I. Copper in plants: Acquisition, transport and interactions. Funct. Plant. Biol. 2009, 36, 409–430. [Google Scholar] [CrossRef] [Green Version]
- Greenbaum, D.; Colangelo, C.; Williams, K.; Gerstein, M. Comparing protein abundance and mRNA expression levels on a genomic scale. Genome Biol. 2003, 4, 117–124. [Google Scholar] [CrossRef] [Green Version]
- Rose, J.K.; Bashir, S.; Giovannoni, J.J.; Jahn, M.M.; Saravanan, R.S. Tackling the plant proteome: Practical approaches, hurdles and experimental tools. Plant J. 2004, 39, 715–733. [Google Scholar] [CrossRef] [PubMed]
- Chen, C.; Song, Y.; Zhuang, K.; Li, L.; Xia, Y.; Shen, Z. Proteomic analysis of copper-binding proteins in excess copper-stressed roots of two rice (Oryza sativa L.) varieties with different Cu tolerances. PLoS ONE 2015, 10, e0125367. [Google Scholar] [CrossRef]
- Song, Y.; Cui, J.; Zhang, H.; Wang, G.; Zhao, F.J.; Shen, Z. Proteomic analysis of copper stress responses in the roots of two rice (Oryza sativa L.) varieties differing in Cu tolerance. Plant Soil 2013, 366, 647–658. [Google Scholar] [CrossRef]
- Zhang, H.; Lian, C.; Shen, Z. Proteomic identification of small, copper-responsive proteins in germinating embryos of Oryza sativa. Ann. Bot. 2009, 103, 923–930. [Google Scholar] [CrossRef] [Green Version]
- Qin, R.; Ning, C.; Björn, L.O.; Li, S. Proteomic analysis of Allium cepa var. agrogarum L. roots under copper stress. Plant Soil 2016, 401, 197–212. [Google Scholar]
- Wang, C.; Wang, J.; Wang, X.; Xia, Y.; Chen, C.; Shen, Z.; Chen, Y. Proteomic analysis on roots of Oenothera glazioviana under copper-stress conditions. Sci. Rep. 2017, 7, 10589. [Google Scholar] [CrossRef] [PubMed] [Green Version]
- Gill, T.; Dogra, V.; Kumar, S.; Ahuja, P.S.; Sreenivasulu, Y. Protein dynamics during seed germination under copper stress in Arabidopsis over-expressing Potentilla superoxide dismutase. J. Plant Res. 2012, 125, 165–172. [Google Scholar] [CrossRef]
- Bona, E.; Marsano, F.; Cavaletto, M.; Berta, G. Proteomic characterization of copper stress response in Cannabis sativa roots. Proteomics 2007, 7, 1121–1130. [Google Scholar] [CrossRef] [PubMed]
- Hego, E.; Bes, C.M.; Bedon, F.; Palagi, P.M.; Chaumeil, P.; Barré, A.; Claverol, S.; Dupuy, J.W.; Bonneu, M.; Lalanne, C.; et al. Differential accumulation of soluble proteins in roots of metallicolous and nonmetallicolous populations of Agrostis capillaris L. exposed to Cu. Proteomics 2014, 14, 1746–1758. [Google Scholar] [CrossRef]
- Li, F.; Shi, J.; Shen, C.; Chen, G.; Hu, S.; Chen, Y. Proteomic characterization of copper stress response in Elsholtzia splendens roots and leaves. Plant Mol. Biol. 2009, 71, 251–263. [Google Scholar] [CrossRef] [PubMed]
- Liu, T.; Shen, C.; Wang, Y.; Huang, C.; Shi, J. New insights into regulation of proteome and polysaccharide in cell wall of Elsholtzia splendens in response to copper stress. PLoS ONE 2014, 9, e109573. [Google Scholar] [CrossRef]
- Roy, S.K.; Kwon, S.J.; Cho, S.W.; Kamal, A.H.M.; Kim, S.W.; Sarker, K.; Oh, M.W.; Lee, M.S.; Chung, K.Y.; Xin, Z.; et al. Leaf proteome characterization in the context of physiological and morphological changes in response to copper stress in sorghum. Biometals 2016, 29, 495–513. [Google Scholar] [CrossRef]
- Roy, S.K.; Cho, S.W.; Kwon, S.J.; Kamal, A.H.M.; Lee, D.G.; Sarker, K.; Moon-Soon Lee, M.S.; Xin, Z.; Woo, S.H. Proteome characterization of copper stress responses in the roots of sorghum. Biometals 2017, 30, 765–785. [Google Scholar] [CrossRef]
- Li, G.; Peng, X.; Xuan, H.; Wei, L.; Yang, Y.; Guo, T.; Kang, G. Proteomic analysis of leaves and roots of common wheat (Triticum aestivum L.) under copper-stress conditions. J. Proteome Res. 2013, 12, 4846–4861. [Google Scholar] [CrossRef]
- Alotaibi, M.O.; Mohammed, A.E.; Almutairi, T.A.; Elobeid, M.M. Morpho-physiological and proteomic analyses of Eucalyptus camaldulensis as a bioremediator in copper-polluted soil in Saudi Arabia. Plants 2019, 8, 43. [Google Scholar] [CrossRef] [Green Version]
- Damkjær, J.T.; Kereiche, S.; Johnson, M.P.; Kovacs, L.; Kiss, A.Z.; Boekema, E.J.; Ruban, A.V.; Horton, P.; Jansson, S. The photosystem II light-harvesting protein Lhcb3 affects the macrostructure of photosystem II and the rate of state transitions in Arabidopsis. Plant Cell 2009, 21, 3245–3256. [Google Scholar] [CrossRef] [PubMed] [Green Version]
- Kapri-Pardes, E.; Naveh, L.; Adam, Z. The thylakoid lumen protease Deg1 is involved in the repair of photosystem II from photoinhibition in Arabidopsis. Plant Cell 2007, 19, 1039–1047. [Google Scholar] [CrossRef] [PubMed] [Green Version]
- Bergantino, E.; Dainese, P.; Cerovic, Z.; Sechi, S.; Bassi, R. A post-translational modification of the PSII subunit CP29 protects maize from cold stress. J. Biol. Chem. 1995, 270, 8474–8481. [Google Scholar] [CrossRef] [PubMed] [Green Version]
- Betterle, N.; Ballottari, M.; Baginsky, S.; Bassi, R. High light-dependent phosphorylation of photosystem II inner antenna CP29 in monocots is STN7 independent and enhances nonphotochemical quenching. Plant Physiol. 2015, 167, 457–471. [Google Scholar] [CrossRef] [Green Version]
- Farinati, S.; DalCorso, G.; Bona, E.; Corbella, M.; Lampis, S.; Cecconi, D.; Polati, R.; Berta, G.; Vallini, G.; Furini, A. Proteomic analysis of Arabidopsis halleri shoots in response to the heavy metals cadmium and zinc and rhizosphere microorganisms. Proteomics 2009, 9, 4837–4850. [Google Scholar] [CrossRef]
- Lundin, B.; Hansson, M.; Schoefs, B.; Vener, A.V.; Spetea, C. The Arabidopsis PsbO2 protein regulates dephosphorylation and turnover of the photosystem II reaction centre D1 protein. Plant J. 2007, 49, 528–539. [Google Scholar] [CrossRef]
- Lintala, M.; Allahverdiyeva, Y.; Kangasjärvi, S.; Lehtimäki, N.; Keränen, M.; Rintamäki, E.; Aro, E.M.; Mulo, P. Comparative analysis of leaf-type ferredoxin-NADP+ oxidoreductase isoforms in Arabidopsis thaliana. Plant J. 2009, 57, 1103–1115. [Google Scholar] [CrossRef]
- Kim, S.R.; Yang, J.I.; An, G. OsCpn60α1, encoding the plastid chaperonin 60α subunit, is essential for folding of rbcL. Mol. Cells 2013, 35, 402–409. [Google Scholar] [CrossRef] [PubMed] [Green Version]
- Mate, C.J.; von Caemmerer, S.; Evans, J.R.; Hudson, G.S.; Andrews, T.J. The relationship between CO2-assimilation rate, Rubisco carbamylation and Rubisco activase content in activase-deficient transgenic tobacco suggests a simple model of activase action. Planta 1996, 198, 604–613. [Google Scholar] [CrossRef]
- Strand, Å.; Zrenner, R.; Trevanion, S.; Stitt, M.; Gustafsson, P.; Gardeström, P. Decreased expression of two key enzymes in the sucrose biosynthesis pathway, cytosolic fructose-1, 6-bisphosphatase and sucrose phosphate synthase, has remarkably different consequences for photosynthetic carbon metabolism in transgenic Arabidopsis thaliana. Plant J. 2000, 23, 759–770. [Google Scholar]
- Fariduddin, Q.; Yusuf, M.; Hayat, S.; Ahmad, A. Effect of 28-homobrassinolide on antioxidant capacity and photosynthesis in Brassica juncea plants exposed to different levels of copper. Environ. Exp. Bot. 2009, 66, 418–424. [Google Scholar] [CrossRef]
- Nunes-Nesi, A.; Carrari, F.; Lytovchenko, A.; Smith, A.M.; Loureiro, M.E.; Ratcliffe, R.G.; Sweetlove, L.J.; Fernie, A.R. Enhanced photosynthetic performance and growth as a consequence of decreasing mitochondrial malate dehydrogenase activity in transgenic tomato plants. Plant Physiol. 2005, 137, 611–622. [Google Scholar] [CrossRef] [PubMed] [Green Version]
- Heyno, E.; Innocenti, G.; Lemaire, S.D.; Issakidis-Bourguet, E.; Krieger-Liszkay, A. Putative role of the malate valve enzyme NADP-malate dehydrogenase in H2O2 signalling in Arabidopsis. Philos. Trans. R. Soc. B 2014, 369, 20130228. [Google Scholar] [CrossRef] [PubMed] [Green Version]
- Wang, Q.J.; Sun, H.; Dong, Q.L.; Sun, T.Y.; Jin, Z.X.; Hao, Y.J.; Yao, Y.X. The enhancement of tolerance to salt and cold stresses by modifying the redox state and salicylic acid content via the cytosolic malate dehydrogenase gene in transgenic apple plants. Plant Biotech. J. 2016, 14, 1986–1997. [Google Scholar] [CrossRef] [PubMed] [Green Version]
- Xiong, Y.; DeFraia, C.; Williams, D.; Zhang, X.; Mou, Z. Characterization of Arabidopsis 6-phosphogluconolactonase T-DNA insertion mutants reveals an essential role for the oxidative section of the plastidic pentose phosphate pathway in plant growth and development. Plant Cell Physiol. 2009, 50, 1277–1291. [Google Scholar] [CrossRef] [PubMed]
- Ahmed, N.; Battah, S.; Karachalias, N.; Babaei-Jadidi, R.; Horányi, M.; Baróti, K.; Hollan, S.; Thornalley, P.J. Increased formation of methylglyoxal and protein glycation, oxidation and nitrosation in triosephosphate isomerase deficiency. Biochim. Biophys. Acta-Mol. Basis Dis. 2003, 1639, 121–132. [Google Scholar] [CrossRef] [Green Version]
- Baena-González, E.; Sheen, J. Convergent energy and stress signaling. Trends Plant Sci. 2008, 13, 474–482. [Google Scholar] [CrossRef] [Green Version]
- Lim, J.D.; Hahn, S.J.; Yu, C.Y.; Chung, I.M. Expression of the glutathione S-transferase gene (NT107) in transgenic Dianthus superbus. Plant Cell Tiss. Org. Cult. 2005, 80, 277–286. [Google Scholar] [CrossRef]
- Kumar, S.; Asif, M.H.; Chakrabarty, D.; Tripathi, R.D.; Dubey, R.S.; Trivedi, P.K. Expression of a rice Lambda class of glutathione S-transferase, OsGSTL2, in Arabidopsis provides tolerance to heavy metal and other abiotic stresses. J. Hazard. Mater. 2013, 248, 228–237. [Google Scholar] [CrossRef]
- Drążkiewicz, M.; Skórzyńska-Polit, E.; Krupa, Z. The redox state and activity of superoxide dismutase classes in Arabidopsis thaliana under cadmium or copper stress. Chemosphere 2007, 67, 188–193. [Google Scholar] [CrossRef]
- Cohu, C.M.; Pilon, M. Regulation of superoxide dismutase expression by copper availability. Physiol. Plant. 2007, 129, 747–755. [Google Scholar] [CrossRef]
- Yamauchi, Y.; Hasegawa, A.; Mizutani, M.; Sugimoto, Y. Chloroplastic NADPH-dependent alkenal/one oxidoreductase contributes to the detoxification of reactive carbonyls produced under oxidative stress. FEBS Lett. 2012, 586, 1208–1213. [Google Scholar] [CrossRef] [PubMed] [Green Version]
- Kawashima, C.G.; Noji, M.; Nakamura, M.; Ogra, Y.; Suzuki, K.T.; Saito, K. Heavy metal tolerance of transgenic tobacco plants over-expressing cysteine synthase. Biotechnol. Let. 2004, 26, 153–157. [Google Scholar] [CrossRef] [PubMed]
- Lee, S.; Kang, B.S. Phytochelatin is not a primary factor in determining copper tolerance. J. Plant Biol. 2005, 48, 32–38. [Google Scholar] [CrossRef]
- Xu, H.; Xu, W.; Xi, H.; Ma, W.; He, Z.; Ma, M. The ER luminal binding protein (BiP) alleviates Cd2+-induced programmed cell death through endoplasmic reticulum stress–cell death signaling pathway in tobacco cells. J. Plant Physiol. 2013, 170, 1434–1441. [Google Scholar] [CrossRef]
- Guan, C.; Jin, C.; Ji, J.; Wang, G.; Li, X. LcBiP, a endoplasmic reticulum chaperone binding protein gene from Lycium chinense, confers cadmium tolerance in transgenic tobacco. Biotechnol. Prog. 2015, 31, 358–368. [Google Scholar] [CrossRef]
- Narindrasorasak, S.; Yao, P.; Sarkar, B. Protein disulfide isomerase, a multifunctional protein chaperone, shows copper-binding activity. Biochem. Biophys. Res. Commun. 2003, 311, 405–414. [Google Scholar] [CrossRef]
- Kuo, W.Y.; Huang, C.H.; Liu, A.C.; Cheng, C.P.; Li, S.H.; Chang, W.C.; Weiss, C.; Azem, A.; Jinn, T.L. CHAPERONIN 20 mediates iron superoxide dismutase (Fe SOD) activity independent of its co-chaperonin role in Arabidopsis chloroplasts. New Phytol. 2013, 197, 99–110. [Google Scholar] [CrossRef]
- Palmgren, M.G. Plant plasma membrane H+-ATPases: Powerhouses for nutrient uptake. Annu. Rev. Plant Physiol. Plant Mol. Biol. 2001, 52, 817–845. [Google Scholar] [CrossRef] [Green Version]
- Owen, J.R.; Morris, C.A.; Nicolaus, B.; Harwood, J.L.; Kille, P. Induction of expression of a 14-3-3 gene in response to copper exposure in the marine alga, Fucus vesiculosus. Ecotoxicology 2012, 21, 124–138. [Google Scholar] [CrossRef] [PubMed]
- Janicka-Russak, M.; Kabała, K.; Burzyński, M. Different effect of cadmium and copper on H+-ATPase activity in plasma membrane vesicles from Cucumis sativus roots. J. Exp. Bot. 2012, 63, 4133–4142. [Google Scholar] [CrossRef] [PubMed] [Green Version]
- Cuypers, A.; Koistinen, K.M.; Kokko, H.; Kärenlampi, S.; Auriola, S.; Vangronsveld, J. Analysis of bean (Phaseolus vulgaris L.) proteins affected by copper stress. J. Plant Physiol. 2005, 162, 383–392. [Google Scholar] [CrossRef]
- Utriainen, M.; Kokko, H.; Auriola, S.; Sarrazin, O.; Kärenlampi, S. PR-10 protein is induced by copper stress in roots and leaves of a Cu/Zn tolerant clone of birch, Betula pendula. Plant Cell Environ. 1998, 21, 821–828. [Google Scholar] [CrossRef]
- Jami, S.K.; Clark, G.B.; Turlapati, S.A.; Handley, C.; Roux, S.J.; Kirti, P.B. Ectopic expression of an annexin from Brassica juncea confers tolerance to abiotic and biotic stress treatments in transgenic tobacco. Plant Physiol. Biochem. 2008, 46, 1019–1030. [Google Scholar] [CrossRef] [PubMed]
- Chmielowska, J.; Veloso, J.; Gutierrez, J.; Silvar, C.; Díaz, J. Cross-protection of pepper plants stressed by copper against a vascular pathogen is accompanied by the induction of a defence response. Plant Sci. 2010, 178, 176–182. [Google Scholar] [CrossRef]
- Ritter, A.; Ubertini, M.; Romac, S.; Gaillard, F.; Delage, L.; Mann, A.; Cock, J.M.; Tonon, T.; Correa, J.A.; Potin, P. Copper stress proteomics highlights local adaptation of two strains of the model brown alga Ectocarpus siliculosus. Proteomics 2010, 10, 2074–2088. [Google Scholar] [CrossRef] [PubMed]
- Jin, X.L.; Ma, C.L.; Yang, L.T.; Chen, L.S. Alterations of physiology and gene expression due to long-term magnesium-deficiency differ between leaves and roots of Citrus reticulata. J. Plant Physiol. 2016, 198, 103–115. [Google Scholar] [CrossRef] [PubMed]
- Zhai, F.Q.; Wang, X.L.; Hua, J.M.; Si, J.Y.; Feng, K. Copper toxicity on seedlings of wheat and the detoxification of calcium. J. Agro-Environ. Sci. 2006, 26, 694–698. [Google Scholar]
- Carrió-Seguí, À.; Romero, P.; Sanz, A.; Peñarrubia, L. Interaction between ABA signaling and copper homeostasis in Arabidopsis thaliana. Plant Cell Physiol. 2016, 57, 1568–1582. [Google Scholar]
- Briat, J.F. Roles of ferritin in plants. J. Plant Nutr. 1996, 19, 1331–1342. [Google Scholar] [CrossRef]
- Alva, A.K.; Chen, E.Q. Effects of external copper concentrations on uptake of trace elements by Citrus seedlings. Soil Sci. 1995, 159, 59–64. [Google Scholar] [CrossRef]
- Ravet, K.; Pilon, M. Copper and iron homeostasis in plants: The challenges of oxidative stress. Antioxid. Redox Sign. 2013, 19, 919–932. [Google Scholar] [CrossRef] [PubMed] [Green Version]
- Luo, Y.; Liu, Y.B.; Dong, Y.X.; Gao, X.Q.; Zhang, X.S. Expression of a putative alfalfa helicase increases tolerance to abiotic stress in Arabidopsis by enhancing the capacities for ROS scavenging and osmotic adjustment. J. Plant Physiol. 2009, 166, 385–394. [Google Scholar] [CrossRef] [PubMed]
- Rakwal, R.; Yang, G.; Komatsu, S. Chitinase induced by jasmonic acid, methyl jasmonate, ethylene and protein phosphatase inhibitors in rice. Mol. Biol. Rep. 2004, 31, 113–119. [Google Scholar] [CrossRef]
- Taddei, S.; Bernardi, R.; Salvini, M.; Pugliesi, C.; Durante, M. Effect of copper on callus growth and gene expression of in vitro-cultured pith explants of Nicotiana glauca. Plant Biosyst. 2007, 141, 194–203. [Google Scholar] [CrossRef]
- Zhou, X.X.; Yang, L.T.; Qi, Y.P.; Guo, P.; Chen, L.S. Mechanisms on boron-induced alleviation of aluminum-toxicity in Citrus grandis seedlings at a transcriptional level revealed by cDNA-AFLP analysis. PLoS ONE 2015, 10, e0115485. [Google Scholar] [CrossRef] [Green Version]
- Sudo, E.; Itouga, M.; Yoshida-Hatanaka, K.; Ono, Y.; Sakakibara, H. Gene expression and sensitivity in response to copper stress in rice leaves. J. Exp. Bot. 2008, 59, 3465–3474. [Google Scholar] [CrossRef] [Green Version]
- Huang, J.H.; Xu, J.; Ye, X.; Luo, T.Y.; Ren, L.H.; Fan, G.C.; Yi, P.Q.; Li, Q.; Ferarezi, R.H.; Chen, L.S. Magnesium deficiency affects secondary lignification of the vascular system in Citrus sinensis seedlings. Trees Struct. Funct. 2019, 33, 171–182. [Google Scholar] [CrossRef]
- Ye, X.; Chen, X.F.; Deng, C.L.; Yang, L.T.; Lai, L.W.; Guo, J.X.; Chen, L.S. Magnesium-deficiency effects on pigments, photosynthesis and photosynthetic electron transport of leaves, and nutrients of leaf blades and veins in Citrus sinensis seedlings. Plants 2019, 8, 389. [Google Scholar] [CrossRef] [Green Version]
- You, X.; Yang, L.T.; Lu, Y.B.; Li, H.; Zhang, S.Q.; Chen, L.S. Proteomic changes of Citrus roots in response to long-term manganese toxicity. Trees Struct. Funct. 2014, 28, 1383–1399. [Google Scholar] [CrossRef]
- Bradford, M.M. A rapid and sensitive method for quantitation of microgramand quantities of protein utilizing the principle of protein-dye binding. Anal. Biochem. 1976, 72, 248–254. [Google Scholar] [CrossRef]
- Sang, W.; Huang, Z.R.; Yang, L.T.; Guo, P.; Ye, X.; Chen, L.S. Effects of high toxic boron concentration on protein profiles in roots of two Citrus species differing in boron tolerance revealed by a 2-DE based MS approach. Front. Plant Sci. 2017, 8, 180. [Google Scholar] [CrossRef] [PubMed] [Green Version]
- Peng, H.Y.; Qi, Y.P.; Lee, J.; Yang, L.T.; Guo, P.; Jiang, H.X.; Chen, L.S. Proteomic analysis of Citrus sinensis roots and leaves in response to long-term magnesium-deficiency. BMC Genom. 2015, 16, 253. [Google Scholar] [CrossRef] [PubMed] [Green Version]
- Figueiredo, A.; Martins, J.; Sebastiana, M.; Guerreiro, A.; Silva, A.; Matos, A.R.; Monteiro, F.; Pais, M.S.; Roepstorff, P.; Coelho, A.V. Specific adjustments in grapevine leaf proteome discriminating resistant and susceptible grapevine genotypes to Plasmopara viticola. J. Proteome 2017, 152, 48–57. [Google Scholar] [CrossRef] [PubMed]
- Zhang, J.; Li, Q.; Qi, Y.P.; Huang, W.L.; Yang, L.T.; Lai, N.W.; Ye, X.; Chen, L.S. Low pH-responsive proteins revealed by a 2-DE based MS approach and related physiological responses in Citrus leaves. BMC Plant Biol. 2019, 18, 188. [Google Scholar] [CrossRef]
- Guo, P.; Qi, Y.P.; Huang, W.L.; Yang, L.T.; Huang, Z.R.; Lai, N.W.; Chen, L.S. Aluminum-responsive genes revealed by RNA-Seq and related physiological responses in leaves of two Citrus species with contrasting aluminum-tolerance. Ecotoxicol. Environ. Saf. 2018, 158, 213–222. [Google Scholar] [CrossRef]
- Yang, L.T.; Qi, Y.P.; Lu, Y.B.; Guo, P.; Sang, W.; Feng, H.; Zhang, H.X.; Chen, L.S. iTRAQ protein profile analysis of Citrus sinensis roots in response to long-term boron-deficiency. J. Proteome 2013, 93, 179–206. [Google Scholar] [CrossRef]
- Guo, P.; Qi, Y.P.; Cai, Y.T.; Yang, T.Y.; Yang, L.T.; Huang, Z.R.; Chen, L.S. Aluminum effects on photosynthesis, reactive oxygen species and methylglyoxal detoxification in two Citrus species differing in aluminum tolerance. Tree Physiol. 2018, 38, 1548–1565. [Google Scholar] [CrossRef] [Green Version]


| Citrus grandis | Citrus sinensis | |||||||||
|---|---|---|---|---|---|---|---|---|---|---|
| Control | Cu200 | Cu300 | Cu400 | Total | Control | Cu200 | Cu300 | Cu400 | Total | |
| Protein yield (mg g−1DW) | 49.4 ± 5.1a | 45.3 ± 0.7a | 47.6 ± 1.2a | 44.7 ± 8.3a | 44.4 ± 5.0a | 43.8 ± 5.4a | 40.9 ± 5.4a | 35.6 ± 3.1a | ||
| Number of spots per gel | 613 ± 4a | 627 ± 8a | 621 ± 12a | 621 ± 22a | 614 ± 7a | 625 ± 15a | 617 ± 12a | 618 ± 9a | ||
| Number of DAP spots | ||||||||||
| Increased in abundances | 15 | 12 | 13 | 2 | 4 | 5 | ||||
| Decreased in abundances | 4 | 2 | 7 | 8 | 12 | 18 | ||||
| Disappeared | 2 | 2 | 1 | 13 | ||||||
| Total | 19 | 14 | 22 | 42 | 12 | 17 | 36 | 45 | ||
| Number of identified DAP spots | ||||||||||
| Increased in abundances | 15 | 12 | 12 | 2 | 4 | 5 | ||||
| Decreased in abundances | 4 | 2 | 7 | 7 | 11 | 12 | ||||
| Disappeared | 2 | 2 | 1 | 11 | ||||||
| Total | 19 | 14 | 21 | 41 | 11 | 16 | 28 | 37 | ||
| Spot No. | Protein Identity | Accession No | Mr(kDa)/PI Exp. | Mr(kDa)/PI Theor. | Protein Score | Peptide Ions | NMP | Ratio | CS (%) | Charge | |||
|---|---|---|---|---|---|---|---|---|---|---|---|---|---|
| Cu0.5 | Cu200 | Cu300 | Cu400 | ||||||||||
| Citrus Grandis | |||||||||||||
| Photosynthesis, Carbohydrate and Energy Metabolism | |||||||||||||
| G1 | 29 kDa ribonucleoprotein A, chloroplastic; Ribonucleoprotein At2g37220, chloroplastic | Cs6g11900.1 | 30.37/5.17 | 36.20/4.33 | 358 | 186 | 9 | 1.00 ± 0.11c | 1.68 ± 0.19ab | 1.20 ± 0.14bc | 2.24 ± 0.26a | 8 | 1 |
| G30 | Photosystem II stability/assembly factor HCF136, chloroplast, putative | Cs7g13970.1 | 45.06/8.46 | 48.11/5.91 | 902 | 42 | 22 | 1.00 ± 0.11b | 1.19 ± 0.20b | 1.17 ± 0.13b | 1.91 ± 0.12a | 19 | 1 |
| G31 | Photosystem II stability/assembly factor HCF136, chloroplast, putative | Cs7g13970.1 | 53.11/5.75 | 59.08/5.94 | 684 | 172 | 28 | 1.00 ± 0.23b | 1.23 ± 0.25b | 2.40 ± 0.19a | 1.58 ± 0.21b | 24 | 1 |
| G10 | Ferredoxin—NADP reductase, leaf-type isozyme, chloroplastic | Cs1g25510.4 | 55.49/5.09 | 62.32/4.92 | 74 | 47 | 14 | 1.00 ± 0.11a | 0.53 ± 0.08b | 0.69 ± 0.10ab | 0.36 ± 0.16b | 12 | 1 |
| G42 | Ferredoxin—NADP reductase, leaf-type isozyme, chloroplastic | Cs1g25510.4 | 40.48/8.68 | 35.76/6.62 | 458 | 122 | 26 | 1.00 ± 0.23b | 3.66 ± 0.24a | 1.64 ± 0.10b | 1.54 ± 0.32b | 23 | 1 |
| G8 | RuBisCO subunit binding-protein alpha subunit, chloroplast, putative, expressed; Chaperonin 60 subunit alpha 1, chloroplastic | Cs8g16040.3 | 61.50/5.23 | 68.61/4.72 | 1350 | 169 | 47 | 1.00 ± 0.22b | 0.31 ± 0.09c | 1.86 ± 0.24a | 1.06 ± 0.13b | 41 | 1 |
| G9 | Ribulose bisphosphate carboxylase/oxygenase activase 1, chloroplastic | Cs7g31800.3 | 47.86/6.29 | 53.65/5.10 | 617 | 119 | 17 | 1.00 ± 0.20ab | 1.38 ± 0.05a | 0.80 ± 0.08bc | 0.48 ± 0.08c | 24 | 1 |
| G6 | Sedoheptulose-1,7-bisphosphatase, chloroplastic | Cs7g31640.4 | 42.40/5.82 | 48.51/4.64 | 489 | 84 | 29 | 1.00 ± 0.22b | 1.66 ± 0.20a | 1.09 ± 0.18ab | 1.32 ± 0.10ab | 25 | 1 |
| G38 | Glyceraldehyde-3-phosphate dehydrogenase B, chloroplastic | Cs3g27520.2 | 48.00/7.10 | 52.45/6.38 | 515 | 104 | 30 | 1.00 ± 0.27b | 2.43 ± 0.31a | 1.42 ± 0.08b | 1.34 ± 0.14b | 26 | 1 |
| G29 | Triosephosphate isomerase, cytosolic (Fragment) | Cs5g16495.1 | 26.96/5.73 | 32.66/6.15 | 326 | 129 | 7 | 1.00 ± 0.04ab | 1.58 ± 0.36a | 0.63 ± 0.12b | 0.18 ± 0.10c | 6 | 1 |
| G35 | Triosephosphate isomerase, cytosolic | Cs7g32500.1 | 26.96/5.73 | 31.99/6.16 | 236 | 125 | 14 | 1.00 ± 0.34a | 0.69 ± 0.14a | 0.51 ± 0.24a | 0 | 11 | 1 |
| G41 | Triosephosphate isomerase, cytosolic | Cs8g18560.2 | 27.24/5.75 | 33.66/6.67 | 428 | 102 | 17 | 1.00 ± 0.14b | 1.97 ± 0.27a | 1.49 ± 0.05ab | 1.16 ± 0.19b | 15 | 1 |
| G4 | Probable 6-phosphogluconolactonase 4, chloroplastic | Orange1.1t02542.1 | 35.38/6.24 | 34.54/4.72 | 1050 | 179 | 25 | 1.00 ± 0.10b | 2.05 ± 0.35a | 2.04 ± 0.28a | 1.30 ± 0.20ab | 20 | 1 |
| G36 | Fructose-1,6-bisphosphatase, cytosolic | Cs3g21280.1 | 37.65/5.95 | 47.35/6.37 | 408 | 80 | 22 | 1.00 ± 0.42b | 4.05 ± 1.70a | 2.31 ± 0.11ab | 1.63 ± 0.18ab | 19 | 1 |
| G17 | Malate dehydrogenase [NADP], chloroplastic | Cs7g21820.2 | 47.97/6.37 | 52.65/5.59 | 654 | 104 | 29 | 1.00 ± 0.28a | 0.71 ± 0.05ab | 1.01 ± 0.02a | 0.32 ± 0.15b | 25 | 1 |
| G37 | Malate dehydrogenase, cytoplasmic | Cs9g10470.1 | 35.54/6.10 | 48.01/6.44 | 212 | 63 | 15 | 1.00 ± 0.28b | 1.66 ± 0.13a | 1.01 ± 0.01b | 0.82 ± 0.15b | 13 | 1 |
| G39 | Malate dehydrogenase, cytoplasmic | Cs9g10470.1 | 42.35/5.94 | 56.49/6.33 | 193 | 144 | 11 | 1.00 ± 0.21b | 2.76 ± 0.46a | 2.11 ± 0.20a | 2.35 ± 0.48a | 10 | 1 |
| G18 | ATP synthase subunit beta, mitochondrial | Cs2g13550.1 | 59.85/6.06 | 61.56/5.45 | 1240 | 203 | 21 | 1.00 ± 0.11bc | 0.73 ± 0.20c | 1.66 ± 0.12a | 1.40 ± 0.11ab | 18 | 1 |
| G23 | ATP synthase gamma chain, chloroplastic | Cs2g03080.1 | 40.62/6.08 | 45.19/5.67 | 594 | 115 | 25 | 1.00 ± 0.08bc | 0.64 ± 0.20c | 1.65 ± 0.09a | 1.38 ± 0.04ab | 22 | 1 |
| G26 | Bis(5’-adenosy l)-triphosphatase | Cs9g13060.1 | 17.37/5.94 | 18.09/5.99 | 216 | 105 | 7 | 1.00 ± 0.07b | 1.03 ± 0.37b | 1.47 ± 0.09ab | 1.86 ± 0.14a | 14 | 1 |
| G24 | Glucose-1-phosphate adenylyltransferase small subunit 2, chloroplastic | Cs2g18800.1 | 57.08/6.74 | 58.03/5.66 | 1120 | 121 | 45 | 1.00 ± 0.12b | 1.97 ± 0.42a | 2.24 ± 0.27a | 1.64 ± 0.31ab | 39 | 1 |
| G25 | Glucose-1-phosphate adenylyltransferase small subunit 2, chloroplastic | Cs2g18800.1 | 65.86/8.50 | 68.69/5.67 | 751 | 139 | 37 | 1.00 ± 0.18b | 2.11 ± 0.43a | 1.09 ± 0.08b | 1.36 ± 0.19ab | 32 | 1 |
| Antioxidation and Detoxification | |||||||||||||
| G40 | Glutathione S-transferase | Cs5g32800.1 | 23.83/6.17 | 30.07/6.75 | 389 | 100 | 20 | 1.00 ± 0.13b | 78.9 ± 28.10a | 93.20 ± 15.40a | 47.10 ± 8.39a | 17 | 1 |
| G34 | Glutathione S-transferase DHAR1, mitochondrial | Cs7g28340.4 | 23.85/6.18 | 30.34/6.46 | 544 | 127 | 21 | 1.00 ± 0.41a | 0.57 ± 0.33a | 0.26 ± 0.06a | 0 | 18 | 1 |
| G21 | Copper/zinc superoxide dismutase (Fragment) | Cs3g12000.1 | 15.09/5.47 | 19.86/5.80 | 83 | 46 | 7 | 1.00 ± 0.07b | 1.03 ± 0.41b | 1.18 ± 0.16b | 2.43 ± 0.51a | 12 | 1 |
| G33 | Manganese superoxide dismutase (Fragment) | Cs7g29850.1 | 25.29/6.79 | 28.64/6.34 | 520 | 107 | 19 | 1.00 ± 0.08b | 1.51 ± 0.15ab | 1.47 ± 0.16ab | 2.02 ± 0.47a | 17 | 1 |
| G16 | Quinone oxidoreductase-like protein At1g23740, chloroplastic | Cs7g08640.2 | 41.88/8.77 | 48.90/5.38 | 728 | 189 | 27 | 1.00 ± 0.12a | 1.17 ± 0.08a | 1.01 ± 0.04a | 0.66 ± 0.03b | 23 | 1 |
| Chaperones and Folding Catalysts | |||||||||||||
| G15 | Probable protein disulfide-isomerase A6 | Cs5g33860.2 | 41.75/6.91 | 44.67/5.58 | 522 | 130 | 28 | 1.00 ± 0.11b | 1.45 ± 0.18ab | 1.49 ± 0.03ab | 1.60 ± 0.21a | 24 | 1 |
| G12 | 20 kDa chaperonin, chloroplastic | Cs4g07030.2 | 26.59/8.89 | 30.93/5.32 | 874 | 186 | 27 | 1.00 ± 0.18b | 0.69 ± 0.13b | 1.66 ± 0.08a | 0.73 ± 0.19b | 23 | 1 |
| G11 | Heat shock cognate 70 kDa protein 2 | Cs7g29010.1 | 70.99/5.09 | 74.6/4.89 | 794 | 113 | 5 | 1.00 ± 0.18a | 0.81 ± 0.12ab | 0.52 ± 0.12b | 0.56 ± 0.04b | 4 | 1 |
| G19 | Chaperonin CPN60-1, mitochondrial, putative, expressed | Orange1.1t01459.2 | 61.73/5.85 | 68.57/5.40 | 632 | 60 | 46 | 1.00 ± 0.23b | 0.46 ± 0.04c | 1.76 ± 0.06a | 0.81 ± 0.22bc | 40 | 1 |
| Signal Transduction | |||||||||||||
| G3 | Calreticulin-1 | Cs3g15060.3 | 52.52/6.29 | 62.84/4.12 | 122 | 99 | 11 | 1.00 ± 0.33a | 0.72 ± 0.17ab | 0.54 ± 0.08ab | 0.19 ± 0.02b | 15 | 1 |
| G27 | Major allergen Pru ar 1 (Major pollen allergen Bet v 1-D/H; Major pollen allergen Bet v 1-A) | Cs9g03630.1 | 17.60/5.67 | 21.51/6.05 | 253 | 104 | 19 | 1.00 ± 0.09c | 3.02 ± 0.42a | 1.66 ± 0.28bc | 2.17 ± 0.49ab | 17 | 1 |
| G5 | 14-3-3 protein 7 (14-3-3-like protein GF14 epsilon) | Cs3g18200.2 | 28.86/4.92 | 37.48/4.61 | 670 | 174 | 25 | 1.00 ± 0.20b | 1.36 ± 0.08ab | 1.39 ± 0.13ab | 1.83 ± 0.16a | 21 | 1 |
| G22 | Annexin D1 | Cs3g18360.1 | 35.88/5.17 | 46.63/5.66 | 784 | 138 | 31 | 1.00 ± 0.72b | 3.18 ± 1.21ab | 4.77 ± 0.99a | 2.03 ± 0.43ab | 27 | 1 |
| Cellular Transport | |||||||||||||
| G28 | Ferritin-2, chloroplastic | Cs7g30630.1 | 29.47/5.41 | 32.63/5.90 | 499 | 155 | 27 | 1.00 ± 0.12a | 0.55 ± 0.12b | 0.88 ± 0.05ab | 1.21 ± 0.16a | 23 | 1 |
| Cell Wall and Cytoskeleton | |||||||||||||
| G7 | Tubulin beta-6 chain | Cs3g26180.1 | 50.38/4.75 | 62.28/4.68 | 775 | 162 | 30 | 1.00 ± 0.10b | 3.48 ± 0.55a | 1.59 ± 0.08b | 1.23 ± 0.39b | 26 | 1 |
| G2 | Endochitinase 1 | Cs8g01850.1 | 35.39/4.85 | 52.52/4.16 | 75 | 33 | 9 | 1.00 ± 0.16a | 0.55 ± 0.27ab | 0.44 ± 0.05b | 0.75 ± 0.09ab | 8 | 1 |
| Stress Response | |||||||||||||
| G14 | Abscisic stress-ripening protein 1-like | Cs3g21500.1 | 17.88/6.00 | 30.30/5.56 | 323 | 123 | 8 | 1.00 ± 0.35b | 1.75 ± 0.48b | 1.97 ± 0.10b | 5.75 ± 0.59a | 29 | 1 |
| Others | |||||||||||||
| G20 | Orange1.1t05091.1 | 157.30/6.83 | 19.29/5.70 | 161 | 12 | 31 | 1.00 ± 0.16c | 1.38 ± 0.32bc | 1.80 ± 0.26ab | 2.31 ± 0.19a | 30 | 1 | |
| G32 | S-adenosyl-L-homocysteine hydrolase (adenosylhomocysteinase) | Orange1.1t01892.1 | 80.71/6.26 | 77.69/6.12 | 577 | 97 | 35 | 1.00 ± 0.18b | 2.72 ± 0.72a | 0.87 ± 0.09b | 0.79 ± 0.10b | 3 | 1 |
| Unidentified Protein Spots | |||||||||||||
| G13 | Receptor serine-threonine protein kinase, putative | Cs9g04750.2 | 25.57/8.87 | 23.24/5.56 | 45 | 109 | 13 | 1.00 ± 0.15b | 1.06 ± 0.28b | 1.13 ± 0.25b | 2.12 ± 0.35a | 22 | 1 |
| Citrus Sinensis | |||||||||||||
| Photosynthesis, Carbohydrate and Energy Metabolism | |||||||||||||
| S19 | Chlorophyll a-b binding protein 8,chloroplastic | Cs3g06180.2 | 29.52/6.84 | 32.89/5.42 | 222 | 95 | 12 | 1.00 ± 0.25b | 1.80 ± 0.27a | 1.28 ± 0.05ab | 0.44 ± 0.09c | 10 | 1 |
| S41 | Protease Do-like 1, chloroplastic | Cs2g28080.1 | 53.11/5.75 | 95.23/4.75 | 553 | 139 | 17 | 1.00 ± 0.15a | 0.12 ± 0.05c | 0.68 ± 0.04ab | 0.51 ± 0.10bc | 15 | 1 |
| S13 | PsbP domain-containing protein 3, chloroplastic | Cs3g27720.1 | 27.63/8.28 | 21.66/5.68 | 366 | 126 | 9 | 1.00 ± 0.17a | 0.81 ± 0.11ab | 0.55 ± 0.10bc | 0.36 ± 0.11c | 12 | 1 |
| S2 | 29 kDa ribonucleoprotein A, chloroplastic; Ribonucleoprotein At2g37220, chloroplastic | Cs6g11900.1 | 30.37/5.17 | 45.1/6.21 | 418 | 195 | 13 | 1.00 ± 0.08a | 0.82 ± 0.16ab | 0.43 ± 0.09c | 0.53 ± 0.06bc | 11 | 1 |
| S32 | 29 kDa ribonucleoprotein A, chloroplastic; Ribonucleoprotein At2g37220, chloroplastic | Cs7g01430.1 | 28.53/7.78 | 33.75/5.11 | 392 | 114 | 19 | 1.00 ± 0.20a | 0.76 ± 0.02ab | 0.49 ± 0.14b | 0 | 23 | 1 |
| S17 | Oxygen-evolving enhancer protein 1, chloroplastic | Cs1g23450.1 | 35.38/5.83 | 24.74/5.56 | 261 | 116 | 7 | 1.00 ± 0.05c | 1.06 ± 0.01bc | 1.34 ± 0.10ab | 1.54 ± 0.14a | 19 | 1 |
| S3 | Carbonic anhydrase, chloroplastic | Cs2g28060.4 | 36.77/6.66 | 53.09/6.25 | 171 | 162 | 5 | 1.00 ± 0.26c | 3.02 ± 0.38ab | 3.14 ± 0.23a | 1.18 ± 0.35bc | 5 | 1 |
| S11 | Rubisco subunit binding-protein alpha subunit, chloroplast, putative, expressed; Chaperonin 60 subunit alpha 1, chloroplastic | Cs8g16040.1 | 61.50/5.23 | 99.02/5.94 | 1250 | 182 | 39 | 1.00 ± 0.1a | 0.70 ± 0.16a | 0.80 ± 0.17a | 0.27 ± 0.04b | 34 | 1 |
| S9 | Ribulose bisphosphate carboxylase/oxygenase activase 1, chloroplastic | Cs7g31800.3 | 50.90/5.33 | 81.78/6.10 | 505 | 107 | 21 | 1.00 ± 0.23a | 0.75 ± 0.10ab | 0.66 ± 0.10ab | 0.51 ± 0.04b | 28 | 1 |
| S14 | Ribulose bisphosphate carboxylase/oxygenase activase 1, chloroplastic | Cs7g31800.3 | 46.96/5.94 | 75.7/5.65 | 505 | 107 | 21 | 1.00 ± 0.11a | 0.65 ± 0.02b | 0.48 ± 0.05b | 0.45 ± 0.05b | 28 | 1 |
| S4 | Ribulose bisphosphate carboxylase/oxygenase activase 1, chloroplastic | Cs7g31800.3 | 46.96/5.94 | 83.26/6.21 | 579 | 139 | 19 | 1.00 ± 0.46a | 0 | 0.38 ± 0.03a | 0.77 ± 0.06a | 17 | 1 |
| S10 | Ribulose bisphosphate carboxylase/oxygenase activase 1, chloroplastic | Cs7g31800.3 | 46.96/5.94 | 79.78/6.02 | 641 | 175 | 24 | 1.00 ± 0.16b | 1.38 ± 0.30b | 2.16 ± 0.23a | 1.05 ± 0.04b | 21 | 1 |
| S21 | Phosphoribulokinase, chloroplastic | Cs3g08480.1 | 45.19/5.97 | 67.41/5.58 | 686 | 137 | 31 | 1.00 ± 0.05a | 1.01 ± 0.04a | 1.02 ± 0.15a | 0 | 27 | 1 |
| S33 | Sedoheptulose-1,7-bisphosphatase, chloroplastic | Cs7g31640.4 | 36.77/6.66 | 43.56/4.96 | 576 | 101 | 27 | 1.00 ± 0.06a | 1.02 ± 0.06a | 0.75 ± 0.24a | 0 | 23 | 1 |
| S44 | Malate dehydrogenase, mitochondrial | Cs7g25390.1 | 35.48/8.52 | 66.81/4.32 | 613 | 144 | 24 | 1.00 ± 0.02b | 1.18 ± 0.21ab | 0.95 ± 0.15b | 1.64 ± 0.26a | 21 | 1 |
| S45 | Malate dehydrogenase, mitochondrial | Cs7g25390.3 | 37.65/5.95 | 63.69/4.53 | 287 | 171 | 9 | 1.00 ± 0.16bc | 1.15 ± 0.2b | 0.46 ± 0.21c | 1.85 ± 0.22a | 8 | 1 |
| S30 | Enolase | Cs6g15540.1 | 15.09/5.47 | 18.14/4.99 | 928 | 154 | 30 | 1.00 ± 0.12a | 0.53 ± 0.07b | 0.63 ± 0.09b | 0.22 ± 0.08c | 26 | 1 |
| S36 | Enolase | Cs6g15540.1 | 47.79/5.54 | 89.59/5.04 | 531 | 136 | 15 | 1.00 ± 0.25b | 1.04 ± 0.22b | 1.78 ± 0.13a | 1.92 ± 0.11a | 47 | 1 |
| S43 | Dihydrolipoyllysine-residue succinyltransferase component of 2-oxoglutarate dehydrogenase complex 2, mitochondrial | Cs2g21190.3 | 40.39/6.95 | 87.84/4.79 | 268 | 144 | 8 | 1.00 ± 0.26a | 0.56 ± 0.20ab | 0.30 ± 0.06b | 0 | 25 | 1 |
| Antioxidation and Detoxification | |||||||||||||
| S1 | 2-Cys peroxiredoxin BAS1, chloroplastic | Cs6g13880.1 | 29.49/7.65 | 30.56/6.56 | 465 | 161 | 17 | 1.00 ± 0.10a | 0.89 ± 0.11a | 0 | 0.81 ± 0.19a | 15 | 1 |
| S20 | Cysteine synthase, chloroplastic/chromoplastic | Orange1.1t02144.1 | 41.35/8.29 | 56.87/5.55 | 880 | 197 | 28 | 1.00 ± 0.14a | 0 | 0.91 ± 0.09a | 1.17 ± 0.06a | 21 | 1 |
| S39 | Cysteine synthase | Cs9g06970.1 | 29.29/6.78 | 60.56/4.69 | 114 | 49 | 6 | 1.00 ± 0.28a | 1.04 ± 0.12a | 0.78 ± 0.15a | 0 | 17 | 1 |
| S34 | L-ascorbate peroxidase 1, cytosolic | Cs8g17370.1 | 28.68/5.42 | 46.45/5.05 | 392 | 114 | 19 | 1.00 ± 0.05a | 0.82 ± 0.18a | 0.77 ± 0.14a | 0.35 ± 0.01b | 23 | 1 |
| S24 | Glutathione peroxidase (Fragment) | Cs5g03830.1 | 18.58/5.72 | 25.08/5.15 | 646 | 135 | 21 | 1.00 ± 0.14a | 1.02 ± 0.07a | 0.88 ± 0.16ab | 0.55 ± 0.12b | 30 | 1 |
| Chaperones and Folding Catalysts | |||||||||||||
| S16 | Luminal-binding protein 5 | Cs5g01840.2 | 73.56/5.09 | 108.09/5.72 | 578 | 112 | 27 | 1.00 ± 0.18b | 1.07 ± 0.21b | 2.57 ± 0.19a | 2.39 ± 0.23a | 23 | 1 |
| S8 | Peptidyl-prolylcis-transisomerase CYP37, chloroplastic | Cs1g06710.1 | 50.39/6.42 | 58.95/5.92 | 109 | 92 | 5 | 1.00 ± 0.13a | 1.03 ± 0.07a | 0.73 ± 0.05ab | 0.66 ± 0.12b | 2 | 1 |
| S26 | Chaperonin CPN60-1, mitochondrial, putative, expressed | Orange1.1t01459.2 | 46.12/8.24 | 52.38/5.28 | 727 | 152 | 39 | 1.00 ± 0.13a | 0.90 ± 0.14a | 1.16 ± 0.12a | 0 | 34 | 1 |
| Signal Transduction | |||||||||||||
| S35 | Major allergen Pru ar 1 (Major pollen allergen Bet v 1-D/H; Major pollen allergen Bet v 1-A) | Cs9g03630.1 | 48.33/6.19 | 89.59/5.09 | 230 | 94 | 15 | 1.00 ± 0.07a | 0.57 ± 0.15b | 1.20 ± 0.13a | 0.91 ± 0.05ab | 13 | 1 |
| S7 | 14-3-3 protein 6 | Orange1.1t01991.1 | 29.44/4.84 | 45.11/6.09 | 439 | 137 | 18 | 1.00 ± 0.18a | 0.28 ± 0.02b | 0.51 ± 0.13ab | 0.54 ± 0.04ab | 16 | 1 |
| Cellular Transport | |||||||||||||
| S5 | Ferritin-3, chloroplastic | Cs6g09150.2 | 28.97/5.46 | 41.03/5.97 | 406 | 129 | 13 | 1.00 ± 0.03a | 0.65 ± 0.03b | 0.61 ± 0.12b | 0.46 ± 0.03b | 33 | 1 |
| Nucleic acid Metabolism | |||||||||||||
| S42 | RuvB-like helicase 1 | Cs6g16920.1 | 38.08/6.90 | 90.61/4.73 | 268 | 99 | 16 | 1.00 ± 0.17a | 0.82 ± 0.33a | 0.56 ± 0.08a | 0 | 25 | 1 |
| Others | |||||||||||||
| S27 | Orange1.1t05091.1 | 53.64/5.26 | 85.72/5.32 | 246 | 73 | 19 | 1.00 ± 0.38a | 0.15 ± 0.01b | 0.23 ± 0.04b | 0.44 ± 0.18ab | 17 | 1 | |
| S28 | Orange1.1t05091.1 | 61.73/5.85 | 95.17/5.28 | 212 | 70 | 16 | 1.00 ± 0.24a | 0.91 ± 0.15a | 0.32 ± 0.05b | 0.60 ± 0.07ab | 14 | 1 | |
| S31 | Orange1.1t05091.1 | 177.77/7.11 | 24.86/4.86 | 170 | 45 | 15 | 1.00 ± 0.07a | 0.75 ± 0.15ab | 0.53 ± 0.12b | 0 | 14 | 1 | |
| S23 | Anthranilate N-methyltransferase | Cs5g24940.1 | 39.48/5.20 | 23.56/5.23 | 300 | 146 | 17 | 1.00 ± 0.03a | 0.93 ± 0.02a | 0.27 ± 0.10b | 0 | 15 | 1 |
| S37 | S-adenosyl-L-homocysteine hydrolase (adenosylhomocysteinase) | Orange1.1t01892.1 | 17.60/5.67 | 26.91/4.83 | 776 | 172 | 24 | 1.00 ± 0.12a | 1.18 ± 0.07a | 0.73 ± 0.24a | 0 | 21 | 1 |
| S38 | Dihydroflavonol-4-reductase | Cs3g01140.1 | 15.15/4.94 | 43.76/4.84 | 396 | 152 | 14 | 1.00 ± 0.07a | 1.28 ± 0.35a | 2.04 ± 0.45a | 0 | 12 | 1 |
| Unidentified Protein Spots | |||||||||||||
| S6 | Light-harvesting chlorophyll-a/b binding protein Lhca6 (Fragment) | Cs7g27290.1 | 26.56/5.43 | 35.60/5.91 | 105 | 50 | 4 | 1.00 ± 0.24a | 0.87 ± 0.06ab | 0.71 ± 0.09ab | 0.49 ± 0.02b | 31 | 1 |
| S12 | Thioredoxin M-type, chloroplastic | Cs3g20630.1 | 19.91/8.83 | 16.79/5.85 | 60 | 43 | 4 | 1.00 ± 0.18a | 0.95 ± 0.13a | 0.80 ± 0.08ab | 0.40 ± 0.17b | 7 | 1 |
| S15 | Nicotinate-nucleotide pyrophosphorylase [carboxylating], putative | Orange1.1t04780.1 | 55.49/5.09 | 91.64/5.82 | 50 | 131 | 26 | 1.00 ± 0.26a | 0.79 ± 0.18ab | 0.59 ± 0.04ab | 0.30 ± 0.02b | 58 | 1 |
| S18 | Disease resistance protein RFL1, putative | Cs3g08210.1 | 49.77/9.44 | 31.35/5.42 | 50 | 18 | 10 | 1.00 ± 0.20a | 0.39 ± 0.13b | 0.33 ± 0.04b | 0.19 ± 0.1b | 17 | 1 |
| S22 | Dehydration-responsive family protein, putative, expressed | Orange1.1t00308.3 | 49.93/5.04 | 88.43/5.57 | 57 | 117 | 24 | 1.00 ± 0.19a | 0.94 ± 0.06ab | 0.87 ± 0.02ab | 0.65 ± 0.07b | 57 | 1 |
| S25 | Transducin/WD40 domain-containing protein-like protein | Cs9g09840.1 | 29.76/6.18 | 31.98/5.16 | 67 | 41 | 9 | 1.00 ± 0.14a | 0.83 ± 0.15a | 0.51 ± 0.12a | 0 | 8 | 1 |
| S29 | ATPase 8, plasma membrane-type | Cs4g01370.1 | 14.72/5.41 | 22.10/5.07 | 68 | 98 | 11 | 1.00 ± 0.09a | 0.90 ± 0.07ab | 0.72 ± 0.05bc | 0.50 ± 0.09c | 21 | 1 |
| S40 | 4-hydroxy-3-methylbut-2-enyl diphosphate reductase | Cs5g28200.1 | 52.22/6.60 | 81.69/4.72 | 63 | 49 | 5 | 1.00 ± 0.16a | 0.68 ± 0.06a | 0.66 ± 0.14a | 0 | 17 | 1 |
© 2020 by the authors. Licensee MDPI, Basel, Switzerland. This article is an open access article distributed under the terms and conditions of the Creative Commons Attribution (CC BY) license (http://creativecommons.org/licenses/by/4.0/).
Share and Cite
Huang, W.-L.; Wu, F.-L.; Huang, H.-Y.; Huang, W.-T.; Deng, C.-L.; Yang, L.-T.; Huang, Z.-R.; Chen, L.-S. Excess Copper-Induced Alterations of Protein Profiles and Related Physiological Parameters in Citrus Leaves. Plants 2020, 9, 291. https://doi.org/10.3390/plants9030291
Huang W-L, Wu F-L, Huang H-Y, Huang W-T, Deng C-L, Yang L-T, Huang Z-R, Chen L-S. Excess Copper-Induced Alterations of Protein Profiles and Related Physiological Parameters in Citrus Leaves. Plants. 2020; 9(3):291. https://doi.org/10.3390/plants9030291
Chicago/Turabian StyleHuang, Wei-Lin, Feng-Lin Wu, Hui-Yu Huang, Wei-Tao Huang, Chong-Ling Deng, Lin-Tong Yang, Zeng-Rong Huang, and Li-Song Chen. 2020. "Excess Copper-Induced Alterations of Protein Profiles and Related Physiological Parameters in Citrus Leaves" Plants 9, no. 3: 291. https://doi.org/10.3390/plants9030291
APA StyleHuang, W.-L., Wu, F.-L., Huang, H.-Y., Huang, W.-T., Deng, C.-L., Yang, L.-T., Huang, Z.-R., & Chen, L.-S. (2020). Excess Copper-Induced Alterations of Protein Profiles and Related Physiological Parameters in Citrus Leaves. Plants, 9(3), 291. https://doi.org/10.3390/plants9030291