Article

Genetic Diversity and Population Structure of Rhododendron rex Subsp. rex Inferred from Microsatellite Markers and Chloroplast DNA Sequences

1
School of Life Sciences, Yunnan University, Kunming 650091, China
2
School of Ecology and Environmental Sciences & Yunnan Key Laboratory for Plateau Mountain Ecology and Restoration of Degraded Environments, Yunnan University, Kunming 650091, China
3
Yunnan Key Laboratory of Plant Reproductive Adaptation and Evolutionary Ecology, Yunnan University, Kunming 650091, China
4
Breeding Base for State Key Laboratory of Land Degradation and Ecological Restoration in Northwest China, Key Laboratory for Restoration and Reconstruction of Degraded Ecosystem in Northwest China of Ministry of Education, Ningxia University, Yinchuan 750021, China
*
Author to whom correspondence should be addressed.
These authors contribute equals to this work.
Plants 2020, 9(3), 338; https://doi.org/10.3390/plants9030338
Submission received: 7 February 2020 / Revised: 4 March 2020 / Accepted: 5 March 2020 / Published: 7 March 2020
(This article belongs to the Special Issue Plant Biodiversity and Genetic Resources)

Abstract

:
Genetic diversity is vital to the sustainable utilization and conservation of plant species. Rhododendron rex subsp. rex Lévl. is an endangered species endemic to the southwest of China. Although the natural populations of this species are facing continuous decline due to the high frequency of anthropogenic disturbance, the genetic information of R. rex subsp. rex is not yet elucidated. In the present study, 10 pairs of microsatellite markers (nSSRs) and three pairs of chloroplast DNA (cpDNAs) were used in the elucidation of the genetic diversity, population structure, and demographic history of 11 R. rex subsp. rex populations. A total of 236 alleles and 12 haplotypes were found. A moderate genetic diversity within populations (HE = 0.540 for nSSRs, Hd = 0.788 for cpDNA markers), high historical and low contemporary gene flows, and moderate genetic differentiation (nSSR: FST = 0.165***; cpDNA: FST = 0.841***) were detected among the R. rex subsp. rex populations. Genetic and geographic distances showed significant correlation (p < 0.05) determined by the Mantel test. The species exhibited a conspicuous phylogeographical structure among the populations. Using the Bayesian skyline plot and species distribution models, we found that R. rex subsp. rex underwent a population demography contraction approximately 50,000–100,000 years ago. However, the species did not experience a recent population expansion event. Thus, habitat loss and destruction, which result in a population decline and species inbreeding depression, should be considered in the management and conservation of R. rex subsp. rex.

Graphical Abstract

1. Introduction

Rhododendron is the largest woody plant genus in Ericaceae, containing more than 1000 recognized species, of which 567 species representing six subgenera are known from China [1]. Wild Rhododendron species are the major components of alpine and subalpine vegetation and widely distributed in America, Europe, and Asia, which have tropical to polar climates [2,3]. Therefore, these species are potential genetic resources for the development of new cultivars that can adapt to diverse environmental conditions [4]. In addition, plants in the genus Rhododendron L. produce numerous chemical constituents and are recognized as an important source of bioactive phytochemicals [5]. Some Rhododendron species are used as traditional medicine in China, India, Europe, and North America against various diseases, such as inflammation, pain, skin ailments, common cold, and gastrointestinal disorders [5]. However, as an important natural resource for human daily life and ecosystem composition, most Rhododendron species are facing risk of extinction due to the high frequency of anthropogenic disturbance [6]. Thus, research on the population genetic information of Rhododendron species is undoubtedly beneficial for germplasm protection and sustainable utilization [6,7,8,9].
Inferring genetic information is recognized as the undisputed basis for the sustainable exploitation and conservation of plant diversity [10,11]. Different molecular markers are used in assessing genetic information and identifying distinct plant populations for management and conservation [12,13,14]. Microsatellite markers (SSRs) are used in revealing the genetic characteristics and related influence factors of plant species at individual and population levels due to their desirable advantages [13,15]. Chloroplast DNA (cpDNA), which is transmitted only through seeds in most angiosperms, is exceptionally conserved in gene content and organization, providing sufficient information for genome-wide evolutionary studies [16]. cpDNA can reveal a more highly geographical structure than a nuclear genome [17] and is generally used in the detection of phylogeographical patterns in plant species [18,19]. Thus, nSSRs and cpDNA were extensively and successfully documented to study the genetic diversity, variation, and population demographic of plant species [17,20,21,22].
Habitat loss and destruction are global problems that continue to threaten global biodiversity [23,24]. Firstly, habitat destruction and loss can cause a decline in the distribution range and population and limit the natural regeneration of a species. Secondly, habitat destruction and loss can increase selfing rates and decrease pollen diversity, thereby affecting a species’s reproductive success [23,25]. Finally, habitat destruction and loss increase genetic drift and inbreeding and reduce gene flow in the fragmented populations of species and substantially decrease species genetic diversity and adaptation to the changing environment. Some studies suggested that woody plants are less likely to lose genetic diversity after habitat fragmentation and destruction than herbaceous species [26]; however, recent reports showed that habitat loss and fragmentation are associated with increased level of inbreeding, reduced gene flow, genetic variation, plant progeny quality, and genetic extinction debt in woody species [24,27]. Thus, understanding the current genetic information of endangered woody plants subjected to habitat loss and destruction is necessary for effective conservation and management.
Rhododendron species are not only popular woody ornamental plants but also play an important role in alpine and subalpine ecosystems. In addition, R. rex is an important wild germplasm source of the genus Rhodendron in China and an endangered plant endemic to the southwest of China [1]. Three subspecies (R. rex subsp. rex, R. rex subsp. gratum, and R. rex subsp. fictolacteum) are recognized in the R. rex complex. Recently, the wild populations of R. rex subsp. rex are facing continuous decline due to the high frequency of anthropogenic disturbance and forest destruction. Genetic information is important to the management and sustainable exploitation of species, particularly those threatened by habitat loss and destruction. However, the genetic diversity and structure of the wild populations of R. rex subsp. rex remain unexplored. In the present study, the genetic diversity and differentiation, population structure, and demographic history of 11 R. rex subsp. rex populations are inferred using 14 pairs of microsatellite markers and three cpDNA sequences. The following central questions are addressed: (1) What is the level of genetic diversity in R. rex subsp. rex? How does they apportion among/within the populations? (2) How is the genetic structure of the remnant population? Are they affected by historical and contemporary gene flows? (3) How is the phylogenetic relationship of haplotypes? Are they reflected by the demographic history in R. rex subsp. rex? This result is used to design optimum management strategies for R. rex subsp. rex conservation.

2. Materials and Methods

2.1. Plant Material Sampling

We collected 212 individuals of R. rex subsp. rex from 11 natural populations. Four of these populations (BJS, DLT, BCL, and JZS) with 63 individuals were distributed in Yunnan province, whereas seven populations (QLB1, QLB2, QLB3, GDX, LJS, LZS, and YS) with 149 individuals were distributed in Sichuan province, China (Table 1). Our sampling locations covered all the herbarium sampling sites and documented sites of R. rex subsp. rex. During field sampling, sampled site, sampled individuals, and altitude were recorded (Figure 1 and Table 1). Fresh leaves were collected from individuals of R. rex subsp. rex separated by a minimum distance of 15 m and then dried in silica gel immediately. The samplings were stored at −4 °C until DNA extraction.

2.2. DNA Extraction, PCR Amplification, and Sequencing

We extracted genomic DNA of R. rex subsp. rex from the silica-dried leaves through a modified cetyltrimethyl ammonium bromide (CTAB) method [28]. Purified DNA was amplified by three universal cpDNA sequences (rbcL, matK, and psbA-trnH). A total of 14 SSR markers were selected from recently developed nuclear microsatellites in Rhododendron subg. Hymenanthes according to their clarity and reproducibility (Table S1) [29,30,31]. PCR amplification was performed in accordance with methods of Zhang et al. [1]. Forward SSR primers were labeled with a fluorescent dye (FAM, TAMRA, or HEX) and visualized by an ABI 3730xl automated sequencer at Sangon Biotech Services Company Ltd. (Shanghai, China). Fragment sizes were read with the GeneMapper version 4.0. CERVUS [32] was used in eliminating four loci as existing null alleles (F(Null) > 0.4) [33]. PCR products by three cpDNA intergenic spacers were sequenced in both directions by Sangon Biotech Services Company Ltd. (Shanghai, China).

2.3. Data Analysis

2.3.1. Data Analysis of Microsatellite Markers

The dataset was edited and formatted with GenAlEx ver. 6.3 [34]. We used Genepop ver. 4.1.4 to test the Hardy–Weinberg equilibrium (HWE) for each locus and population [35]. The universal genetic diversity parameters were calculated using GenAlEx ver. 6.3 [34] and POPGENE ver. 1.32 [35]. Then, rarefied allelic richness (Ra), total diversity (HT), and the level of gene differentiation (GST) among R. rex subsp. rex populations were estimated by FSTAT ver. 2.9.3 [13,36]. Analysis of the molecular variance (AMOVA) was implemented in the estimation of genetic variation by using Arlequin ver. 3.11 [37,38], and FST values with 103 permutations were calculated for the assessment of genetic differentiation between the pairwise populations of R. rex subsp. rex.
The historical gene flow (Nm) between the pairs of R. rex subsp. rex populations was calculated using Wright’s principles using formula Nm = (1 − FST)/4FST [39]. In addition, pollen to seed gene flow ratio (mp/ms) was calculated using the Ennos formula [40]. To estimate contemporary migration patterns, we estimated the contemporary inter-population migrations in R. rex subsp. rex using the BayesAss version 3.0 by 3 × 106 Markov chain Monte Carlo (MCMC) iterations, with a burn-in of 106 iterations and a sampling frequency of 2000 by setting delta at 0.15 (the default value) [41,42,43].
Isolation by distance was examined in GenAlEx ver. 6.3 on the basis of the correlation of a geographic distance for pairwise populations with FST/(1 − FST) value [34]. Population structure was accessed through unweighted pair group mean analysis (UPGMA) and principal coordinate analysis. TFPGA ver. 1.3 with 5000 permutations [44] and GenAlEx ver. 6.3 [34] were used, respectively. The Bayesian clustering analysis with an admixture model to understand the population structure of R. rex subsp. rex using STRUCTURE ver. 2.2 was also explored [22,45]. K-values in the model ranged from two to 15 with 20 independent variables for each set with a burn-in of 1 × 10⁵ iterations and 1 × 10⁵ subsequent Markov chain Monte Carlo steps [45]. The final best-fit number of the clusters was determined by ΔK values in STRUCTURE HARVESTER ver. 0.6.8 [46,47].
By performing a heterozygosity excess test, we explored the demographic history of the populations. We used two different models, namely, stepwise mutation and two-phased models, to construct the recent bottleneck statistic in BOTTLENECK ver. 1.2.02 (Sign and Wilcoxon tests) [48]. We further analyzed the genetic bottleneck with Garza–Williamson index (GWI) in Arlequin ver. 3.11 [38]. GWI lower than the critical Mc value of 0.68 indicated a reduction in population size [1,38,49].

2.3.2. Data Analysis of cpDNA Sequences

We used SeqMan II [50] and Bioedit ver. 7.0.4.1 [51] to treat the raw sequencing data and manually edited and assembled these sequences [22]. Three cpDNA intergenic spacers of R. rex subsp. rex were combined using PAUP 4.0 [52].
The haplotypes and variable sites of combined cpDNA sequences were calculated by DnaSP ver. 5.0 [53]. Nei’s nucleotide diversity (Pi) and haplotype diversity (Hd) indices of R. rex subsp. rex were tested within a population and among populations. The haplotype distribution in each sampled population was plotted by ArcGIS ver. 10.2. In addition, we calculated HT and within-population gene diversity (HS) with Permut ver. 1.0 [22]. The two values of population differentiation GST and NST were computed in accordance with the methods described by Pons and Petit [54] and with the same software. AMOVA of cpDNA sequences was constructed with Arlequin ver. 3.11 [37,38].
A genealogical haplotype network was constructed by Network ver. 4.2.0.1 for the estimation of the relationship per haplotype, and an indel was treated as a single mutational event [55]. The phylogenetic relationships of the as-obtained haplotypes of R. rex subsp. rex were inferred by Bayesian methods and neighbor-joining method in MrBayes ver. 3.1.2 [56]. Nerium oleander (EU916729.1, GQ997664.1 and AY899942.1) was selected as the outgroup species.
The evolutionary rates of seed plants (1.01 × 10⁻⁹) were used for each Beast analysis in BEAST ver. 1.6.1 [57,58,59] with 107 iterations and a burn-in of 106 under the Hasegawa–Kishino–Yano (HKY) model and a strict clock. The most suitable model (HKY) was determined by Mega ver. 6.06 [60]. The results were visualized using the software FigTree ver. 1.4.2. The signatures of demographic changes in R. rex subsp. rex populations were assessed. We calculated pairwise mismatch distribution, neutrality tests (Tajima’s D and Fu’s FS), the sum of squared deviations and the raggedness index, and their p-values using DnaSP ver. 5.0 [53] and Arlequin ver. 3.11 [38].

2.3.3. Analysis of Species Distribution Model

Species distribution models were constructed for the identification of the species’ potential distribution during the last glacial maximum (LGM; ~21–18 ka) at present and in the future (model rcp45 for the years 2050, model rcp85 for the years 2070) by MAXENT v. 3.3.3k [61]. For each time period, models were run for 25 replicates, and default parameters were used. A total of 28 points comprised our 11 sampled sites and 17 records compiled in the Chinese Virtual Herbarium (www.cvh.org.cn), and 19 bioclimatic variables were obtained from the WorldClim database [62].

3. Results

3.1. SSR Data

We identified 169 alleles at 10 polymorphic loci among 11 R. rex subsp. rex populations, ranging from eight (R-40, R-49) to 30 (R-30), with an average of 16.9 alleles per locus (). All loci and populations conformed to HWE (p > 0.05; Table S3). At the locus level, genetic diversity and variation exhibited certain dissimilarities. However, no remarkable difference was detected between populations (Table 2). NP varied from 2 (BJS) to 12 (DLT and JZS), Ra varied from 3.071 (BJS) to 4.231 (JZS), AE varied from 2.011 (BJS) to 3.954 (YS), and I varied from 0.740 (BJS) to 1.319 (YS). The minimum values of HO (0.300) and HE (0.399) occurred in population BJS. The mean value of fixation indices (Fis = 0.171; Table 2) was positive for R. rex subsp. rex populations, suggesting a slightly increased level of inbreeding.
AMOVA indicated that 83.53% genetic variation occurred within populations, whereas 16.47% variation was estimated among the populations (Table 3). Genetic differentiation was observed among populations (FST = 0.165, 0.15 < FST < 0.25).
A high level of historical gene flow of pairwise populations was detected in R. rex subsp. rex (Table 4). The minimum gene flow was generated from populations BJS and QLB2 (0.307), whereas the maximum gene flow was generated from populations QLB2 and QLB3 (7.452). The relative contribution of mp/ms was 24.775, indicating that pollen dispersal played an important role in the gene flow of R. rex subsp. rex. Except for other populations migrating to LJS, a non-significant level of inter-population contemporary migration rate between the populations of R. rex subsp. rex was detected (M < 0.05, Table 5).
The optimal K value was 3 with ΔK of 63.924, and the second fit value was 6 with ΔK of 16.473 according to STUCTURE analysis (Figure S1A,B). At K of 3, the populations GDX, YS, and JZS were similar, BJS and DLT were related, and the remaining populations BCL, LJS, LZS, QLB1, QLB2, and QLB3 comprised one group (Figure 1B; Figure S1A). At K = 6, the populations BCL and LZS were further distinguished from LJS, QLB1, QLB2, and QLB3, and JZS was further distinguished from GDX and YS (Figure 1C; Figure S1A). This result was in accordance with the conclusions of UPGMA (Figure S1C) and principal component analysis (PCA) at the population level (Figure 2A). In conclusion, the populations of R. rex subsp. rex should be grouped into three groups according to the genetic structure analysis results by using SSR data. A significant correlation between genetic and geographic distances was determined by Mantel test (p < 0.050; Figure 2A).
As shown in Table 6, most of the probabilities of the Wilcoxon and Sign tests under both models in R. rex subsp. rex populations were non-significant (p > 0.05). In addition, the allele distribution per population was presented as a normal L-shaped distribution. The above-mentioned results indicated that the R. rex subsp. rex populations conformed to the mutation–drift equilibrium. However, GWI values were lower than the critical Mc indices (0.68), implying that the populations of R. rex subsp. rex underwent a demographic reduction in history.

3.2. cpDNA Sequence

The three cpDNAs, matK, psbA-trnH, and rbcL were 828, 398, and 658 bp in length, respectively (GenBank accession numbers: MN228019-MN228483). The 1884-bp combined cpDNA sequences of R. rex subsp. rex had 18 polymorphic sites and 12 haplotypes (H1–H12) (Table 1). The detailed haplotype distribution per population is displayed in Figure 1.
The populations DLT (0.538 and 0.00031) and GDX (0.514 and 0.00115) exhibited additional maximum values of Hd and Pi per site, followed by QLB2 (Hd = 0.264, Pi = 0.00028) and QLB3 (Hd = 0.264, Pi = 0.00028), whereas no diversity was found in the seven remaining populations (Table 1). In summary, the total Hd and Pi for R. rex subsp. rex were 0.78768 and 0.00180, respectively. The value of HT (0.909) was higher than that of HS (0.337), and the value of NST (0. 0.774) was significantly higher than that of GST (0.629; p < 0.05; Table S4). These results indicated the remarkable phylogeographic structure among the populations of R. rex subsp. rex. AMOVA indicated that 84.07% genetic variation was partitioned among populations, whereas 15.93% was partitioned within populations (Table 3). This result was inconsistent with the result of nSSRs data. Moreover, significant genetic differentiation was observed among R. rex subsp. rex populations (FST = 0.841, p < 0.001).
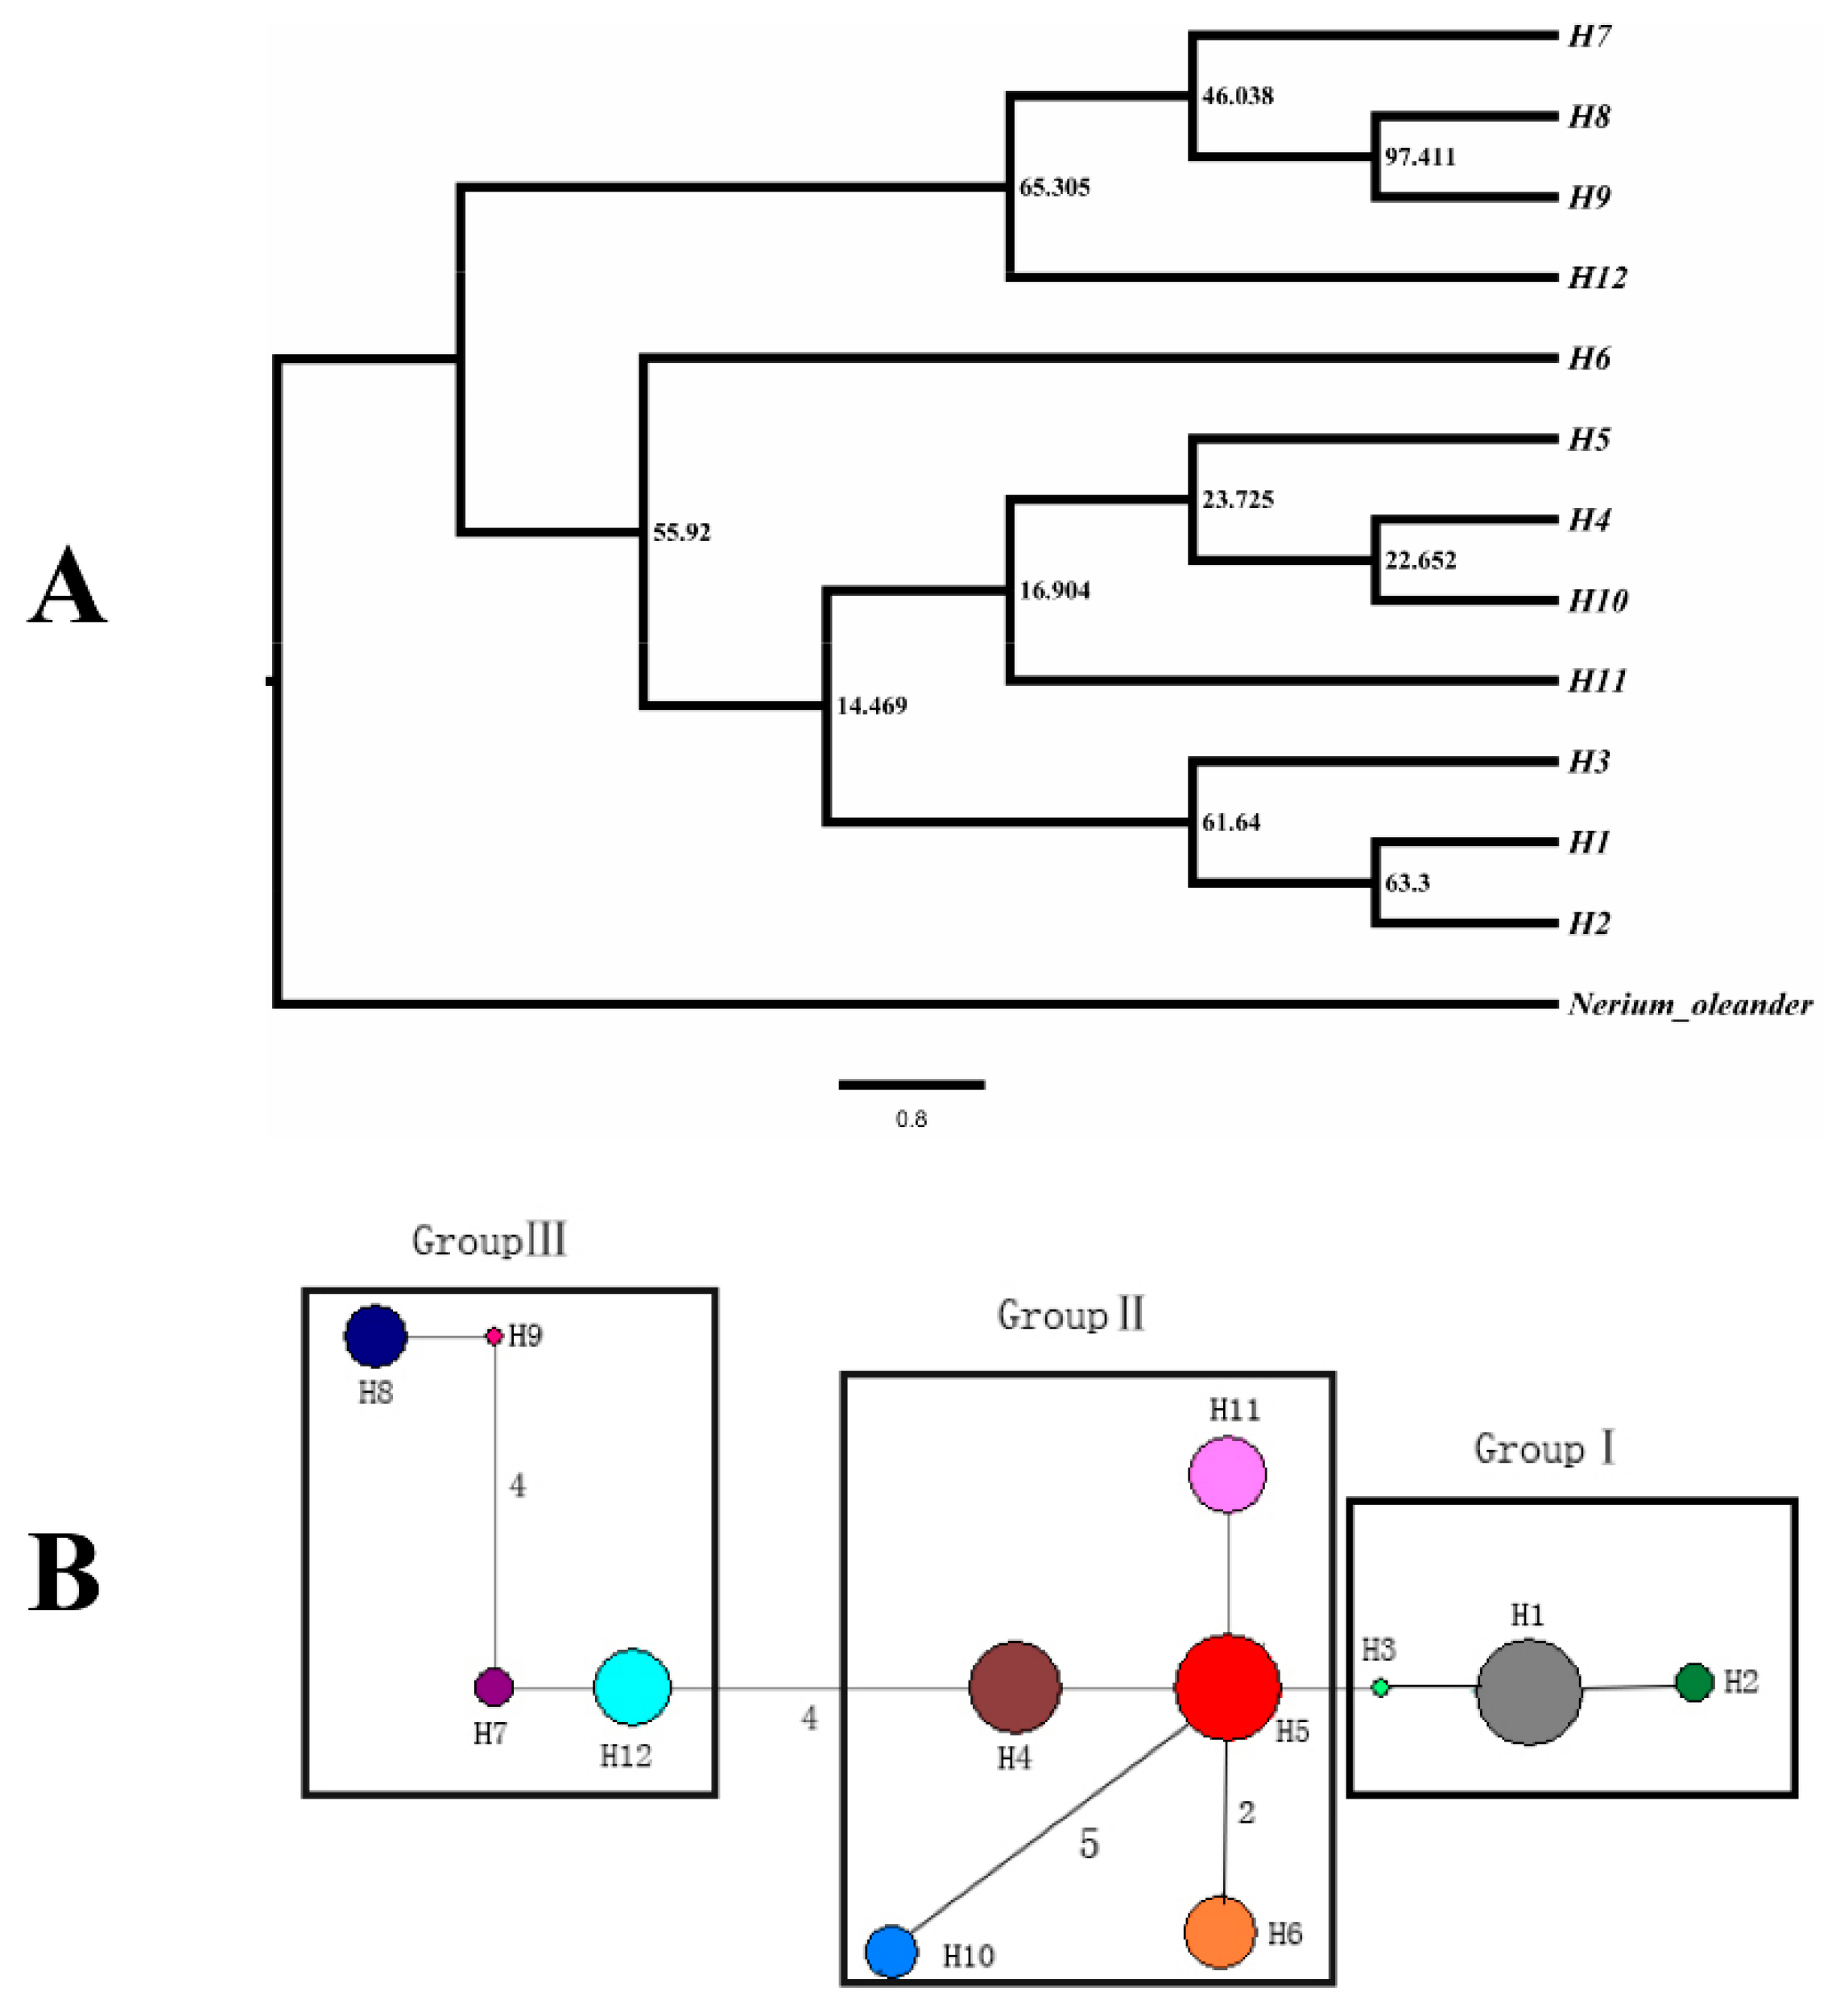
The phylogenetic relationships of 12 cpDNA haplotypes are shown in Figure 3A. H7, H8, H9, and H12 were grouped into one clade. Among the remaining haplotypes, H1, H2, and H3 were grouped into one clade, while H4, H5, H10, and H11 were grouped into another clade. H6 was differentiated from the remaining others. However, the result of the haplotype network diagram shown that H6 distributed more closely to H5, and the 12 cpDNA haplotypes should be divided into three groups (Figure 3B).
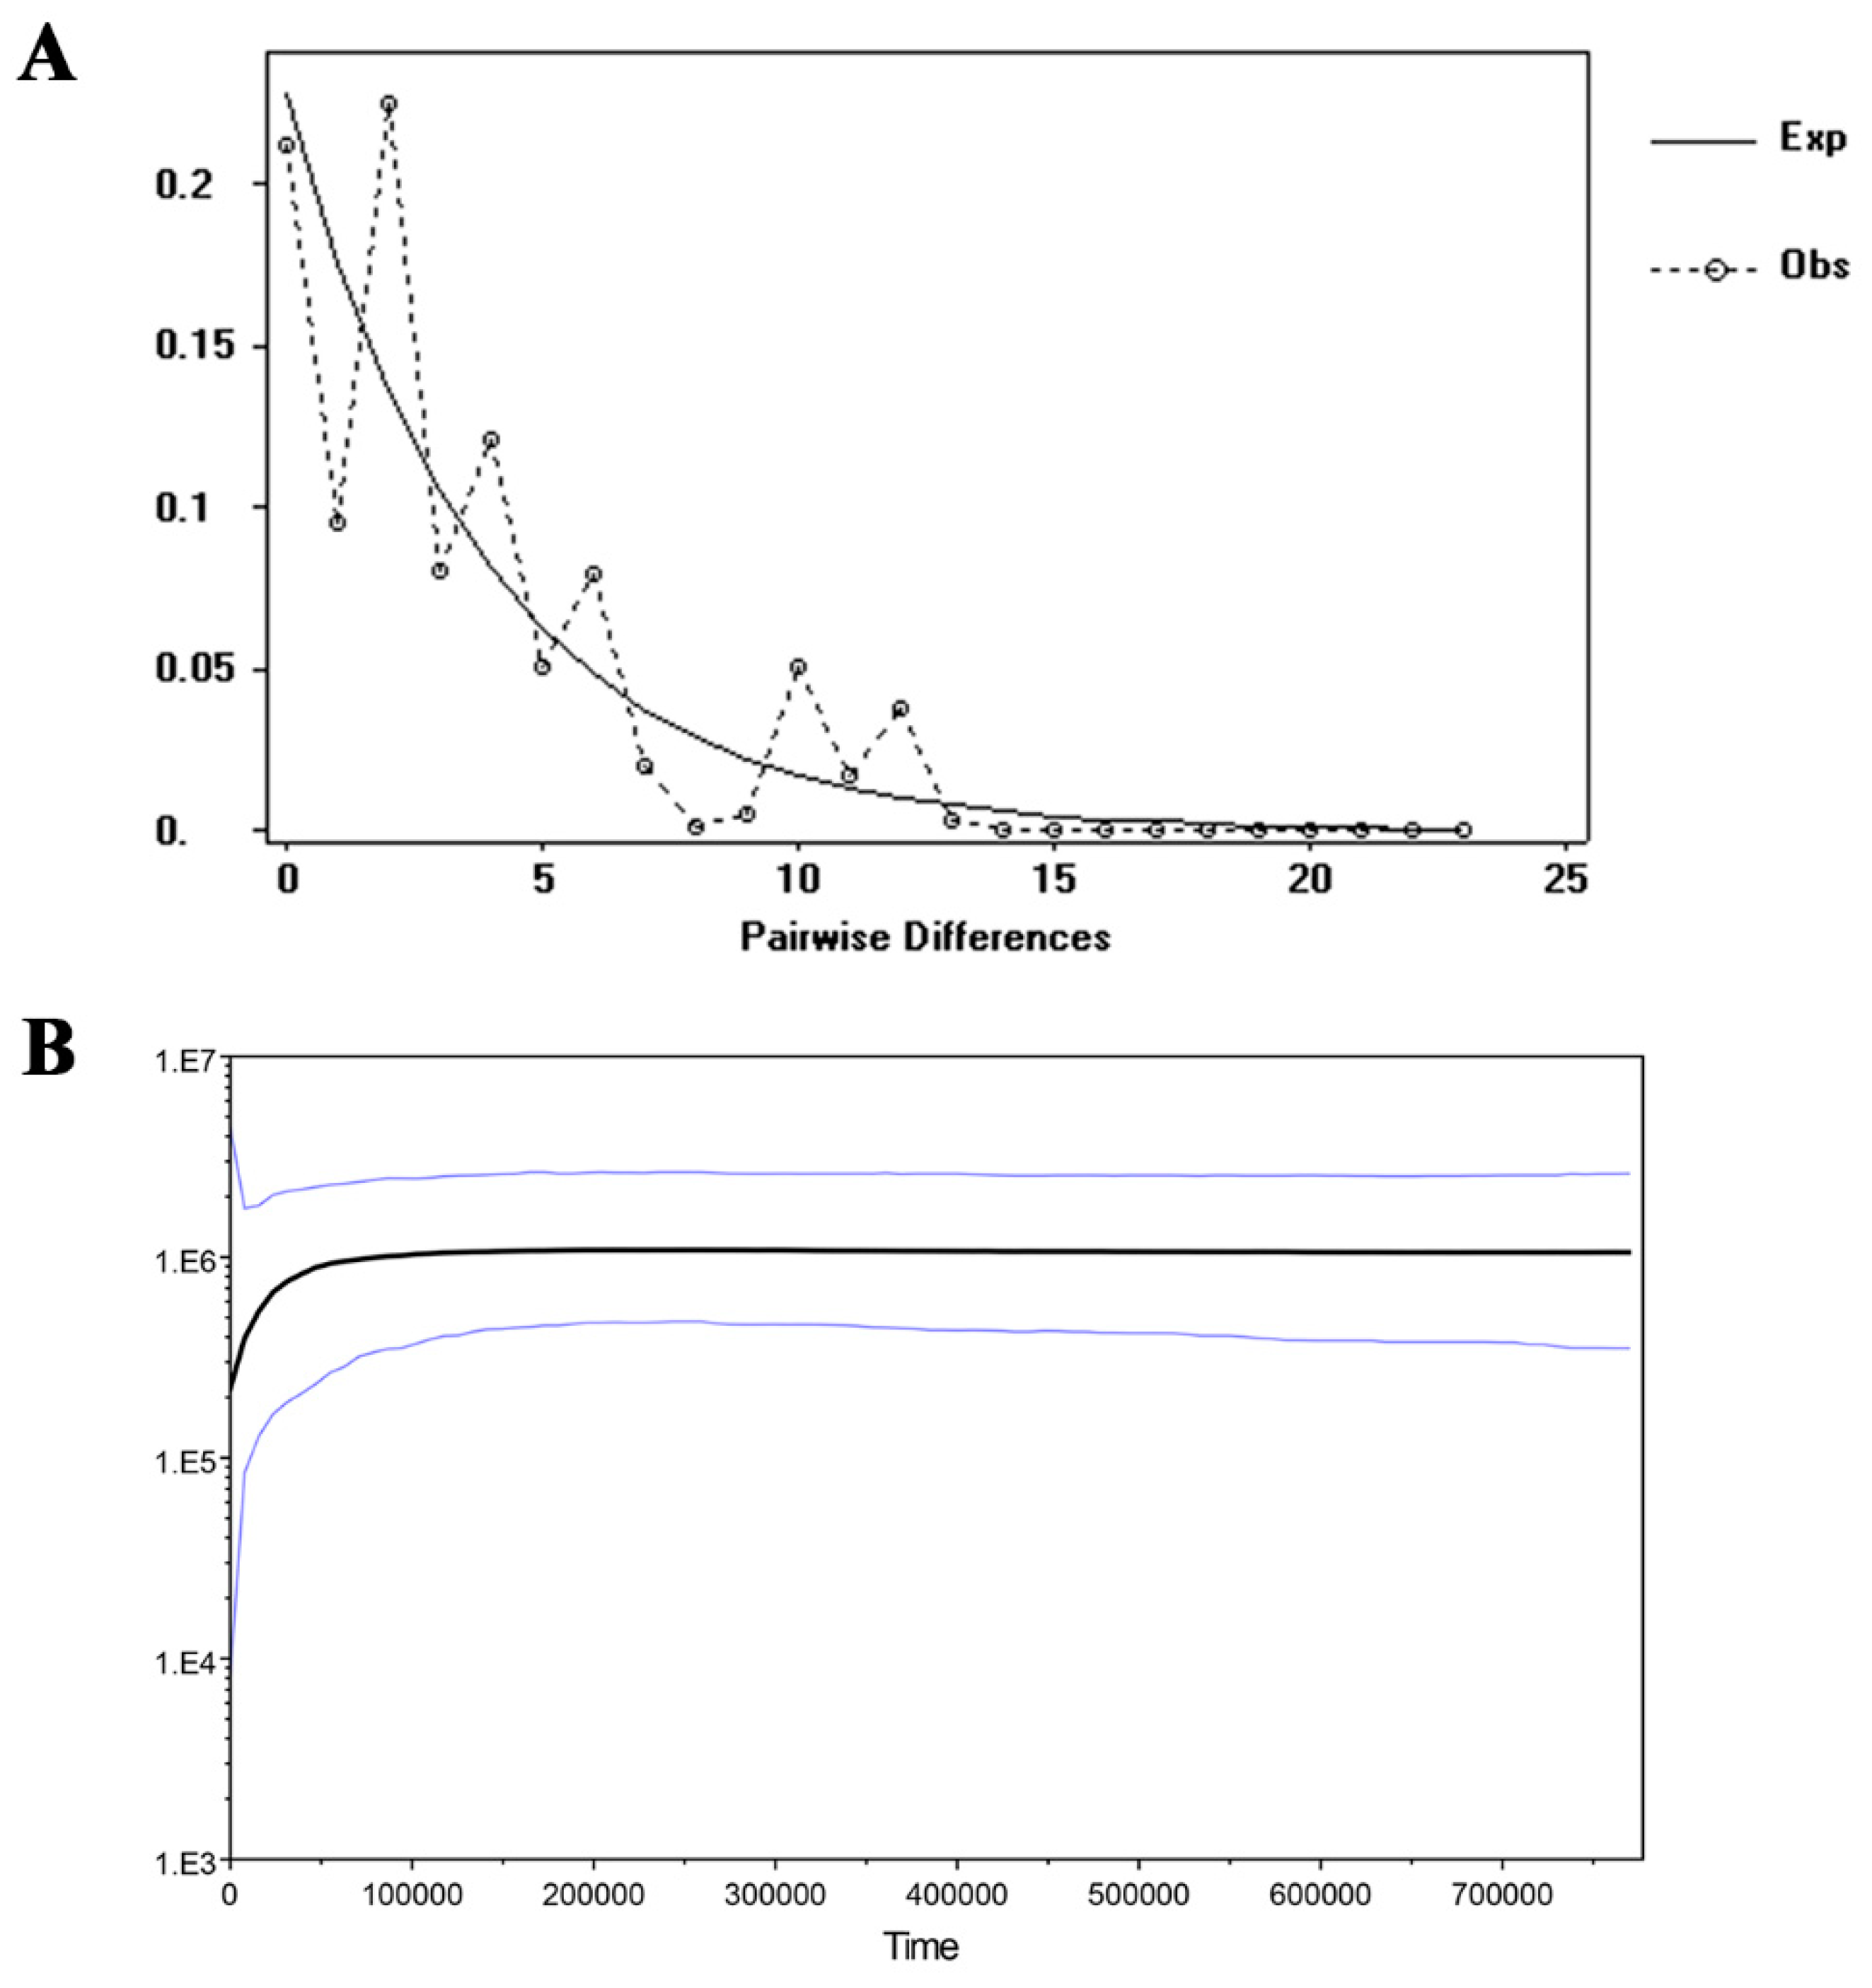
Only the Fu and Li’D yielded significantly positive values (p < 0.05; Table S5) according to the neutrality test. This result indicated that no recent population expansion in R. rex subsp. rex occurred, and this was supported by the effects of mismatch distributions shown in the multimodal graph (Figure 4A). Based on the Bayesian analysis, the skyline plot indicated that the historical demographic of R. rex subsp. rex populations experienced a contraction event approximately 50,000–100,000 years ago and had no recent expansion (Figure 4B).

3.3. Species Distribution Model

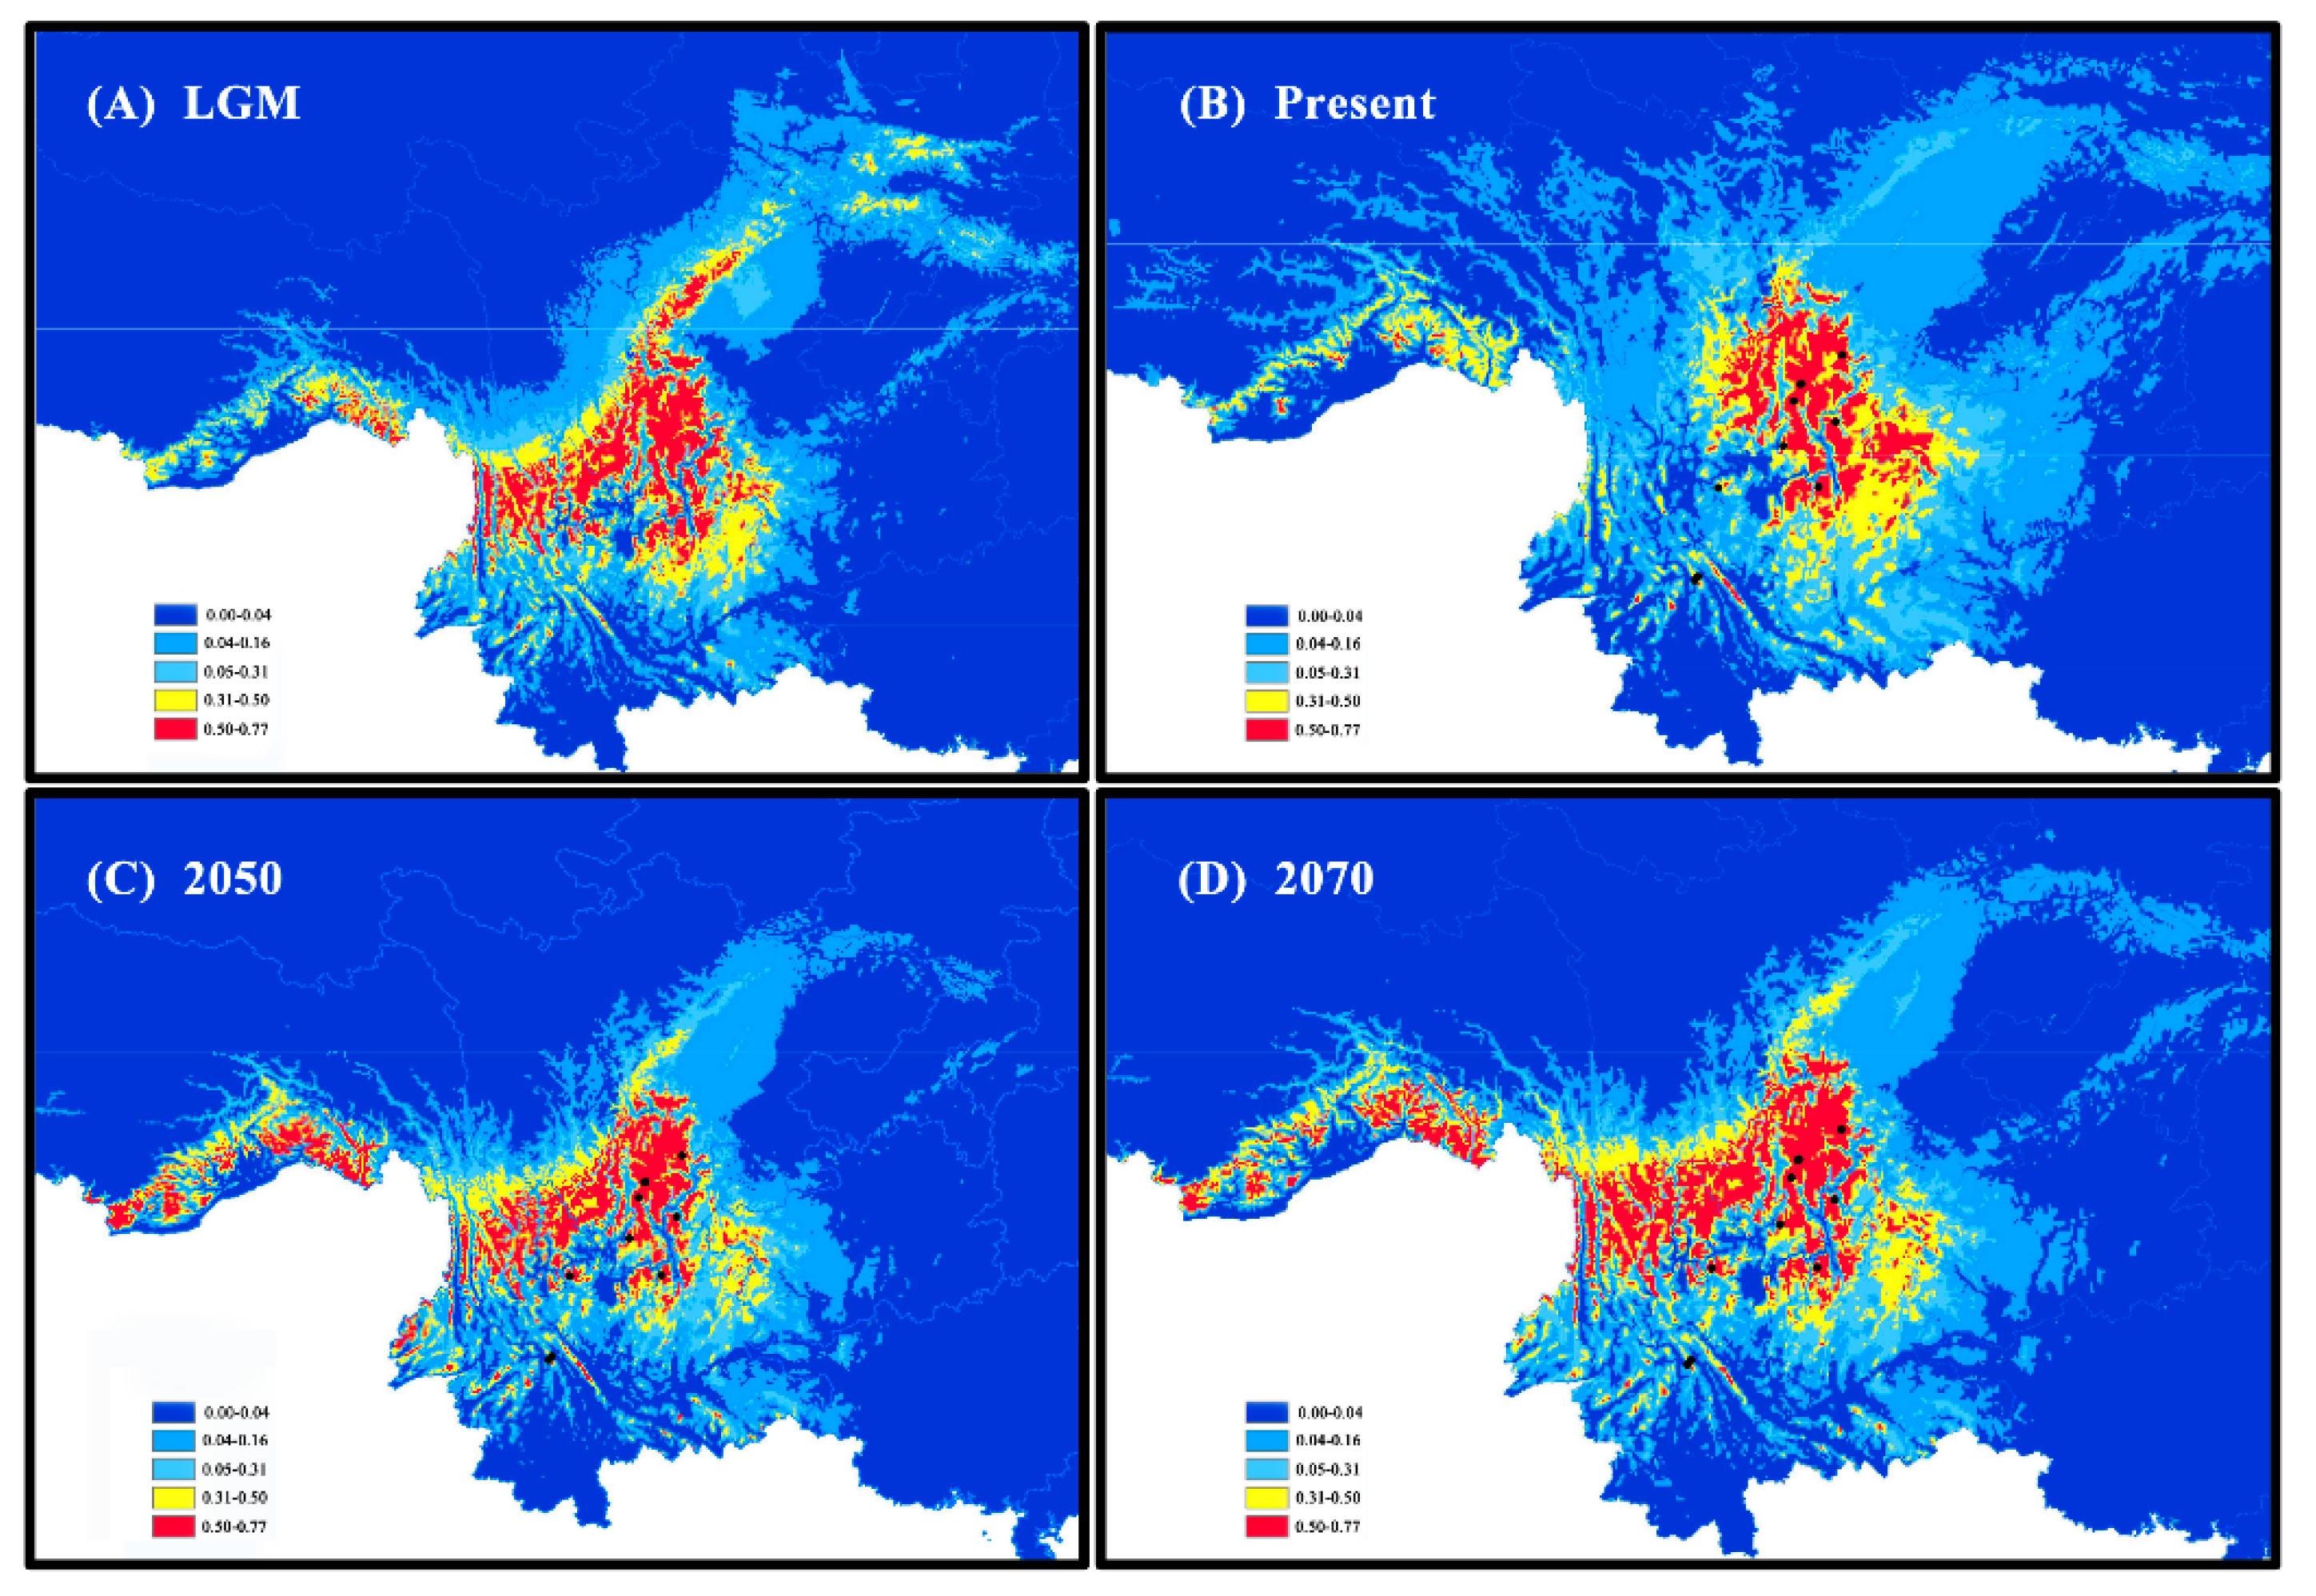
According to predictions of R. rex subsp. rex’s past, present, and future potential distributions, the predicted current distributions showed a clear range contraction relative to the LGM distributions. Moreover, the moderate habitat suitability (>0.31) was slightly removed to the northeastern direction (Figure 5A,B). The potential distribution with moderate to high habitat suitability (>0.31) for the years 2050 and 2070 was slightly extended compared with the present-day model (Figure 5C,D).

4. Discussion

4.1. Genetic Diversity in R. rex Subsp. rex Populations

The genetic diversity of species reflects its long-term evolution and adaptation demographic history [63]. Based on nSSR data, R. rex subsp. rex has lower genetic diversity (HE = 0.540) than the other species of Rhododendron, such as R. protistum var. giganteum (HE = 0.602) [9], R. jinggangshanicum (HE = 0.642) [64], R. simsii (HE = 0.754) [65], R. ripense (HE = 0.800) [66], and R. brachycarpum (HE = 0.815) [67], but has higher genetic diversity than R. ferrugineum (HE = 0.500) [68]. Meanwhile, the genetic diversity of R. rex subsp. rex is evidently higher than that of the “narrow” species (HE = 0.420) and lower than that of the “widespread” species (HE = 0.620) [69]. Inconsistent with the results of microsatellite markers, the genetic diversity of R. rex subsp. rex (Pi = 0.00180) assessed by cpDNA shows a higher tendency toward high genetic diversity than the genetic diversities of 20 species of Rhododendron sect. Brachycalyx (insular species, Pi = 0.00040; continental species, Pi = 0.00160) in East Asia [70], but a lower tendency than the genetic diversity of bird-dispersed arctic–alpine plant Vaccinium vitis-idaea in Ericaceae (Pi = 0.00240) [71]. The value of HT estimated in R. rex subsp. rex (0.909) is higher than the mean value of HT (0.6747) in 170 plant species according to cpDNA [19,72]. Therefore, R. rex subsp. rex possesses a relatively moderate genetic diversity compared with the other species in Rhododendron. In general, life span, reproductive mode, and breeding system are the important factors in genetic diversity [6,22,69]. As in other outcrossing and long-lived species in Rhododendron, high historical gene flow among ancestral population mitigates the loss of genetic diversity and further results in a moderate or high genetic diversity in remnant populations [69,73]. Thus, the current levels of genetic diversity in R. rex subsp. rex may be attributed to the species’ long-lived habit, which is similar to other perennial woody plants [9,22].

4.2. Genetic Differentiation and Structure among R. rex Subsp. rex Populations

The FST value of R. rex subsp. rex indicated that a moderate genetic differentiation among populations occurred. A total of 83.75% genetic variation occurred within R. rex subsp. rex populations with regard to nSSR markers, whereas 83.53% variation was partitioned among populations with regard to cpDNA sequences. This discordance should be affected by dispersal mechanisms among populations of plant species in Rhododendron [74,75]. Insect visitors are the primary pollen dispersal vectors for Rhododendron species. Various insect vectors evolved longer dispersal distance for pollen, whereas the seeds dispersed by wind traveled less than 10 m albeit in open landscapes [74]. Meanwhile, this different consequence might be related to the type and evolutionary rates of different genome sequences [76]. In general, the evolutionary rate of nuclear genomes transmitted by parents was higher than that of maternally inherited chloroplast genomes [77]. Therefore, cpDNA variations reflected a past change, whereas nSSR variations inferred recent events in the population demographics of R. rex subsp. rex.
On the basis of genetic structure analysis by SSR data, the populations of R. rex subsp. rex were grouped into three groups, and the correlation between genetic and geographic distances was significant (p < 0.05). Phylogenetic trees and genealogical haplotype networks based on cpDNA sequences showed that three reciprocally lineages were detected. This species possessed unique genetic lineages and endemic cpDNA haplotypes in its separate refuge populations. The closely related haplotypes H1, H2, and H3 were distributed in populations BJS, BCL, and DLT; H4, H5, H6, H10, and H11 occurred primarily in populations LJS, JZS, LZS, QLB1, QLB2, and QLB3; H7, H8, H9, and H12 were only detected in populations GDX and YS.
Habitat dislocation and overexploitation accelerate the generation of genetic differentiation among populations [9,13]. In the sampled regions, large-scale land reclamation and unreasonable forest destruction can be observed, which resulted in habitat loss and fragmented distribution in R. rex subsp. rex natural populations. In addition, gene flow is a fundamental micro-evolutionary force, influencing genetic differentiation among populations [78,79]. The contemporary gene flow of R. rex subsp. rex is lower than that of the related species of R. protistum var. giganteum [9], which plays an important role in the formation of genetic structure and differentiation among R. rex subsp. rex populations. Moreover, breeding system is an important factor for the genetic differentiation and structure of a species [6,22,69]. Although both selfing and outcrossing are detected in Rhododendron species [80,81], the breeding system in R. rex subsp. rex is yet to be explored. Based on the positive value of fixation indices (Fis) and the phenomenon of all populations deviated from HWE in the present study, we can reasonably speculate that inbreeding is present in populations of R. rex subsp. rex. Hence, the mating system and its influences on genetic differentiation and structure must be further elucidated in R. rex subsp. rex.

4.3. Population Demographic History of the R. rex Subsp. rex

Exploring the historical demography of a species can facilitate our knowledge of its ancient evolutionary environment [58]. Quaternary glaciers profoundly affected the distribution and genetic variation of plant species. Tremendous global climatic oscillations during quaternary glaciations with several glacial–interglacial cycles caused the expansion and contraction of plant distribution [82]. Most plants were subjected to population demographic stability or expansion throughout the LGM [83,84]. The Bayesian skyline plot of cpDNA showed that R. rex subsp. rex experienced a notable reduction approximately 50,000–100,000 years ago. This supposition is supported by the GWI values, which are lower than the critical Mc indices (0.68). Microsatellite-based bottleneck analysis indicated that no recent bottleneck event occurred in the natural populations of R. rex subsp. rex. Therefore, the population demographic contraction detected in the R. rex subsp. rex might have been the result of climate oscillations, and the finding is consistent with the results obtained from other species, such as Cycas simplicipinna [63]. Typically, rapid population expansion occurred in the post-glacial period because temperatures increased to warm conditions [85]. However, based on neutrality and mismatch distribution tests, no recent population expansion occurred in R. rex subsp. rex. We speculate that the populations of R. rex subsp. rex might have survived in situ rather than migrating long distances to suitable habitats and that evolutionary adaptation might have occurred in the cold environment. The current existing populations of R. rex subsp. rex were limited in distribution at 2400–3400 m elevation, and this condition might partly support our speculation. In addition, the complex topology of physical environmental condition in southwest China might cause geographical barriers between population migrations. This scenario was also found in the population demography of Leucomeris decora [86].

5. Conclusions

The present study firstly investigated the genetic diversity, population structure, and demographic history of 11 remnant R. rex subsp. rex populations. A moderate genetic diversity, a high genetic differentiation, and a conspicuous geographical structure were detected in R. rex subsp. rex. The species possessed unique genetic lineages and endemic cpDNA haplotypes in its separate refuge populations. In addition, we found that R. rex subsp. rex experienced a population contraction approximately 50,000–100,000 years ago based on the comprehensive analysis of demographic history. Furthermore, no recent population expansion occurred in this species. Hence, the conservation of R. rex subsp. rex should focus on habitat destruction and loss, resulting in a population decline and inbreeding depression within populations. Furthermore, all the remnant adult trees of R. rex subsp. rex should receive priority protection for the maintenance of its genetic diversity. This research exhibited tremendous ecological value for the future conservation and sustainable utilization of R. rex subsp. rex and other similar plants, which are subjected to climate oscillation, inbreeding depression, overexploration, and habitat destruction.

Supplementary Materials

The following are available online at https://www.mdpi.com/2223-7747/9/3/338/s1: Figure S1. Bayesian inference of the number of clusters when K = 3 and K = 8 (A), delta K values obtained (B), and an unweighted pair-group method with arithmetic averages (UPGMA) phenogram of R. rex subsp. rex (C) based on nSSR; Table S1. The information of 14 microsatellite primers for the R. rex subsp. rex; Table S2. Summary of the 10 microsatellite loci used to the 11 populations of R. rex subsp. rex; Table S3. p-Value of Hardy–Weinberg equilibrium test for 11 populations of R. rex subsp. rex; Table S4. Genetic diversity and differentiation parameters for the combined cpDNA in 11 populations of R. rex subsp. rex; Table S5. Parameters of neutrality tests based on cpDNA of R. rex subsp. rex.

Author Contributions

S.-K.S., Y.-H.L., X.Z., and Y.-H.W. initiated and designed the research. S.-K.S. obtained funding for this study. S.-K.S., Y.-H.L., and X.Z. collected the materials and performed the experiments. S.-K.S., Y.-H.L., X.Z., and Y.-H.W. wrote and revised the paper. All authors read and approved the version to be published. All authors have read and agreed to the published version of the manuscript.

Funding

This study was financially supported by the National Key Research and Development Project of China (2017YFC0505204), the National Natural Science Foundation of China (31560224, 31870529), the Young Academic and Technical Leader Raising Foundation of Yunnan Province (2018HB035), the Open Fund of Yunnan Key Laboratory for Plateau Mountain Ecology and Restoration of Degraded Environments (2018DG005), and the Program for Excellent Young Talents, Yunnan University.

Acknowledgments

The authors thank Xiu-Yan Feng from the Kunming Institute of Botany, Chinese Academy of Science for her construction suggestions. We also thank Fang-Li Liu, Xiong-Li Zhou, and Yue Zhang for their assistance with the field sampling.

Conflicts of Interest

The authors declare no conflicts of interest.

References

  1. Zhang, Y.; Zhang, X.; Wang, Y.H.; Shen, S.K. De Novo Assembly of transcriptome and development of novel EST-SSR markers in Rhododendron rex Lévl. through illumina sequencing. Front. Plant Sci. 2017, 8, 1664. [Google Scholar] [CrossRef] [Green Version]
  2. Yoichi, W.; Jin, X.F.; Peng, C.I.; Tamaki, I.; Tomaru, N. Contrasting diversification history between insular and continental species of three-leaved azaleas (Rhododendron sect. Brachycalyx) in East Asia. J. Biogeogr. 2017, 44, 1065–1076. [Google Scholar] [CrossRef]
  3. Xing, W.; Liao, J.; Cai, M.; Xia, Q.; Liu, Y.; Zeng, W.; Jin, X. De novo assembly of transcriptome from Rhododendron latoucheae Franch. using illumina sequencing and development of new EST-SSR markers for genetic diversity analysis in Rhododendron. Tree Genet. Genomes 2017, 13, 53. [Google Scholar] [CrossRef]
  4. Wei, H.; Dhanaraj, A.L.; Rowland, L.J.; Fu, Y.; Krebs, S.L.; Arora, R. Comparative analysis of expressed sequence tags from cold-acclimated and non-acclimated leaves of Rhododendron catawbiense Michx. Planta 2005, 221, 406–416. [Google Scholar] [CrossRef]
  5. Qiang, Y.; Zhou, B.; Gao, K. Chemical constituents of plants from the genus. Rhododendron 2011, 8, 792–815. [Google Scholar]
  6. Wu, F.Q.; Shen, S.K.; Zhang, X.J.; Wang, Y.H.; Sun, W.B. Genetic diversity and population structure of an extremely endangered species: The world’s largest Rhododendron. AoB Plants 2015, 7, 10696–10700. [Google Scholar] [CrossRef] [PubMed] [Green Version]
  7. Scheiber, S.M.; Robacker, C.D.; Lindstrom, O.M. Evaluation of deciduous azaleas for cold hardiness potential in the southeastern united states. J. Environ. Hortic. 2000, 18, 230–233. [Google Scholar]
  8. Scariot, V.; De, K.E.; Handa, T.; De, R.J. Comparative study of the discriminating capacity and effectiveness of AFLP, STMS and EST markers in assessing genetic relationships among evergreen azaleas. Plant Breed. 2010, 126, 207–212. [Google Scholar] [CrossRef]
  9. Wu, F.Q.; Shen, S.K.; Zhang, X.; Yang, G.S.; Wang, Y.H. Inferences of genetic structure and demographic history of Rhododendron protistum var. giganteum—The world’s largest Rhododendron using microsatellite markers. Flora 2017, 233, 1–6. [Google Scholar] [CrossRef]
  10. Frankham, R. Genetics and extinction. Biol. Conserv. 2005, 126, 131–140. [Google Scholar] [CrossRef]
  11. Divakara, B.N.; Upadhyaya, H.D.; Wani, S.P.; Gowda, C.L.L. Biology and genetic improvement of Jatropha curcas L.: A review. Appl. Energy 2010, 87, 732–742. [Google Scholar] [CrossRef] [Green Version]
  12. Han, Y.C.; Teng, C.Z.; Chang, F.H.; Robert, G.W.; Zhou, M.Q.; Hu, Z.L.; Song, Y.C. Analyses of genetic relationships in Nelumbo nucifera using nuclear ribosomal ITS sequence data, ISSR and RAPD markers. Aquat. Bot. 2007, 87, 141–146. [Google Scholar] [CrossRef]
  13. Zhang, J.J.; Ye, Q.G.; Gao, P.X.; Yao, X.H. Genetic footprints of habitat fragmentation in the extant populations of Sinojackia (Styraceaceae): Implications for conservation. Bot. J. Linn. Soc. 2012, 170, 232–242. [Google Scholar] [CrossRef] [Green Version]
  14. Mutegi, S.M.; Muchugi, A.; Carsan, S.; Kariba, R.; Jamnadass, R.; Oballa, P.; Brunner, A.M.; Runo, S. Genetic diversity of the African poplar (Populus ilicifolia) populations in Kenya. Tree Genet. Genomes 2016, 12, 1–7. [Google Scholar] [CrossRef]
  15. Wambulwa, M.C.; Meegahakumbura, M.K.; Chalo, R.; Kamunya, S.; Muchugi, A.; Xu, J.C.; Liu, J.; Li, D.Z.; Gao, L.M. Nuclear microsatellites reveal the genetic architecture and breeding history of tea germplasm of east Africa. Tree Genet. Genomes 2016, 12, 1–10. [Google Scholar] [CrossRef]
  16. Pervaiz, T.; Sun, X.; Zhang, Y.; Tao, R.; Zhang, J.; Fang, J. Association between chloroplast and mitochondrial dna sequences in Chinese Prunus genotypes (Prunus persica, Prunus domestica, and Prunus avium). BMC Plant Biol. 2015, 15, 4. [Google Scholar] [CrossRef] [Green Version]
  17. Yuan, Q.J.; Zhang, Z.Y.; Peng, H.; Ge, S. Chloroplast phylogeography of dipentodon (dipentodontaceae) in southwest china and northern Vietnam. Mol. Ecol. 2008, 17, 1054–1065. [Google Scholar] [CrossRef]
  18. Hewitt, G. The genetic legacy of the Quaternary ice ages. Nature 2000, 405, 907–913. [Google Scholar] [CrossRef]
  19. Petit, R.J.; Duminil, J.; Fineschi, S.; Hampe, A.; Salvini, D.; Vendramin, G.G. Comparative organization of chloroplast, mitochondrial and nuclear diversity in plant populations. Mol. Ecol. 2005, 14, 689–701. [Google Scholar] [CrossRef] [Green Version]
  20. Garcia-Lor., A.; Luro, F.; Ollitrault, P.; Navarro, L. Genetic diversity and population structure analysis of mandarin germplasm by nuclear, chloroplastic and mitochondrial markers. Tree Genet. Genomes 2015, 11, 1–15. [Google Scholar] [CrossRef]
  21. Mingeot, D.; Husson, C.; Mertens, P.; Watillon, B.; Bertin, P.; Druart, P. Genetic diversity and genetic structure of black alder (Alnus glutinosa [L.] Gaertn) in the Belgium-Luxembourg-France cross-border area. Tree Genet. Genomes 2016, 12, 1–12. [Google Scholar] [CrossRef] [Green Version]
  22. Zhang, X.; Shen, S.K.; Wu, F.Q.; Wang, Y.H. Inferring genetic variation and demographic history of Michelia yunnanensis Franch. (Magnoliaceae) from chloroplast DNA sequences and microsatellite markers. Front. Plant Sci. 2017, 8, 583. [Google Scholar] [CrossRef] [PubMed] [Green Version]
  23. Breed, M.; Ottewell, K.; Gardner, M.; Marklund, M.H.K.; Dormontt, E.E.; Lowe, A.J. Mating patterns and pollinator mobility are critical traits in forest fragmentation genetics. Heredity 2015, 115, 108–114. [Google Scholar] [CrossRef] [PubMed] [Green Version]
  24. Aguilar, R.; Cristóbal-Pérez, E.J.; Balvino-Olvera, F.J.; Aguilar-Aguilar, M.; Aguirre-Acosta, N.; Ashworth, L.; Lobo, J.A.; Martén-Rodríguez, S.; Fuchs, E.J.; Sanchez-Montoya, G.; et al. Habitat fragmentation reduces plant progeny quality: A global synthesis. Ecol. Lett. 2019, 22, 1163–1173. [Google Scholar] [CrossRef] [Green Version]
  25. Sáyago, R.; Quesada, M.; Aguilar, R.; Ashworth, L.; Lopezaraiza-Mikel, M.; Martén-Rodríguez, S. Consequences of habitat fragmentation on the reproductive success of two Tillandsia species with contrasting life history strategies. AoB Plants 2018, 10. [Google Scholar] [CrossRef] [Green Version]
  26. Hamrick, J.L. Response of forest trees to global environmental changes. For. Ecol. Manag. 2004, 197, 323–335. [Google Scholar] [CrossRef]
  27. Vranckx, G.; Jacquemyn, H.; Muys, B.; Honnay, O. Meta-analysis of susceptibility of woody plants to loss of genetic diversity through habitat fragmentation. Conserv. Biol. 2011, 26, 228–237. [Google Scholar] [CrossRef]
  28. Doyle, J. DNA protocols for plants—CTAB total DNA isolation. In Molecular Techniques in Taxonomy; Hewitt, G.M., Ed.; Springer: Berlin, Germany, 1991. [Google Scholar]
  29. Wang, X.; Huang, Y.; Long, C.L. Isolation and characterization of twenty-four microsatellite loci or Rhododendron decorum Franch (Ericaceae). Hortscience 2009, 44, 2028–2030. [Google Scholar] [CrossRef] [Green Version]
  30. Wang, N.; Qin, Z.C.; Yang, J.B.; Zhang, J. Development and characterization of 15 microsatellite loci for Rhododendron delavayi Franch. (Ericaceae). Hortscience 2010, 45, 457–459. [Google Scholar] [CrossRef]
  31. Li, L.F.; Yin, D.X.; Song, N. Genomic and EST microsatellites for Rhododendron aureum (Ericaceae) and cross-amplification in other congeneric species. Am. J. Bot. 2011, 98, 250–252. [Google Scholar] [CrossRef]
  32. Dakin, E.E.; Avise, J.C. Microsatellite null alleles in parentage analysis. Heredity 2004, 93, 504–509. [Google Scholar] [CrossRef] [PubMed]
  33. Fan, L.; Zheng, H.; Milne, R.I.; Zhang, L.; Mao, K. Strong population bottleneck and repeated demographic expansions of Populus adenopoda (salicaceae) in subtropical China. Ann. Bot. 2018, 121, 665–679. [Google Scholar] [CrossRef] [PubMed] [Green Version]
  34. Peakall, R.; Smouse, P.E. GENALEX 6: Genetic analysis in excel. Population genetic software for teaching and research. Mol. Ecol. Notes 2006, 6, 288–295. [Google Scholar] [CrossRef]
  35. Yeh, F.C.; Yang, R.; Boyle, T.B.; Ye, Z.; Mao, J.X. POPGENE, the User-Friendly Shareware for Population Genetic Analysis; University of Alberta: Edmonton, AB, Canada, 1997; Available online: http://www.ualberta.ca/~fyeh/ (accessed on 5 February 2020).
  36. Goudet, J. FSTAT (Version 1.2): A computer program to calculate F-statistics. J. Hered. 1995, 86, 485–486. [Google Scholar] [CrossRef]
  37. Excoffier, L.; Smouse, P.E.; Quattro, J.M. Analysis of molecular variance inferred from metric distances among DNA haplotypes: Application to human mitochondrial DNA restriction data. Genetics 1992, 131, 479–491. [Google Scholar]
  38. Excoffier, L.; Laval, G.; Schneider, S. Arlequin (Version 3.0): An integrated software package for population genetics data analysis. Evol. Bioinform. 2005, 1, 47. [Google Scholar] [CrossRef] [Green Version]
  39. Wright, S. Evolution in Mendelian populations. Genetics 1931, 16, 97. [Google Scholar]
  40. Ennos, R.A. Estimating the relative rates of pollen and seed migration among plant populations. Heredity 1994, 72, 250–259. [Google Scholar] [CrossRef] [Green Version]
  41. Abbott, R.J.; Brochmann, C. History and evolution of the arctic flora: In the footsteps of eric hultén. Mol. Ecol. 2003, 12, 299–313. [Google Scholar] [CrossRef]
  42. Wilson, G.A.; Rannala, B. Bayesian inference of recent migration rates using multilocus genotypes. Genetics 2003, 163, 1177–1191. [Google Scholar]
  43. Meirmans, P.G. Nonconvergence in Bayesian estimation of migration rates. Mol. Ecol. Resour. 2014, 14, 726–733. [Google Scholar] [CrossRef] [PubMed]
  44. Miller, M.P. Tools for population genetic analyses (TFPGA) 1.3: A Windows program for the analysis of allozyme and molecular population genetic data. Comput. Softw. 1997, 4, 157. [Google Scholar]
  45. Pritchard, J.K.; Stephens, M.; Donnelly, P. Inference of population structure using multilocus genotype data. Genetics 2000, 155, 945–959. [Google Scholar] [PubMed]
  46. Evanno, G.; Regnaut, S.; Goudet, J. Detecting the number of clusters of individuals using the software STRUCTURE: A simulation study. Mol. Ecol. 2005, 14, 2611–2620. [Google Scholar] [CrossRef] [PubMed] [Green Version]
  47. Earl, D.A. STRUCTURE HARVESTER: A website and program for visualizing STRUCTURE output and implementing the Evanno method. Conserv. Genet. Resour. 2012, 4, 359–361. [Google Scholar] [CrossRef]
  48. Piry, S.; Luikart, G.; Cornuet, J. BOTTLENECK: A computer program for detecting recent reductions in the effective size using allele frequency data. J. Hered. 1999, 90, 502–503. [Google Scholar] [CrossRef]
  49. Garza, J.C.; Williamson, E.G. Detection of reduction in population size using data from microsatellite loci. Mol. Ecol. 2001, 10, 305–318. [Google Scholar] [CrossRef]
  50. Swindell, S.R.; Plasterer, T.N. Sequence Data Analysis Guidebook; Humana Press: New York, NY, USA, 1997; pp. 75–89. [Google Scholar]
  51. Hall, T.A. BioEdit: A user-friendly biological sequence alignment editor and analysis program for Windows 95/98/NT. Nucleic Acids Symp. Ser. 1999, 41, 95–98. [Google Scholar]
  52. Swofford, D.L. PAUP*: Phylogenetic Analysis Using Parsimony (and Other Methods); Version 4.0b10; Sinauer Associates, Inc.: Sunderland, MA, USA, 2002. [Google Scholar]
  53. Librado, P.; Rozas, J. DnaSP v5: A software for comprehensive analysis of DNA polymorphism data. Bioinformatics 2009, 25, 1451–1452. [Google Scholar] [CrossRef] [Green Version]
  54. Pons, O.; Petit, R.J. Measuring and testing genetic differentiation with ordered versus unordered alleles. Genetics 1996, 144, 1237–1245. [Google Scholar]
  55. Bandelt, H.J.; Forster, P.; Röhl, A. Median-joining networks for inferring intraspecifc phylogenies. Mol. Biol. Evol. 1999, 16, 37–48. [Google Scholar] [CrossRef] [PubMed]
  56. Ronquist, F.; Huelsenbeck, J.P. MrBayes 3: Bayesian phylogenetic inference under mixed models. Bioinformatics 2003, 19, 1572–1574. Available online: http://tree.bio.ed.ac.uk/software/figtree/ (accessed on 5 February 2020). [CrossRef] [PubMed] [Green Version]
  57. Batalha-Filho, H.; Cabanne, G.S.; Miyaki, C.Y. Phylogeography of an Atlantic forest passerine reveals demographic stability through the last glacial maximum. Mol. Phylogenet. Evol. 2012, 65, 892–902. [Google Scholar] [CrossRef] [PubMed]
  58. Graur, D.; Li, W.H. Fundamentals of Molecular Evolution; Sinauer Associates: Sunderland, MA, USA, 2000. [Google Scholar]
  59. Drummond, A.J.; Rambaut, A. BEAST: Bayesian evolutionary analysis by sampling trees. BMC Evol. Biol. 2007, 7, 214. [Google Scholar] [CrossRef] [Green Version]
  60. Tamura, K.; Stecher, G.; Peterson, D.; Filipski, A.; Kumar, S. MEGA6: Molecular evolutionary genetics analysis version 6.0. Mol. Boil. Evol. 2013, 30, 2725–2729. [Google Scholar] [CrossRef] [Green Version]
  61. Phillips, S.J.; Anderson, R.P.; Schapire, R.E. Maximum entropy modeling of species geographic distributions. Ecol. Model. 2006, 190, 231–259. [Google Scholar] [CrossRef] [Green Version]
  62. Hijmans, R.J.; Cameron, S.E.; Parra, J.L.; Jones, P.G.; Jarvis, A. Very high resolution interpolated climate surfaces for global land areas. Int. J. Clim. 2005, 25, 1965–1978. Available online: http://www.worldclim.org (accessed on 5 February 2020). [CrossRef]
  63. Feng, X.Y.; Wang, Y.; Gong, X. Genetic diversity, genetic structure and demographic history of Cycas simplicipinna (Cycadaceae) assessed by DNA sequences and SSR markers. BMC Plant Biol. 2014, 14, 187. [Google Scholar] [CrossRef] [Green Version]
  64. Li, M.W.; Chen, S.F.; Shi, S.; Zhang, Z.; Liao, W.B.; Wu, W.; Zhou, R.C.; Fan, Q. High genetic diversity and weak population structure of Rhododendron jinggangshanicum, a threatened endemic species in Mount Jinggangshan of China. Biochem. Syst. Ecol. 2015, 58, 178–186. [Google Scholar] [CrossRef]
  65. Tan, X.X.; Li, Y.; Ge, X.J. Development and characterization of eight polymorphic microsatellites for Rhododendron simsii Planch (Ericaceae). Conserv. Genet. 2009, 10, 1553–1555. [Google Scholar] [CrossRef]
  66. Kondo, T.; Nakagishi, N.; Isagi, Y. Shaping of genetic structure along Pleistocene and modern river systems in the hydrochorous riparian azalea, Rhododendron ripense (Ericaceae). Am. J. Bot. 2009, 96, 1532–1543. [Google Scholar] [CrossRef] [PubMed]
  67. Hirao, A.S. Kinship between parents reduces offspring fitness in a natural population of Rhododendron brachycarpum. Ann. Bot. 2010, 105, 637–646. [Google Scholar] [CrossRef] [Green Version]
  68. Bruni, I.; De Mattia, F.; Labra, M.; Grassi, F.; Fluch, S.; Berenyi, M.; Ferrari, C. Genetic variability of relict Rhododendron ferrugineum L. populations in the Northern Apennines with some inferences for a conservation strategy. Plant Biosyst. 2012, 146, 24–32. [Google Scholar] [CrossRef]
  69. Nybom, H. Comparison of different nuclear DNA markers for estimating intraspecific genetic diversity in plants. Mol. Ecol. 2004, 13, 1143–1155. [Google Scholar] [CrossRef] [PubMed]
  70. Yoichi, W.; Sakaguchi, S.; Ueno, S.; Tomaru, N.; Uehara, K. Development and characterization of EST-SSR markers for the genus Rhododendron section Brachycalyx (Ericaceae). Plant Species Biol. 2017, 32, 455–459. [Google Scholar] [CrossRef]
  71. Ikeda, H.; Yoneta, Y.; Higashi, H.; Eidesen, P.B.; Barkalov, V.; Yakubov, V.; Brochmann, C.; Setoguchi, H. Persistent history of the bird-dispersed arctic-alpine plant Vaccinium vitis-idaea L. (Ericaceae) in Japan. J. Plant Res. 2015, 128, 437–444. [Google Scholar] [CrossRef] [PubMed]
  72. Hamrick, J.L.; Godt, M.J.W. Allozyme diversity in plant species. In Plant Population Genetics, Breeding, and Genetic Resources; Brown, A.H.D., Clegg, M.T., Kahler, A.L., Weir, B.S., Eds.; Sinauer: Sunderland, MA, USA, 1989; pp. 43–63. [Google Scholar]
  73. Setoguchi, H.; Mitsui, Y.; Ikeda, H.; Nomura, N.; Tamura, A. Genetic structure of the critically endangered plant Tricyrtis ishiiana (Convallariaceae) in relict populations of Japan. Conserv. Genet. 2011, 12, 491–501. [Google Scholar] [CrossRef]
  74. Escaravage, N.; Wagner, J. Pollination effectiveness and pollen dispersal in a Rhododendron ferrugineum (Ericaceae) population. Plant Biol. 2004, 6, 606–615. [Google Scholar] [CrossRef]
  75. Stephenson, C.M.; Kohn, D.; Park, K.; Atkinson, R.J.; Edwards, C.; Travis, J.M.J. Testing mechanistic models of seed dispersal for the invasive Rhododendron ponticum (L.). Perspect. Plant Ecol. Evol. Syst. 2007, 9, 15–28. [Google Scholar] [CrossRef]
  76. Han, Q.X.; Higashi, H.; Mitsui, Y.; Setoguchi, H. Distinct phylogeographic structures of wild radish (Raphanus sativus L. var. raphanistroides Makino) in Japan. PLoS ONE 2015, 10, e0135132. [Google Scholar] [CrossRef] [Green Version]
  77. Cheng, B.B.; Zheng, Y.Q.; Sun, Q.W. Genetic diversity and population structure of Taxus cuspidata in the Changbai mountains assessed by chloroplast DNA sequences and microsatellite markers. Biochem. Syst. Ecol. 2015, 63, 157–164. [Google Scholar] [CrossRef]
  78. Yao, X.H.; Ye, Q.G.; Kang, M.; Huang, H.W. Microsatellites analysis reveals interpopulation differention and gene flow in endangered tree Changiostyrax dolichocarpa (Styracaceae) with fragmented distribution in central China. New Phytol. 2007, 176, 472–480. [Google Scholar] [CrossRef] [PubMed]
  79. Côté, C.L.; Gagnaire, P.A.; Bourret, V.; Verreault, G.; Castonguay, M.; Bernatchez, L. Population genetics of the American eel (Anguilla rostrata): Fst = 0 and North Atlantic Oscillation effects on demographic fluctuations of a panmictic species. Mol. Ecol. 2013, 22, 1763–1776. [Google Scholar] [CrossRef] [PubMed]
  80. Escaravage, N.; Pornon, A.; Doche, B.; Till-Bottraud, I. Breeding system in an alpine species: Rhododendron ferrugineum (Ericaceae) in the French northern Alps. Can. J. Bot. 1997, 75, 736–743. [Google Scholar] [CrossRef]
  81. Hahn, C.Z.; Michalski, S.G.; Durka, W. Gene flow in, and mating system of, Rhododendron simsii in a nature reserve in subtropical china. Nord. J. Bot. 2017, 35, 1–7. [Google Scholar] [CrossRef] [Green Version]
  82. Harrison, S.P.; Yu, G.; Takahara, H.; Prentice, I.C. Diversity of temperate plants in East Asia. Nature 2001, 413, 129–130. [Google Scholar] [CrossRef]
  83. Bisconti, R.; Canestrelli, D.; Colangelo, P.; Nascetti, G. Multiple lines of evidence for demographic and range expansion of a temperate species (Hyla sarda) during the last glaciation. Mol. Ecol. 2011, 20, 5313–5327. [Google Scholar] [CrossRef]
  84. Pinheiro, F.; De Barros, F.; Palma‒Silva, C.; Fay, M.F.; Lexer, C.; Cozzolino, S. Phylogeography and genetic differentiation along the distributional range of the orchid Epidendrum fulgens: A Neotropical coastal species not restricted to glacial refugia. J. Biogeogr. 2011, 38, 1923–1935. [Google Scholar] [CrossRef] [Green Version]
  85. Gao, Y.D.; Zhang, Y.; Gao, X.F.; Zhu, Z.M. Pleistocene glaciations, demographic expansion and subsequent isolation promoted morphological heterogeneity: A phylogeographic study of the alpine Rosa sericea complex (Rosaceae). Sci. Rep. 2015, 5, 11698. [Google Scholar] [CrossRef] [Green Version]
  86. Zhao, Y.J.; Gong, X. Genetic structure of the endangered Leucomeris decora (Asteraceae) in China inferred from chloroplast and nuclear DNA markers. Conserv. Genet. 2014, 13, 271–281. [Google Scholar] [CrossRef]
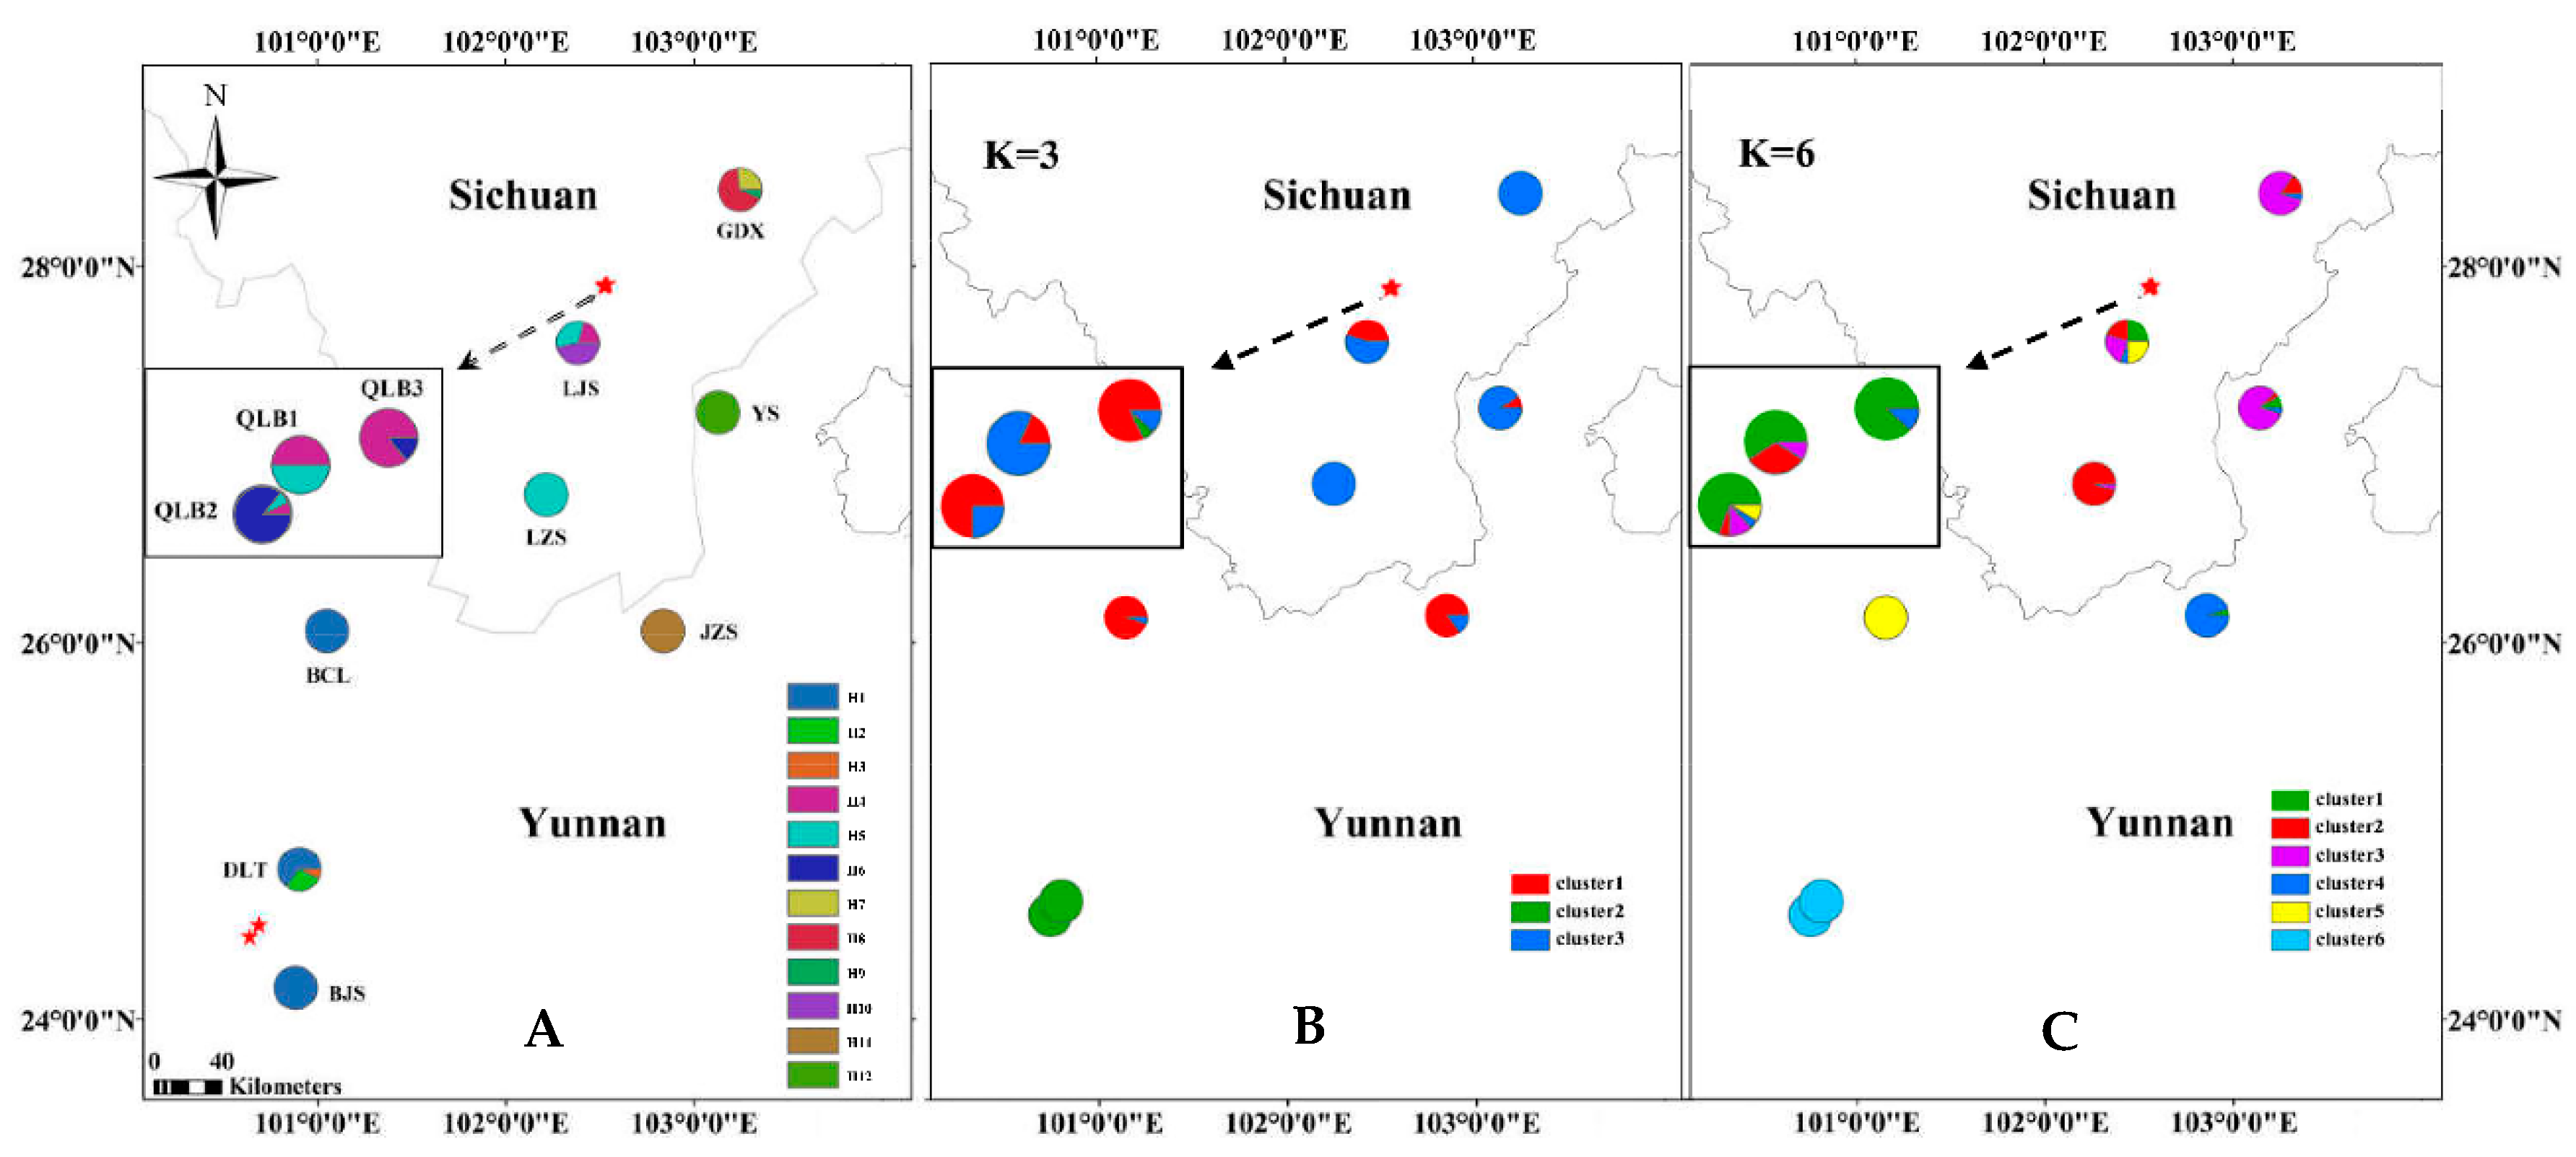
Figure 1. Distribution of chloroplast DNA (cpDNA) haplotypes (A); map of the geographic distribution of nuclear microsatellite clusters when the assumed cluster numbers are (B) K = 3 and (C) K = 6 in 11 populations of Rhododendron rex subsp. rex.
Plants 09 00338 g001
Figure 2. Principal coordinate analysis (A) and the plot of geographical distance against genetic distance (B) for R. rex subsp. rex by SSR data analysis.
Plants 09 00338 g002
Figure 3. Bayesian tree (A) and the network of haplotypes (B) based on combined cpDNA sequences. (A) The numbers on branches indicate the posterior probability; (B) the size of the circles corresponds to the frequency of each haplotype, and the vertical branches indicate mutational steps.
Plants 09 00338 g003
Figure 4. Mismatch distribution (A) and Bayesian skyline plot based on combined cpDNA sequences (B). (A) The solid lines show expected values, whereas the dashed lines represent observed values under a model of sudden population expansion. (B) The black line indicates effective population size fluctuation throughout.
Plants 09 00338 g004
Figure 5. Distribution dynamics of R. rex subsp. rex using MAXENT. Predicted distributions are shown for (A) the last glacial maximum (LGM), (B) the present, (C) the year 2050, and (D) the year 2070. Color-coded keys represent different habitat suitability.
Plants 09 00338 g005
Table 1. Details of sample locations, sample size (N), haplotype diversity (Hd), and nucleotide diversity (Pi) surveyed for cpDNA sequences of R. rex subsp. rex. SSR—microsatellite marker.
LocationPopulation
Code
LatitudeLongitudeAltitude
(m)
N (cpDNA/SSR)Haplotypes (No.)cpDNA
HdPi
YunnanBJS24°24′31″100°38’15″26706/6H100
DLT24°28′57″100°41’47″266014/15H1, H2, H30.5380.00031
BCL26°3′26″101°03’11″295015/21H100
YS27°13′09″103°07’43″288716/23H1200
JZS26°04′07″102°49’56″325016/21H1100
SichuanQLB127°53′46″102°30’56″325014/22H4, H500
QLB227°53′19″102°30’36″330314/23H4, H5, H60.2640.00028
QLB327°54′0.4″102°31’44″333214/17H4, H60.2640.00028
GDX28°24′29″103°14’33″296615/20H7, H8, H90.5140.00115
LJS27°35′19″102°23’34″283315/20H4, H5, H1000
LZS26°47′48″102°12’30″333516/24H500
Total11 155/212H1–H120.7880.0018
Table 2. Genetic diversity of populations in R. rex subsp. rex.
PopulationNPRaNAAEIHOHEFisPPB (%)
BCL103.5745.8003.2151.0610.4290.4740.119100.00%
BJS23.0713.1002.0110.7400.3000.3990.33190.00%
DLT124.1786.1003.8041.2810.5130.5780.14890.00%
GDX33.6815.8003.4791.1830.4520.5470.200100.00%
JZS124.2316.1003.0851.2520.4010.6050.357100.00%
LJS83.8416.7003.1691.2280.4780.5610.167100.00%
LZS73.6766.2003.1141.2300.5580.5850.06890.00%
QLB143.6895.8003.2131.1830.5150.5560.098100.00%
QLB233.6186.2002.9941.0860.4170.4860.165100.00%
QLB353.7185.9003.1181.1870.4980.5410.11190.00%
YS113.9376.9003.9541.3190.5470.6050.119100.00%
Mean73.7475.8733.1961.1590.4640.5400.17196.36%
Note: NA, mean number of alleles; AE, number of effective alleles; I, Shannon’s information index; HO, observed heterozygosity; HE, expected heterozygosity; NP, number of private alleles; Ra: rarefied allelic richness; Fis, fixation index; PPB (%), percentage of polymorphic loci.
Table 3. Analysis of molecular variance (AMOVA) based on 14 microsatellites and three cpDNA sequences in R. rex subsp. rex. d.f.: degrees of freedom.
Source of Variationd.f.Sum of SquaresVariance ComponentsPercentage of Variation (%)
SSR dataAmong populations10237.7480.54816.47FST = 0.165 ***
Within populations4131148.3982.78183.53
Total4231386.1463.329
cpDNA sequencesAmong populations10276.0231.94084.07FST = 0.841 ***
Within populations14452.9190.36715.93
Total154328.9422.314
Note: *** p < 0.001, most significant difference.
Table 4. Historical gene flows between 11 populations of R. rex subsp. rex.
PopulationBCLBJSDLTGDXJZSLJSLZSQLB1QLB2QLB3YS
BCL0
BJS0.3110
DLT0.4692.0240
GDX0.7340.5040.8170
JZS1.2570.4630.6991.4390
LJS2.0130.4390.7152.622.2080
LZS1.5820.4810.7811.7211.4542.860
QLB11.8950.4210.6741.6362.14610.5912.970
QLB22.3630.3070.4621.0591.6493.7821.8824.0210
QLB32.0290.3650.5721.0931.5822.7852.0993.4617.4520
YS1.1000.5170.8332.6421.5253.2071.6211.8621.4791.6170
Table 5. Contemporary migration rate between populations of R. rex subsp. rex by BayesAss with 95% confidence intervals.
Population->BCLBJSDLTGDXJZSLJSLZSQLB1QLB2QLB3YS
BCL0.6950.0290.0290.0280.0270.0550.0280.0280.0270.0280.028
BJS0.0290.6960.0280.0280.0280.0510.0280.0280.0290.0270.029
DLT0.0290.0270.6950.0280.0280.0530.0270.0270.0290.0280.029
GDX0.0280.0270.0270.6970.0290.0520.0270.0280.0280.0280.028
JZS0.0270.0280.0280.0260.6950.0570.0270.0280.0280.0290.027
LJS0.0300.0280.0270.0290.0280.7190.0270.0280.0290.0270.029
LZS0.0280.0280.0290.0280.0280.0570.6940.0270.0260.0280.027
QLB10.0290.0270.0270.0280.0270.0550.0270.6940.0280.0290.028
QLB20.0290.0280.0260.0290.0270.0550.0280.0290.6950.0270.027
QLB30.0280.0290.0280.0280.0270.0550.0270.0280.0280.6950.028
YS0.0280.0280.0260.0280.0270.0560.0280.0260.0290.0280.695
Note: population->: population migration into the other populations.
Table 6. Bottleneck analysis of 11 populations in R. rex subsp. rex.
PopulationTwo Phased Model (T.P.M)Step Mutation Model (S.M.M)Mode
Shift
Garza–Williamson Index
Sign TestWilcoxon TestSign TestWilcoxon Test
BCL0.6140.5390.1700.813L0.336
BJS0.2110.4100.0680.545L0.399
DLT0.3990.6520.1830.839L0.329
GDX0.1580.8620.002 **0.998L0.492
JZS0.1760.8130.1830.958L0.361
LJS0.1780.8620.1690.958L0.278
LZS0.0740.9470.003 **0.995L0.297
QLB10.3700.4230.1810.947L0.284
QLB20.3710.4610.0580.984L0.323
QLB30.0650.8620.0740.984L0.333
YS0.6120.4610.3890.722L0.349
Note: ** p < 0.01, significant difference.