Abstract
As members of the plant microbiota, arbuscular mycorrhizal fungi (AMF) may be effective in enhancing plant resilience to drought, one of the major limiting factors threatening crop productivity. AMF host their own microbiota and previous data demonstrated that endobacteria thriving in Gigaspora margarita modulate fungal antioxidant responses. Here, we used the G. margarita–Candidatus Glomeribacter gigasporarum system to test whether the tripartite interaction between tomato, G. margarita and its endobacteria may improve plant resilience to combined water/nutrient stress. Tomato plants were inoculated with spores containing endobacteria (B+) or not (B-), and exposed to combined water/nutrient stress. Plants traits, AM colonization and expression of AM marker genes were measured. Results showed that mycorrhizal frequency was low and no growth effect was observed. Under control conditions, B+ inoculated plants were more responsive to the symbiosis, as they showed an up-regulation of three AM marker genes involved in phosphate and lipids metabolism compared with B− inoculated or not-inoculated plants. When combined stress was imposed, the difference between fungal strains was still evident for one marker gene. These results indicate that the fungal endobacteria finely modulate plant metabolism, even in the absence of growth response.
1. Introduction
Microbial communities associated with plants—the plant microbiota—include beneficial microorganisms which potentially help their host to cope with biotic and abiotic stresses [1,2]. A role in plant resilience to drought, one of the main current threats for crops, has been attributed to specific components of the root microbiota [2] such as plant growth-promoting bacteria [3,4] and arbuscular mycorrhizal fungi (AMF). The latter are one of the main components of plant mycobiota [5] and may enhance plant resilience to drought, improving nutrients accumulation, water uptake and plant growth [6]. Experimental evidence of such a beneficial role has been obtained in crops including maize [7], soybean [8], wheat [9], date palm [10], apple [11] and tomato [12,13]. AMF are able to efficiently extract water from soil through an extended extra-radical mycelium, to enhance plant stomatal conductance [14] and to induce the plant production of osmolytes. Moreover, they induce the plant production of ROS-scavenging anti-oxidant compounds [15], reducing oxidative stress [16], which is one of the negative effects originated by drought [17]. However, contrasting data emerged from a detailed transcriptomic analysis of two drought-tolerant sorghum cultivars grown under field conditions. Drought stress induced a disruption in the plant AM symbiosis with a corresponding loss of fungal biomass and a significant reduction in symbiosis markers gene expression [18]. These partly contrasting results open many questions on the functional network established between plants and AMF under drought.
A further element of complexity is that AMF host their own bacterial microbiota both at the extra-radical mycelium surfaces and within their cytoplasm, where bacteria live as obligate endobacteria [5]. Among AMF which host endobacteria [19,20], Gigaspora margarita with its Candidatus Glomeribacter gigasporarum (CaGg) offers a unique system, since a cured line, without endobacteria, is available [21]. This system offers the unprecedented chance to investigate the role of AMF–endobacteria interactions by comparing the two isogenic lines upon application of diverse “omics” approaches [22,23]. These previous works demonstrated that the obligate endobacterium CaGg enhances fungal fitness by priming mitochondrial and antioxidant metabolism [22,24]. Superoxide dismutase (Cu/Zn), glutathione peroxidase and thioredoxin reductase resulted as the most abundant proteins in the fungal line hosting the endobacterium [24], mirrored by a highest amount of glutathione and glutathione disulfide [25]. Remarkably, the higher antioxidant capacity of the CaGg-containing fungal line could also help the host plant to maintain cellular redox homeostasis during symbiosis, lowering the amount of carboxylated proteins, which are markers of oxidative stress [24].
In this context where the molecular mechanisms previously identified in G. margarita containing the endobacterium are mainly related to an activation of antioxidant metabolism, we hypothesized that CaGg could act as an intracellular component of the plant mycobiota and play an active role in plant protection against drought and nutrient stress. We therefore investigated the tripartite interaction between G. margarita–CaGg and tomato plant, using the fungal strain without CaGg as a control. Tomato (Solanum lycopersicum) was used as a model plant being also one of the major horticultural species worldwide. The interaction between tomato and G. margarita has been investigated in some previous researches [26,27] which revealed a low mycorrhizal success (around 20–30%). However, considering that (i) different tomato cultivars could differently respond to AM symbiosis, (ii) the amount of colonization is not always considered the major determinant of plant performance [28,29] and (iii) the uniqueness of the G. margarita–CaGg model—we chose tomato as the reference plant. In addition, tomato has extensively been studied to investigate the effect of AM symbiosis upon plant stresses [12,13,30,31,32].
It is known that plants’ responses to multiple abiotic stresses do not fully overlap with plant responses to a singly applied stress [33]. While tomato responses to drought have been largely described [30,31], its response to nutrient stress is well exemplified by the fact that tomato plants grown under low phosphate (Pi) availability showed delayed flowering and fruiting [34], confirming that nutrient limitation has a broad impact on major developmental processes.
Here, we considered a combined water/nutrient stress as this could represent a more realistic condition found in today’s fields and is rarely investigated under laboratory conditions.
2. Results
2.1. Tomato Plants Inoculated with G. Margarita Showed Low Root Colonization Levels
Tomato plants were inoculated with G. margarita spores containing endobacteria (B+) or cured spores without endobacteria (B-), while not-inoculated plants were used as non-mycorrhizal controls (NM). All the plants were grown under normal growth conditions (well-watered, WW) and under combined stress (CS) where a reduction of about 60% of water and nutrients supply was applied.
Since the dynamics of tomato root AM colonization by G. margarita were unknown, we sampled plants at 60 and 90 days after inoculation. At each time point, mycorrhizal colonization as well as plant biometric traits were measured. Results showed that G. margarita successfully colonized tomato roots mostly producing intracellular hyphae and intercalary arbuscules recalling a Paris-type colonization [26,35]. The colonization only reached relatively low frequency levels at both time points (Figure 1) with a mean frequency (F%) of 15% and 23% at 60 and 90 days, respectively. Similarly, root cortex colonization (M%) showed very low values. By contrast, the abundance of arbuscules in colonized root portions was almost 100% (Figure 1, Figure S1). A few differences between time points, stress treatment and endobacteria presence in any of the measured mycorrhization parameters emerged (ANOVA, p > 0.05, Table S1). Notably, B− colonized roots showed a significantly higher frequency of mycorrhization (F%) under combined stress conditions at 60 days, but such a difference was not any more evident at 90 days (Figure 1).
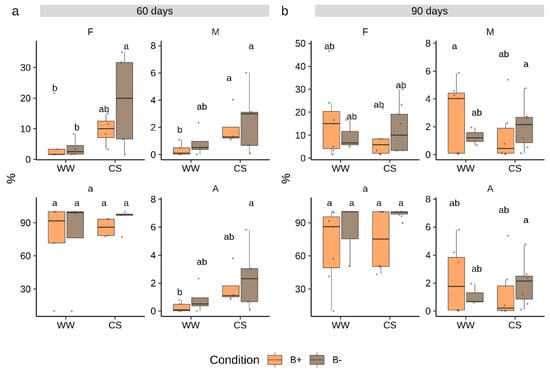
Figure 1.
Colonization parameters in Solanum lycopersicum cv. M82 inoculated with Gigaspora margarita at 60 (a) and 90 (b) days. Statistically supported differences between mycorrhizal (B- and B+), stress conditions and time points are indicated with different letters (Kruskal–Wallis test, p < 0.05). F% = frequency of mycorrhization, M% = intensity of mycorrhization, a% = arbuscules abundance in colonized fragments, A% = arbuscules abundance in whole root apparatus. Boxplots display median value (horizontal line), quartiles (boxes) and 1.5 × interquartile ranges (whiskers).
2.2. Combined Water and Nutrients Stress Has a Negative Impact on Tomato Growth which is not Alleviated by Mycorrhization
To monitor growth responses under combined stress and mycorrhizal conditions, three biometric parameters (shoot length, SL, shoot fresh weight, SFW, root fresh weight, RFW) and the SPAD (Soil Plant Analysis Development) index, which quantifies the leaf chlorophyll content as a proxy of the plant nutritional status [36], were measured at both sampling time points. ANOVA analysis was performed to detect the effect of each of the four factors within the experimental system (combined stress, mycorrhizal colonization, endobacteria presence, time point and their interactions) on each trait. Results showed that all measured plant traits were mostly modulated by the combined stress treatment (ANOVA, p < 0.001; Table 1) and by the time point factor (ANOVA, p < 0.05). By contrast, the mycorrhizal colonization factor (considering both G. margarita lines) was significant only for SFW (p < 0.001), while endobacterial occurrence happened for none of the parameters. However, the interaction effects of combined stress, time point and endobacteria occurrence was significant for SL and SFW. Under CS conditions, both control and mycorrhizal plants accumulated a slightly lower fresh biomass when compared to the well-watered condition, with more marked differences at 90 days (Figure 2). Some responses to CS conditions significantly differed in the B+ and B− lines. In particular, lower values, although not significantly different, were measured in the B− lines at 60 days for the RFW, SFW and SL parameters, while the trend was reversed at 90 days (Figure 2). Irrespective of the time point considered, SPAD index values were similar across conditions, highlighting a comparable nutritional status. This was further confirmed by the analysis of the shoot phosphorus (P) content which showed that the mycorrhizal status did not improve the P content irrespective of the imposed combined stress (Figure S2). The shoot P level, however, displayed a weak increase under CS conditions in all plants.

Table 1.
Four-way ANOVA table on plant growth traits data (model formula: parameter ~ treatment × (AM colonization/endobacteria) × time point). SL, shoot length, SFW, shoot fresh weight, RFW, root fresh weight, SPAD index. Significant factors’ effects and their interactions (p < 0.05) are shown in bold. CS, combined water/nutrient stress.
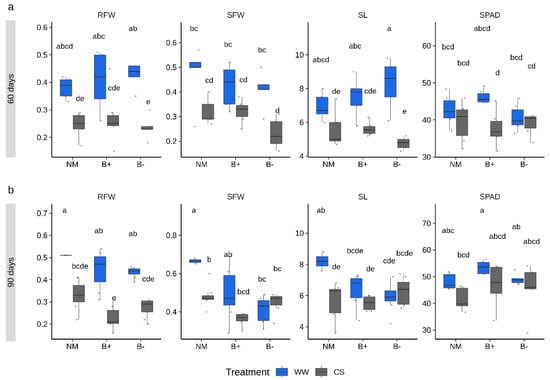
Figure 2.
Plant traits measured in tomato inoculated with G. margarita containing or not its endobacteria (B+ and B−, respectively) under combined stress (CS, gray) or well-watered (WW, blue) conditions sampled after 60 (a) and 90 (b) days. Differences between conditions, stress treatment and time points are indicated for each parameter with different letters according to Tukey’s HSD (honestly significant difference) post hoc test after ANOVA (p < 0.05). CS, combined stress, WW, normal control conditions. RFW, root fresh weight (g), SFW, shoot fresh weight (g), SL, shoot length (cm), SPAD index. Boxplots display median value (horizontal line), quartiles (boxes) and 1.5 × interquartile ranges (whiskers).
To track the effects of mycorrhizal colonization in plant fresh biomass accumulation, the mycorrhizal growth response (MGR) parameter was calculated (Figure 3). This index is calculated as the logarithmic ratio between parameters measured in mycorrhizal vs. non-mycorrhizal plants. The analysis was performed for RFW and SFW as well as for total fresh weight (TFW). Data revealed that, while at 60 days, the response to mycorrhization was near to neutrality (MGR = 0), at 90 days, MGR values were negative (MGR < 0) for all the parameters considered. No differences emerged between B+ and B− inoculated plants under WW conditions, while significant differences emerged in MGR calculated on SFW and TFW under CS conditions.
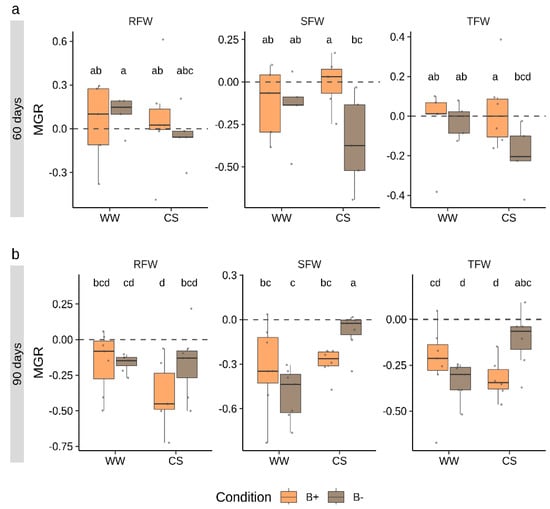
Figure 3.
Mycorrhizal growth response (MGR) calculated on biomass parameters in tomato plants colonized by B+ ad B− G. margarita lines at 60 days (a) and 90 days (b) after inoculation under combined stress (CS) and well-watered (WW) conditions. RFW, SFW and TFW refer to MGR values calculated on root, shoot and total fresh weight, respectively. Different letters indicate statistically supported differences, also considering the two time points, according to Kruskal–Wallis test (p < 0.05). Boxplots display median value (horizontal line), quartiles (boxes) and 1.5 × interquartile ranges (whiskers).
At 60 days, MGR values (SFW and TFW, Figure 3) were significantly higher in B+ than in B− inoculated plants-, while at 90 days, results were reversed with higher responsiveness to mycorrhization in B− colonized plants.
2.3. Plant Genes, Marker of a Functional AM Symbiosis, are Modulated by CaGg
To check whether CaGg endobacterial populations hosted in G. margarita had an impact at the molecular level on plant and fungal metabolism, we tested the expression of some genes involved in different aspects of AM symbiosis by using qRT-PCR on materials sampled 90 days after inoculation (Table S2).
First, we measured the expression of plant genes involved in nutrients exchange such as those involved in AM-dependent phosphate transport (SlPT4, [37]) and lipids biosynthesis (SlFatM and SlDIS, [38,39]). While the first indirectly indicates the occurrence of phosphate transfer from the AMF towards the plant, the other two can be considered markers of the lipids transfer from the plant towards the AMF, which are indeed fatty acid auxotrophs [40,41]. Notably, under well-watered conditions (WW), these transcripts were more abundant in B+ vs. B− colonized roots (p < 0.05, Figure 4).
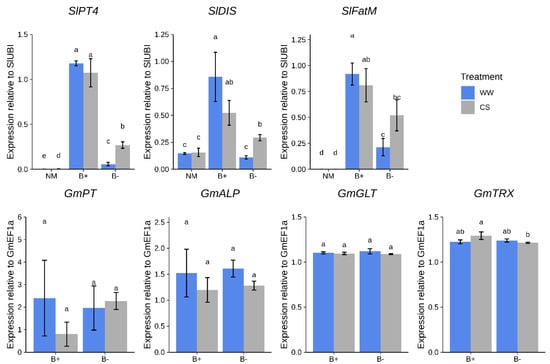
Figure 4.
Expression profiles of marker genes in tomato roots colonized by G. margarita at 90 days after inoculation. Differences are indicated with different letters according to Kruskal–Wallis test (p < 0.05). CS = combined water/nutrient stress, WW = normal conditions. Plant genes: SlPT4, SlDIS; SlFatM; G. margarita genes: GmPT, GmALP, GmGLT, GmTRX.
Under CS conditions, while differences in SlPT4 remained, the expression of SlDIS and SlFatM significantly increased in B− roots, reaching levels similar to those found in B+ mycorrhizal roots.
As a second step, we checked the abundance of G. margarita fungal transcripts involved both in symbiosis-dependent phosphate metabolism and endobacterium-mediated ROS metabolism [22]. No relevant difference between the two fungal strains was detected looking at the expression levels of the fungal phosphate transporter GmPT and alkaline phosphatase GmALP genes (Figure 4). Both genes were found to be expressed in arbusculated cells [41]. We also tested two fungal markers of ROS detoxification, a glutathione peroxidase (GmGLT) and a thioredoxin reductase (GmTRX), since they were abundantly expressed and up-regulated in the pre-symbiotic phase of the B+ compared with the B− fungal line [22,24]. Notably, while GmGLT did not show differential regulation under any condition, GmTRX was slightly up-regulated under CS conditions in tomato B+ roots compared with B− inoculated plants (Figure 4). Taken in their whole, the experiments reveal that the plant and not only the fungus, perceives the presence of the endobacterium hosted inside the fungal cytoplasm.
3. Discussion
Several studies showed the potential of AM symbiosis to alleviate nutrients and drought stress in tomato plants [12,13,31,32,34]. These evidences highlight that application of AMF under environmental stress conditions in tomato deserves further experimental validation by testing additional host and AMF genotypes.
3.1. The Combination G. Margarita/Tomato cv “M82” Does not Exploit the Benefits of the Symbiosis
In this work, we used G. margarita–CaGg—at the moment the unique available system which allows to manipulate the endobacterial presence in AMF—to disentangle the role of endobacteria in modulating plant responses to a combined water/nutrient stress. We selected to grow the plants in small alveolar trays as we could mimic the large-scale growing conditions used to produce tomato seedlings in industrial nurseries and we could easily apply the combined stress.
Our findings first showed that under controlled experimental conditions, G. margarita led to a low and patchy mycorrhizal colonization without evidence of a growth effect. The observed colonization rate (around 20%) was similar to that reported by Tahat et al. [27] on a different tomato genotype colonized by G. margarita, and much less than the mycorrhizal frequency (typically higher than 60–80%) obtained by inoculating the AMF fungus F. mosseae [12,42], even in the same alveolar tray system used in this study (data not shown). Probably due to their huge genome, which requires energetic investments for multiplication [23], Gigasporaceae are not equally successful in colonizing roots of all plant species, and in particular those which, as tomato, need important nutrient support [34]. These considerations are also mirrored by ecological data: indeed, a global assessment of AMF diversity [43] showed that Gigasporaceae have a limited ecological distribution when compared with other AMF families such as Glomeraceae.
3.2. The Endobacterium Living in G. Margarita Modulates Molecular Responses of Tomato
Our data showed that the presence/absence of the endobacterium had no impact on mycorrhization, confirming previous results [21].
The measurements of growth-related parameters and SPAD revealed that the positive effect of G. margarita and its bacterial endosymbiont on plant responses was limited, possibly as a consequence of the low root colonization, and that major differences were found at 60 days after inoculation. The endobacterium seems to have a slight time-dependent effect on plant growth parameters. This probably mirrors the colonization dynamics of the B− fungal strain which is characterized by a slower growth rate compared with B+ [21]. Overall, the complex G. margarita–CaGg did not enhance tomato growth under combined stress, which caused the greatest negative impact at both time points. Accordingly, when analyzing SPAD index values and P shoot content, we found no differences between mycorrhizal and non-mycorrhizal plants under both control and CS conditions. Similarly, Bulgarelli et al. [44] did not find any increase in P shoot level in soybean upon mycorrhization and, more in general, they found no correlation between P accumulation and growth responses, probably due to the fact that soybean has a high P demand, such as tomato. Moreover, under CS treatment, a slight increase in the P shoot content was observed, and this was probably caused by the specific experimental conditions which enhance the tomato attitude to accumulate P in the epigeous organs [45].
Notwithstanding the low colonization rate and the absence of a growth effect of G. margarita on tomato, the molecular mechanisms associated with arbuscule functioning were activated. Three plant marker genes, at the basis of the reciprocal benefits in AM symbiosis, were up-regulated in mycorrhizal plants compared with non-mycorrhizal plants, even under combined CS stress, as also described by Volpe et al. [30]. An opposite behavior, i.e., mycorrhizal marker genes strongly down-regulated under drought conditions, was described for sorghum plants [18]: this discrepancy could be explained by differences in the amplitude of the water-stress imposed (severe vs. moderate), in the growth conditions (open-field vs. controlled growth chamber) and in the plant species used (monocot vs. dicot). Another explanation may lay in that the native sorghum-associated AMF are probably not well-adapted to drought conditions.
Interestingly, especially in the WW conditions, plants colonized by the fungus with its endobacterium (B+) showed a stronger up-regulation of plant symbiotic genes compared with B− inoculated roots. Among the symbiotic marker genes, PT4 revealed a significant up-regulation, notwithstanding the unchanged P amount detected in the shoot.
Probably as a consequence of the limited colonization success, G. margarita did not provide advantages in terms of vegetative biomass, irrespective of the growth conditions and of the activation of the phosphate transporters in both the fungus and the plant. The results also indicate that the presence of endobacteria living inside the fungus finely modulate plant metabolism through the regulation of AM symbiotic genes.
Taken as a whole, tomato growing in the alveolar trays demonstrated to perceive the difference between G. margarita with and without its endobacterium, and to activate the signaling and the accommodation process, but these cellular and molecular events were not sufficiently powerful to elicit a growth effect and stress tolerance. Even if the leading hypothesis (whether an endobacterium increases plant resistance to environmental stress) was not confirmed, the investigation provides novel information on the molecular mechanisms underlying AM establishment: even in the presence of a reduced fungal biomass, the plant distinguishes between the two fungal lines and, accordingly, modulates the expression of two genes (the mycorrhiza-inducible phosphate transporter SlPT4 and SlFatM) which are two iconic markers of AM functionality.
4. Materials and Methods
4.1. Plant Materials, Experimental Set-Up and Sampling
To mimic the large-scale growing conditions which are used to produce tomato seedlings in industrial nurseries, the experiment was set-up in a miniaturized system constituted by small alveolar trays (60 wells, 5 × 5 × 14 cm and 100 mL in volume each) filled with oven-sterilized (180 °C, 3 h) quartz sand. Tomato (Solanum lycopersicum cv “M82” LA3475) seeds were surface-sterilized with a 3 min wash in 70% ethanol with the addition of 3 drops of Tween 20 (3 min) followed by a wash in 2.5% sodium hypochlorite in sterile dH2O (13 min) and three rinses in sterile dH2O (10 min each). Seeds were plated in 0.6% plant agar medium (Duchefa, Haarlem, The Netherlands) and germinated in the dark at 23 °C for five days and then moved to day/night conditions for at least four days (16 h/8 h light/dark photo-period). The experimental set-up consisted of 2 mycorrhization conditions (B+ and B−) plus an uninoculated control, and a combined water/nutrient treatment (CS) with its respective untreated control (WW). Two sets of 6 plants each were prepared: the first to be sampled at 60 days after inoculation and the second at 90 days after inoculation.
At the end of the preliminary growth phases, for each experimental condition, 12 seedlings, for a total of 72 individuals, were then transferred to alveolar trays and parts of the seedlings were inoculated using 100 spores/plant of Gigaspora margarita Becker and Hall (isolate BEG 34, deposited at the European Bank of Glomeromycota), containing CaGg endobacteria (B+) or spores of a cured line without endobacteria (B-; [21]). G. margarita spores were propagated in Trifolium repens trap cultures, isolated using the wet sieving technique [46] and manually collected. Spores were then surface-sterilized in 3% w/v chloramine-T and 0.03% w/v streptomycin sulfate and subsequently washed with sterile water three times for 10 min each. Spores were then deposited around roots while potting seedlings in sterile quartz sand. Control plants were grown on the same substrate but no G. margarita spores were added. The experimental set-up is summarized in Figure S4.
Plants were grown in a controlled growth chamber (14 h light at 24 °C/10 h dark at 20 °C) and watered twice a week with a modified Long Ashton solution [47] containing 3.2 μM Na2HPO4, and 1 mM NaNO3. A low P content was used to ensure good levels of root colonization since a higher concentration could impair AM symbiosis establishment. After the first 30 days in which AM symbiosis could establish without interferences [9,48], combined stress was gradually induced by lowering the substrate water capacity (SWC%) as described in Lehnert et al. [9]. Untreated plants (WW conditions) were watered with Long Ashton solution as described above, allowing to compare them with plants in which both nutrients and water were lowered to induce a combined water/nutrient stress (CS conditions). The weight of the alveolar trays was monitored each two days and maintained at >90% in well-watered control plants and at 35% in stressed plants. These values allowed to maintain the stem water potential between −0.6 and −0.8 MPa in the combined stress treatment (moderate water stress) and higher than −0.5 MPa in controls as established in a preliminary pilot experiment (data not shown). Similarly, these conditions allowed to reduce 60% of nutrients supply to CS plants inducing combined stress.
To confirm that a moderate water stress was achieved, the stem water potential was monitored at the end of the experiment on three randomly sampled plants for each tray and the SWC% levels confirmed (Figure S3).
Shoot water potential was indirectly measured from leaves according to Freitas et al. [49] Briefly, leaves were enclosed in plastic bags with wet filter paper and a reflective envelope to suppress transpiration allowing the leaf water potential to equilibrate with the stem. After 20 min, leaves were excised from the stem and shoot water potential was measured using a Schölander pressure chamber.
AM colonization dynamics were followed sampling 6 plants per condition after 60 days and the remaining 6 at 90 days after the start of the experiment. During each harvesting, plants were sampled and roots washed thoroughly under tap water to remove sand particles. Root/shoot fresh weight (RFW and SFW) and shoot length (SL) were measured. During the experiment, SPAD index was measured after the first month and at both sampling points using an SPAD-502 Chlorophyll Meter (Konica-Minolta Inc., Chiyoda, Tokyo, Japan). For each plant, the values recorded from three different leaflets of the first fully expanded leaf from apical meristem were considered. The mycorrhizal growth response parameter (MGR) on RFW, SFW and total fresh weight (TFW) was calculated, according to Hoeksema et al. [50] as reported in Equation (1).
MGR = loge(TFWMYC/TFWNM)
Mycorrhizal colonization was estimated on a representative portion of root materials at each sampling time point. Roots were stained in 0.1% cotton blue Sigma-Aldrich (St. Louis, MO, USA), bleached in lactic acid (two washes, 1 h each) and 1 cm-length fragments assembled on glass slides. Roots segments (60 cm per plant) were then observed and AM colonization scored according to Trouvelot et al. [51]. To exclude cross-contamination, mycorrhizal colonization was also checked on non-mycorrhizal plants (NM).
Total phosphorus content was determined colorimetrically using the malachite green method [52], after sulfuric-perchloric digestion [53] on ground, oven-dried (48 h at 40 °C) shoot material.
4.2. RNA Isolation and Processing
RNA was isolated from 3 different plants for each condition, starting from freeze-dried root tissue using NucleoSpin® RNA Plant and Fungi kit (Macherey-Nagel, Düren, Germany) and quantified by using a NanoDrop spectrophotometer (NanoDrop Technologies, Inc., Wilmington, DE, USA). Samples were then diluted to 200 ng/ul and subjected to a DNAse treatment using the Turbo DNA-freeTM kit (Ambion, Austin, TX, USA) according to the manufacturer’s instructions. The absence of DNA contamination was assessed in PCR assays using primers for the tomato ubiquitin gene (Solyc01g056940; [54]. cDNA was synthesized from about 400 ng of DNA-free total RNA using the SuperscriptTM II Reverse Transcriptase Kit (Invitrogen, Waltham, MA, USA) according to the manufacturer’s instructions. cDNAs were 1:2 diluted for quantitative relative expression analysis (RT-qPCR).
4.3. Quantitative Real-Time PCR (RT-qPCR)
Reactions were carried out in two technical replicates using a Rotor-Gene Q apparatus (QIAGEN, Hilden, Germany) in a final volume of 15 µL containing 2.25 µL of water, 7.5 µL of Rotor-Gene SYBR® Green PCR Mastermix (QIAGEN, Hilden, Germany), 2.25 µL of 3 µM forward and reverse primers and 0.75 µL of cDNA sample. The PCR cycling program consisted of a holding stage of 10 min at 95 °C and 40 cycles of 15 s at 95 °C and 1 min at 60 °C. A melting curve (55–95 °C) with a heating rate of 0.5 °C for 10 s and a continuous fluorescence measurement was recorded at the end of each run. Oligonucleotides were designed using tomato CDSs as a reference (SL2.5 version from Solgenomics database, http://solgenomics.net) using the primer3 v4.1.0 web software (http://bioinfo.ut.ee/primer3/) and purchased from Sigma-Aldrich (St. Louis, MO, USA) (Table S2). Take-off (Cq) and amplification efficiency values were calculated using the “comparative quantitation” mode in the Rotor-Gene Q software. Normalized relative gene expression was calculated using ubiquitin (UBI) and elongation factor 1α (EF1α) as a reference gene for tomato and G. margarita, respectively [54,55]. Normalized relative quantities (NRQ) of gene expression were calculated based on gene specific amplification efficiencies using the sample with the lower Cq value as the calibrator, as described in Pfaffl [56]. Statistical analysis was performed on log2-normalized NRQ values using a pairwise Kruskal–Wallis test as described below.
4.4. Data Analysis
Statistical tests were performed in the R statistical programming environment [57] using RStudio GUI v1.2.5019 [58]. Data were log2-transformed and normality and homoscedasticity were tested using Shapiro–Wilk [59] and Levene’s tests [60] in the “stats” v3.6.3 and “car” v3.0-7 R packages [61], respectively (p < 0.05). According to data distributions, ANOVA or aligned rank transformed (ART) was performed on raw values for parametric and non-parametric data, respectively [62], using the R packages “stats” and “ARTool” v10.0.7, respectively (p < 0.05). The endobacteria presence/absence factor was modeled as nested in the mycorrhization factor. Pairwise comparisons between treatments were performed using the appropriate post hoc tests. Tukey’s test [63] and pairwise Kruskal–Wallis [64] tests from the package “agricolae” v1.3.2 [65] were adopted at p < 0.05 for parametric and non-parametric data, respectively. Graphical elaborations were performed using the “ggplot2” v3.3.0 package [66].
Supplementary Materials
The following are available online at https://www.mdpi.com/2223-7747/9/7/886/s1, Figure S1: Micrographs showing cotton-blue staining of AM colonization in tomato roots colonized by G. margarita, Figure S2: Shoot phosphorus content of tomato plants inoculated with G. margarita containing or not its endobacteria and the control (B+, B−, NM) under combined stress (CS, gray) or well-watered (WW, blue) after 90 days, Figure S3: Stem water potential in control (well-watered) and combined-stress (CS) plants collected at 60 and 90 days after inoculation, Figure S4. Experimental set-up scheme. Table S1: Non-parametric three-way ANOVA table on aligned rank transformed (ART) data of mycorrhizal colonization parameters, Table S2: Primer sequences used in RT-qPCR experiments.
Author Contributions
Conceptualization, L.L., M.C. and P.B.; methodology, M.N., M.C. and V.S.; validation, M.C., G.G., M.N. and V.S.; formal analysis, M.C. and G.G.; investigation, M.C., G.G., M.N. and V.S.; data curation, M.C. and G.G.; writing—original draft preparation, M.C., L.L. and P.B.; writing—review and editing, M.C., L.L., P.B., M.N. and V.S.; visualization, M.C.; supervision, L.L. and P.B.; funding acquisition, L.L. and P.B. All authors have read and agreed to the published version of the manuscript.
Funding
This research has received funding from the European Union’s Horizon 2020 research and innovation programme under grant agreement N° 727929 (A novel and integrated approach to increase multiple and combined stress tolerance in plants using tomato as a model—TOMRES).
Acknowledgments
Authors thank Mara Politi, Stefania Stelluti and Maria Teresa Della Beffa for technical assistance. They also thank Giorgio Buffa for his support in water potential measurements and Francesco Venice for sharing fungal primers.
Conflicts of Interest
The authors declare no conflict of interest. The funders had no role in the design of the study; in the collection, analyses, or interpretation of data; in the writing of the manuscript, or in the decision to publish the results.
References
- Liu, H.; Brettell, L.E.; Qiu, Z.; Singh, B.K. Microbiome-mediated stress resistance in plants. Trends Plant Sci. 2020. [Google Scholar] [CrossRef]
- Naylor, D.; Coleman-Derr, D. Drought stress and root-associated bacterial communities. Front. Plant Sci. 2018, 8. [Google Scholar] [CrossRef] [PubMed]
- Andreo-Jimenez, B.; Vandenkoornhuyse, P.; Lê Van, A.; Heutinck, A.; Duhamel, M.; Kadam, N.; Jagadish, K.; Ruyter-Spira, C.; Bouwmeester, H. Plant host and drought shape the root associated fungal microbiota in rice. PeerJ 2019, 7, e7463. [Google Scholar] [CrossRef]
- Vigani, G.; Rolli, E.; Marasco, R.; Dell’Orto, M.; Michoud, G.; Soussi, A.; Raddadi, N.; Borin, S.; Sorlini, C.; Zocchi, G.; et al. Root bacterial endophytes confer drought resistance and enhance expression and activity of a vacuolar H+-pumping pyrophosphatase in pepper plants. Environ. Microbiol. 2018. [Google Scholar] [CrossRef]
- Bonfante, P.; Venice, F.; Lanfranco, L. The mycobiota: Fungi take their place between plants and bacteria. Curr. Opin. Microbiol. 2019, 49, 18–25. [Google Scholar] [CrossRef] [PubMed]
- Bahadur, A.; Batool, A.; Nasir, F.; Jiang, S.; Mingsen, Q.; Zhang, Q.; Pan, J.; Liu, Y.; Feng, H. Mechanistic insights into arbuscular mycorrhizal fungi-mediated drought stress tolerance in plants. Int. J. Mol. Sci. 2019, 20, 4199. [Google Scholar] [CrossRef] [PubMed]
- Bárzana, G.; Aroca, R.; Ruiz-Lozano, J.M. Localized and non-localized effects of arbuscular mycorrhizal symbiosis on accumulation of osmolytes and aquaporins and on antioxidant systems in maize plants subjected to total or partial root drying. Plant Cell Environ. 2015, 38, 1613–1627. [Google Scholar] [CrossRef]
- Porcel, R.; Aroca, R.; Azcón, R.; Ruiz-Lozano, J.M. PIP Aquaporin gene expression in arbuscular mycorrhizal Glycine max and Lactuca sativa plants in relation to drought stress tolerance. Plant Mol. Biol. 2006, 60, 389–404. [Google Scholar] [CrossRef] [PubMed]
- Lehnert, H.; Serfling, A.; Enders, M.; Friedt, W.; Ordon, F. Genetics of mycorrhizal symbiosis in winter wheat (Triticum aestivum). New Phytol. 2017, 215, 779–791. [Google Scholar] [CrossRef]
- Meddich, A.; Jaiti, F.; Bourzik, W.; Asli, A.E.; Hafidi, M. Use of mycorrhizal fungi as a strategy for improving the drought tolerance in date palm (Phoenix dactylifera). Sci. Hortic. 2015, 192, 468–474. [Google Scholar] [CrossRef]
- Huang, D.; Ma, M.; Wang, Q.; Zhang, M.; Jing, G.; Li, C.; Ma, F. Arbuscular mycorrhizal fungi enhanced drought resistance in apple by regulating genes in the MAPK pathway. Plant Physiol. Biochem. 2020, 149, 245–255. [Google Scholar] [CrossRef] [PubMed]
- Chitarra, W.; Pagliarani, C.; Maserti, B.; Lumini, E.; Siciliano, I.; Cascone, P.; Schubert, A.; Gambino, G.; Balestrini, R.; Guerrieri, E. Insights on the impact of arbuscular mycorrhizal symbiosis on tomato tolerance to water stress. Plant Physiol. 2016, 171, 1009–1023. [Google Scholar] [CrossRef] [PubMed]
- Fracasso, A.; Telò, L.; Lanfranco, L.; Bonfante, P.; Amaducci, S. Physiological beneficial effect of Rhizophagus intraradices inoculation on tomato plant yield under water deficit conditions. Agronomy 2020, 10, 71. [Google Scholar] [CrossRef]
- Augé, R.M.; Toler, H.D.; Saxton, A.M. Arbuscular mycorrhizal symbiosis alters stomatal conductance of host plants more under drought than under amply watered conditions: A meta-analysis. Mycorrhiza 2015, 25, 13–24. [Google Scholar] [CrossRef] [PubMed]
- Nath, M.; Bhatt, D.; Prasad, R.; Gill, S.S.; Anjum, N.A.; Tuteja, N. Reactive oxygen species generation-scavenging and signaling during plant-arbuscular mycorrhizal and Piriformospora indica interaction under stress condition. Front. Plant Sci. 2016, 7, 1574. [Google Scholar] [CrossRef]
- de Vries, F.T.; Griffiths, R.I.; Knight, C.G.; Nicolitch, O.; Williams, A. Harnessing rhizosphere microbiomes for drought-resilient crop production. Science 2020, 368, 270–274. [Google Scholar] [CrossRef]
- Cruz de Carvalho, M.H. Drought stress and reactive oxygen species: Production, scavenging and signaling. Plant Signal. Behav. 2008, 3, 156–165. [Google Scholar] [CrossRef]
- Varoquaux, N.; Cole, B.; Gao, C.; Pierroz, G.; Baker, C.R.; Patel, D.; Madera, M.; Jeffers, T.; Hollingsworth, J.; Sievert, J.; et al. Transcriptomic analysis of field-droughted sorghum from seedling to maturity reveals biotic and metabolic responses. Proc. Natl. Acad. Sci. USA 2019, 116, 27124–27132. [Google Scholar] [CrossRef]
- Bonfante, P.; Desirò, A. Who lives in a fungus? The diversity, origins and functions of fungal endobacteria living in Mucoromycota. ISME J. 2017, 11, 1727. [Google Scholar] [CrossRef]
- Sun, X.; Chen, W.; Ivanov, S.; MacLean, A.M.; Wight, H.; Ramaraj, T.; Mudge, J.; Harrison, M.J.; Fei, Z. Genome and evolution of the arbuscular mycorrhizal fungus Diversispora epigaea (formerly Glomus versiforme) and its bacterial endosymbionts. New Phytol. 2019, 221, 1556–1573. [Google Scholar] [CrossRef]
- Lumini, E.; Bianciotto, V.; Jargeat, P.; Novero, M.; Salvioli, A.; Faccio, A.; Bécard, G.; Bonfante, P. Presymbiotic growth and sporal morphology are affected in the arbuscular mycorrhizal fungus Gigaspora margarita cured of its endobacteria. Cell. Microbiol. 2007, 9, 1716–1729. [Google Scholar] [CrossRef]
- Salvioli, A.; Ghignone, S.; Novero, M.; Navazio, L.; Venice, F.; Bagnaresi, P.; Bonfante, P. Symbiosis with an endobacterium increases the fitness of a mycorrhizal fungus, raising its bioenergetic potential. ISME J. 2016, 10, 130–144. [Google Scholar] [CrossRef]
- Venice, F.; Ghignone, S.; di Fossalunga, A.S.; Amselem, J.; Novero, M.; Xianan, X.; Toro, K.S.; Morin, E.; Lipzen, A.; Grigoriev, I.V.; et al. At the nexus of three kingdoms: The genome of the mycorrhizal fungus Gigaspora margarita provides insights into plant, endobacterial and fungal interactions. Environ. Microbiol. 2020, 22, 122–141. [Google Scholar] [CrossRef] [PubMed]
- Vannini, C.; Carpentieri, A.; Salvioli, A.; Novero, M.; Marsoni, M.; Testa, L.; de Pinto, M.C.; Amoresano, A.; Ortolani, F.; Bracale, M.; et al. An interdomain network: The endobacterium of a mycorrhizal fungus promotes antioxidative responses in both fungal and plant hosts. New Phytol. 2016, 211, 265–275. [Google Scholar] [CrossRef]
- Dearth, S.P.; Castro, H.F.; Venice, F.; Tague, E.D.; Novero, M.; Bonfante, P.; Campagna, S.R. Metabolome changes are induced in the arbuscular mycorrhizal fungus Gigaspora margarita by germination and by its bacterial endosymbiont. Mycorrhiza 2018, 28, 421–433. [Google Scholar] [CrossRef] [PubMed]
- Cavagnaro, T.R.; Gao, L.-L.; Smith, F.A.; Smith, S.E. Morphology of arbuscular mycorrhizas is influenced by fungal identity. New Phytol. 2001, 151, 469–475. [Google Scholar] [CrossRef]
- Tahat, M.M.; Kamaruzaman, S.; Radziah, O.; Kadir, U.; Masdek, Z.H.N. Response of Lycopersicum esculentum MILL. to different arbuscular mycorrhizal fungi species. Asian J. Plant Sci. 2008, 7, 479–484. [Google Scholar] [CrossRef]
- Koch, A.M.; Antunes, P.M.; Maherali, H.; Hart, M.M.; Klironomos, J.N. Evolutionary asymmetry in the arbuscular mycorrhizal symbiosis: Conservatism in fungal morphology does not predict host plant growth. New Phytol. 2017, 214, 1330–1337. [Google Scholar] [CrossRef]
- Sawers, R.J.H.; Svane, S.F.; Quan, C.; Grønlund, M.; Wozniak, B.; Gebreselassie, M.-N.; González-Muñoz, E.; Montes, R.A.C.; Baxter, I.; Goudet, J.; et al. Phosphorus acquisition efficiency in arbuscular mycorrhizal maize is correlated with the abundance of root-external hyphae and the accumulation of transcripts encoding PHT1 phosphate transporters. New Phytol. 2017, 214, 632–643. [Google Scholar] [CrossRef]
- Volpe, V.; Chitarra, W.; Cascone, P.; Volpe, M.G.; Bartolini, P.; Moneti, G.; Pieraccini, G.; Di Serio, C.; Maserti, B.; Guerrieri, E.; et al. The association with two different arbuscular mycorrhizal fungi differently affects water stress tolerance in tomato. Front. Plant Sci. 2018, 9, 1480. [Google Scholar] [CrossRef]
- Ruiz-Lozano, J.M.; Aroca, R.; Zamarreño, Á.M.; Molina, S.; Andreo-Jiménez, B.; Porcel, R.; García-Mina, J.M.; Ruyter-Spira, C.; López-Ráez, J.A. Arbuscular mycorrhizal symbiosis induces strigolactone biosynthesis under drought and improves drought tolerance in lettuce and tomato. Plant Cell Environ. 2016, 39, 441–452. [Google Scholar] [CrossRef] [PubMed]
- Bitterlich, M.; Sandmann, M.; Graefe, J. Arbuscular mycorrhiza alleviates restrictions to substrate water flow and delays transpiration limitation to stronger drought in tomato. Front. Plant Sci. 2018, 9, 154. [Google Scholar] [CrossRef] [PubMed]
- Zhang, H.; Sonnewald, U. Differences and commonalities of plant responses to single and combined stresses. Plant J. 2017, 90, 839–855. [Google Scholar] [CrossRef]
- Zouari, I.; Salvioli, A.; Chialva, M.; Novero, M.; Miozzi, L.; Tenore, G.; Bagnaresi, P.; Bonfante, P. From root to fruit: RNA-Seq analysis shows that arbuscular mycorrhizal symbiosis may affect tomato fruit metabolism. BMC Genom. 2014, 15, 221. [Google Scholar] [CrossRef] [PubMed]
- Bonfante, P.; Genre, A. Plants and arbuscular mycorrhizal fungi: An evolutionary-developmental perspective. Trends Plant Sci. 2008, 13, 492–498. [Google Scholar] [CrossRef] [PubMed]
- Porro, D.; Dorigatti, C.; Stefanini, M.; Ceschini, A. Use of SPAD meter in diagnosis of nutritional status in apple and grapevine. Acta Hortic. 2001, 564, 243–252. [Google Scholar] [CrossRef]
- Gómez-Ariza, J.; Balestrini, R.; Novero, M.; Bonfante, P. Cell-specific gene expression of phosphate transporters in mycorrhizal tomato roots. Biol. Fertil. Soils 2009, 45, 845–853. [Google Scholar] [CrossRef]
- Bravo, A.; Brands, M.; Wewer, V.; Dörmann, P.; Harrison, M.J. Arbuscular mycorrhiza-specific enzymes FatM and RAM2 fine-tune lipid biosynthesis to promote development of arbuscular mycorrhiza. New Phytol. 2017, 214, 1631–1645. [Google Scholar] [CrossRef]
- Keymer, A.; Pimprikar, P.; Wewer, V.; Huber, C.; Brands, M.; Bucerius, S.L.; Delaux, P.-M.; Klingl, V.; von Röpenack-Lahaye, E.; Wang, T.L.; et al. Lipid transfer from plants to arbuscular mycorrhiza fungi. eLife 2017, 6, e29107. [Google Scholar] [CrossRef]
- Sugiura, Y.; Akiyama, R.; Tanaka, S.; Yano, K.; Kameoka, H.; Kawaguchi, M.; Akiyama, K.; Saito, K. Myristate as a carbon and energy source for the asymbiotic growth of the arbuscular mycorrhizal fungus Rhizophagus irregularis. BioRxiv 2019, 731489. [Google Scholar] [CrossRef]
- Xie, X.; Lin, H.; Peng, X.; Xu, C.; Sun, Z.; Jiang, K.; Huang, A.; Wu, X.; Tang, N.; Salvioli, A.; et al. Arbuscular mycorrhizal symbiosis requires a phosphate transceptor in the Gigaspora margarita fungal symbiont. Mol. Plant 2016, 9, 1583–1608. [Google Scholar] [CrossRef] [PubMed]
- Chialva, M.; Fangel, J.U.; Novero, M.; Zouari, I.; di Fossalunga, A.S.; Willats, W.G.T.; Bonfante, P.; Balestrini, R. Understanding changes in tomato cell walls in roots and fruits: The contribution of arbuscular mycorrhizal colonization. IJMS 2019, 20, 415. [Google Scholar] [CrossRef] [PubMed]
- Davison, J.; Moora, M.; Öpik, M.; Adholeya, A.; Ainsaar, L.; Bâ, A.; Burla, S.; Diedhiou, A.G.; Hiiesalu, I.; Jairus, T.; et al. Global assessment of arbuscular mycorrhizal fungus diversity reveals very low endemism. Science 2015, 349, 970–973. [Google Scholar] [CrossRef] [PubMed]
- Bulgarelli, R.G.; Marcos, F.C.C.; Ribeiro, R.V.; de Andrade, S.A.L. Mycorrhizae enhance nitrogen fixation and photosynthesis in phosphorus-starved soybean (Glycine max L. Merrill). Environ. Exp. Bot. 2017, 140, 26–33. [Google Scholar] [CrossRef]
- Basirat, M.; Malboobi, M.A.; Mousavi, A.; Asgharzadeh, A.; Samavat, S. Effects of phosphorous supply on growth, phosphate distribution and expression of transporter genes in tomato plants. Austr. J. Crop Sci. 2011, 5, 537. [Google Scholar]
- Gerdemann, J.W.; Nicolson, T.H. Spores of mycorrhizal Endogone species extracted from soil by wet sieving and decanting. Transact. Brit. Mycol. Soc. 1963, 46, 235–244. [Google Scholar] [CrossRef]
- Hewitt, E.J. Sand and Water Culture Methods Used in the Study of Plant Nutrition, 2nd ed.; Commonwealth Agricultural Bureaux: Oxfordshire, UK, 1966; pp. 1–241. [Google Scholar]
- Balestrini, R.; Rosso, L.C.; Veronico, P.; Melillo, M.T.; De Luca, F.; Fanelli, E.; Colagiero, M.; di Fossalunga, A.S.; Ciancio, A.; Pentimone, I. Transcriptomic responses to water deficit and nematode infection in mycorrhizal tomato ioots. Front. Microbiol. 2019, 10, 1807. [Google Scholar] [CrossRef]
- de Freitas, S.T.; Shackel, K.A.; Mitcham, E.J. Abscisic acid triggers whole-plant and fruit-specific mechanisms to increase fruit calcium uptake and prevent blossom end rot development in tomato fruit. J. Exp. Bot. 2011, 62, 2645–2656. [Google Scholar] [CrossRef]
- Hoeksema, J.D.; Chaudhary, V.B.; Gehring, C.A.; Johnson, N.C.; Karst, J.; Koide, R.T.; Pringle, A.; Zabinski, C.; Bever, J.D.; Moore, J.C.; et al. A meta-analysis of context-dependency in plant response to inoculation with mycorrhizal fungi. Ecol. Lett. 2010, 13, 394–407. [Google Scholar] [CrossRef]
- Trouvelot, A.; Kough, J.; Gianinazzi-Pearson, V. Mesure du taux de mycorhization VA d’un système radiculaire. Recherche de méthodes d’estimation ayant une signification fonctionnelle. In Physiological and Genetical Aspects of Mycorrhizae; Gianinazzi-Pearson, V., Gianinazzi, S., Eds.; Institut National de la Recherche Agronomique: Paris, France, 1986; pp. 217–221. [Google Scholar]
- Ohno, T.; Zibilske, L.M. Determination of low concentrations of phosphorus in soil extracts using malachite green. Soil Sci. Soc. Am. J. 1991, 55, 892–895. [Google Scholar] [CrossRef]
- Martin, M.; Celi, L.; Barberis, E. Determination of low concentrations of organic phosphorus in soil solution. Comm. Soil Sci. Plant Anal. 1999, 30, 1909–1917. [Google Scholar] [CrossRef]
- Fiorilli, V.; Catoni, M.; Miozzi, L.; Novero, M.; Accotto, G.P.; Lanfranco, L. Global and cell-type gene expression profiles in tomato plants colonized by an arbuscular mycorrhizal fungus. New Phytol. 2009, 184, 975–987. [Google Scholar] [CrossRef] [PubMed]
- Salvioli, A.; Lumini, E.; Anca, I.A.; Bianciotto, V.; Bonfante, P. Simultaneous detection and quantification of the unculturable microbe Candidatus Glomeribacter gigasporarum inside its fungal host Gigaspora margarita. New Phytol. 2008, 180, 248–257. [Google Scholar] [CrossRef] [PubMed]
- Pfaffl, M.W. A new mathematical model for relative quantification in real-time RT–PCR. Nucleic Acids Res. 2001, 29, e45. [Google Scholar] [CrossRef] [PubMed]
- R Core Team. R: A Language and Environment for Statistical Computing; R Foundation for Statistical Computing: Vienna, Austria, 2020. [Google Scholar]
- RStudio Team. RStudio: Integrated Development Environment for R; RStudio, Inc.: Boston, MA, USA, 2020. [Google Scholar]
- Shapiro, S.S.; Wilk, M.B. An analysis of variance test for normality (complete samples). Biometrika 1965, 52, 591–611. [Google Scholar] [CrossRef]
- Levene, H. Robust tests for equality of variances. In Contributions to Probability and Statistics: Essays in Honor of Harold Hotelling; I. Olkin Stanford University Press: Palo Alto, CA, USA, 1960; pp. 278–292. [Google Scholar]
- Fox, J.; Weisberg, S. An R Companion to Applied Regression, 3rd ed.; Sage: Thousand Oaks, CA, USA, 2019. [Google Scholar]
- Kay, M.; Wobbrock, J. mjskay/ARTool: ARTool 0.10.6; Zenodo. 2019. Available online: https://zenodo.org/record/2556415#.XwwxX3UzZ8x (accessed on 11 July 2020). [CrossRef]
- Tukey, J.W. Comparing individual means in the analysis of variance. Biometrics 1949, 5, 99–114. [Google Scholar] [CrossRef] [PubMed]
- Kruskal, W.H. A nonparametric test for the several sample problem. Ann. Math. Stat. 1952, 23, 525–540. [Google Scholar] [CrossRef]
- De Mendiburu, F. Agricolae: Statistical Procedures for Agricultural Research, R Package Version 1.3-2; 2020. Available online: https://CRAN.R-project.org/package=agricolae (accessed on 30 April 2020).
- Wickham, H. ggplot2: Elegant Graphics for Data Analysis, 2nd ed.; Use R! Springer International Publishing: New York, NY, USA, 2016; ISBN 978-3-319-24275-0. [Google Scholar]


© 2020 by the authors. Licensee MDPI, Basel, Switzerland. This article is an open access article distributed under the terms and conditions of the Creative Commons Attribution (CC BY) license (http://creativecommons.org/licenses/by/4.0/).