Abstract
Phospholipid-hydrolyzing enzymes include members of the phospholipase C (PLC) family that play important roles in regulating plant growth and responding to stress. In the present study, a systematic in silico analysis of the wheat PLC gene family revealed a total of 26 wheat PLC genes (TaPLCs). Phylogenetic and sequence alignment analyses divided the wheat PLC genes into 2 subfamilies, TaPI-PLC (containing the typical X, Y, and C2 domains) and TaNPC (containing a phosphatase domain). TaPLC expression patterns differed among tissues, organs, and under abiotic stress conditions. The transcript levels of 8 TaPLC genes were validated through qPCR analyses. Most of the TaPLC genes were sensitive to salt stress and were up-regulated rapidly, and some were sensitive to low temperatures and drought. Overexpression of TaPI-PLC1-2B significantly improved resistance to salt and drought stress in Arabidopsis, and the primary root of P1-OE was significantly longer than that of the wild type under stress conditions. Our results not only provide comprehensive information for understanding the PLC gene family in wheat, but can also provide a solid foundation for functional characterization of the wheat PLC gene family.
1. Introduction
Phospholipids are an important component of cytoplasmic membranes, playing a vital role in plant growth, development, and regulation of responses to abiotic stresses and biotic challenges [1,2]. Phospholipases in plants are responsible for the hydrolysis of phospholipids and are divided into four types: phospholipase A1 (PLA1), phospholipase A2 (PLA2), phospholipase C (PLC), and phospholipase D (PLD). Within each type, there also are subfamilies that differ in structure, substrate, binding site and reaction conditions under which they are active [3]. Based on their substrates, PLCs can be divided into two subfamilies: the phosphatidylinositol specific PLC (PI-PLC) and the nonspecific PLC (NPC) [4,5]. PI-PLC can hydrolyze phosphatidylinositol 4,5-bisphosphate (PIP2) to produce two important signaling molecules, inositol triphosphate (IP3) and diacylglycerol (DAG) [6], which release Ca2+ from cells and activate members of the protein kinase C (PKC) family, thus participating in plant growth and development [7,8]. Members of the NPC hydrolyze a series of membrane phospholipids such as phosphatidylcholine (PC) and phosphatidylethanolamine (PE) to generate phosphatidylserine (PS), diacetylglycerol (DAG), and the corresponding phosphate groups [9,10,11,12]. When plants NPCs were first discovered, they were not related to any other known members of the plant phospholipase family, but had three conserved regions shared with phospholipase in Mycobacterium tuberculosis [12]. Although NPC does not have the C2, X, Y, and EF domains, it contains a phosphatase domain and can hydrolyze phospholipid, so it is classified as a subfamily of the PLCs [6,12,13].
Members of the phospholipase C gene family have been categorized and described in many plant species [3,5,14,15,16] including 9 PI-PLC and 6 NPC genes in Arabidopsis thaliana, 4 PI-PLC, and 5 NPC genes in rice (Oryza sativa L.), 5 PI-PLC and 4 NPC genes in maize (Zea mays L.), and 12 PI-PLC and 9 NPC genes in cotton (Gossypium spp.). In A. thaliana, AtPI-PLC1 played an important role in hyperosmotic stress independent of ABA treatment [17]. AtPI-PLC2 is involved in seedling growth, the endoplasmic reticulum stress response, and regulation of male and female gametophyte development [18,19], whereas AtPI-PLC3 and AtPI-PLC9 contributed to heat resistance [20,21]. Overexpression of AtPI-PLC5 caused premature leaf decay [22], the AtNPC4 gene enhanced resistance to high osmotic stress [23]. Abscisic acid induced up-regulation of AtPI-PLC6 expression and participation in the cold stress response [24]. In Brassica napus, overexpression of BnPI-PLC2 enhanced plant drought tolerance and positively affected phytohormone levels [25,26]. In potato, StPLC was involved in regulation of DNA synthesis and the cell cycle [27], and in maize, ZmPI-PLC1 affected plant development by promoting asymmetric cell division [14].
PLC enzymes also are known to be involved in growth, development and stress responses in wheat (Triticum aestivum L.) [5,28,29,30,31]. However, the genes in wheat have not previously been analyzed systematically. In this study, we identified and characterized the wheat PLC gene family, including sequence features, conserved domains, chromosomal locations, phylogenetic relationships, cis-acting elements, tissue specific expression levels, and expression patterns in response to abiotic stresses including low temperature, drought, and salt stress. One of the family members, TaPI-PLC1-2B, was demonstrated to play an important role in responding to drought and salt stress. Our study not only presents comprehensive information for understanding the PLC gene family in wheat, but can also provide a solid foundation for the functional characterization of the wheat PLC gene family.
2. Results
2.1. Identification and Analysis of Phospholipase C (PLC) Gene Family Members in Wheat
Following analysis of the PLAZA protein database with HMM and confirmation of the conserved domains by CDD, Pfam, and SMART search tools, a total of 26 wheat PLC genes were identified and named TaPI-PLC1-2A to TaNPC7-4A, based on their subfamily, chromosomal position, and genomic homology. Results of analysis by ExPasy indicated that the physicochemical properties of the two groups of encoded proteins differed (Table 1). TaPI-PLC proteins comprised of 585–633 amino acids with molecular weights of 65.7–71.1 kDa and a slightly acidic isoelectric point of less than 7. In contrast, TaNPC proteins were smaller, only 513-554 amino acids in length, with molecular weights of 56.7–61.7 kDa. Seven TaNPC proteins had isoelectric points less than 7, while the other 8 all had isoelectric points greater than 7 and were slightly alkaline. The GRAVY values of TaPI-PLC and TaNPC proteins were less than 0, indicating that members of both families were hydrophilic.

Table 1.
Features of TaPLC genes identified in wheat.
2.2. Exon–Intron Structure and Conserved Motifs of TaPLC Genes
As shown in Figure 1, there are structural differences among TaPLC genes, but genes clustered on a branch have similar exon-intron structures, numbers, and distributions of functional motifs. TaPI-PLC genes share 4 motifs designated 2, 3, 4 and 10. Except for TaPI-PLC1-2A, TaPI-PLC1-2B, and TaPI-PLC1-2D, which have 8 exons and 7 introns, all the others have 9 exons and 8 introns. The TaNPC genes mainly contain 6 motifs including 1, 5, 6, 7, 8, and 9. TaNPC6-3B and the three homologous copies of TaNPC2 contain 4 exons; TaNPC7-4A, TaNPC5-3A, and the three homologous copies of TaNPC4 contain 3 exons, while the homologous copies of TaNPC1 and TaNPC2 have only two exons. From the protein sequence alignment results, it can be found that motifs 1, 5, 6, 7, 8, and 9 together constitute the phospholipase domain of NPC (Figure 2). While motifs 2 and 10 form the PI-PLC-X domain, motifs 3 and 4 correspond to PI-PLC-Y and PI-PLC-C2, respectively (Figure 3).
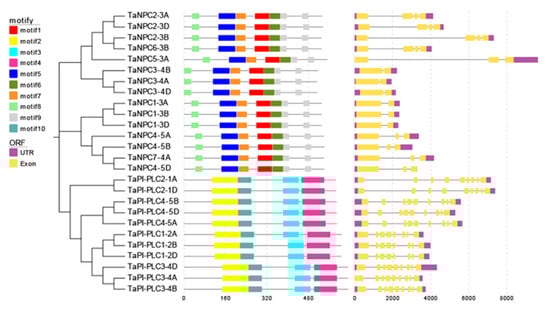
Figure 1.
Evolutionary relationship (left), sequence prediction (center), and gene structure (right) of TaPLC genes. The evolutionary history was inferred by using the Neighbor-joining method in MEGA7, and the bootstrap value was 1000. The combination of motifs associated with each TaPLC protein is shown in the middle. Ten motifs are marked with boxes of different colors. The EvolView online tool was used to compare the predicted coding sequence (CDS) with the corresponding genomic sequence to detect the exon/intron distribution of the corresponding TaPLC gene. The yellow box represents an exon and the gray solid line represents an intron.
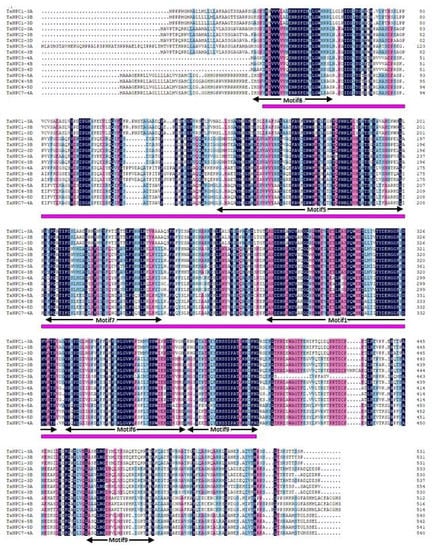
Figure 2.
Sequence alignment of the 15 members of wheat NPC proteins. The black lines indicate motifs 1, 5, 6, 7, 8, and 9. The purple lines denote the NPC domain.
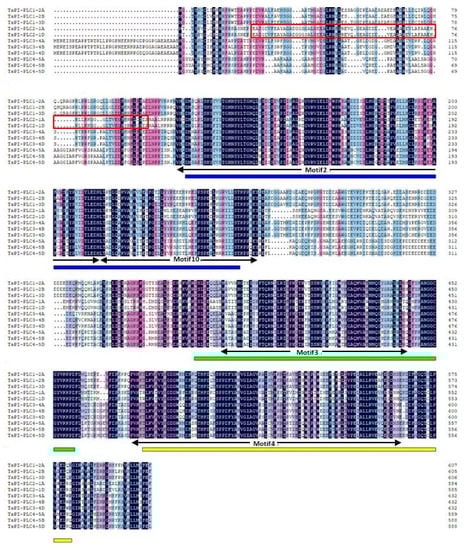
Figure 3.
Sequence alignment of the 11 members of wheat PI-PLC proteins. The black lines indicate motifs 2, 3, 4, and 10. The red box represents the EF-hand. The blue, green, and yellow lines represent PI-PLC-X, PI-PLC-Y, and PI-PLC-C2 domains, respectively.
2.3. Phylogenetic Analysis of TaPLC Genes
In order to precisely reveal the evolutionary relationships of the TaPLC proteins, we performed phylogenetic analyses of 4 monocotyledons (wheat, rice, maize, and orchid) and 3 dicotyledons (Arabidopsis, soybean, and cotton) using a neighbor-joining method (Figure 4, Table S1). From the results we can see that the phylogenetic tree showed that 89 PLC genes were divided into PI-PLC and NPC groups totaling 50 PI-PLC genes and 39 NPC genes, respectively. Genes from monocots and dicots were relatively distantly related, wheat and rice were evolutionarily closer to each other than wheat and maize or wheat and orchid, and Arabidopsis PLCs showed high homology to PI-PLCs from soybean and cotton. Similar trends were found for the TaNPC proteins, which more closely resembled those in rice and maize.
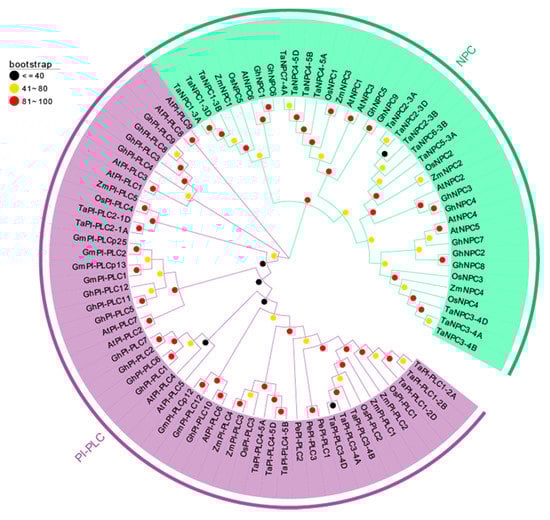
Figure 4.
Phylogenetic tree of TaPLCs from wheat, rice, maize, orchid, Arabidopsis, soybean, and cotton. The phylogenetic tree was constructed by using the Neighbor-joining method with 1000 bootstrap replications. The PI-PLC and NPC subfamilies are shown in purple and green colors.
2.4. Chromosome Localization, Gene Duplication, and Collinearity Analysis of TaPLC Genes
The 26 members of the TaPLC family are randomly distributed on 14 chromosomes of wheat (Figure 5), among which the 3A, 3B, and 4A chromosomes carried the most TaPLC genes. Chromosomes 1A, 1D, 2A, 2B, and 2D contained fewer members, with only one gene per chromosome. Among the 26 TaPLC genes, there were 10, 8, and 8 members distributed on wheat sub-genomes A, B, and D, respectively.
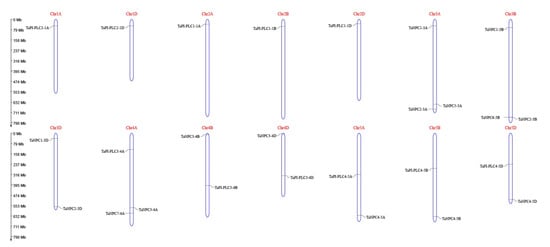
Figure 5.
Chromosomal distribution of TaPLC genes in wheat. The chromosomal position of each TaPLC was mapped according to the physical positions of wheat genomes (Table 1). The chromosome number is labeled at the top of each chromosome. The scale is in mega bases (Mb).
In terms of gene duplication, there were 7 TaPLC members (TaPI-PLC1, 3, 4, and TaNPC1, 2, 3, 4) containing three copies and only TaPI-PLC2 containing two copies, TaNPC5-3A, TaNPC6-3B, and TaNPC7-4A had only one copy each, which was on chromosomes 3A, 3B, and 4A (Figure 6). Interestingly, TaNPC7-4A had the greatest sequence similarity to TaNPC4-5A (93.67%), TaNPC4-5B (96.13%), and TaNPC4-5D (96.31%). Therefore, TaNPC7-4A was identified as a segmental duplication gene. TaNPC5-3A had the greatest sequence similarity to TaNPC2-3A (88.94%), and TaNPC6-3B had the greatest sequence similarity to TaNPC2-3B (95.17%). Because the genes were distantly located, they were also identified as segmental duplication gene. Therefore, TaNPC7-4A, TaNPC5-3A, and TaNPC6-3B were segmental duplications, and no tandem duplication events involving TaPLCs were discovered in the wheat genome. In addition, we found that TaPI-PLC3-4A and TaNPC3-4A on chromosome 4A were reversed with their homologous genes on chromosomes 4B and 4D (Figure 6).
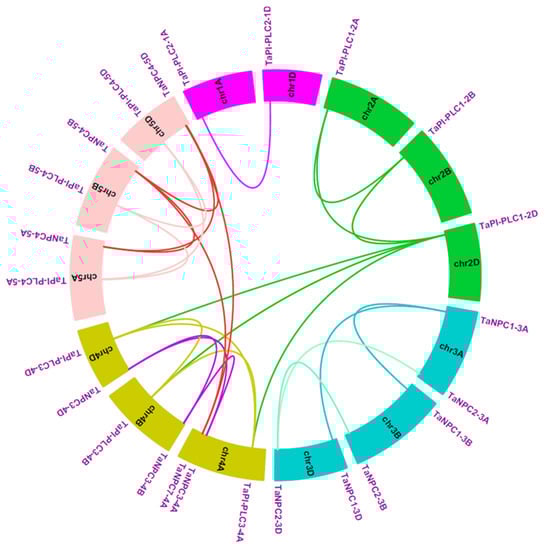
Figure 6.
Schematic diagram of the homologous TaPLC genes in wheat A, B and D sub-genomes and the duplicated genes pairs identified in wheat.
To better understand the evolutionary factors that affect the TaPLC gene family, we calculated the Ka (Nonsynonymous) and Ks (Synonymous) ratios between TaPLC gene pairs (Table S2). The Ka/Ks values of the segmentally duplicated TaPLC gene pairs, as well as of the orthologous TaPLC gene pairs were less than 1, suggesting that members of this gene family might have undergone strong purifying selective pressure during evolution in wheat.
Next, synteny analysis between wheat and rice was conducted (Figure 7, Table S3), and 23 orthologous PLC gene pairs were found, reinforcing the strong relationship between these plant species revealed by phylogenetic analyses. These results indicated that there was a strong genetic relationship between PLC genes in monocotyledons.
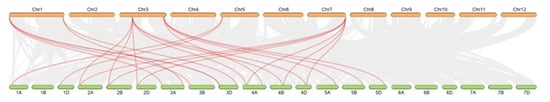
Figure 7.
Syntenic relationships between TaPLC genes in wheat and rice. Gray lines in the background indicate the collinear blocks within the wheat and rice genomes, while the red lines highlight the synteny of TaPLC gene pairs.
2.5. Cis-Regulatory Elements in the Promoters of Wheat PLC Genes
To further evaluate the mechanism of TaPLC gene regulation in the abiotic stress response, the 2.0 kb upstream sequences from the translation initiation sites of TaPLC genes were submitted to PlantCARE for detection of cis-acting elements. Six such elements related to abiotic stress were evaluated including ABRE (Involved in the abscisic acid responsiveness), W-box (involved in dehydration responsiveness), MYB (Involved in drought-inducibility), MYC (involved in the drought and abscisic acid responsiveness), LTR (involved in low-temperature responsiveness), and TC-rich repeats (involved in defense and stress responsiveness) (Figure 8). Each TaPLC gene contained at least two stress-related cis-acting elements, with ABRE, MYC, and MYB found in almost all TaPLCs. From 1 to 3 LTRs were present in 13 TaPLCs, and TC-rich repeats and W-boxes were located in 6 and 16 TaPLCs, respectively. These results indicated that the individual TaPLC genes can respond to multiple abiotic stresses.
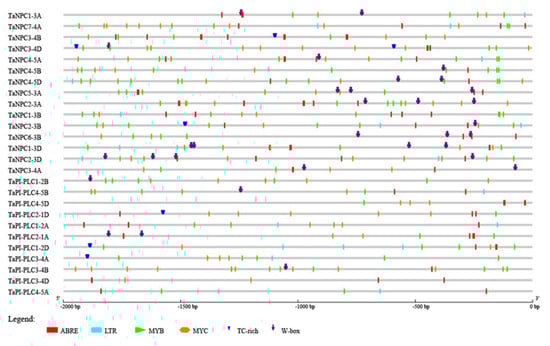
Figure 8.
Predicted cis-acting elements in TaPLC promoters. Promoter sequences (–2000 bp) of 26 TaPLC genes analyzed by PlantCARE.
2.6. Expression Patterns of TaPLC Genes in Different Tissues, Organs, and Stresses
The heatmap of 26 TaPLC genes was constructed by using RNA-seq data from the wheat expression database, and these genes were represented by TPM (Transcripts per million reads) values in seven different tissues and organs (root, stem, leaf, spike, grain, embryo, endosperm) (Figure 9). Within the TaPI-PLC subtype, only TaPI-PLC3-4B and TaPI-PLC3-4D were barely expressed in all tissues and organs, and the other 9 genes were significantly expressed in at least one tissue or organ. TaPI-PLC1-2A, TaPI-PLC1-2B, TaPI-PLC1-2D, and TaPI-PLC2-1D were highly expressed in roots and stems, while TaPI-PLC4-5A, TaPI-PLC4-5B, and TaPI-PLC4-5D were mainly expressed in roots, stems, and grains. Among TaNPCs, only TaNPC7-4A, TaNPC4-5A, TaNPC4-5B, and TaNPC4-5D had high expression levels, which were expressed in all seven tissues and organs. The heatmap results also showed that most homologous gene copies such as TaPI-PLC1, TaPI-PLC4, TaNPC3, and TaNPC4 had similar expression patterns and were highly expressed in the same tissues.
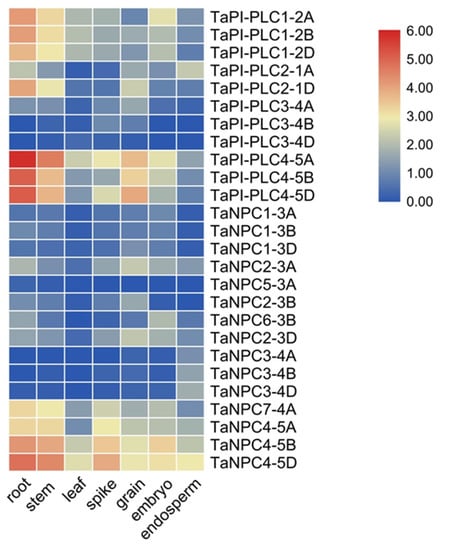
Figure 9.
Expression profiles of TaPLC genes in 7 different tissues and organs (root, stem, leaf, spike, grain, embryo, endosperm). The data used in the figure were obtained from the wheat expression database (http://202.194.139.32/expression/index.html?tdsourcetag=s_pcqq_aiomsg).
These results for gene expression under various abiotic stresses highlight the great importance of PLC family members in response to adverse conditions in plants (Figure 10). Under low temperature, drought, and salt stress, multiple copies of TaPI-PLC1, TaPI-PLC2, TaPI-PLC3, and TaNPC4 were up-regulated in the PLC family of wheat. Conversely, TaPI-PLC3-4A, TaPI-PLC3-4B, TaNPC1-3A, TaNPC1-3D, and TaNPC5-3A were almost not expressed under the three abiotic stresses. Most TaPLC genes were expressed under salt stress, which indicated that members of the PLC gene family might be sensitive to salt.
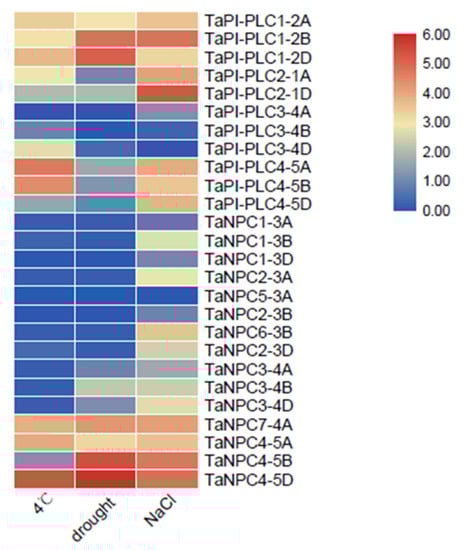
Figure 10.
Expression profiles of 26 TaPLC genes under different stresses. The data used in the figure were obtained from the wheat expression database.
2.7. Expression Profiles of TaPLCs in Leaves under Abiotic Stress
To further explore the expression changes in the TaPLC genes under various abiotic stresses including low temperature, salt, and drought, qRT-PCR was used to investigate the transcript levels of TaPI-PLC1-2B, TaPI-PLC2-1D, TaPI-PLC3-4A, TaPI-PLC4-5D, TaNPC1-3B, TaNPC2-3A, TaNPC3-4B, and TaNPC4-5D (Figure 11).
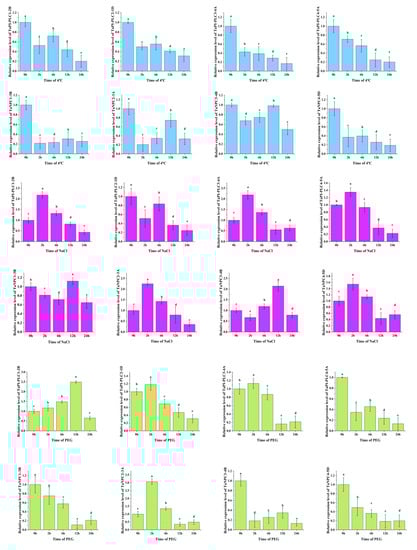
Figure 11.
Gene expression profiles of TaPLC genes under drought (PEG) (green), salt (NaCl) (purple), and low temperature (4 °C) (blue) stress. The 2 -ΔΔCT method was used to calculate relative gene expression. In order to calculate the relative expression, the expression of each gene under the control treatment was set as 1. Error bars indicate standard deviations of three biological replicates. Different letters marked on the same bar chart indicate significant differences at the 0.05 level.
Under drought stress, the expression levels of 8 TaPLC genes differed in leaves. The results showed that only the expressions of TaPI-PLC1-2B, TaPI-PLC2-1D, TaPI-PLC3-4A, and TaNPC2-3A were up-regulated after PEG treatment, while the others were significantly down-regulated. TaPI-PLC2-1D, TaPI-PLC3-4A and TANPC2-3A were firstly up-regulated, reached a peak at 2h, and then were down-regulated, while TaPI-PLC1-2B reached a peak at 12h. There was a high degree of agreement of TaPI-PLC between qPCR and public data, while data for TaNPC were quite different.
Under low temperature stress at 4 °C, the expression levels of 8 TaPLC genes were significantly down-regulated. Interestingly, except for TaPI-PLC3-4A and TaPI-PLC4-5A, the other six genes showed only a slight upward and downward trend. The expression pattern of TaNPC was basically consistent with the results in Figure 10 and showed different expression pattern compares with TaPI-PLCs.
Under salt stress, PLC genes were significantly up-regulated except for TaPI-PLC2-1D. The expressions of TaPI-PLC1-2B, TaPI-PLC3-4A, TaPI-PLC4-5A, TaNPC2-3A, and TaNPC4-5D reached their peak values at 2h and then decreased, while the expressions of TaNPC1-3B and TaNPC3-4B did not reach peak values until 12h. The results were basically consistent with Figure 10, indicating that PLC genes were indeed sensitive to salt stress. Further, the different patterns of expression under different stress treatments indicated that members of the TaPLC gene family differ in their responses and regulatory mechanisms when exposed to conditions of abiotic stress.
2.8. Overexpression of TaPI-PLC1-2B Enhanced Abiotic Stress Resistance in Arabidopsis Transgenic Plants
The TaPI-PLC1-2B gene is evolutionarily close to OsPI-PLC1 in rice (Figure 4). In addition, the expression of TaPI-PLC1-2B was consistent with OsPI-PLC1 under drought, salt and low temperature stress. Therefore, we hypothesized that TaPI-PLC1-2B might play an important role in abiotic stress response. In order to reveal the potential function of TaPI-PLC1-2B, an overexpression vector for it was constructed (Figure 12) and transgenic Arabidopsis plants were obtained.
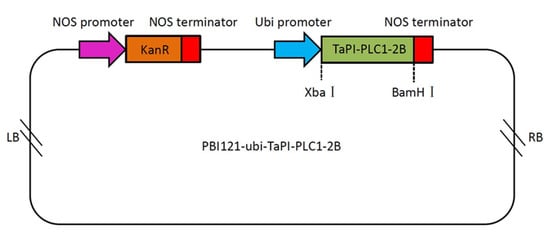
Figure 12.
Schematic diagram of the overexpression vector containing TaPI-PLC1-2B. LB, left border; NOS promoter, nopaline synthase gene promoter; NOS terminator, nopaline synthase gene terminator; Ubi promoter, ubiquitin gene promoter; KanR, kanamycin resistance gene; RB, right border.
The independent homozygous transgenic line (T3) was used for the experiments, and wild type (WT) Arabidopsis was used as the control. The TaPI-PLC1-2B transgenic seedlings (P1-OE) and the WT were planted on medium containing 100 mM NaCl and 200 mM mannitol. After 10 days of growth, the taproot lengths of P1-OE and WT plants were counted and photographed (Figure 13). The results showed that under the conditions of salt (100 mM NaCl) and drought (200 mM mannitol) stress, there were significant phenotypic differences between P1-OE and WT seedlings. On MS medium containing NaCl (Figure 13A, C) and mannitol (Figure 13B, C), the primary roots lengths of P1-OE seedlings were 31.15% and 25.39% longer than WT seedlings, respectively. These data indicated that overexpression of TaPI-PLC1-2B could significantly enhance salt and drought stress responses in Arabidopsis.
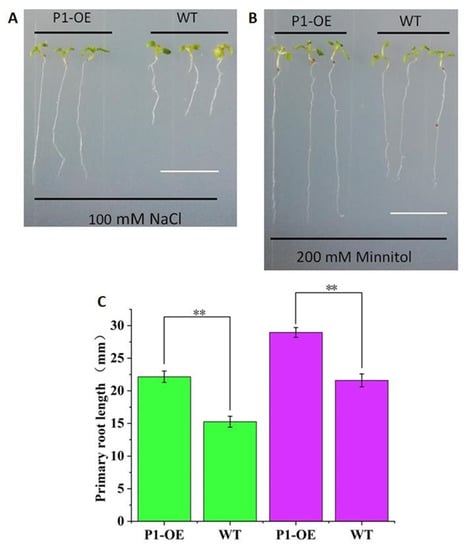
Figure 13.
Analysis of the sensitivity of WT and TaPI-PLC1-2B overexpression (P1-OE) seedlings to NaCl and mannitol. (A) Phenotype of WT and TaPI-PLC1-2B transgenic seedlings grown on MS medium containing 100Mm NaCl for 10 days. (B) Ten-day-old WT and TaPI-PLC1-2B transgenic seedlings grown on MS medium containing 200 mM mannitol. (C) Primary roots lengths of the WT and TaPI-PLC1-2B transgenic plants at 10 day after sowing. The green rectangle represents NaCl treatment and the purple rectangle represents mannitol treatment. Bars = 10 mm. Mean values were calculated from 20 biological replicates, with error bars representing standard deviations. Statistically significant differences are indicated: **, p < 0.01.
3. Discussion
Improvements in sequencing and bioanalytical tools have opened the large genomes of crop plants to investigation, providing avenues to the identification of plant gene families and the mining of their functions [32,33]. This study used bioinformatics to identify a family of 26 PLC genes in wheat, a number greater than that in Arabidopsis (15), rice (9), and maize (9). These 26 genes had arisen through whole genome replication and tandem gene duplication events [34], and gene expansion also has enhanced the ability of wheat to adapt to complex and variable environments. However, there was considerable variation among the basic characteristics of wheat PLC proteins in features such as protein length, molecular weight, and isoelectric point. Due to the continuous insertion and deletion of introns, wheat PLC gene structure also has evolved considerably. Each member of the family contains from 1 to 8 introns and 2 to 9 exons, and some PLC genes contain UTR regions. Amino acid sequence analysis showed that all TaPI-PLCs have retained the three conserved X, Y and C2 domains, and only TaPI-PLC2-1A and TaPI-PLC2-1D have an EF-hand. All TaNPCs have phosphoesterase domains. The conserved amino acid sequences in the EF-hand and the X, Y, C2, and phosphoesterase domains may affect gene transcription and the activation and inhibition of wheat PLC proteins by binding or interacting with other factors. In the phylogenetic tree we constructed for the Arabidopsis, cotton, soybean, orchid, maize, rice, and wheat PLC gene families, the wheat, rice, and maize PLC genes were widely distributed within the same branch, indicating that they have higher homology, and the genetic relationship between wheat, rice, and maize PLC genes is closer than the relationship to Arabidopsis. Especially between wheat and rice, the relationship in Figure 7 showed syntenic TaPLC gene pairs between wheat and rice, and in combination with phylogenetic analysis, these results indicate that the TaPLC genes in wheat and rice share high homology. Further chromosome location analysis showed that the 26 TaPLC genes are located unevenly on 14 chromosomes, with most of them near the terminal regions. TaPLC genes were not found on chromosomes 6 and 7, which may be the result of genome-wide replication events during wheat evolution.
The expression patterns of PLC genes in different tissues have been described in different plant species such as Arabidopsis, rice, soybean, and cotton [3,5,15,35]. According to the RNAseq data provided by the database, expression patterns of the PLC genes in wheat were investigated in various tissues and organs. High transcript levels of TaNPC4-5D were detected in all tissues and organs, especially root and stem. TaPI-PLC4-5A showed the highest expression level in root, while TaNPC2 and TaPI-PLC8 showed low expression in various tissues and organs. A previous study showed AtPLC2 transcripts were highly expressed in all organs in Arabidopsis [35], GmPI-PLC7 were detected in all organs of cotton [3], OsPLC1 and OsPLC3 were highly expressed in all organs, but OsPLC2 was detected in various organs with lower expression in rice [5]. The varied expression patterns of the wheat PLC genes imply that those genes may be involved in different stage or organ development of wheat.
Abiotic stress can induce a series of plant responses ranging from transcriptional regulation to signal transduction and the expression and activation of functionally specialized proteins [36]. Phospholipase genes play an important regulatory role in responding to environmental stress and because of their importance, members of the PLC gene family have been studied in considerable depth in other plants. For example, expression of all of the Arabidopsis PI-PLCs except for AtPI-PLC2 was induced by abiotic stresses [5,35], and abscisic acid also induced up-regulation of AtPI-PLC6 [24,37]. AtPI-PLC6, AtPI-PLC7, and AtPI-PLC8 were up-regulated by auxin and cytokinin [9,31]. In other plants, the expression of mung bean VrPI-PLC3, tobacco NtPI-PLC1, potato StPI-PLC1, and StPI-PLC2, and tempeh bean TluPI-PLC1 and TluPI-PLC2 was influenced by drought stress [38,39,40,41]. In our study, the results of qRT-PCR showed that the TaPLC genes were responsive to drought, salt, and cold stress. Among the three abiotic stresses, the TaPLC genes were more sensitive to salt stress (Figure 10 and Figure 11).
Phylogenetic analysis suggests that proteins from different species belonging to the same evolutionary branch may have similar functions. For example, OsNPC2 in rice was more sensitive to salt, and its expression level increased nearly eight times under salt stress [42]. The evolutionary relationship between TaNPC2 and OsNPC2 was relatively close (Figure 4 and Figure 11), and the expression of TaNPC2-3A increased by 2.5 times under salt stress. Similarly, OsPI-PLC1 was simultaneously induced by various stresses and especially by salt treatment, and under salt stress its expression increased 2 times [43]. A study on maize showed that overexpression of a ZmPI-PLC1 could improve drought tolerance of maize [44]. TaPI-PLC1-2B was highly homologous with OsPI-PLC1 and ZmPI-PLC1, and showed good resistance to both salt and drought stress, which was verified by the stress treatment of transgenic plants (Figure 13). Therefore, our study has shown that the expression of TaPLC genes changes under one or more abiotic stresses, indicating that they potentially have important roles in responses to environmentally adverse conditions.
4. Materials and Methods
4.1. Identification of PLC Family Members in the Wheat Genome
To identify potential PLC gene family members, we screened the entire protein sequence of the wheat genome from the PLAZA database (https://bioinformatics.psb.ugent.be/plaza/) with the HMM profiles (http://pfam.xfam.org/) PI-PLC-X (PF00388), PI-PLC-Y (PF00387), and PI-PLC-C2 (PF00168), the three domains characteristic of PI-PLC, and (PF04185) the domain characteristic of NPC proteins [5]. Those sequences with a cutoff value <0.001 and containing all three PLC-X, PLC-Y, and PLC-C2 domains were considered to be candidate members of the TaPI-PLC family, while those with only a phosphoesterase domain were designated potential TaNPC proteins. Putative PI-PLC protein sequences were submitted to CDD (https://www.ncbi.nlm.nih.gov/cdd), Pfam (http://pfam.xfam.org/), and SMART (http://smart.embl-heidelberg.de/) to confirm the presence of all three conserved domains.
4.2. Sequence Analysis and Structural Characterization of PLC Genes/Proteins in Wheat
PLC family member sequences were submitted to ExPASy (https://web.expasy.org/protparam/) to calculate the number of amino acids, molecular weight, theoretical isoelectric point (pI), and the grand average of hydrophobicity (GRAVY) of each protein [45]. MEME (http://meme-suite.org/tools/meme) was used to identify conserved domains with motifs = 10 [46]. The EvolView online tool (http://www.evolgenius.info/evolview/#login) was used to compare the predicted coding sequence (CDS) with the corresponding genomic sequence to detect the exon/intron distribution of the corresponding TaPLC genes [47].
4.3. Phylogenetic Distribution, Chromosome Location, and Gene Duplication Analyses
Phylogenetic analysis was performed using the protein sequences of rice, Arabidopsis, orchid, cotton, maize, and the newly identified TaPLCs (Table S1). MEGA7 software was used to perform multiple amino acid alignments of the sequences, with a bootstrap value of 1000 to construct a rootless phylogenetic tree by neighbor-joining (NJ) [48,49].
We used Map Gene 2 chromosome v 2 (MG2C) (http://mg2c.iask.in/mg2c_v2.0/?tdsourcetag=s_pcqq_aiomsg) to generate the map showing the position of the TaPLC genes in the chromosomes. To identify duplicated gene pairs, we defined gene duplication according to the following criteria [50]: (1) the alignable nucleotide sequence covered was >70% of the longer aligned gene, and (2) the aligned region had an identity >70%. The duplicated gene pairs were visualized using circle diagram. Non-synonymous (Ka) and synonymous (Ks) values were calculated by TBtools software [51].
4.4. Analysis of Cis-Acting Elements in TaPLC Genes’ Promoters
The upstream sequences (2000 bp) of the TaPLC coding sequences (CDS) were retrieved from PLAZA and submitted to PlantCARE (http://bioinformatics.psb.ugent.be/webtools/plantcare/html/) to identify cis-acting element. The Gene Structure Display Server (http://gsds.cbi.pku.edu.cn/) was used to draw diagrams [52].
4.5. RNA-Sequencing (RNA-seq) Data Analysis of PLC Genes
RNA-seq data for seven different abiotic stress, tissues, and organs (root, stem, leaf, spike, grain, embryo, endosperm) were obtained from the gene expression site of Chinese spring (http://202.194.139.32/expression/index.html?tdsourcetag=s_pcqq_aiomsg) and used to study the expression patterns of TaPLCs. Cluster analysis of the data was performed using TBtools software to generate heatmaps.
4.6. Plant Materials and Abiotic Stress Treatments
Common wheat (Triticum aestivum L., AABBDD, 2n = 6x = 42) Chinese spring (CS) was used as experimental material. Seeds with the same degree of fullness were selected for disinfection (70% alcohol for 1 min, 10% NaClO for 10 min, then washed by sterilized water 3 times). The sterilized seeds were placed on moistened filter paper in a sterile Petri dish and germinated in the dark for 48 h (25 °C). Seedlings were cultured with 16/8 h light, 25/20 °C temperature, and 70% relative humidity. The seedlings (15 days after germination) were cultured to two leaves. Salt stress was administered with 200mM sodium chloride (NaCl) and drought was simulated by treatment with 20% polyethylene glycol (PEG6000) [53]. The seedlings were incubated at 4 °C for low temperature stress. The leaves of the control and treatment groups were collected at 0, 2, 6, 12, and 24 h (Three duplicate samples were taken for each period.), immediately frozen with liquid nitrogen, and stored at −80 °C until RNA extraction.
4.7. Total RNA Extraction and Expression Analyses of Wheat PLC Genes
Oligo7 was used to design RT-PCR primers for TaPLC genes. Total RNA was extracted using the plant total RNA extraction kit (TIANGEN, Beijing, China). The cDNA was synthesized with a First Strand cDNA Synthesis Kit (TIANGEN, Beijing, China). 18S RNA was used as the internal reference gene [28], and the specific primer sequences of each gene are shown in Table S4. Reactions of 20 µL contained 2× Super-Real Mix 10 µL, 50× ROXII; 2 µL, forward and reverse primers 1 µl for each, cDNA 2µL, and ddH2O 4 µL. Reaction conditions included pre-denaturation at 95 °C for 15 min, denaturation at 95 °C for 10 s, annealing at 60 °C for 32 s, and 40 cycles. Three biological replicates and three technical replicates were applied for all qPCR analyses in this study. The 2-ΔΔCT method was used to calculate relative gene expression. Software SPSS 19 was used for significance analysis and standard deviation calculation.
4.8. Generation of Transgenic Plants
The TaPI-PLC1-2B CDS was amplified through PCR using primers TaPI-PLC1-2B-C, and subsequently cloned into the PBI121 plant expression vector harboring the ubi promoter. Arabidopsis Columbia-0 was used to generate TaPI-PLC1-2B transgenic plants. Seedlings were cultured on half-strength Murashige and Skoog (MS) medium with 16/8 h light, 22/20 °C temperature, and 70% relative humidity. Salt stress was treated with 200 mM NaCl and drought was simulated by treatment with 200 mM mannitol [54]. Mannitol and NaCl were added directly to the MS medium. The transformation of the obtained recombinant vector into wild type (WT) Arabidopsis was performed via an Agrobacterium tumefaciens (Strain GV3101) mediated floral-dip method [55]. The transgenic plants were screened by using 50mg/L kanamycin [56].
5. Conclusions
In this study, we successfully performed a genome-wide analysis of the PLC family genes in wheat. 26 TaPLC genes in two subfamilies (TaPI-PLC and TaNPC) were identified in the genome of wheat. Both PI-PLC and NPC gene sequences showed high conservation as well as significant differences in wheat. Moreover, the 26 wheat PLC genes had different types and numbers of cis-regulatory elements in their respective promoters, consistent with their unique expression patterns in specific tissues and under different abiotic stresses. Through the analysis of the expression levels of some TaPLC gene family members under salt, drought, and low temperature stress, it was found that the PLC family members responded to the three abiotic stresses, especially salt stress. Furthermore, the TaPI-PLC1-2B gene was further studied and its overexpression vector was constructed and transferred to Arabidopsis for functional verification. The results showed that the TaPI-PLC1-2B transgenic seedlings had significantly improved resistance to salt stress and drought stress, and the primary root of P1-OE was significantly longer than that of the wild type. These results provide a solid basis for further investigation of biological functions of wheat PLC genes.
Supplementary Materials
The following are available online at https://www.mdpi.com/2223-7747/9/7/885/s1, Figure S1: The TaPLC families motifs, Table S1: The IDs of PLC genes from Arabidopsis, soybean, rice, cotton, maize and Orchid, Table S2: The homologous TaPLC genes in wheat A, B and D sub-genomes and the Duplicated genes pairs identified in wheat, Table S3: Orthologous PLC gene pairs between wheat and rice, Table S4: Specific primers used for qRT-PCR analysis.
Author Contributions
Conceptualization, X.W., M.Y.; methodology, X.W., Y.L., Z.L., J.Z.; validation, X.W., M.Y.; formal analysis, X.W.; investigation, X.W., J.Z., L.Z.; resources, X.G., J.D., M.Y.; writing—original draft preparation, X.W.; writing—review and editing, M.Y., L.S.T., D.M.W.; supervision, X.G., M.Y.; funding acquisition, X.G., J.D., M.Y. All authors have read and agreed to the published version of the manuscript.
Funding
This work was supported by grants from China agricultural research system (CARS-3-2-47). Fundamental Research Funds for the Central Universities (Z109021623), Chinese postdoctoral science foundation (2016M602871). The funders had no role in study design, data collection and analysis, decision to publish, or preparation of the manuscript.
Conflicts of Interest
The authors declare that there have no conflicts of interest.
References
- Boss, W.F.; Im, Y.J. Phosphoinositide signaling. Annu. Rev. Plant Biol. 2012, 63, 409–429. [Google Scholar] [CrossRef]
- Bhati, K.K.; Aggarwal, S.; Sharma, S.; Mantri, S.; Singh, S.P.; Bhalla, S.; Kaur, J.; Tiwari, S.; Roy, J.K.; Tuli, R.; et al. Differential expression of structural genes for the late phase of phytic acid biosynthesis in developing seeds of wheat (Triticum aestivum L.). Plant Sci. 2014, 224, 74–85. [Google Scholar] [CrossRef] [PubMed]
- Zhang, B.; Wang, Y.; Liu, J.Y. Genome-wide identification and characterization of phospholipase C gene family in cotton (Gossypium spp.). Sci. China Life Sci. 2018, 61, 88–99. [Google Scholar] [CrossRef]
- Hong, Y.; Zhao, J.; Guo, L.; Kim, S.C.; Deng, X.; Wang, G.; Zhang, G.; Li, M.; Wang, X. Plant phospholipases D and C and their diverse functions in stress responses. Prog. Lipid Res. 2016, 62, 55–74. [Google Scholar] [CrossRef]
- Singh, A.; Kanwar, P.; Pandey, A.; Tyagi, A.K.; Sopory, S.K.; Kapoor, S.; Pandey, G.K. Comprehensive genomic analysis and expression profiling of phospholipase C gene family during abiotic stresses and development in rice. PLoS ONE 2013, 8, e62494. [Google Scholar] [CrossRef] [PubMed]
- Pokotylo, I.; Kolesnikov, Y.; Kravets, V.; Zachowski, A.; Ruelland, E. Plant phosphoinositide-dependent phospholipases C: Variations around a canonical theme. Biochimie 2014, 96, 144–157. [Google Scholar] [CrossRef] [PubMed]
- Rupwate, S.D.; Rajasekharan, R. Plant phosphoinositide-specific phospholipase C: An insight. Plant Signal. Behav. 2012, 7, 1281–1283. [Google Scholar] [CrossRef] [PubMed]
- Aggarwal, S.; Shukla, V.; Bhati, K.K.; Kaur, M.; Sharma, S.; Singh, A.; Mantri, S.; Pandey, A.K. Hormonal Regulation and Expression Profiles of Wheat Genes Involved during Phytic Acid Biosynthesis Pathway. Plants 2015, 4, 298–319. [Google Scholar] [CrossRef]
- Peters, C.; Li, M.; Narasimhan, R.; Roth, M.; Welti, R.; Wang, X. Nonspecific phospholipase C NPC4 promotes responses to abscisic acid and tolerance to hyperosmotic stress in Arabidopsis. Plant Cell 2010, 22, 2642–2659. [Google Scholar] [CrossRef]
- Song, J.; Zhou, Y.; Zhang, J.; Zhang, K. Structural, expression and evolutionary analysis of the non-specific phospholipase C gene family in Gossypium hirsutum. BMC Genom. 2017, 18, 979. [Google Scholar] [CrossRef]
- Molano, E.P.L.; Cabrera, O.G.; José, J.; Nascimento, L.C.D.; Carazzolle, M.F.; Teixeira, P.J.; Álvarez, J.; Tiburcio, R.A.; Filho, P.M.T.; Lima, G.; et al. Ceratocystis cacaofunesta genome analysis reveals a large expansion of extracellular phosphatidylinositol-specific phospholipase-C genes (PI-PLC). BMC Genom. 2018, 19, 58. [Google Scholar] [CrossRef] [PubMed]
- Pokotylo, I.; Pejchar, P.; Potocky, M.; Kocourkova, D.; Krckova, Z.; Ruelland, E.; Kravets, V.; Martinec, J. The plant non-specific phospholipase C gene family. Novel competitors in lipid signalling. Prog. Lipid Res. 2013, 52, 62–79. [Google Scholar] [CrossRef] [PubMed]
- Munnik, T.; Testerink, C. Plant phospholipid signaling: “In a nutshell”. J. Lipid Res. 2009, 50, S260–S265. [Google Scholar] [CrossRef]
- Apostolakos, P.; Panteris, E.; Galatis, B. The involvement of phospholipases C and D in the asymmetric division of subsidiary cell mother cells of Zea mays. Cell. Motil. Cytoskeleton 2008, 65, 863–875. [Google Scholar] [CrossRef] [PubMed]
- Wang, F.; Deng, Y.; Zhou, Y.; Dong, J.; Chen, H.; Dong, Y.; Wang, N.; Li, X.; Li, H. Genome-Wide Analysis and Expression Profiling of the Phospholipase C Gene Family in Soybean (Glycine max). PLoS ONE 2015, 10, e0138467. [Google Scholar] [CrossRef] [PubMed]
- Song, F. Molecular cloning and characterization of a rice phosphoinositide-specific phospholipase C gene, OsPI-PLC1, that is activated in systemic acquired resistance. Physiol. Mol. Plant Pathol. 2002, 61, 31–40. [Google Scholar]
- Takahashi, S.; Katagiri, T.; Hirayama, T.; Shinozaki, K. Hyperosmotic Stress Induces a Rapid and Transient Increase in Inositol 1,4,5-Trisphosphate Independent of Abscisic Acid in Arabidopsis Cell Culture. Plant Cell Physiol. 2001, 42, 214–222. [Google Scholar] [CrossRef] [PubMed]
- Kanehara, K.; Yu, C.Y.; Cho, Y.; Cheong, W.F.; Torta, F.; Shui, G.; Wenk, M.R.; Nakamura, Y. Arabidopsis AtPLC2 Is a Primary Phosphoinositide-Specific Phospholipase C in Phosphoinositide Metabolism and the Endoplasmic Reticulum Stress Response. PLoS Genet. 2015, 11, e1005511. [Google Scholar] [CrossRef] [PubMed]
- Li, L.; He, Y.; Wang, Y.; Zhao, S.; Chen, X.; Ye, T.; Wu, Y. Arabidopsis PLC2 is involved in auxin-modulated reproductive development. Plant J. 2015, 84, 504–515. [Google Scholar] [CrossRef]
- Zheng, S.Z.; Liu, Y.L.; Li, B.; Shang, Z.L.; Zhou, R.G.; Sun, D.Y. Phosphoinositide-specific phospholipase C9 is involved in the thermotolerance of Arabidopsis. Plant J. 2012, 69, 689–700. [Google Scholar] [CrossRef]
- Gao, K.; Liu, Y.L.; Li, B.; Zhou, R.G.; Sun, D.Y.; Zheng, S.Z. Arabidopsis thaliana phosphoinositide-specific phospholipase C isoform 3 (AtPLC3) and AtPLC9 have an additive effect on thermotolerance. Plant Cell Physiol. 2014, 55, 1873–1883. [Google Scholar] [CrossRef] [PubMed]
- Zhang, J.; Xia, K.; Yang, Y.; Yang, H. Overexpression of Arabidopsis phosphoinositide-specific phospholipase C5 induces leaf senescence. Plant Cell Tissue Organ Cult. (PCTOC) 2014, 120, 585–595. [Google Scholar] [CrossRef]
- Munnik, T.; Vermeer, J.E. Osmotic stress-induced phosphoinositide and inositol phosphate signalling in plants. Plant Cell Environ. 2010, 33, 655–669. [Google Scholar] [CrossRef] [PubMed]
- Chua, N.H.; Sanchez, J.P. Arabidopsis PLC1 Is Required for Secondary Responses to Abscisic Acid Signals. Plant Cell 2001, 13, 1143–1154. [Google Scholar] [CrossRef][Green Version]
- Nokhrina, K.; Ray, H.; Bock, C.; Georges, F. Metabolomic shifts in Brassica napus lines with enhanced BnPLC2 expression impact their response to low temperature stress and plant pathogens. GM Crops Food 2014, 5, 120–131. [Google Scholar] [CrossRef][Green Version]
- Das, S.; Hussain, A.; Bock, C.; Keller, W.A.; Georges, F. Cloning of Brassica napus phospholipase C2 (BnPLC2), phosphatidylinositol 3-kinase (BnVPS34) and phosphatidylinositol synthase1 (BnPtdIns S1)—Comparative analysis of the effect of abiotic stresses on the expression of phosphatidylinositol signal transduction-related genes in B. napus. Planta 2005, 220, 777–784. [Google Scholar] [CrossRef]
- Apone, F.; Alyeshmerni, N.; Wiens, K.; Chalmers, D.; Chrispeels, M.J.; Colucci, G. The G-protein-coupled receptor GCR1 regulates DNA synthesis through activation of phosphatidylinositol-specific phospholipase C. Plant Physiol. 2003, 133, 571–579. [Google Scholar] [CrossRef] [PubMed]
- Zhang, K.; Jin, C.; Wu, L.; Hou, M.; Dou, S.; Pan, Y.J. Expression Analysis of a Stress-Related Phosphoinositide-Specific Phospholipase C Gene in Wheat (Triticum aestivum L.). PLoS ONE 2014, 9, e105061. [Google Scholar] [CrossRef]
- Song, M.; Liu, S.; Zhou, Z.; Han, Y. TfPLC1, a gene encoding phosphoinositide-specific phospholipase C, is predominantly expressed in reproductive organs in Torenia fournieri. Sex. Plant Reprod. 2008, 21, 259–267. [Google Scholar] [CrossRef]
- Pan, Y.Y.; Wang, X.; Ma, L.G.; Sun, D.Y. Characterization of phosphatidylinositol-specific phospholipase C (PI-PLC) from Lilium daviddi pollen. Plant Cell Physiol. 2005, 46, 1657–1665. [Google Scholar] [CrossRef][Green Version]
- Lin, W.H.; Ye, R.; Ma, H.; Xu, Z.H.; Xue, H.W. DNA chip-based expression profile analysis indicates involvement of the phosphatidylinositol signaling pathway in multiple plant responses to hormone and abiotic treatments. Cell Res. 2004, 1, 38–49. [Google Scholar] [CrossRef] [PubMed]
- Guo, X.J.; Wang, J.R. Global identification, structural analysis and expression characterization of bHLH transcription factors in wheat. BMC Plant Biol. 2017, 17, 90–102. [Google Scholar] [CrossRef]
- Michael, A.; Jane, R.; Thomas, L.; Raphaël, F.; Françoise, A.; Cyril, P.; Nacer, M.; Sophie, D.; Erik, K. Linking the International Wheat Genome Sequencing Consortium bread wheat reference genome sequence to wheat genetic and phenomic data. Genome Biol. 2018, 19, 111. [Google Scholar] [CrossRef]
- Panchy, N.; Lehti-Shiu, M.D.; Shiu, S.H. Evolution of gene duplication in plants. Plant Physiol. 2016, 00523–02016. [Google Scholar] [CrossRef]
- Tasma, I.M.; Brendel, V.; Whitham, S.A.; Bhattacharyya, M.K. Expression and evolution of the phosphoinositide-specific phospholipase C gene family in Arabidopsis thaliana. Plant Physiol. Biochem. 2008, 46, 627–637. [Google Scholar] [CrossRef]
- Kosová, K.; Vítámvás, P.; Prášil, I.T.; Renaut, J. Plant proteome changes under abiotic stress—Contribution of proteomics studies to understanding plant stress response. J. Proteom. 2011, 74, 1301–1322. [Google Scholar] [CrossRef]
- Gaude, N.; Nakamura, Y.; Scheible, W.R.; Ohta, H.; Dormann, P. Phospholipase C5 (NPC5) is involved in galactolipid accumulation during phosphate limitation in leaves of Arabidopsis. Plant J. 2008, 56, 28–39. [Google Scholar] [CrossRef]
- Shi, M.; Zhou, L.; Zhao, L.; Shang, M.; Huang, Y.J. Csseverin inhibits apoptosis through mitochondria-mediated pathways triggered by Ca2 + dyshomeostasis in hepatocarcinoma PLC cells. PLoS Negl. Trop. Dis. 2017, 11, e0006074. [Google Scholar] [CrossRef]
- Xia, L.; Liang, H.; Xu, L.; Chen, J.J. Subcellular localization and function study of a secreted phospholipase C from Nocardia seriolae. FEMS Microbiol. Lett. 2017, 364, 17. [Google Scholar] [CrossRef]
- Chen, J.; Zheng, D.; Cui, H.; Liu, S.; Zhang, L.; Liu, C.J. Roles and mechanisms of TRPC3 and the PLCγ/PKC/CPI-17 signaling pathway in regulating parturition. Mol. Med. Rep. 2018, 17, 898–910. [Google Scholar] [CrossRef]
- Mahmud, H.; Scherpen, F.J.G.; Boer, T.M.D.; Lourens, H.J.; Bont, E.S. Peptide microarray profiling identifies phospholipase C gamma 1 (PLC-γ1) as a potential target for t (8;21) AML. Oncotarget 2017, 8, 67344–67354. [Google Scholar] [CrossRef] [PubMed]
- Choi, J.; Kim, K.S.; Rho, H.S.; Lee, Y.H. Differential roles of the phospholipase C genes in fungal development and pathogenicity of Magnaporthe oryzae. Fungal Genet. Biol. 2011, 48, 445–455. [Google Scholar] [CrossRef] [PubMed]
- Suzuki, M.; Tanaka, K.; Kuwano, M.; Yoshida, K.T. Expression pattern of inositol phosphate-related enzymes in rice (Oryza sativa L.): Implications for the phytic acid biosynthetic pathway. Gene 2007, 405, 55–64. [Google Scholar] [CrossRef]
- Wang, C.R.; Yang, A.F.; Yue, G.D.; Gao, Q.; Yin, H.Y.; Zhang, J.R. Enhanced expression of phospholipase C 1 (ZmPLC1) improves drought tolerance in transgenic maize. Planta 2008, 227, 1127–1140. [Google Scholar] [CrossRef] [PubMed]
- Gasteiger, E.; Hoogland, C.; Gattiker, A.; Duvaud, S.E.; Wilkins, M.R.; Appel, R.D.; Bairoch, A. Protein Identification and Analysis Tools on the ExPASy Server. In The Proteomics Protocols Handbook; Walker, J.M., Ed.; Humana Press: New York, NY, USA, 2005; pp. 571–607. [Google Scholar] [CrossRef]
- Bailey, T.L.; Mikael, B.; Buske, F.A.; Martin, F.; Grant, C.E.; Luca, C.; Ren, J.; Li, W.W.; Noble, W.S. MEME Suite: Tools for motif discovery and searching. Nucleic Acids Res. 2009, 37, W202–W208. [Google Scholar] [CrossRef] [PubMed]
- Zhang, H.; Gao, S.; Lercher, M.J.; Hu, S.; Chen, W.H. EvolView, an online tool for visualizing, annotating and managing phylogenetic trees. Nucleic Acids Res. 2012, 40, W569–W572. [Google Scholar] [CrossRef]
- Saitou, N.; Nei, M.J. Evolution: The neighbor-joining method: A new method for reconstructing phylogenetic trees. Mol Biol Evol. 1987, 4, 406–425. [Google Scholar] [CrossRef]
- Sudhir, K.; Glen, S.; Koichiro, T.J. Evolution: MEGA7: Molecular Evolutionary Genetics Analysis Version 7.0 for Bigger Datasets. Mol. Biol. Evol. 2016, 33, 1870–1874. [Google Scholar] [CrossRef]
- Zhao, P.; Wang, D.; Wang, R.; Kong, N.; Zhang, C.; Yang, C.; Wu, W.; Ma, H.; Chen, Q. Genome-wide analysis of the potato Hsp20 gene family: Identification, genomic organization and expression profiles in response to heat stress. BMC Genom. 2018, 19, 61. [Google Scholar] [CrossRef]
- Chen, C.; Xia, R.; Chen, H.; He, Y. TBtools, a toolkit for biologists integrating various HTS-data handling tools with a user-friendly interface. bioRxiv 2018. [Google Scholar] [CrossRef]
- Hu, B.; Jin, J.; Guo, A.Y.; Zhang, H.; Luo, J.; Gao, G. GSDS 2.0: An upgraded gene feature visualization server. Bioinformatics 2014, 31, 296–1297. [Google Scholar] [CrossRef] [PubMed]
- Han, Z.; Liu, Y.; Deng, X.; Liu, D.; Liu, Y.; Hu, Y.; Yan, Y. Genome-wide identification and expression analysis of expansin gene family in common wheat (Triticum aestivum L.). BMC Genom. 2019, 20, 101. [Google Scholar] [CrossRef] [PubMed]
- Xia, K.; Wang, B.; Zhang, J.; Li, Y.; Yang, H.; Ren, D. Arabidopsis phosphoinositide-specific phospholipase C 4 negatively regulates seedling salt tolerance. Plant Cell Environ. 2017, 40, 1317–1331. [Google Scholar] [CrossRef]
- Clough, S.J.; Bent, A.F. Floral dip: A simplified method for Agrobacterium-mediated transformation of Arabidopsis thaliana. Plant J. 1998, 16, 735–743. [Google Scholar] [CrossRef]
- Zhao, Y.; Ma, R.; Xu, D.; Bi, H.; Xia, Z.; Peng, H. Genome-Wide Identification and Analysis of the AP2 Transcription Factor Gene Family in Wheat (Triticum aestivum L.). Front. Plant Sci. 2019, 10, 1286. [Google Scholar] [CrossRef]


© 2020 by the authors. Licensee MDPI, Basel, Switzerland. This article is an open access article distributed under the terms and conditions of the Creative Commons Attribution (CC BY) license (http://creativecommons.org/licenses/by/4.0/).