Abstract
Here, we investigate whether England’s 152 local flood risk management strategies (LFRMSs) satisfy minimal legislative criteria and address the growing surface water flood (SWF) risk caused by climate change. A systematic audit was used to assess the alignment of the LFRMSs with national climate change legislation and other relevant national strategies. An objective method to identify inclusion of a range of factors that good strategies should include was applied. LFRMSs are mostly meeting their minimum statutory requirements. However, there is a widespread issue across most LFRMSs regarding inadequate consideration of increasing SWF risk from climate changes, which highlights the need for enhanced LFRMSs by improved planning and climate change adaptation plans. There is some evidence of good practice within the LFRMS portfolio, which is discussed in the context of the ongoing LFRMS update process. Beyond England, there are implications for developing FRM processes at a local level that can be objectively assessed against national requirements. Communities in England face inadequately managed SWF risk in the future because of the range in plan quality across the LFRMSs. This research contributes to the ongoing examination of the full suite of 152 LFRMSs and, therefore, builds towards a complete assessment of the SWF management approach in England. This will help inform local climate change adaptation strategies that cater to the escalating threat of SWF due to climate change.
1. Introduction
1.1. Background to the UK’s Complex Flood Risk Management Framework and Study Rationale
The major UK summer floods in 2007 led to over 46,000 homes and up to 6000 businesses being flooded, and around £3 billion in insurance claims [1,2]. The scale of the flood impacts led to the commissioning of the Pitt Review, which aimed to learn lessons from the 2007 flood events and make a series of recommendations to improve flood risk management approaches. The eventual Pitt recommendations, amongst many other things, called for greater national coordination of flood risk management via a “unifying Act” alongside enhanced local responsibilities to manage flood risk [3]. However, and as summarised by [4], the subsequent Flood and Water Management Act 2010 ([5]; hereafter F&WMA2010) failed to deliver on the unifying Act recommendation and, rather, addressed only the “immediate legislative requirements” [6]. In this context, the flood risk management (FRM i.e., any actions that: reduce the likelihood of a flood occurring; reduce the scale of a flood; or reduce the magnitude of the damage that a flood creates) framework in England (note that the devolved administrations in Northern Island, Scotland, and Wales have a responsibility for flood risk management in their respective nations but this analysis considers England only) that followed the F&WMA2010 is determined by a suite of overlapping legislation, strategies, plans, and guidance that each cover different spatial areas, timeframes, and sources of flooding (i.e., river, coastal, surface water, and groundwater), which is summarised in Table 1.

Table 1.
A summary of the most relevant acts, plans, or strategies (including those that cascade from primary legislation) that define the approach to flood risk management in England, with a particular focus on surface water flooding. Risk management authorities, as defined in the F&WMA2010, are included in the second column in italics. Plans that cascade out of primary legislation are included in bold in the second column. Some organisations have changed their names since they were given certain powers—only the current names are used here.
The F&WMA2010 failure, therefore, has allowed certain areas of flood risk management to slip through the cracks of the resultant policy framework. It is argued here that this happened to surface water flood (i.e., flooding caused by the slow drainage of rainwater by sewer systems or the natural environment) risk, and the analysis of the resultant inadequate management of SWF is the focus of the present study.
1.2. Further Complications from Climate Change Legislation and Actions
Alongside the F&WMA2010, England also has a separate framework for addressing climate change risks. The Climate Change Act 2008 ([7]; hereafter CCA2008) set out a process of assessing climate change risks every 5 years (known as the Climate Change Risk Assessment, or CCRA) and of responding to the CCRA risk within a National Adaptation Programme (NAP). Flood risks are a major part of the CCRA and, therefore, should be addressed in NAP with adequate plans to manage those risks. The CCA2008 also set up a statutory, independent body—the Committee on Climate Change (CCC)—to report every 2 years on progress towards adequate risk management.
1.3. The General Problem: Unclear Risk Ownership and Stakeholder Engagement
Within all this legislation, the most central element of the FRM framework is the National Flood and Coastal Erosion Risk Management (FCERM) Strategy [8], which was updated and significantly improved [9] in 2020 as compared to the original 2011 version. The F&WMA2010 dictates that the Environment Agency must provide a “strategic overview” for all risk management authorities which includes Lead Local Flood Authorities (LLFAs), district councils, relevant highways agencies, internal drainage boards, and water companies. However, the agency, as outlined above, does not directly manage the activities of those risk management authorities. This is particularly relevant as the agency has taken an integrated FRM (e.g., [10]) approach to the strategy, which relies on all stakeholders acting in line with the overarching strategy. Therefore, as good as the national strategy may be, it still cannot address the failure of the F&WMA2010 to unify the FRM approaches of different risk management authorities, or stakeholders, who can choose to act on different spatiotemporal scales and in different ways with differing levels of commitment.
1.4. The Specific Problem: Surface Water Flood Risk Management
Whilst such a ‘patchwork’ framework to FRM is not necessarily a poor approach, it has been highlighted by England’s statutory climate change adaptation advisor—the Committee on Climate Change—that some elements of FRM have no clear strategy because of this structure [11]. This particularly applies to surface water flooding (SWF), as there are many different actors involved. The analysis of the potential “policy gap” (i.e., the difference between risk magnitude and the magnitude of risk that could be managed by the planned SWF interventions) is, therefore, the focus of this paper.
This SWF issue arises because of the framing of the F&WMA2010, which gives the Environment Agency responsibility for developing a national Flood and Coastal Erosion Risk Management (FCERM) Strategy. However, as per the Water Resources Act (1991), the Environment Agency only has the authority to manage flood risk from main rivers and the sea, while the F&WMA2010 gives responsibility for developing strategies for SWF risk management to England’s 152 LLFAs (Figure 1). The LLFAs were provided with guidance for developing their local flood risk management strategies [12] and tools to assess future changes in flood risk [13], and given a requirement within the F&WMA2010 that their strategies should be consistent with the National FCERM Strategy. The division of strategic development means that SWF risks have been assessed and addressed in different ways across England’s LLFAs.
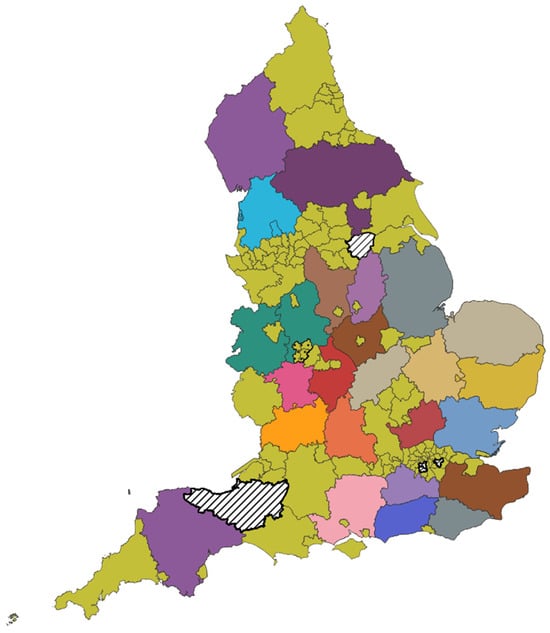
Figure 1.
Map of the 152 LLFAs in England. Light green areas indicate where an LLFA aligns with a local authority, and other colours indicate where an LLFA aligns with a different type of authority (most commonly a county council). The LFRMSs that were unavailable for this analysis (see Section 2.3 are indicated by hatching. LFRMSs that cover more than one LLFA are indicated by stippling for the 4 local authorities that combined their LFRMS (Dudley, Sandwell, Walsall, and Wolverhampton) and common colours where local authorities and county councils combined their LFRMS (light blue for Blackpool, Blackburn with Darwen, and Lancashire in the north west; and dark green for Shropshire and Staffordshire in the west midlands).
Again, this does not necessarily mean that there is an inadequate approach to SWF risk management. In fact, place-based planning could be beneficial to address the spatial variability in risk. However, it has meant that, to date, the CCC has not fully assessed England’s strategy for SWF risk management, which the CCC has a statutory responsibility to do, because there is no clear, overarching articulation of the approach or a complete compilation of the LLFA actions. In other words, it is not straightforward to define and assess adaptation planning and progress that is spread across 152 LLFA strategies [9]. The CCC has referred to [14], who identified that only 55 of the 90 LFRMSs available at that time included a cost–benefit analysis of proposed actions and that 35 of the 90 LFRMSs did not specify when or how actions would take place, both factors required by the F&WMA2010 [15]. Furthermore, and because of the delegation of responsibility for SWF risk management to the LLFAs, the CCC raised the criticism that the impact of climate change on SWF risk was not properly addressed in the National Adaptation Programme, as it should be under the CCA2008 [11]. In response to this CCC assessment, the government disputed that climate change was not considered concerning SWF, but the response did not point to any analysis or evidence that such considerations existed in the LLFA strategies [16]. Instead, the government referred to the Surface Water Management Action Plan [17] as addressing this, which the CCC had already assessed as containing no actions that directly aim to reduce the risk of SWF (although it does note the potential and practical risk and asset ownership issues that have been discussed here).
In addition to the [14] assessment of LFRMSs, ref. [4] have also assessed a sub-set (n = 43) of the strategy documents for the 81 LLFAs that had published an LFRMS at the time of their research. Their analysis focused on the legal requirements for the strategies, as dictated by the F&WMA2010, and on implementation criteria outlined by the Local Government Association [12]. The authors developed 16 evaluation criteria to test alignment with the F&WMA2010 and Local Government Association guidance, and these were assessed on a 3-point “scorecard” scale based on [18]. The key result from the analysis was that the 43 LLFAs were generally producing strategies that met the minimum legal requirements. More than 75% of the strategies assessed fully met one or more of the following 5 criteria: a summary was included; risk management authorities were specified; objectives for managing flood risk were included; local flood risk was assessed; and/or a preliminary flood risk assessment was specified. However, more than 50% of the strategies assessed failed to fully meet one or more of these 6 criteria: costs and benefits of the FRM measures proposed were presented; the review process of the strategy was outlined; alignment with the Water Framework Directive is specified; contribution to the Habitats Directive is specified; the public consultation process was specified in the strategy; and/or consistency with the National FCERM Strategy is specified.
However, neither [14] or [4] directly assess the elements of climate change risk in the SWF risk management assessments or actions in the LFRMSs. Therefore, this is a key aim of the current study as this remains a gap in the literature and is an important risk.
In addition to the SWF risk management issues relating to FRM processes described above, we must also consider the scale of the SWF risk and how this is likely to increase as a result of climate change in the UK. For this, we can look to the research underpinning the UK’s 2022 climate change risk assessment [19,20], which shows that under assumptions of high population growth and a continuation of current levels of adaptation, the annual cost of expected damages from SWF would approximately double by the 2080s. This is, therefore, a major physical and social risk as well as a potential risk assessment failure point. It should be further noted that projections of the high-intensity, convective rainfall that tends to drive SWF are challenging to produce (e.g., [21]) and, therefore, the uncertainty inherent in these projections adds further urgency to the production of robust and adequate FRM plans at the local scale.
1.5. Aims and Goal
Given these issues relating to SWF risk management and climate change in England, this paper aims to develop an audit framework for local flood risk management strategies (LFRMSs) and to apply that audit framework to the published LFRMSs produced by England’s LLFAs. Our ultimate goal is to assess whether England has an adequate strategy for managing increasing surface water flood risk in a changing climate. There will be some consideration of quite general attributes of the LFRMSs but, given the work of [4,14], there will not be a detailed assessment of whether the strategies meet their requirements under the F&WMA2010.
1.6. Structure of the Paper
Section 2 describes the audit method that will be applied in this paper, with a focus on the questions that will be asked of the LFRMSs and how they will be assessed. Section 3 presents the results of the audit in terms of the scores across all LFRMSs as a whole. Section 4 will discuss the results in the context of the national FRM framework and the climate change adaptation approach in England, as well as look to individual LFRMSs for lessons to be learned and draw conclusions from the analysis.
2. Materials and Methods
In order to audit whether the LFRMSs are adequately accounting for climate change-induced risk increases and meeting certain legal requirements, a method of expert evaluation of the strategies was applied that assessed them against a mix of qualitative and quantitative criteria. This method is similar to those of [4,14], who developed their evaluation criteria from the legal requirements listed in the F&WMA2010 and the guidance points developed by the LGA [12]. However, this study will look at a range of “audit” questions that will indicate the extent to which the LFRMSs have appropriately assessed and managed local flood risk and how they are accounting for climate change.
To achieve these outcomes, the audit questions fall into 3 categories:
- Audit of the LFRMS document attributes—using the F&WMA2010 and [12] as a guide to how LFRMSs should be produced. These questions looked at the publication date, version, length, authorship, and review process. The aim here was to assess whether the process of producing the LFRMS was sound and not whether the F&WMA2010 requirements were being met.
- Audit of the LFRMS approaches. These questions used CCC assessment processes as a guide and focused in on the nature of the LFRMS objectives and measures, how the strategies are evaluated, whether they were based on a risk assessment, whether climate change factors were incorporated into the risk assessment and/or LFRMS, and whether the LFRMS were consistent with the National FCERM Strategy.
- Audit of specific terms that good LFRMSs should include—using the National FCERM Strategy [8] and CCRA [22] as a guide, these questions looked to assess the extent to which the LFRMS referred to key datasets, risks, resilience-focussed FRM approaches (i.e., not hard infrastructure defences), and legislation.
These questions were assessed in different ways, as appropriate, but all fell into these categories of metrics: year or date range; count/number; yes/no; or A/B/C scorecard grading as per [4]. The assessment of the questions, up to a point, was subjective, but to ensure consistency and accuracy as much as possible, a single researcher was used to make these assessments and a subset of the judgements were re-assessed by a second researcher to corroborate the classifications and raise any inconsistencies at multiple points in the assessment. In these subsets, the context of the assessment was also analysed to ensure that the scores are indicative of the LFRMS contents.
2.1. Specific Audit Questions
Table 2 presents the audit questions applied to the LFRMSs alongside the assessment metric. These questions were applied to all available LFRMSs, which are discussed in Section 2.3.
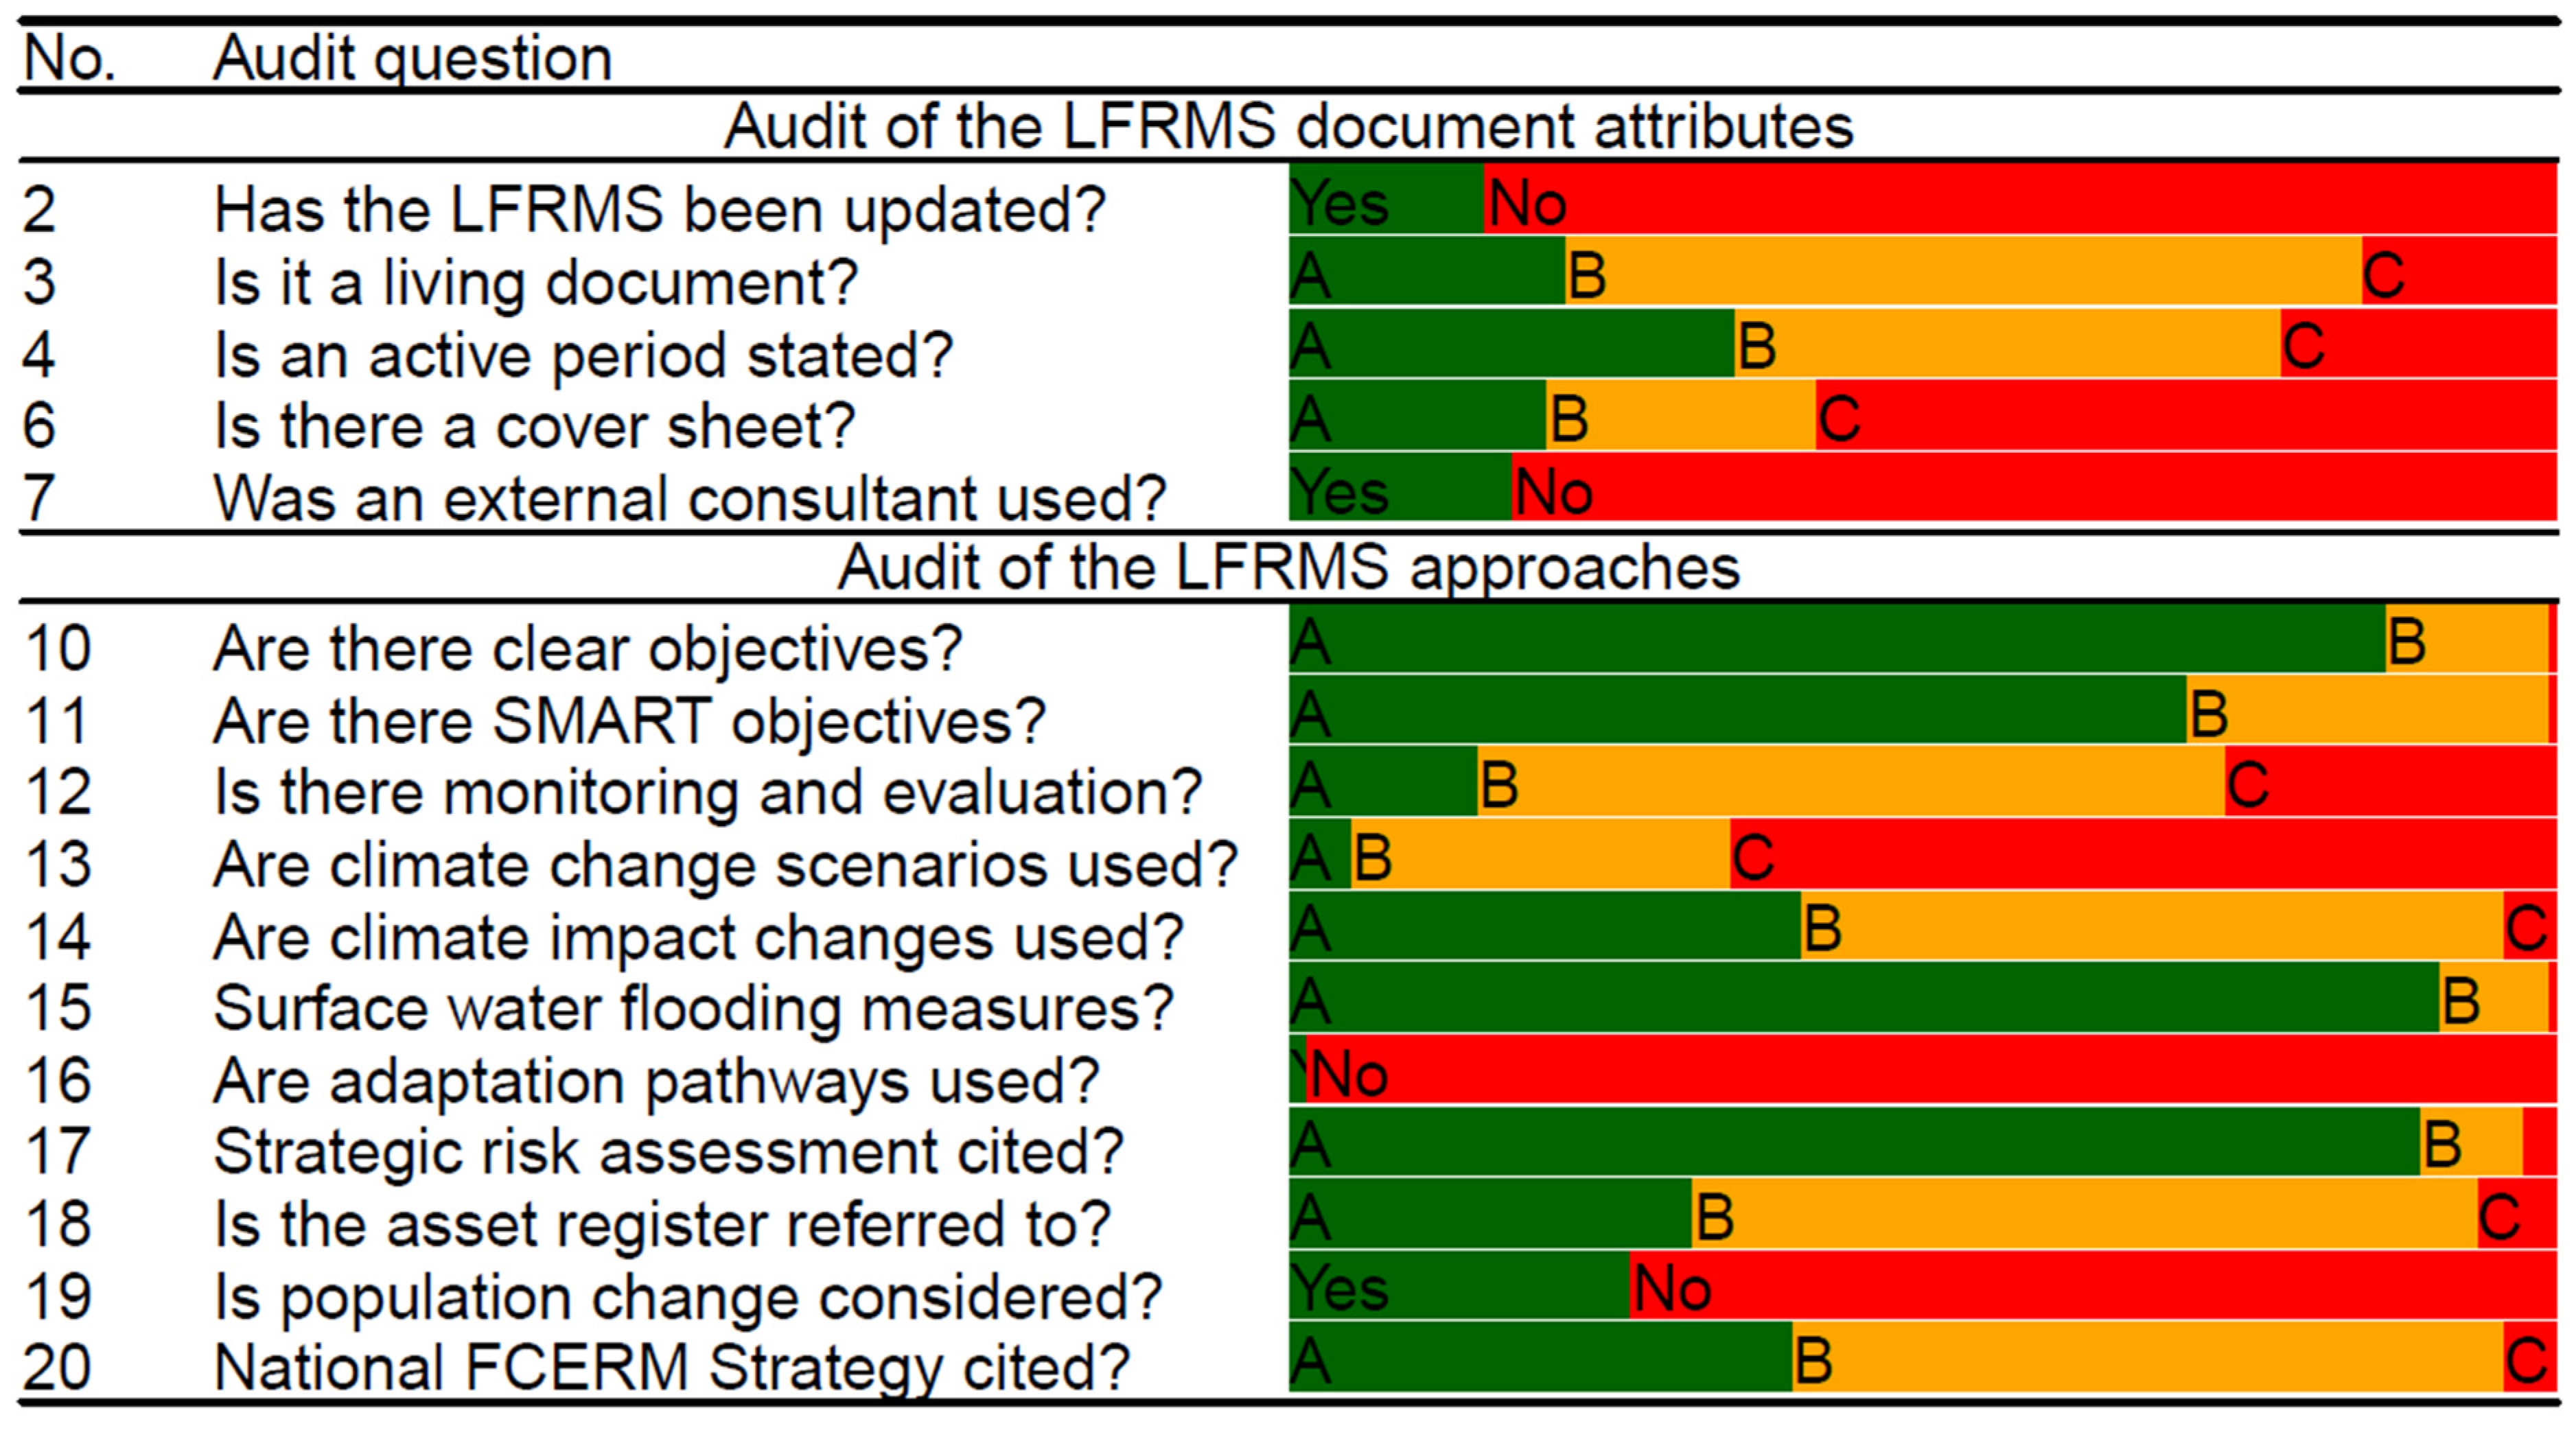
Table 2.
The specific audit questions that underpin this analysis. They are split into 3 categories, described in Section 2.1, and are presented alongside the metric by which they were assessed in this analysis.
Questions 1–7 were used to examine the relatively simple document attributes, as described in point 1 above. Questions 8–20 take a more detailed look at key LFRMS approaches, as described in point 2 above. Questions 21–25 took a direct, quantitative approach to assessing the extent to which the LFRMS refers to specific FCERM approaches and relevant datasets to support flood risk analyses, as described in point 3 above. The calibration of the “scorecard” indicators for the more in-depth questions is described in Section 2.2.
2.2. Calibrating the Audit Question “Scorecard” Indicators
Most of the indicators linked to “scorecard” questions (i.e., the questions with A, B, C responses) can be structured using a fairly simple model, e.g., A: Yes, x is outlined in detail, B: Yes, x is outlined with limited detail, C: No, x is not outlined. This applies to questions 2–4, 6, 10, 15, 17–18, and 20. Some of the audit questions, however, are more complicated yet also fundamental to the value of this analysis so they require some extra discussion.
Question 11 asks “Are the objectives SMART (specific, measurable, achievable, realistic, time-bound)?”, with the assessment criteria “A: Yes, they mostly meet the SMART criteria, B: Yes, they partially meet the SMART criteria, C: No, they are not SMART”. SMART, is widely used and understood, even in similar contexts to this analysis (e.g., [9,11]), so it is reasonable to assume that the authors of LFRMSs are likely to be aware of the concept and might apply it, knowingly or otherwise, to their plans. However, it is a concept that has been questioned [24] and it is not always defined or applied in a universal way. Given this, it is worth focusing on the way that each element was interpreted for this analysis.
- Specific, in this case, and in addition to being well-defined, concerns whether an objective or action relates to the overall aim of the LFRMS initiative, which, from the F&WMA2010, is to “manage local flood risk”. In our assessment, therefore, we looked for objectives that directly manage flood risk rather than objectives that are tangential, such as those related to operational processes or organisational structures that, while useful, don’t necessarily lead to a reduction in flood risk.
- Measurable relates to whether the objective or action is theoretically quantitatively measurable. We did not look for the metric or assessment process here (this is the focus of Question 12) but, rather, whether the objective is articulated in a way that makes it practical rather than aspirational, say.
- Achievable was approached in a broad sense: it was assessed whether the objectives or actions were within the power of the LLFA (i.e., in line with the responsibilities set out in the F&WMA2010) and if achieving the objective was broadly conceivable.
- Realistic relates to any discussion around the resources and skills available to the LLFA and whether, in board terms, these appear sufficient to meet the objectives. (Note that the R in SMART is sometimes defined as relevant but this would overlap with the definition of specific used here.)
- Time-bound is quite straightforward but important: is there a target or completion date associated with the objective or action?
Within our analysis, we placed the most emphasis on specific, measurable, and time-bound as these elements are distinct and most reliably assessed within the approach applied here. These elements are also prioritised by an analysis of how to practically use climate change risk assessments to develop an effective adaptation policy [25]. Achievable and realistic are clearly important but are more challenging to assess and overlap with the other three elements so the threshold to meet these criteria was lower.
Question 12 asks “Are the objectives accompanied by monitoring and evaluation approaches?”. This aims to identify if clear metrics and assessment processes are outlined alongside the SMART objectives discussed above.
Questions 13 and 14 looked to understand if the LFRMS discussed climate changes in a sophisticated way, with the former looking for evidence of the uncertainty of climate change projections informing the objectives and the latter looking for consideration of the impacts of specific climate risks.
All other questions have either yes/no or number assessment criteria and require no further explanation. In all cases where names have changed (e.g., Highways England to Highways Agency) or it is known that some stakeholders use different names (e.g., Property Level Resilience and Property Level Protection) we searched for all plausible terms and summed the results.
2.3. The Local Flood Risk Managements Strategies (LFRMSs)
The research team searched the relevant LLFAs’ website and/or contacted the LLFAs for their LFRMSs during January and February 2022. Of England’s 152 LLFAs, 147 had a complete LFRMS (i.e., a strategy document with an incorporated or separate action plan) that was found online or was provided via email after contacting the LLFA. It was not possible to acquire a complete LFRMS from 5 LLFAs despite multiple attempts to contact them via email and phone throughout January to March 2022. These LLFAs were Doncaster, Greenwich, Merton, Somerset, and Wandsworth.
In addition, three small groups of LLFAs had produced a joint LFRMS, these are:
- Dudley, Sandwell, Walsall, and Wolverhampton (4 LLFAs combined)
- Blackburn with Darwen, Blackpool, and Lancashire (3 LLFAs combined)
- Shropshire and Staffordshire (2 LLFAs combined)
This resulted in a total of 141 LFRMS documents that were available to be analysed, which covered 147 of the 152 LLFAs.
As mentioned above, some LFRMSs incorporated the action plan into the main document and some had it as a separate document. Where it was separate, we conducted our analysis on the main document and the separate action plan and combined the results to ensure that our analysis was examining consistent material.
3. Results
This section provides an analysis and contextualisation of selected results from the audit. The complete dataset of results, which is too large to reproduce in full here, is available on the Queen Mary Research Online [26].
3.1. LFRMS Attributes and Planning Approaches
The first section of Figure 2 shows that, in general, LFRMSs are being produced in line with guidance. A relatively small number have been updated (Q2: 22/141, 16%; Figure 3a shows the rate of publication and update of LFRMSs) but this is likely to increase following the publication of the updated National FCERM Strategy in 2020, with which LFRMSs are supposed to align.
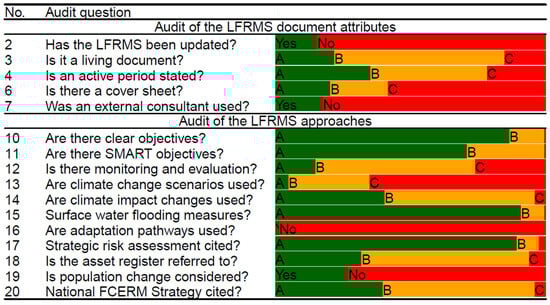
Figure 2.
A summary of the audit questions with a Yes/No (green/red) or A/B/C (green/orange/red) answer. The audit questions have been abbreviated here from the full questions included in Table 2.
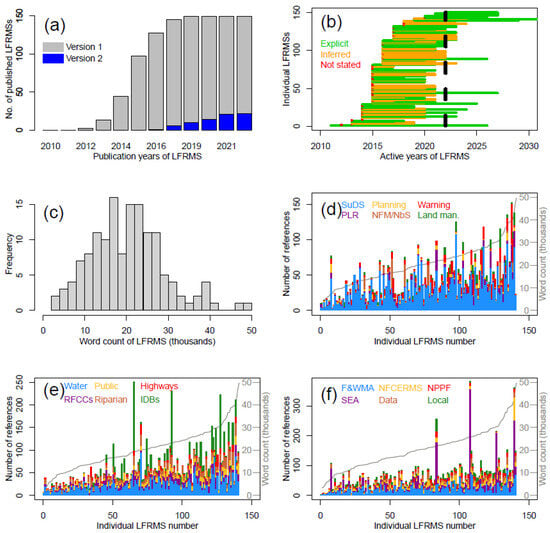
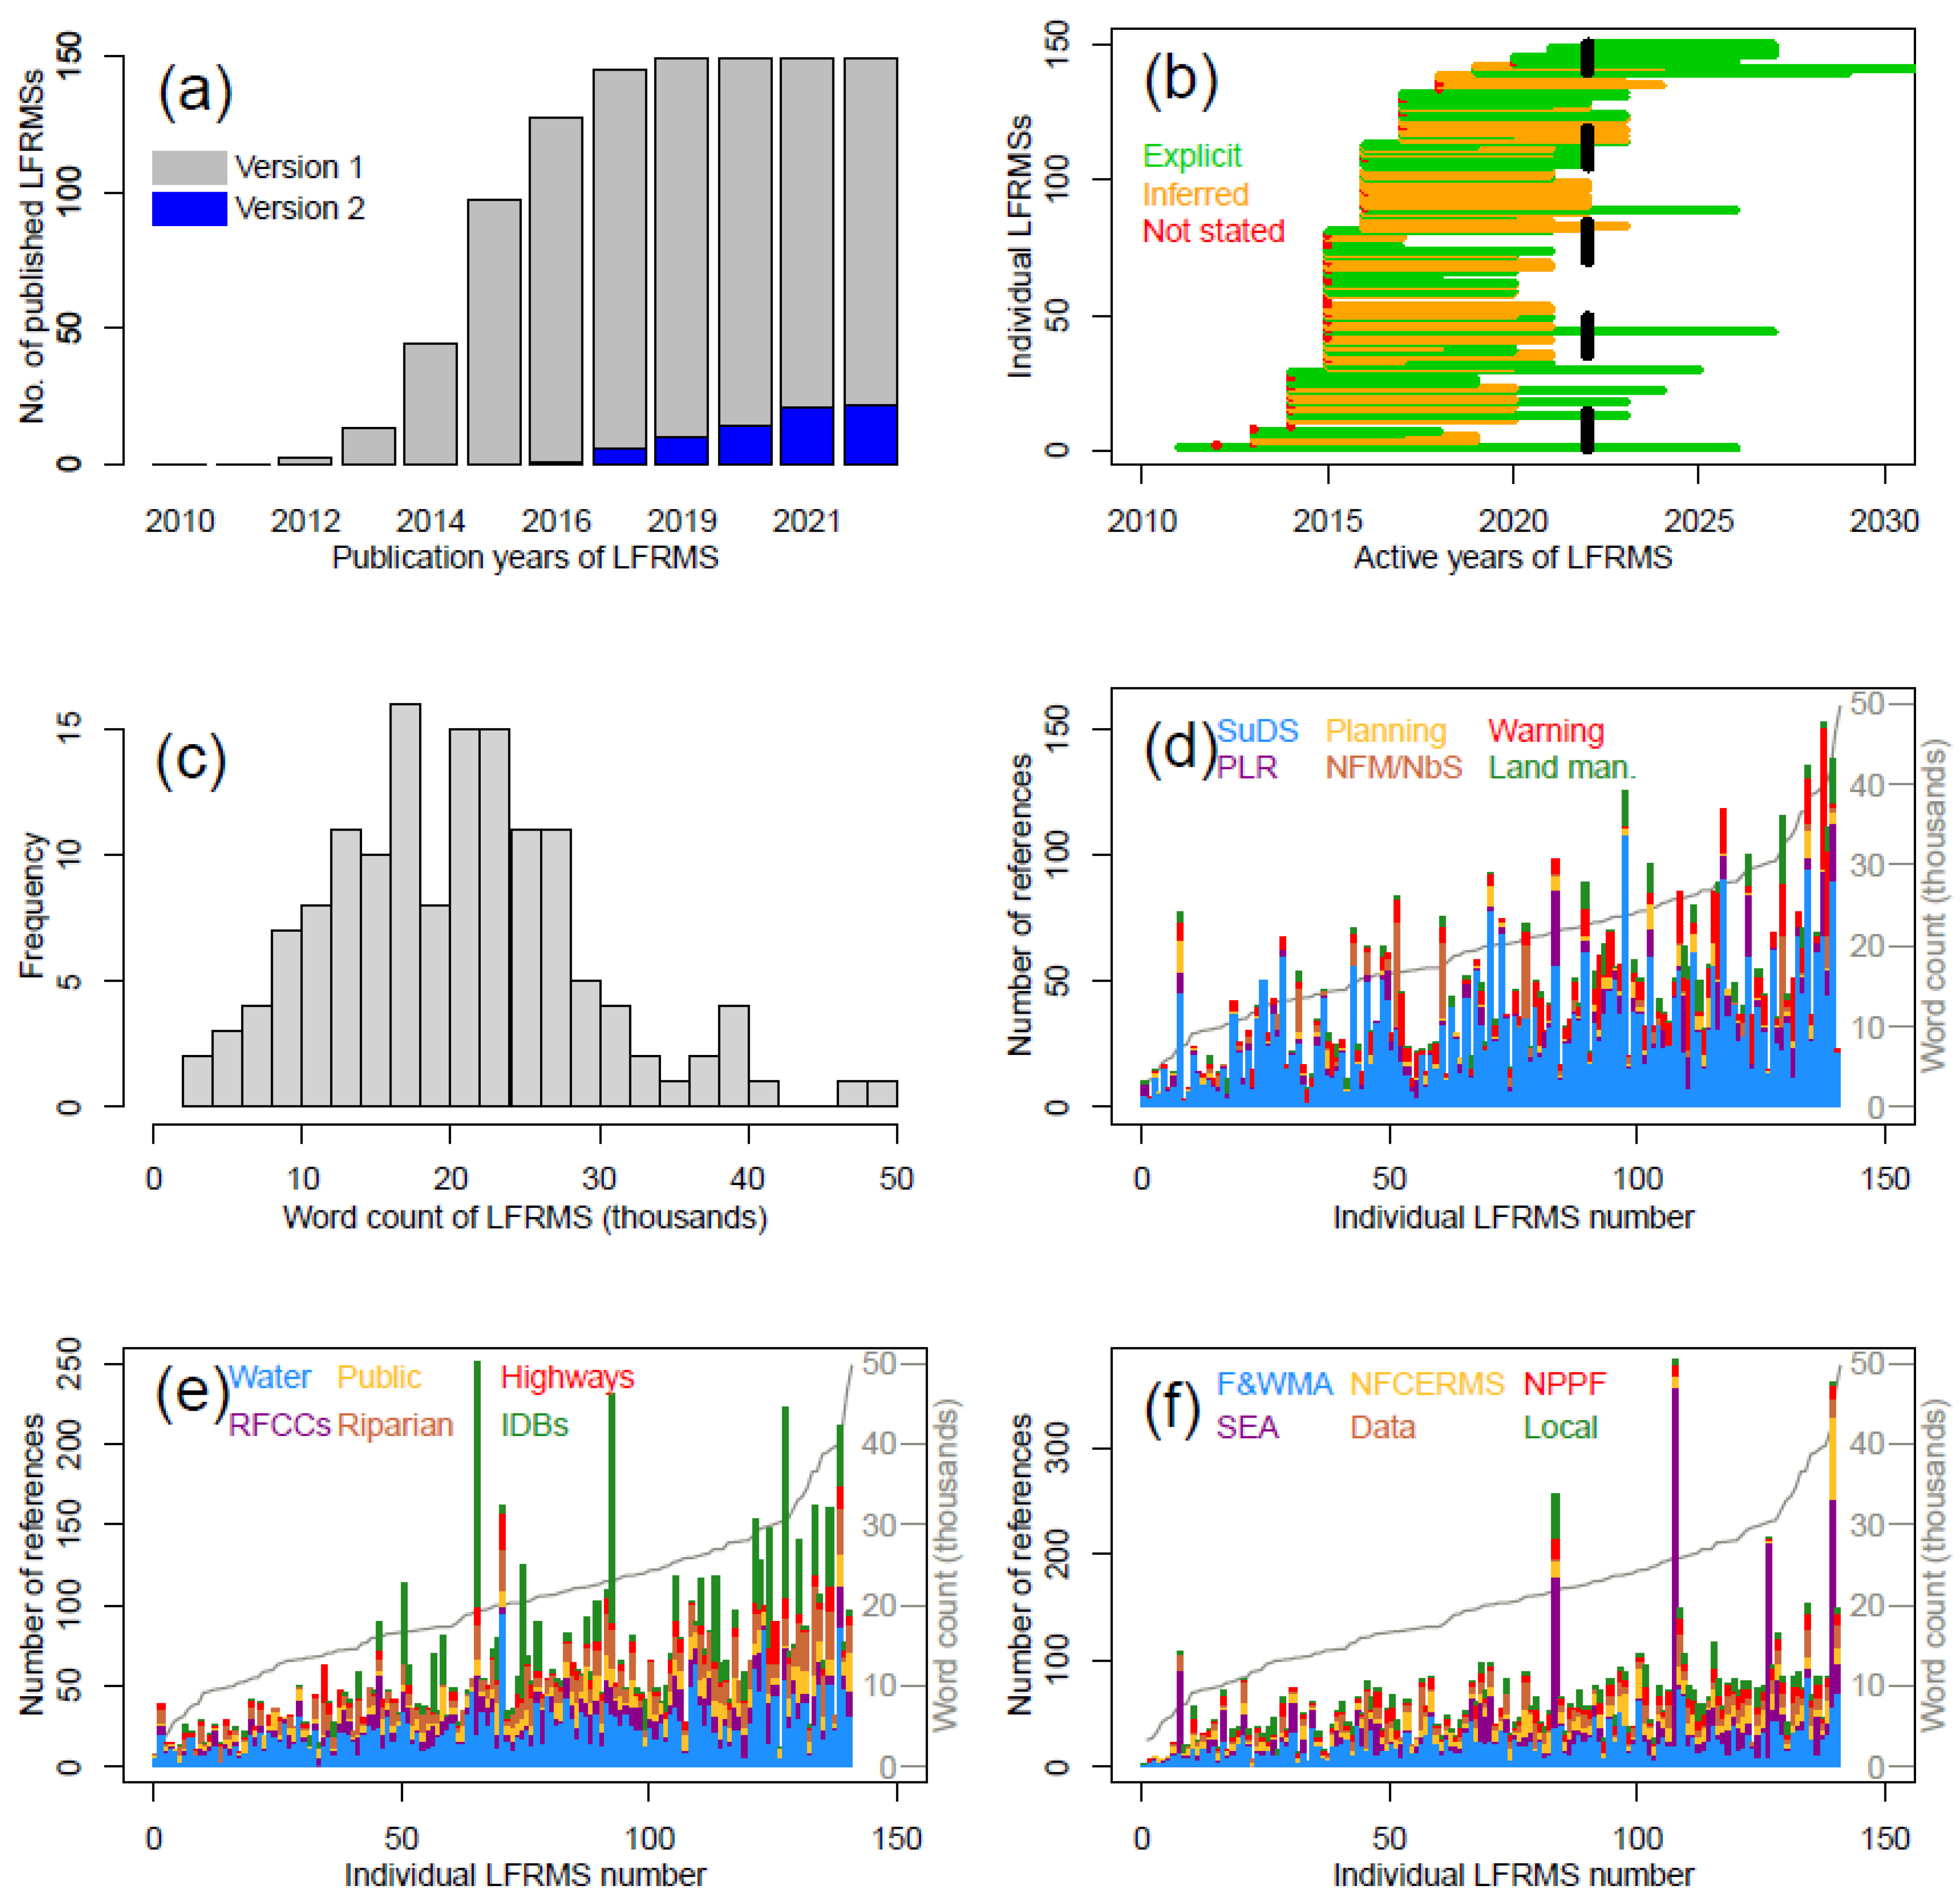
Figure 3.
A detailed presentation of the data collected from the audit. (a) Cumulative publication year data of the 1st and 2nd versions of the LFRMSs. (b) Horizontal lines representing the active period of the 141 LFRMSs examined. These are ordered vertically for the different LLFAs by the publication date of their most recent LFRMS. The line is green if the active period is explicit, orange if implied (i.e., it can be inferred from other information in the LFRMS), or red if it is not stated and not clear from other information. (c) Frequency distribution plot for the word counts of the 141 LFRMS. (d) Stacked bar graph showing the number of references in each LFRMS to a selection of resilience-focused FRM interventions: sustainable drainage systems—blue; property-level resilience—magenta; spatial planning—yellow; natural flood risk management/nature-based solutions—brown; flood warning systems—red; land management/upland water storage—green. The LFRMSs are ordered by word count, which is shown as the grey line. (e) As for (d), but examining stakeholders that should be consulted: water companies—blue; regional flood and coastal committees—magenta; riparian land owners—brown; the public—yellow; the Highways Agency—red; internal drainage boards—green. (f) As for (d), but examining policies and datasets that should be referred to: Flood and Water Management Act (2010)—blue; the Strategic Environmental Assessment—magenta; National FCERM Strategy—yellow; flood risk datasets—brown; National Planning Policy Framework—red; the local plan—green).
There is evidence in the documents that most LFRMSs are viewed as living documents to some extent by the LLFAs (Q3: 120/141, 85%) and that they have been implicitly or explicitly assigned an active period (Q4: 111/141, 79%; Figure 3b visualises those active periods). However, many of the LFRMSs with an active period have now gone beyond the end of that period (Q4: 60/141, 43%) and, therefore, require an urgent update. (It is likely that the intense response to the COVID-19 pandemic throughout 2020 and into 2022 by local authorities diverted resources from FRM and has delayed some of the LFRMS updates).
Fewer than half of the LFRMSs have a cover sheet (Q6: 59/141, 42%), making it impossible to identify whether the strategy has been peer reviewed and formally signed off. A small number of LLFAs indicated that they commissioned external consultants to develop their LFRMS (Q7: 25/141, 18%). These commissions were spread across a range of companies—WSP (5), ch2m (2), Peter Brett (2), JBA (3), Parsons Brinckerhoff (1), AECOM (5), Balfour Beatty (1), Capita (5), URS (6), Environment UK Ltd. (1), Metis Consultants (1)—with no clear dominant consultancy (some LLFAs instructed multiple consultancies). While the use of a consultancy does not imply that the LFRMS will be of higher quality, it does indicate that some LLFAs invested capital in their LFRMS. The range of consultants used suggests a missed opportunity for LLFAs to have issued combined tenders for single consultancies to produce multiple (consistent) LFRMSs, which could have increased cost efficiency and comparability across LLFAs.
A key result of this analysis is that nearly all LFRMSs included clear objectives (Q10: 140/141, 99%) and the same number can be classified as including some elements of SMART objectives (Q11: 140/141, 99%). When objectives fell short of being fully SMART, it tended to be the time-bound element that was lacking. Some degree of monitoring and evaluation is included in the majority of LFRMSs (Q12: 104/141, 74%) but there is room for improvement in most of those plans (i.e., the B score is dominant for Q12).
Climate change scenarios were rarely considered in LFRMSs (Q13: 49/141, 35%), and this number reduced even further when looking for evidence of scenarios informing actions, i.e., the A score for Q13 (7/141, 5%). Nonetheless, the majority of LFRMSs did discuss examples of potential climate change impacts (Q14: 135/141, 96%) despite not using projections. Given the importance of climate change to these strategies, the examination of these and related results is expanded in Section 3.3. Also considering future risk, population change was incorporated into less than one-third of LFRMSs (Q19: 38/141, 27%). In response to these uncertainties influencing long term planning, dynamic adaptation pathways can be used. However, they were only evident in a very small number of LFRMSs (Q16: 2/141, 1%) despite their very successful use in the Thames Estuary 2100 strategy [27].
Despite these criticisms, there is further evidence that the majority of LFRMSs are meeting their basic requirements in terms of direct consideration of SWF risk management measures (Q15: 140/141, 99%), references to the Strategic Risk Assessment (Q17: 138/141, 98%) and Asset Register (Q18: 132/141, 94%), and alignment with the National FCERM Strategy (Q19: 135/141, 96%).
3.2. LFRMS Coverage of FRM Approaches, Data, and Other Policies
Figure 3c shows that the length of LFRMSs is remarkably varied, with the longest at almost 50,000 words and the shortest at under 3300 words. The peak of the approximately normal distribution lies around 16,000–24,000 words. In the discussion, the links between word count and performance in this audit exercise will be considered.
Figure 3d shows the prevalence of references to a selection of resilience-focused FRM interventions that the research team considered to be important elements of a good LFRMS. Remarkably, 100% of LFRMSs refer to SuDS—this is a higher proportion than included objectives or referred to surface water flooding or climate change. It appears clear that the existence and use of SuDS has been picked up universally by the LLFA community. There was also a high incidence of using the term in the LFRMSs, with a mean of over 29 references to SuDS in each LFRMS. That said, there was a huge range in the number of references to SuDS in individual LFRMSs, from a single reference in one LFRMS to over 100 in another, so the depth of consideration appears to vary greatly. Other interventions, however, were referred to much less often: PLR/PLP—75%; spatial planning—55%; natural flood management/nature-based solutions—27%; flood warnings—86%; and land management/upland water storage—58%. There were some instances where individual LFRMSs had very few references to any of these interventions, and this will be examined more in the discussion. Some of this variability can be explained by the different local contexts but there are, nonetheless, insights of value in these findings.
References to “consult” or “consultation” were found in the vast majority of LFRMSs (137/141, 97%; [26]), with a mean of 13 references per LFRMS, which suggests LLFAs are consulting with relevant stakeholders. To elaborate on this, Figure 3e shows how many times individual LFRMSs referred to important stakeholder groups. Water companies dominate the number of references here (140/141 LFRMSs, 99%), which is understandable, given their role in SWF risk management. RFCCs (131/141, 93%) and the public (135/141, 96%) are referred to in the vast majority of LFRMSs. IDBs and riparian landowners are referred to in fewer LFRMSs (78% and 88%, respectively), but when they are included, there is a high number of mean references per LFRMS (14 and 11 references, respectively). Indeed, there are several instances of LFRMSs that have a very high number of references to the IDBs. However, the frequency of stakeholder reference does not necessarily translate to high-quality engagement, which is difficult to assess without implementing a much more in-depth method.
On references to underpinning legislation, policies, and data, it is unsurprising that nearly all the LFRMSs refer to the F&WMA2010 (138/141, 98%) and the National FCERM Strategy (140/141, 99%), as these represent the primary legislation that requires the LFRMS to be produced and the national strategy with which the LFRMSs must align. There is also a high level of engagement with the National Planning Policy Framework (126/141, 89%) and the local plans (127/141, 90%), which implies that LLFAs are considering the FRM implications for housing development. There is a relatively low rate of reference to the national data products (this includes the risk of flooding from rivers and seas (RoFRS), risk of flooding from surface water (RoFSW), flood map for planning, flood map for surface water, or the UK climate projections (UKCP09 or UKCP18) datasets) that could be used to underpin an LFRMS (116/141, 82%) and, similarly, references to strategic environmental assessments are not high (117/141, 83%).
Finally, on the relationship between word count and positive elements of the strategy documents, a clear relationship can be seen between longer documents and references to resilience-related FRM interventions (Figure 3d) and key stakeholders (Figure 3e). However, the relationship is weaker with references to other key plans and strategies (Figure 3f), which points to a more general issue with LLFAs contextualising their local strategies with other plans, strategies, and legislation.
3.3. Climate Change
In Section 3.1, some initial analysis showed that climate change scenarios and tools to plan under uncertainty were very rarely used. In this section, the examination of climate change factors will be expanded.
The term “climate change” was used in all but one of the LFRMSs examined (140/141, 99%) and was referred to, on average, 20 times in each LFRMS. However, once more specific climate change legislation and policy is considered, this prevalence rapidly decreases: the Climate Change Act (2008) is referred to in fewer than half of the LFRMSs (61/141, 43%), the Climate Change Risk Assessment in fewer than one fifth of the LFRMSs (26/141, 18%), and the National Adaptation Programme (NAP) in fewer than one sixth of the LFRMSs (19/141, 13%). However, while theoretically it would appear necessary for LFRMSs to refer to the NAP, it has been consistently noted by the Committee on Climate Change that the NAP has repeatedly failed to address flood risk in any meaningful way. This points to a clear failing in the delegated and top-down approach to SWF risk management in England: if the NAP is inadequate then there is no (statutory) direction or target for long-term, evidence-based adaptation plans nationally or locally. If LFRMSs develop adequate (or better) plans in relation to climate change, this is in spite of the NAP and not because of it.
It was also found that ranges of climate change scenarios were rarely considered in the LFRMSs, with as few as 5% using scenarios to inform actions. This is a key shortcoming in the plans. It implies that the range of potential impacts are not being considered and, therefore, there will not be adaptation plans put in place to prepare for the full range of possibilities.
Overall, though, it is clear that the consideration of climate change impacts across the LFRMSs is weak and should be addressed to avoid increasing exposure to flood risk, particularly SWF risk, in the future.
4. Discussion
The key aim of this analysis was to identify whether the LFRMSs are, as a whole, adequately addressing SWF risk in England, particularly in the context of a changing climate. Using a systematic method of quantifying elements of the LFRMSs that are indicative of important factors being included in the strategies, it was shown that there are significant shortcomings in the LFRMS portfolio. While nearly all the LFRMSs were shown to address SWF risk, very few were shown to address important aspects of climate change and increasing risk in the future. Of most concern:
- Only 35% considered climate change scenarios in any way;
- Population change in the future was only considered in 27%;
- The Climate Change Risk Assessment was only referred to in 18%;
- The National Adaptation Programme was only cited in 13%; and
- Only 1% referred to the dynamic adaptation pathway approach (and none present this method in the LFRMS).
It is, therefore, concluded that the current framework of delegating responsibility for SWF risk management into the LFRMSs does not provide an adequate, national response to the risks that are faced.
There are, therefore, significant opportunities for LFRMSs to address SWF risk in a changing climate in a much more sophisticated way—the knowledge, data, and tools are rapidly developing but they need to be implemented more widely. Encouragingly, some of the more recent LFRMSs that now align with the 2020 version of the National FCERM Strategy are using more sophisticated approaches and are referring to a wider range of resilience measures (e.g., City of London, Devon). This opportunity should be seized to disseminate good practice and to capitalise on the improvements in the new National FCERM Strategy.
Despite the issues around climate change adaptation planning, our analysis is largely consistent with [4,14] the fact that the LFRMSs are broadly meeting their statutory requirements. Indeed, Figure 2 shows that, more or less, the overall LFRMS portfolio is meeting the minimum requirements from the F&WMA2010. We also see evidence of stakeholder engagement being reported but cannot comment of the quality of that engagement from the method employed.
4.1. Examining Individual LFRMSs
It was identified in Section 3.2 that some of the LFRMSs had very few references to resilience-focused interventions. This included the Southend-on-Sea Unitary Authority, which, at over 49,000 words, is the longest of the LFRMSs. Examination of this LFRMS and other strategies with similarly low references to interventions highlighted that they included very few, if any, actions that directly reduce flood risk. They tended to focus on actions that improve risk characterisation, raising awareness, and encouraging stakeholders to act. While these aims are in line with objectives from the old, 2011 National FCERM Strategy, there were no actions in line with the “building, maintaining and improving flood and coastal erosion management infrastructure and systems” from that strategy that would have addressed flood risk. In these cases, there is little reason to refer to any interventions, least of all the resilience-focused ones that have been highlighted here.
At the other end of the LFRMS length scale, many of the shortest LFRMSs refer to other plans that include actions to address flood risk. In the case of Essex, Durham, Leicester City UA, and Poole (all under 5500 words), they refer to the surface water management plan (SWMP) rather than developing new actions themselves that will directly reduce flood risk. These short LFRMSs have other issues as well: Essex was the single LFRMS that did not refer to climate change; none of the four refer to any of the key datasets identified in Section 3.2; none of the four refer to more than two of the resilience-focused FRM interventions; and Durham, Leicester, and Poole do not refer to the NPPF or local plan, which implies that the potential impact on housing development has not been considered at the necessary depth. Whilst LFRMS length is not necessarily a negative, in these cases of short documents it does appear to indicate a delegation of planning to another plan or strategy, which is not the role of the LFRMS as set out in the F&WMA2010. Additionally, these plans do not take into account stakeholder preferences, as plans are not derived from engagement activities but rather through delegation.
The issues raised here appear to be common across FRM. Indeed, both the NAP and Defra’s Surface Water Management Action Plan have been criticised for similar issues by the CCC for delegating planning and acting on flood risk [11]. As discussed in Section 1, this is the result of the lack of a unifying act for FRM: there is no clear, overarching objective, so individual plans and strategies often refer back to each other and delegate responsibilities without ever developing a clear approach or set of actions that reduce flood risk. That many LLFAs have not used the opportunity to develop an LFRMS to take a strong lead on SWF risk management is entirely reasonable in the FRM system as it exists and is a key cause of the inadequate national management of the SWF risk that has been identified here. This was identified as a possibility in [17] but we provide evidence here to show that it is the case.
However, there is a group of LFRMSs that scored very highly in the audit. The Newcastle City Council LFRMS scored highest, followed by Leeds City Council, East Riding of Yorkshire Council, and Norfolk County Council. It is worth examining why these were ranked highest and to identify lessons that can be applied to other LFRMSs as they are updated. Newcastle’s LFRMS responded well to the standard elements required by the F&WMA2010 (i.e., objectives, actions, responsibilities) and it was also underpinned by the relevant datasets, including climate projections. The buy-in from stakeholders and consideration of impacts and responses was clear (e.g., integration of local planning and the NAP). The Norfolk LFRMS demonstrated widespread engagement with stakeholders as well as extensive consideration of the resilience-focused interventions. Leeds—an updated version and a WSP commission—made excellent use of the UKCP09 dataset and the Strategic Environmental Assessment. The East Riding of Yorkshire LFRMS, similarly, demonstrated good engagement with stakeholders, informed consideration of the resilience-focused interventions, and good use of underlying datasets. A commonality across these plans is meaningful stakeholder engagement and incorporating science. It is worth noting that these 4 LLFAs have long histories of FCERM issues and were almost certainly in good positions (and had clear motivation) to compile good LFRMSs.
4.2. Reflecting on the Method
There are some shortcomings to the method applied in this research. While some of the audit questions required an examination and classification of text from the LFRMSs (e.g., Q10–15 from Table 2), a large part of this analysis involved the somewhat blunt approach of searching for key terms that were chosen to identify valuable characteristics of each LFRMS. This approach allowed the research team to examine all the LFRMS, which has not been done before, in a reasonable time frame, but it did not allow for the nuance within each LFRMS to be examined. A more detailed examination was undertaken for a sub-set of LFRMSs (some of which is reported above) to ensure that the method was uncovering results of value—and it was assessed that it did—but this cannot be guaranteed for the whole portfolio. Nonetheless, with a degree of error that cannot be calculated, this examination provides valuable insights into the nature of the SWF risk management framework in England.
The analysis did not consider whether the plans had actually been implemented on the ground. This is a key element of the climate change adaptation assessment process but, as a first step, the current work only focussed on whether adequate plans are in place. This is logical, as it is unlikely that LLFAs are doing more than they set out in their LFRMS, but if the plan is inadequate, then it is almost certain that actions are also inadequate. Nonetheless, assessment of implementation of interventions is planned for future work.
4.3. Future Research
This study is a discrete piece of research that responds to a key climate change policy issue in the UK: is increasing surface water flood risk being adequately managed? The evidence presented here suggests that it is not and highlights potential policy framework problems that other nations should reflect upon.
This analysis is part of a larger research agenda that looks at the effectiveness of the full flood and coastal erosion risk management (FCERM) policy area in the UK.
The next element of the problem that we have investigated is the perceptions of FCERM policy professionals and practitioners on the issues that exist in the FCERM policy framework. This will shed light on the underlying causes of the policy gaps and how these experts in the field imagine that these issues could be addressed.
The longer-term ambition is to work with impacted communities and the wider stakeholder network alongside the policymakers to investigate what sustainable and palatable adaptation pathways look like in the context of flooding and coastal erosion risk. This will also require refined estimates of those risks, and this is also part of our research agenda.
5. Conclusions
The conclusions of this research are:
- The findings corroborate previous work that LFRMSs are generally meeting their minimum statutory requirements.
- There is a widespread issue across LFRMSs, with inadequate consideration of increasing climate change risk. We therefore conclude that the plans in place in England to manage surface water flood risk are not describing adequate actions.
- There is some evidence of good practice within the LFRMS portfolio (Section 4.1) and effort should be made to disseminate this as LLFAs update their LFRMSs in line with the new National FCERM Strategy.
Indeed, these results have implications for the ongoing development of local flood risk management in England, most notably that stakeholders require further engagement, that the position of the LFRMS in the overall strategy framework needs to be appreciated, and that robust long-term plans need to be developed in line with the latest evidence to account for likely climate changes.
Looking more widely to other nations and regions that are developing their climate change adaptation strategies, there are lessons to be drawn from this analysis. Most notably, there is clearly an issue with delegating a key element of long-term risk management planning to a large number of local bodies with limited guidance, evaluation, or national strategy. Based on the analysis here, the system employed for LFRMSs in England, if re-designed, would ideally include consistent and readily available data for long-term risk assessment, a framework for ongoing evaluation and improvement with a more clearly defined planning structure, and a clear national strategy that determines what level of risk reduction the individual LFRMSs should be aiming to achieve. These factors could be employed in other regions where long-term climate risk responses are being developed.
Author Contributions
Conceptualization, A.R.; methodology, A.R. and A.J.M.; software, A.R.; validation, A.R. and A.D.P.; formal analysis, A.J.M.; investigation, A.J.M.; resources, A.R. data curation, A.R. and A.J.M.; writing—original draft preparation, A.R.; writing—review and editing, A.R., A.J.M. and A.D.P.; visualization, A.R.; supervision, A.R.; project administration, A.R. and A.D.P.; funding acquisition, A.R. All authors have read and agreed to the published version of the manuscript.
Funding
This research received no external funding.
Data Availability Statement
Supporting data is available on the Queen Mary University of London data repository [26].
Conflicts of Interest
The authors declare no conflict of interest.
References
- Marsh, T.J.; Hannaford, J. The Summer 2007 Floods in England and Wales—A Hydrological Appraisal; Centre for Ecology & Hydrology: Wallingford, UK, 2007. [Google Scholar]
- Environment Agency. The Costs of the Summer 2007 Floods in England Project: SC070039/R1; Environment Agency: Bristol, UK, 2010.
- Pitt, M. The Pitt Review: Learning Lessons from the 2007 Floods; Cabinet Office: London, UK, 2008.
- Benson, D.; Fritsch, O.; Langstaff, L. Local flood risk management strategies in England: Patterns of application. J. Flood Risk Manag. 2018, 11, S827–S837. [Google Scholar] [CrossRef]
- HM Government. Flood and Water Management Act; HM Government: London, UK, 2010.
- Defra. Government’s Response to Sir Michael Pitt’s Review of the Summer 2007 Floods: Final Progress Report 2012; Defra: London, UK, 2012.
- HM Government. Climate Change Act; HM Government: London, UK, 2008.
- Environment Agency. National Flood and Coastal Erosion Risk Management Strategy for England; Environment Agency: London, UK, 2020.
- Committee on Climate Change. Progress in Preparing for Climate Change—2021 Progress Report to Parliament; Committee on Climate Change: London, UK, 2021. [Google Scholar]
- van der Most, H.; Marchand, M. Selecting Measures and Designing Strategies for Integrated Flood Management, A Guidance Document; World Meteorological Organization (WMO): Geneva, Switzerland, 2017. [Google Scholar]
- Committee on Climate Change. Progress in Preparing for Climate Change—2019 Progress Report to Parliament; Committee on Climate Change: London, UK, 2019. [Google Scholar]
- Local Government Association. Framework to Assist the Development of the Local Strategy for Flood Risk Management: ‘A Living Document’; LGA: London, UK, 2011. [Google Scholar]
- Environment Agency. Framework and Tools for Local Flood Risk Assessment; Environment Agency: London, UK, 2014.
- Maiden, T.; Anderson, M.; Kirkup, B.; Fawcett, J.; Wilson, N.; Ogunyoye, F. Evaluation of the Arrangements for Managing Local Flood Risk, Final Report FD2680; Defra: London, UK, 2017.
- Committee on Climate Change. Progress in Preparing for Climate Change—2017 Progress Report to Parliament; Committee on Climate Change: London, UK, 2017. [Google Scholar]
- HM Government. Government Response to the Committee on Climate Change 2019 Report to Parliament—Progress in Preparing for Climate Change; HM Government: London, UK, 2019.
- Defra. Surface Water Management Action Plan; Defra: London, UK, 2018.
- Fritsch, O.; Kamkhaji, J. Implementing in the Laboratory: Scorecards for Appraising Regulatory Impact Assessment. In Handbook of Regulatory Impact Assessment; Dunlop, C.A., Claudio, M., Radaelli, C.M., Eds.; Edward Elgar: Cheltenham, UK, 2016; pp. 399–411. [Google Scholar]
- Sayers, P.B.; Horritt, M.; Carr, S.; Kay, A.; Mauz, J.; Lamb, R.; Penning-Rowsell, E. Third UK Climate Change Risk Assessment (CCRA3): Future Flood Risk. In Research Undertaken by Sayers and Partners for the Committee on Climate Change; Committee on Climate Change: London, UK, 2020. [Google Scholar]
- Russell, A.; Sayers, P. Assessing future flood risk and developing integrated flood risk management strategies: A case study from the UK Climate Change Risk Assessment. Sustainability 2022, 14, 13945. [Google Scholar] [CrossRef]
- Kendon, E.J.; Prein, A.F.; Senior, C.A.; Stirling, A. Challenges and outlook for convection-permitting climate modelling. Philos. Trans. R. Soc. A 2021, 379, 20190547. [Google Scholar] [CrossRef] [PubMed]
- HM Government. UK Climate Change Risk Assessment 2022; HM Government: London, UK, 2022.
- Haasnoot, M.; Kwakkel, J.H.; Walker, W.E.; Maat, J. Dynamic adaptive policy pathways: A method for crafting robust decisions for a deeply uncertain world. Glob. Environ. Chang. 2013, 23, 485–498. [Google Scholar] [CrossRef]
- Day, T.; Tosey, P. Beyond SMART? A new framework for goal setting. Curric. J. 2011, 22, 515–534. [Google Scholar] [CrossRef]
- Brown, K.; DiMauro, M.; Johns, D.; Holmes, G.; Thompson, D.; Russell, A.; Style, D. Turning risk assessment and adaptation policy priorities into meaningful interventions and governance processes. Phil. Trans. R. Soc. A. 2018, 376, 20170303. [Google Scholar] [CrossRef] [PubMed]
- Queen Mary Research Online. Local Flood Risk Management Strategies (LFRMSs) Audit. 2022. Available online: https://qmro.qmul.ac.uk/xmlui/handle/123456789/79272 (accessed on 23 January 2023).
- Environment Agency. Thames Estuary 2100—Managing Flood Risk Through London and the Thames Estuary; Environment Agency: London, UK, 2012.

Disclaimer/Publisher’s Note: The statements, opinions and data contained in all publications are solely those of the individual author(s) and contributor(s) and not of MDPI and/or the editor(s). MDPI and/or the editor(s) disclaim responsibility for any injury to people or property resulting from any ideas, methods, instructions or products referred to in the content. |
© 2024 by the authors. Licensee MDPI, Basel, Switzerland. This article is an open access article distributed under the terms and conditions of the Creative Commons Attribution (CC BY) license (https://creativecommons.org/licenses/by/4.0/).