Abstract
Drought poses a significant threat to water resources in East Africa, necessitating a comprehensive assessment of its impacts for effective mitigation strategies. This study utilizes two global gridded SPEI datasets to analyze drought characteristics (i.e., frequency, duration, and severity) in East Africa from 1981 to 2021. To estimate the sustainability of water resources over the region, the study employed the Reliability–Resiliency–Vulnerability framework (RRV) that aggregates the drought characteristics (i.e., frequency, duration, and severity). Drought is deemed to have occurred when the SPEI value falls below −1, so the threshold for water demand (RRV) is also computed at a threshold level of −1. The findings indicate pronounced changes in drought patterns across East Africa, with evidence of varying degrees of recovery and resilience in different regions. Employing the RRV framework over the East Africa region to determine how the region can cope with the effects of drought revealed a median range of RRV of 0.61 to 0.80, indicating a sustainable situation during the study period. This indicates that despite the recorded drought incidences, the water catchments of lakes, rivers, and major water towers are not threatened and, thus, less vulnerable. Although certain regions exhibit declining resilience and vulnerability to drought impacts, there is a need for targeted mitigation measures and policy interventions to safeguard water resources.
1. Introduction
Extreme events stemming from climate change have emerged as a focal point of concern for researchers and policymakers on a global scale. Among these events, shifts in precipitation patterns, including intensified rainfall and prolonged droughts, have emerged as critical concerns [1]. The World Meteorological Organization (WMO) defines drought as a pernicious natural hazard characterized by negative precipitation anomaly that, when extended over a season or longer period, is insufficient to meet the demands of human activities and the environment [2]. Droughts, when compared to other natural disasters like floods, storms, extreme high-temperature events, wildfires, earthquakes, and other geophysical hazards like volcanic activities and landslides, cause colossal economic damage that is huge and impactful, as recently detailed in the Emergency Event Database (EM-DAT; [3]). Drought is classified into four primary types: meteorological drought [4,5], arising from insufficient rainfall within a specific period; hydrological drought [6], associated with insufficient surface and groundwater availability; agricultural drought and pedological [7], caused by a shortage of water for plant development; and socio-economic drought, which involves an insufficient supply to meet the demand for diverse economic commodities, encompassing the three previously mentioned types of droughts [8,9]. Combined occurrences of droughts and heatwaves exert substantial effects on agriculture, energy, water resources, and ecosystems [10]. The sustenance of life on Earth relies significantly on essential water resources, interconnected with critical economic sectors such as industry, agriculture, power, and transportation [11]. These resources are crucial in supporting the population’s well-being, the survival of wildlife and plant life, and the environment’s overall health [12].
In East Africa, the scarcity of freshwater and diminished river flow is exacerbated by the substantial influence of drought on water resources [13,14,15]. The area is presently confronting unparalleled consequences of drought, and these effects are anticipated to escalate due to the influence of climate change [16]. The Nile River, a vital water resource in the region, is projected to experience a reduction in annual flow due to climate change [17]. The effects of drought on water resources have been witnessed in susceptible regions, including northeastern and southern Ethiopia, eastern Somalia, and northeastern Kenya [18]. In Uganda, drought substantially influences water resources by causing a decline in average annual rainfall and elevated temperatures, thereby impacting water availability and recharge systems, as research findings indicate [19,20]. Similarly, the changing climate in Rwanda, marked by rising temperatures and more prolonged dry spells, threatens crop production and strains the water supply, which is crucial for the country’s economy [21].
Accurately assessing and analyzing drought characteristics is crucial for developing effective water resource management strategies and mitigation plans and adapting to changing climatic conditions [22]. Traditional drought analysis often relies on single-dimensional indices focusing on specific aspects like precipitation deficit (e.g., Standardized Precipitation Index—SPI) or soil moisture (e.g., Palmer Drought Severity Index—PDSI) [23]. Although valuable, traditional drought indices may not capture the complete picture of drought complexity as they neglect the crucial role and interplay of other factors, such as water storage capacity and evapotranspiration [24,25]. Recent studies emphasize incorporating additional factors to enhance drought assessment methodologies. For instance, [26] proposed a Weighted Water Storage Deficit Index that accounts for the contribution of each terrestrial water storage component in calculating the drought signal, providing more realistic drought estimates over large basins in Africa. Additionally, [27] presented a modified drought index, the Standardized Precipitation–Evapotranspiration Irrigation Index (SPEII), which considers the human activity of irrigation to monitor cropland vegetation drought better. Overall, it is essential to note that different timescales and seasons affect drought characteristics and occurrences, with recent studies highlighting that drought occurrences have been increasing over small time scales and that the total length of such occurrences is decreasing [28,29]. Therefore, continuous monitoring is required to inform strategies and minimize adverse impacts on the economy, society, and environment.
Integrating reliability, resilience, and vulnerability (RRV) metrics in enhancing drought risk assessment offers a comprehensive approach [30,31]. RRV metrics evaluate a system’s capacity to withstand and recover from adverse conditions and its ability to recover from undesirable conditions and measure the potential consequences of prolonged unsatisfactory states [32]. Recent advancements include optimal dynamic frameworks, such as those proposed by [33], that analyze drought risk in water supply systems based on reliability and vulnerability parameters. Moreover, the RRV fuzzy-based frameworks, as demonstrated by [34], offer improved efficiency in assessing watershed health and drought risk by accounting for uncertainty and complexity. Reference [35] recommends using RRV to establish long-term drought strategies for regions where future drought risk is expected to increase. The RRV approach makes it possible to analyze different scenarios that could include specific mitigation or adaptation strategies to accommodate a varying climate [36,37].
To address the escalating challenges posed by climate change-induced drought in East Africa, this study used RRV metrics alongside an aggregation index based on the Standardized Precipitation–Evapotranspiration Index (SPEI) to quantify water availability within the region. By transcending traditional indices and integrating reliability, resilience, and vulnerability parameters, this research seeks to provide a more nuanced understanding of drought dynamics. Existing studies in the region have primarily concentrated on estimating observed changes in drought characteristics, their trends, variability, and potential future scenarios. However, to our knowledge, no study has undertaken a comprehensive examination of the sensitivity of the RRV framework using SPEI variability as an indicator of drought across different timescales. Consequently, the present study analyzes recent observed changes in drought episodes based on the SPEI index and the spatial and temporal patterns of RRV indicators from 1981 to 2021. This is expected to revolutionize current drought assessment practices and inform more effective mitigation and adaptation strategies in East Africa amidst a changing climate. The rest of the paper is organized in a manner where the study area, data, and materials are described in Section 2, while the results are presented in Section 3. Discussion follows in Section 4, and then the conclusion and recommendation are delineated in Section 5.
2. Study Area, Datasets, and Methodology
2.1. Study Area
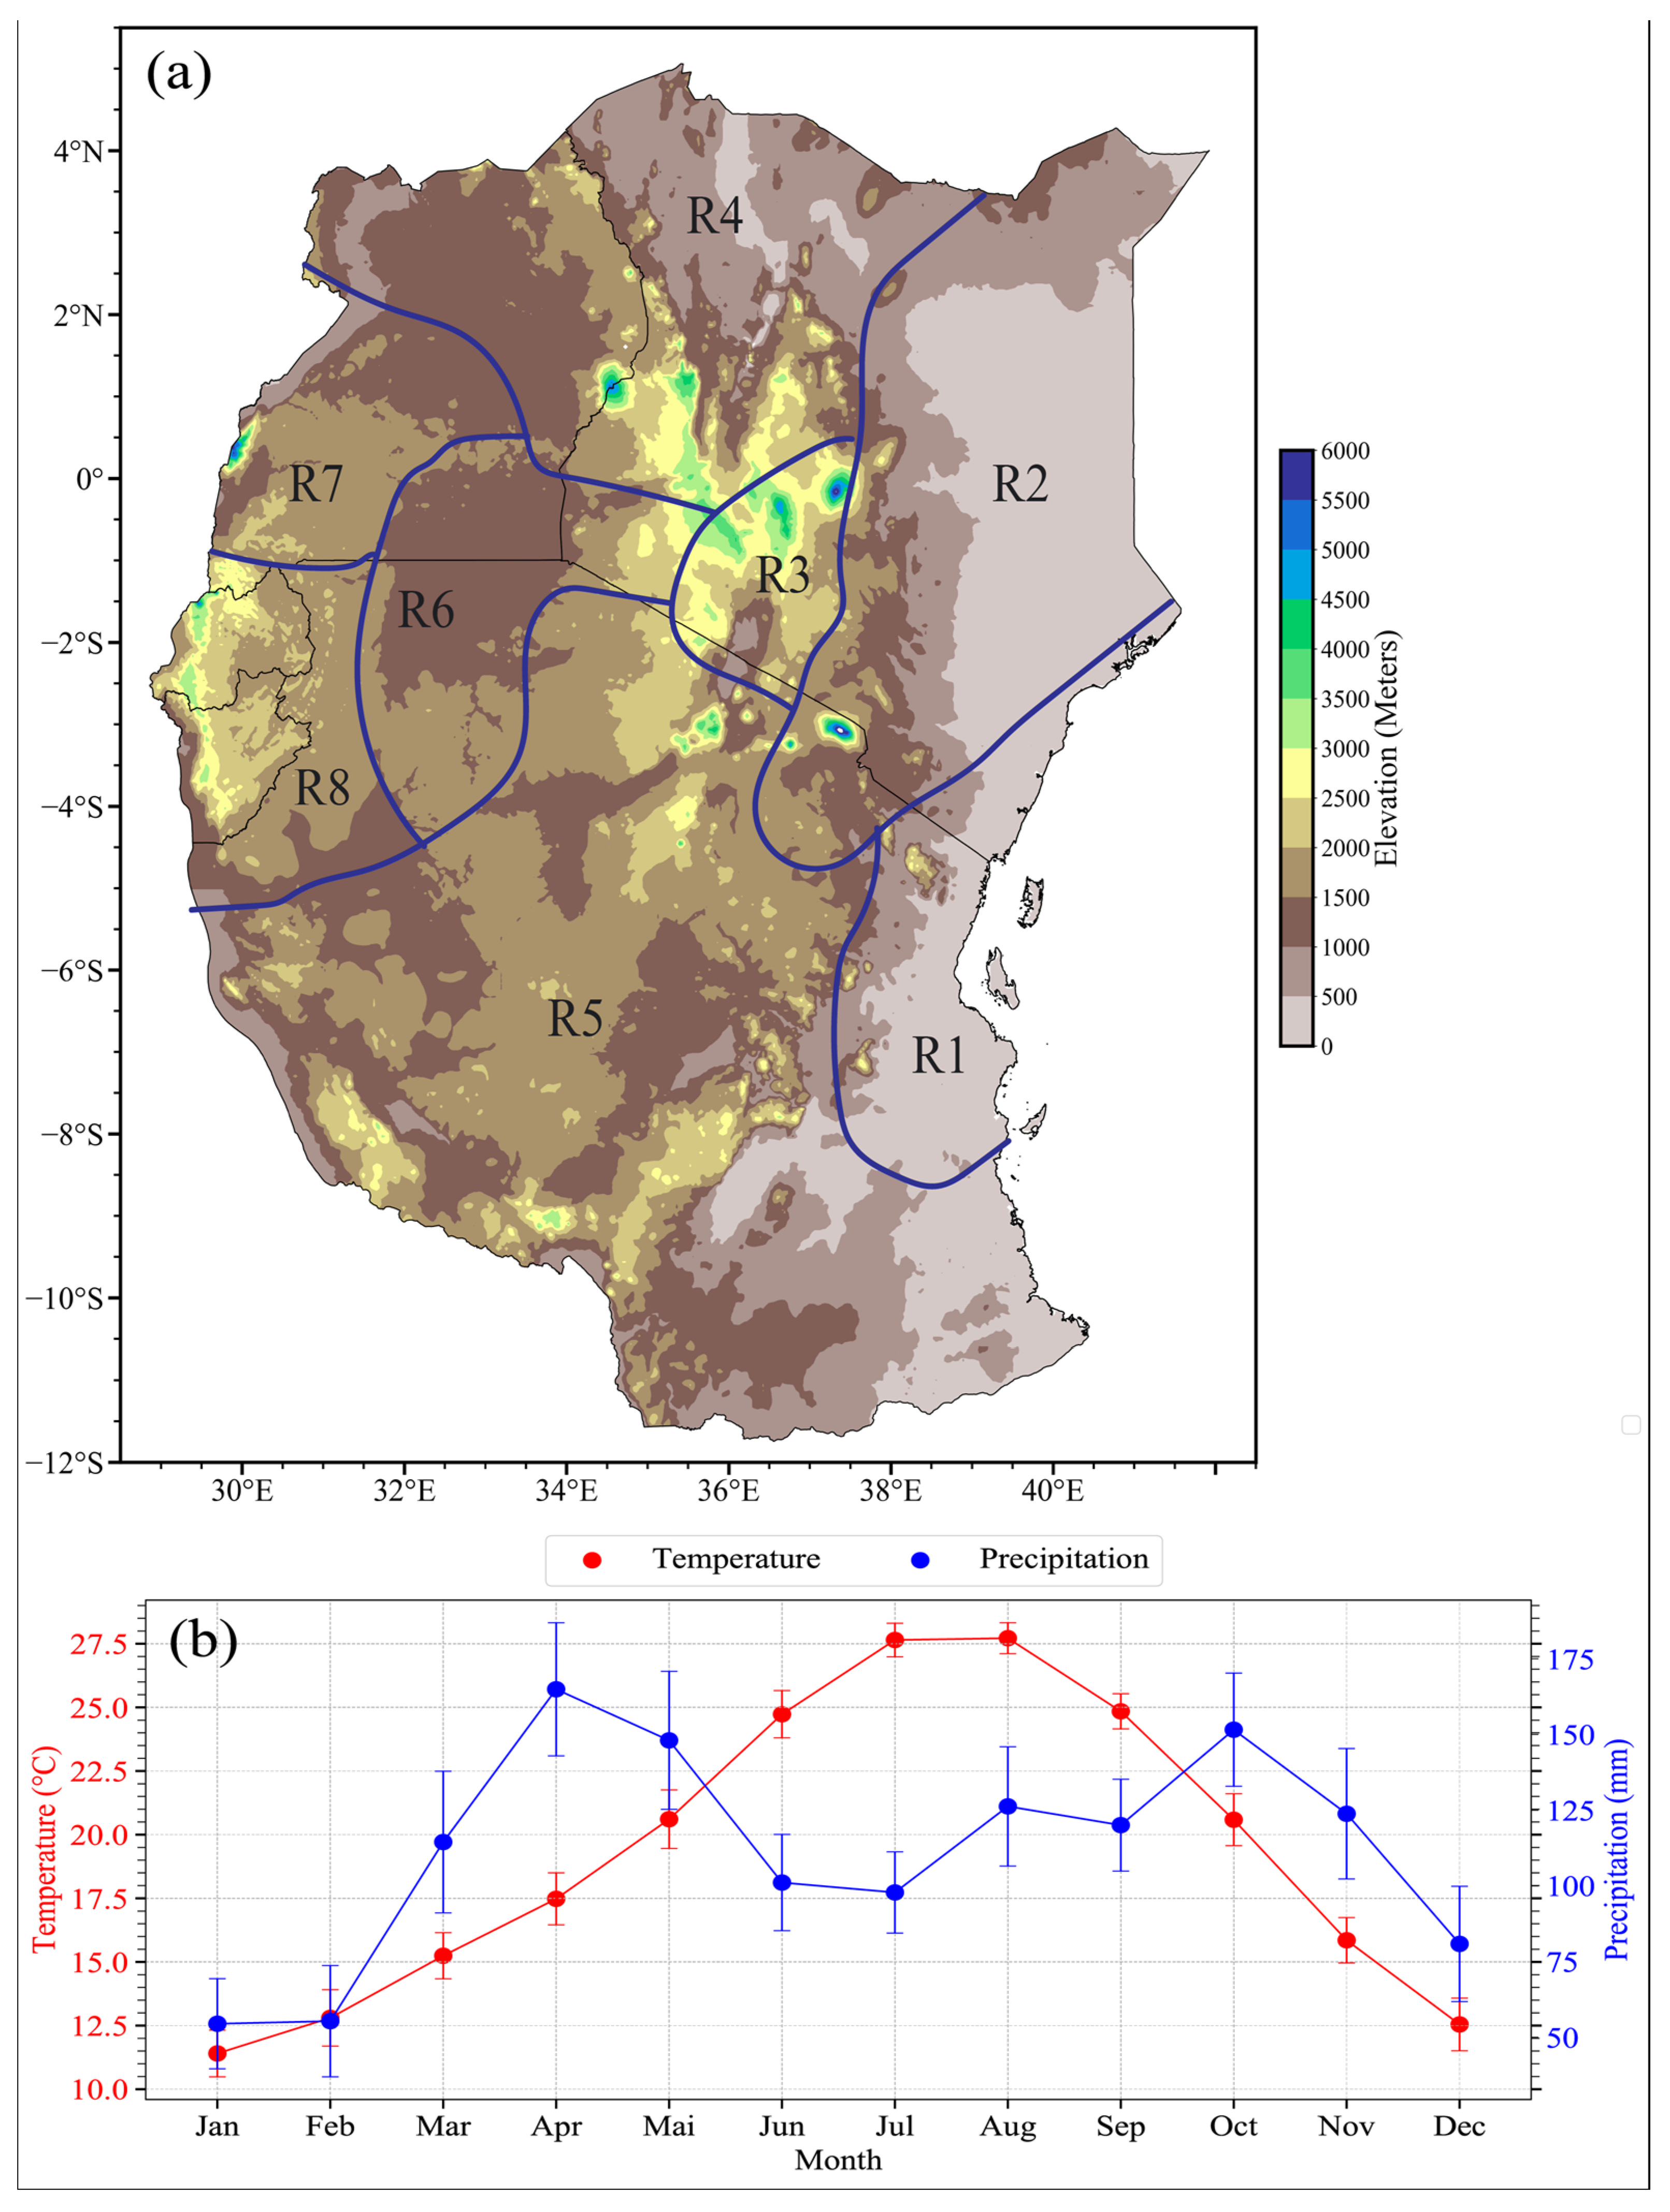
East Africa is bounded along latitude 28° E to 42° E and longitude 12° S to 5° N. It comprises five countries: Kenya, Uganda, Tanzania, Burundi, and Rwanda. Despite the region’s rich diversity of water resources, including Lake Victoria, Lake Tanganyika, and the Nile, the region suffers from a water deficit due to perennial drought occurrences and the uneven distribution of water resources. Climatologically, the region can be categorized as having a moist sub-humid climate experienced along Uganda, Rwanda, and Burundi; dry sub-humid (northern parts of Uganda, western Tanzania, and Kenya); semi-arid (parts of Tanzania); and arid (significant parts of Kenya). This is further delineated into eight climatic zones that receive homogenous rainfall, as earlier defined by [38]. These zones are classified as Regions 1 to 8, as marked in Figure 1a. Generally, the region receives two rainfall seasons from March to May (MAM) and from October to December (OND) that support agriculture and provide a source of water for major industry and household usage [39] (Figure 1b). However, since 2016, East Africa has suffered recurrent drought, with nine seasons experiencing dry anomalies (failed rainfall) and only two having regular rainfall events [40]. Such anomalies lead to a ripple effect on water resources’ sustainability that can result in vulnerability. Thus, to understand the effect of the recent drought on water resources, we considered how drought has evolved over these regions and its effect on water resources during the past 40 years.

Figure 1.
(a) The study area with topographical elevation (meters). The blue line depicts the eight geographical regions across East Africa as delineated by Indeje et al. [38], (b) Monthly variability of Temperature and precipitation over East Africa.
2.2. Datasets
The study utilized the global gridded Standardized Precipitation–Evapotranspiration Index (hereafter SPEIbase v.2.8) datasets with a timescale of 1 to 48 months. These products were developed at 0.5° × 0.5° horizontal grid resolution and are available at monthly timescales from 1901 to 2021. The SPEIbase v.2.8 is based on the precipitation and potential evapotranspiration (PET) sourced from Climatic Research Unit TS4.6 datasets to calculate the potential evapotranspiration (PET), using the FAO-56 Penman–Montieth approach. The products are available on an open-source platform (https://digital.csic.es/handle/10261/288226, accessed on 5 February 2024) and present an opportunity to quantify drought conditions at the global level. Further details can be obtained from [41,42]. To account for uncertainty, the study further employs SPEI data that are computed based on monthly precipitation from Climate Hazard Group InfraRed Precipitation with Station Data (CHIRPS v.20) and PET from Global Land Evaporation Amsterdam Model (GLEAM v.3.7a). The recently released SPEI products developed at high resolution provide an opportunity to estimate drought changes across various levels, thereby supporting the development of site-specific adaptation measures. These datasets are publicly available at the Centre for Environmental Data Analysis (CEDA; https://doi.org/10.5285/ac43da11867243a1bb414e1637802dec, accessed on 6 February 2024) [43]. We computed drought characteristics based on the two products due to how they capture drought signals over the study region and determine where they exhibit disparities to account for uncertainty. The surface air temperature and precipitation datasets used to depict pluviothermic patterns of the study region during the study period are depicted in Figure 1b and were sourced from ERA5 [44]. All datasets were regridded to a uniform horizontal resolution of 50 km by 50 km using the bilinear interpolation technique.
2.3. Methodology
Based on SPEI-01 datasets, we first examined the recent changes in drought characteristics (i.e., frequency, duration, and severity) over the East Africa region from 1981 to 2021. Table 1 describes the drought characteristics considered for this study. These drought features adversely affect streamflow and surface water levels that support daily livelihoods. A one-month SPEI was chosen to represent a short climatological drought that affects soil moisture and plant stress, especially during the growing period. To further estimate the evolution of drought changes across timescales, we divided the study period into two 20-year periods (i.e., 1981 to 2001 and 2002 to 2021). This was to aid in determining the period when drought episodes were most prominent and which region bore the brunt of drought changes. Further, the study employed a two-sample t-test using the means and variance for each period at each grid point to aid in establishing if the mean values between those two periods were statistically significant. Thus, we set an alpha of 90% confidence for the significance test.

Table 1.
Drought characteristics considered in the present study. Drought months are months with SPEI ≤ −1.
Thus, to estimate the sustainability of water resources over a region, the study employed the Reliability–Resiliency–Vulnerability model (RRV) that aggregates the drought characteristics (i.e., frequency, duration, and severity). Drought is deemed to have occurred when the SPEI value falls below −1, so the threshold for water demand (RRV) is also computed at a threshold level of −1.
Reliability is defined as the probability that no failure (drought) occurs within a specified duration. Regarding the SPEI threshold, the system is considered reliable if it is within a range of 0 > SPEI > −0.99. However, if the SPEI value falls below −1, it indicates that water demand is not being met and system reliability is low. This can be expressed in Equation (1).
where is the duration of individual droughts and is the number of droughts. represents the number of time intervals.
On the other hand, resiliency (Equation (2)) is defined as the capacity of the region to recover water demands from drought effects after a prolonged period. It is reciprocal for drought duration in a specific locality. The higher the resilience, the higher the water sustainability. If the drought lasts longer, the water system will become less resilient. d(j) is the duration and v(j) in Equation (3) is the cumulative SPEI during the drought event.
Vulnerability (Vul; Equation (3)) represents the failure of a region to recover from the effects of drought; hence, water availability is acutely affected. Vulnerability expresses failure, which is defined as the average of the total deficit, which is the sum of the deficit divided by the number of deficit events.
Therefore, the RRV optimized index is computed by combining reliability, resiliency, and vulnerability to estimate the overall drought condition and analyze the sustainability of the water system over the East Africa region.
where Rel is the reliability, Res is the resiliency, and Vul is the vulnerability. The RRV shows the sustainability of the water resource system. Its values range from 0 to 1. This can be further disaggregated into five category classes, such as “very high (0.81 to 1.00)”, “high” (0.61 to 0.80)”, “moderate (0.41 to 0.60)”, “low (0.21 to 0.40)”, and finally “very low (0.00 to 0.20)”. The system is considered to attain more sustainability as values approach one and vice versa. More details can be obtained from the work of [30], who first developed it for application in evaluating water resources systems. Numerous studies have thus employed it to estimate water resource use and availability [31,35,45]. To display the changes in drought characteristics, the study employed boxplots and spatial analysis to demonstrate the distribution of drought changes and the RRV framework. A box-and-whisker plot helps represent the datasets based on five key indicators: minimum value, first quarter (25th percentile), median, third quantile (75th percentile), and maximum value. The interquartile range shows the changes in drought events. Various studies have used this approach (e.g., [31,35]).
3. Results
3.1. Drought Characteristics
To understand the drought characteristics and their effect on water resources over the East Africa region, we analyzed how drought frequency (hereafter, DF), duration (DD), and severity (DS) affected the region before quantifying the watershed sustainability based on the RRV framework. The study period was divided into two durations (i.e., 1981–2001 and 2002–2021) to understand how it has evolved over the past 40 years and in which decade the impact was most prominent. As earlier pointed out, drought conditions were defined when SPEI values dropped below −1; hence, the more negative values, the more severe the drought conditions were. DF was analyzed to establish the number of drought occurrences during the two time periods, while DD depicted the length (months) from when the drought was first detected to the period it terminated. Meanwhile, DS indicated that the total deficit was below the threshold value, and thus, it revealed how intensely the region suffered from drought anomalies. Understanding the drought intensity reveals the magnitude of the drought on the environment and, thus, the effect on available water resources. The study utilized two gridded SPEI datasets to account for uncertainty and demonstrate how they robustly depict drought characteristics over the study region.
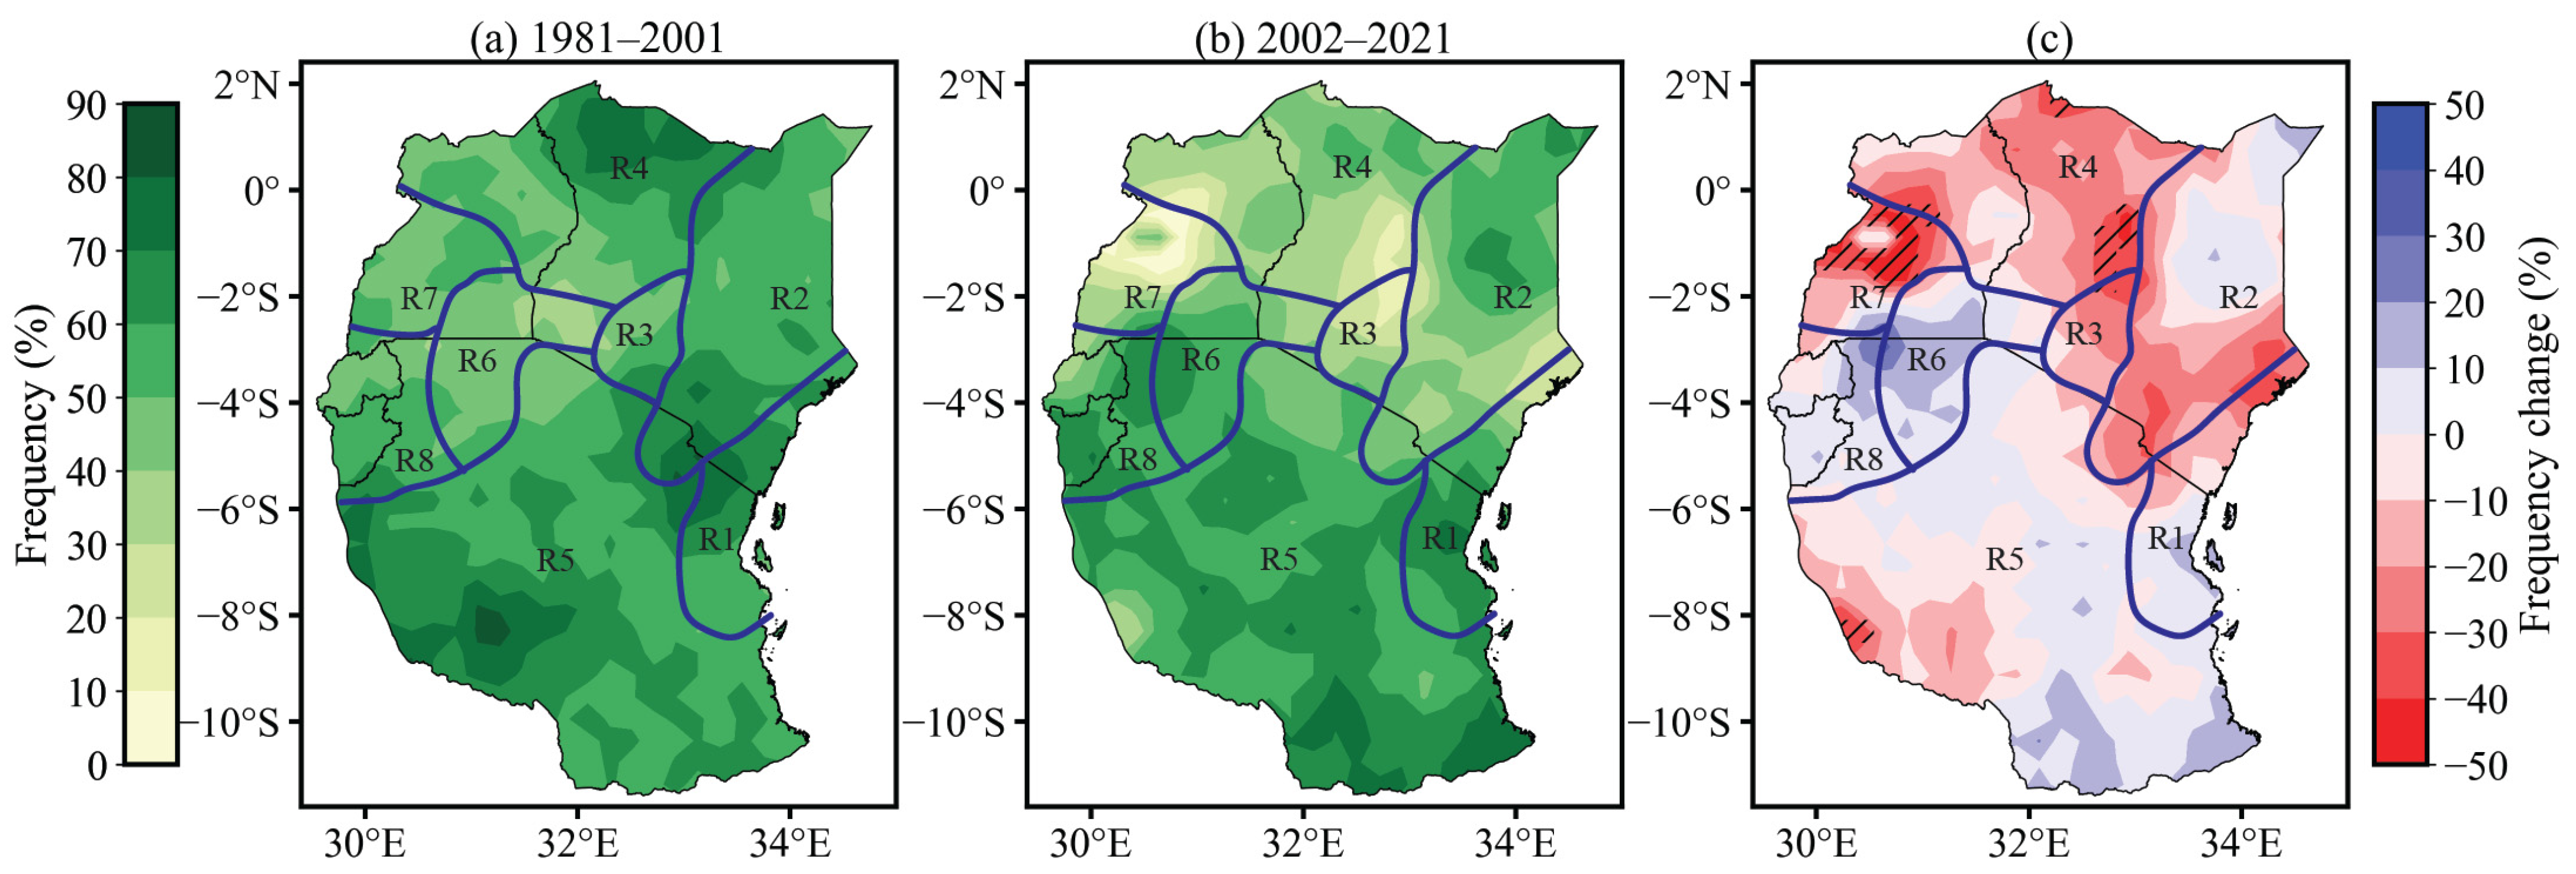
Figure 2a,b shows the spatial pattern of DF over East Africa during the two periods across the eight climatic zones based on SPEIbase v.2.8 data, while Figure A1a,b shows DF spatial patterns based on CHIRPS_GLEAM SPEI datasets. Up to 80% of the DF has been detected to have occurred over the region during the two scales. More recurrent DF is observed along Regions 1, 4, and 5 as compared to other regions during the first decade. However, based on CHIRPS_GLEAM datasets, the spatial variance of DF is about 70% during the study duration (Figure A1a,b). Meanwhile, few occurrences of DF were noted in Regions 3 and 6 from 1981 to 2001, with all products showing similar patterns. During 2002–2021, R6, parts of R2, R5, and R8 show persistent DF occurrences. Regions 3, 4, and 7 show reduced DF during recent decades compared to the period from 1981 to 2001. The changes in DF during 2002–2021 are less in most regions, except for R5, as depicted in SPEIbase v.2.8 products. The notable drought signals that are evident in R5 are not detected in the CHIRPS_GLEAM product. Further analysis shows that R6 and R8 depict a slight increase in DF during the last decade compared to the previous decade, as noted in both products. Comparing the changes in drought occurrence during the two timescales based on a two-sample t-test using means and variance for each of the two periods at each grid point shows that the mean values during the two periods were statistically significant along R7 and parts of R4 (Figure 2c). However, based on CHIRPS_GLEAM products, the changes in the mean values show insignificant drought occurrences at a 90% significance test level (Figure A1c). Such disparities in the two products call for the need to continually improve the quality of drought products till they can detect similar drought signals and minimize possible uncertainty.

Figure 2.
Spatial distribution of DF (%) under the two historical periods (1981–2001, 2002–2021). The hatched area denotes the significance level at 90%. (c) Represents the frequency change between the two periods (a) and (b).
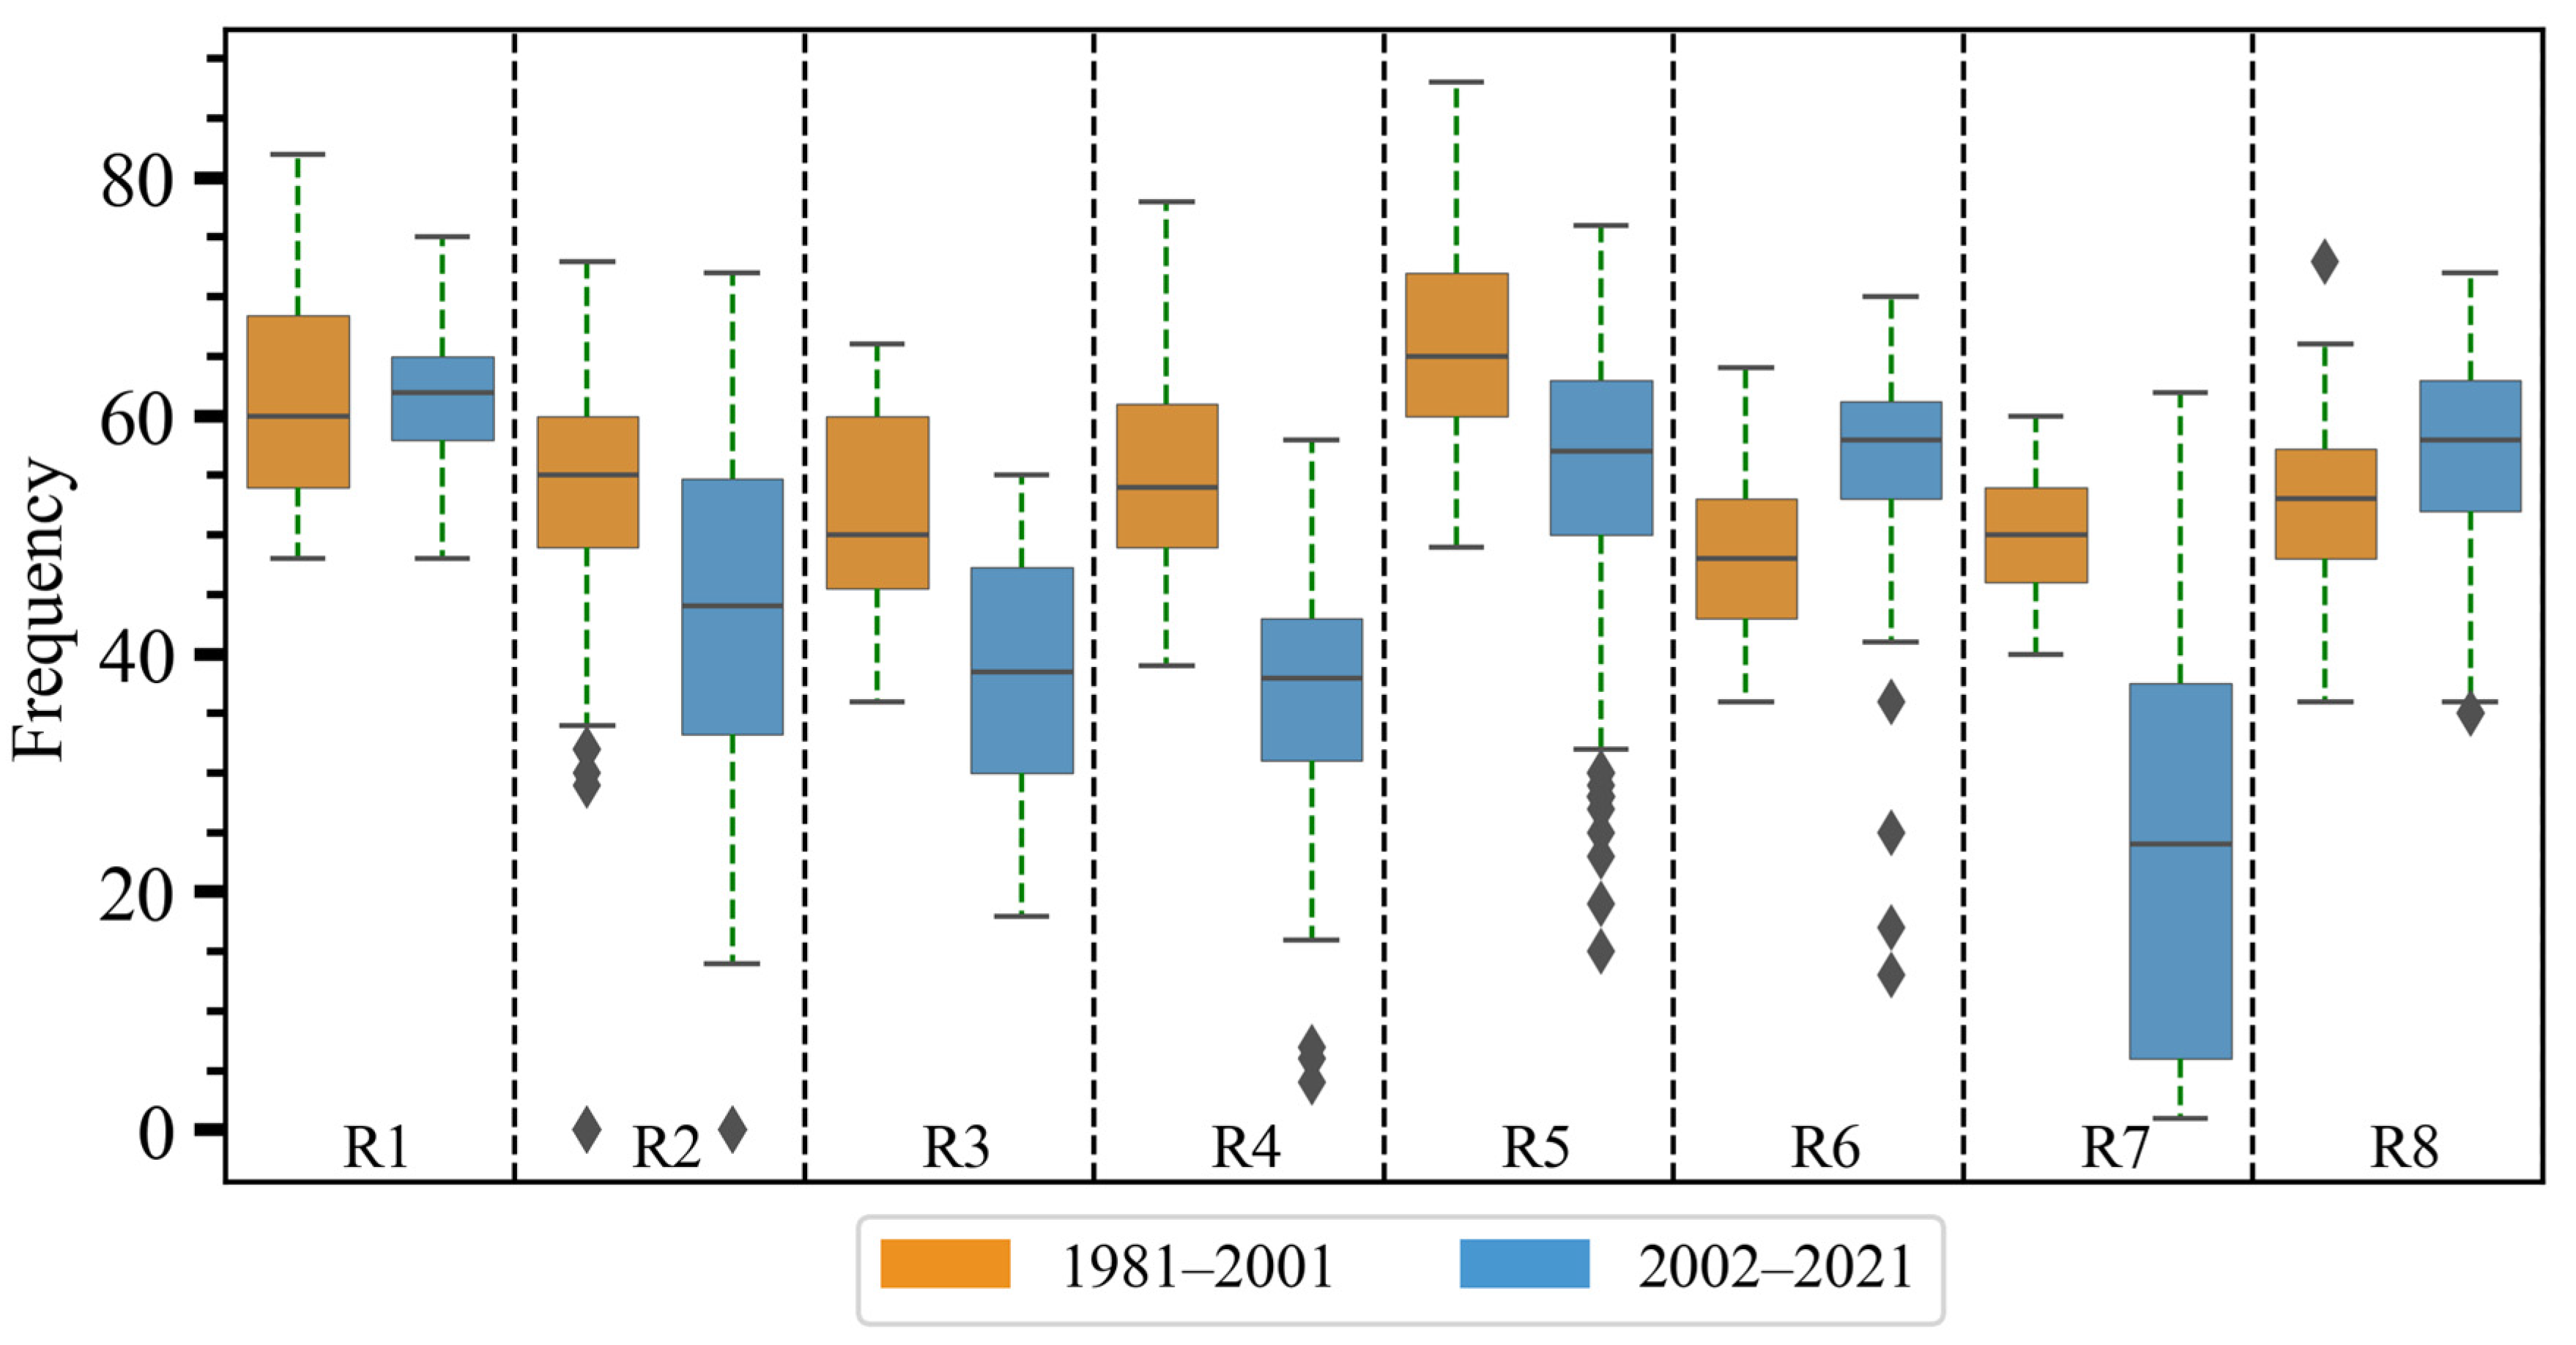
Further analysis, comparing average DF occurrences across each sub-region and timescales, is depicted in Figure 3 using boxplot diagrams and based on SPEIbase v2.8 product. The boxplots of DF across eight regions for the two periods show that the median frequency at Region 1 during 1981–2001 was 60% and increased to 64% during 2002–2021. In Region 2, the median DF was also recorded at 55%, which has declined to 44% during the last 20 years. For Region 3, it can be observed that DF declined rapidly from 50% to 35% during the last 20 years as compared to the first study period (Figure 3). It is interesting to note that Region 7 shows large variability in DF from 1981 to 2001, with the median frequency noted at 45%. This region has experienced a rapid decline in DF during the recent decade, reaching 20% from 48%. The observed episodes of drought recurrence have an overall impact on soil moisture, plant survival, and other spheres of life dependent on water availability. Generally, East Africa has continued to experience DF, with only Regions 3 and 7 showing less drought frequency during the study duration.

Figure 3.
Boxplot of DF using gridded data from 8 geographical regions of East Africa for two historical periods (1981–2001, 2002–2021).
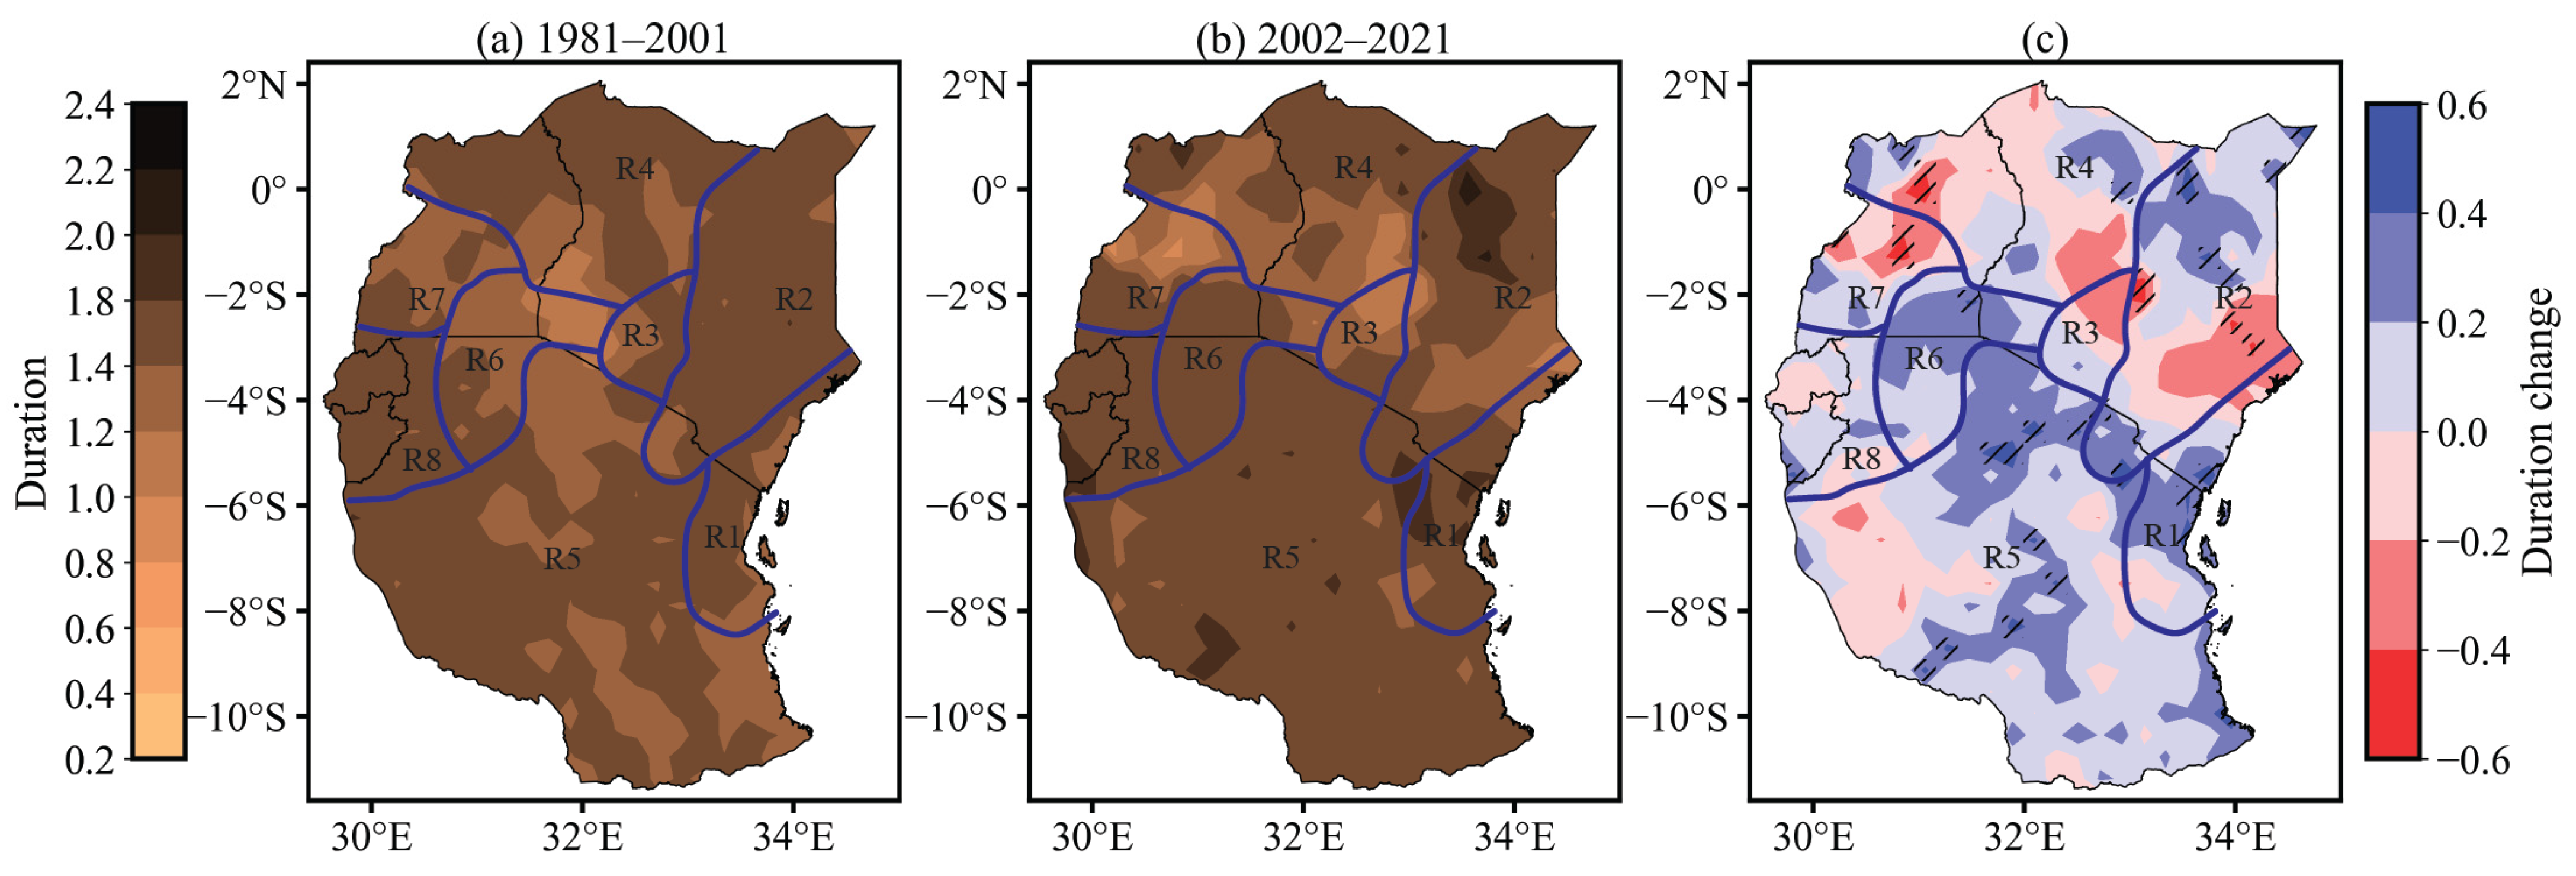
The results obtained for spatial changes in DD during 1981–2001 and 2002–2021 are presented in Figure 4a and b and Figure A2a,b. It is apparent that DD has been increasing in the study region in recent decades, with most regions recording positive changes. This is especially evident in Regions 2 and 5, which showed a notable increase in DD of up to 2.4 months of continuous SPEI-01 drought from 2002 to 2021. On the other hand, R3 and R7 show less drought duration or no notable change during both study periods. Interestingly, R1, which is mainly characterized by coastal belts, has experienced less drought duration during recent decades as compared to the 1981–2001 period (Figure 5b). On the other hand, the R8 region with a moist sub-humid climate has observed an upsurge in DD during the current climate compared to the historical period. This could be attributed to increased urbanization and reduced land cover due to degradation, which creates more space for an increased population and higher demand for agricultural land expansion. It is interesting to note that the noteworthy change in DD is depicted in the SPEIbase v2.8 product when we compare the two timescales, as shown in Figure 4c. Conversely, the CHIRPS_GLEAM product reveals insignificant DD change when compared to the differences during the two-study duration (Figure A2c).
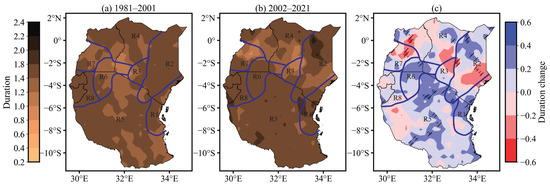
Figure 4.
Spatial distribution of DD over East Africa under the two historical periods (1981–2001, 2002–2021). The hatched area denotes the significance level at 90%. (c) Represents the duration change between the two periods (a) and (b).

Figure 5.
Boxplot of DD using gridded data from 8 geographical regions of East Africa for two historical periods (1981–2001, 2002–2021) [month].
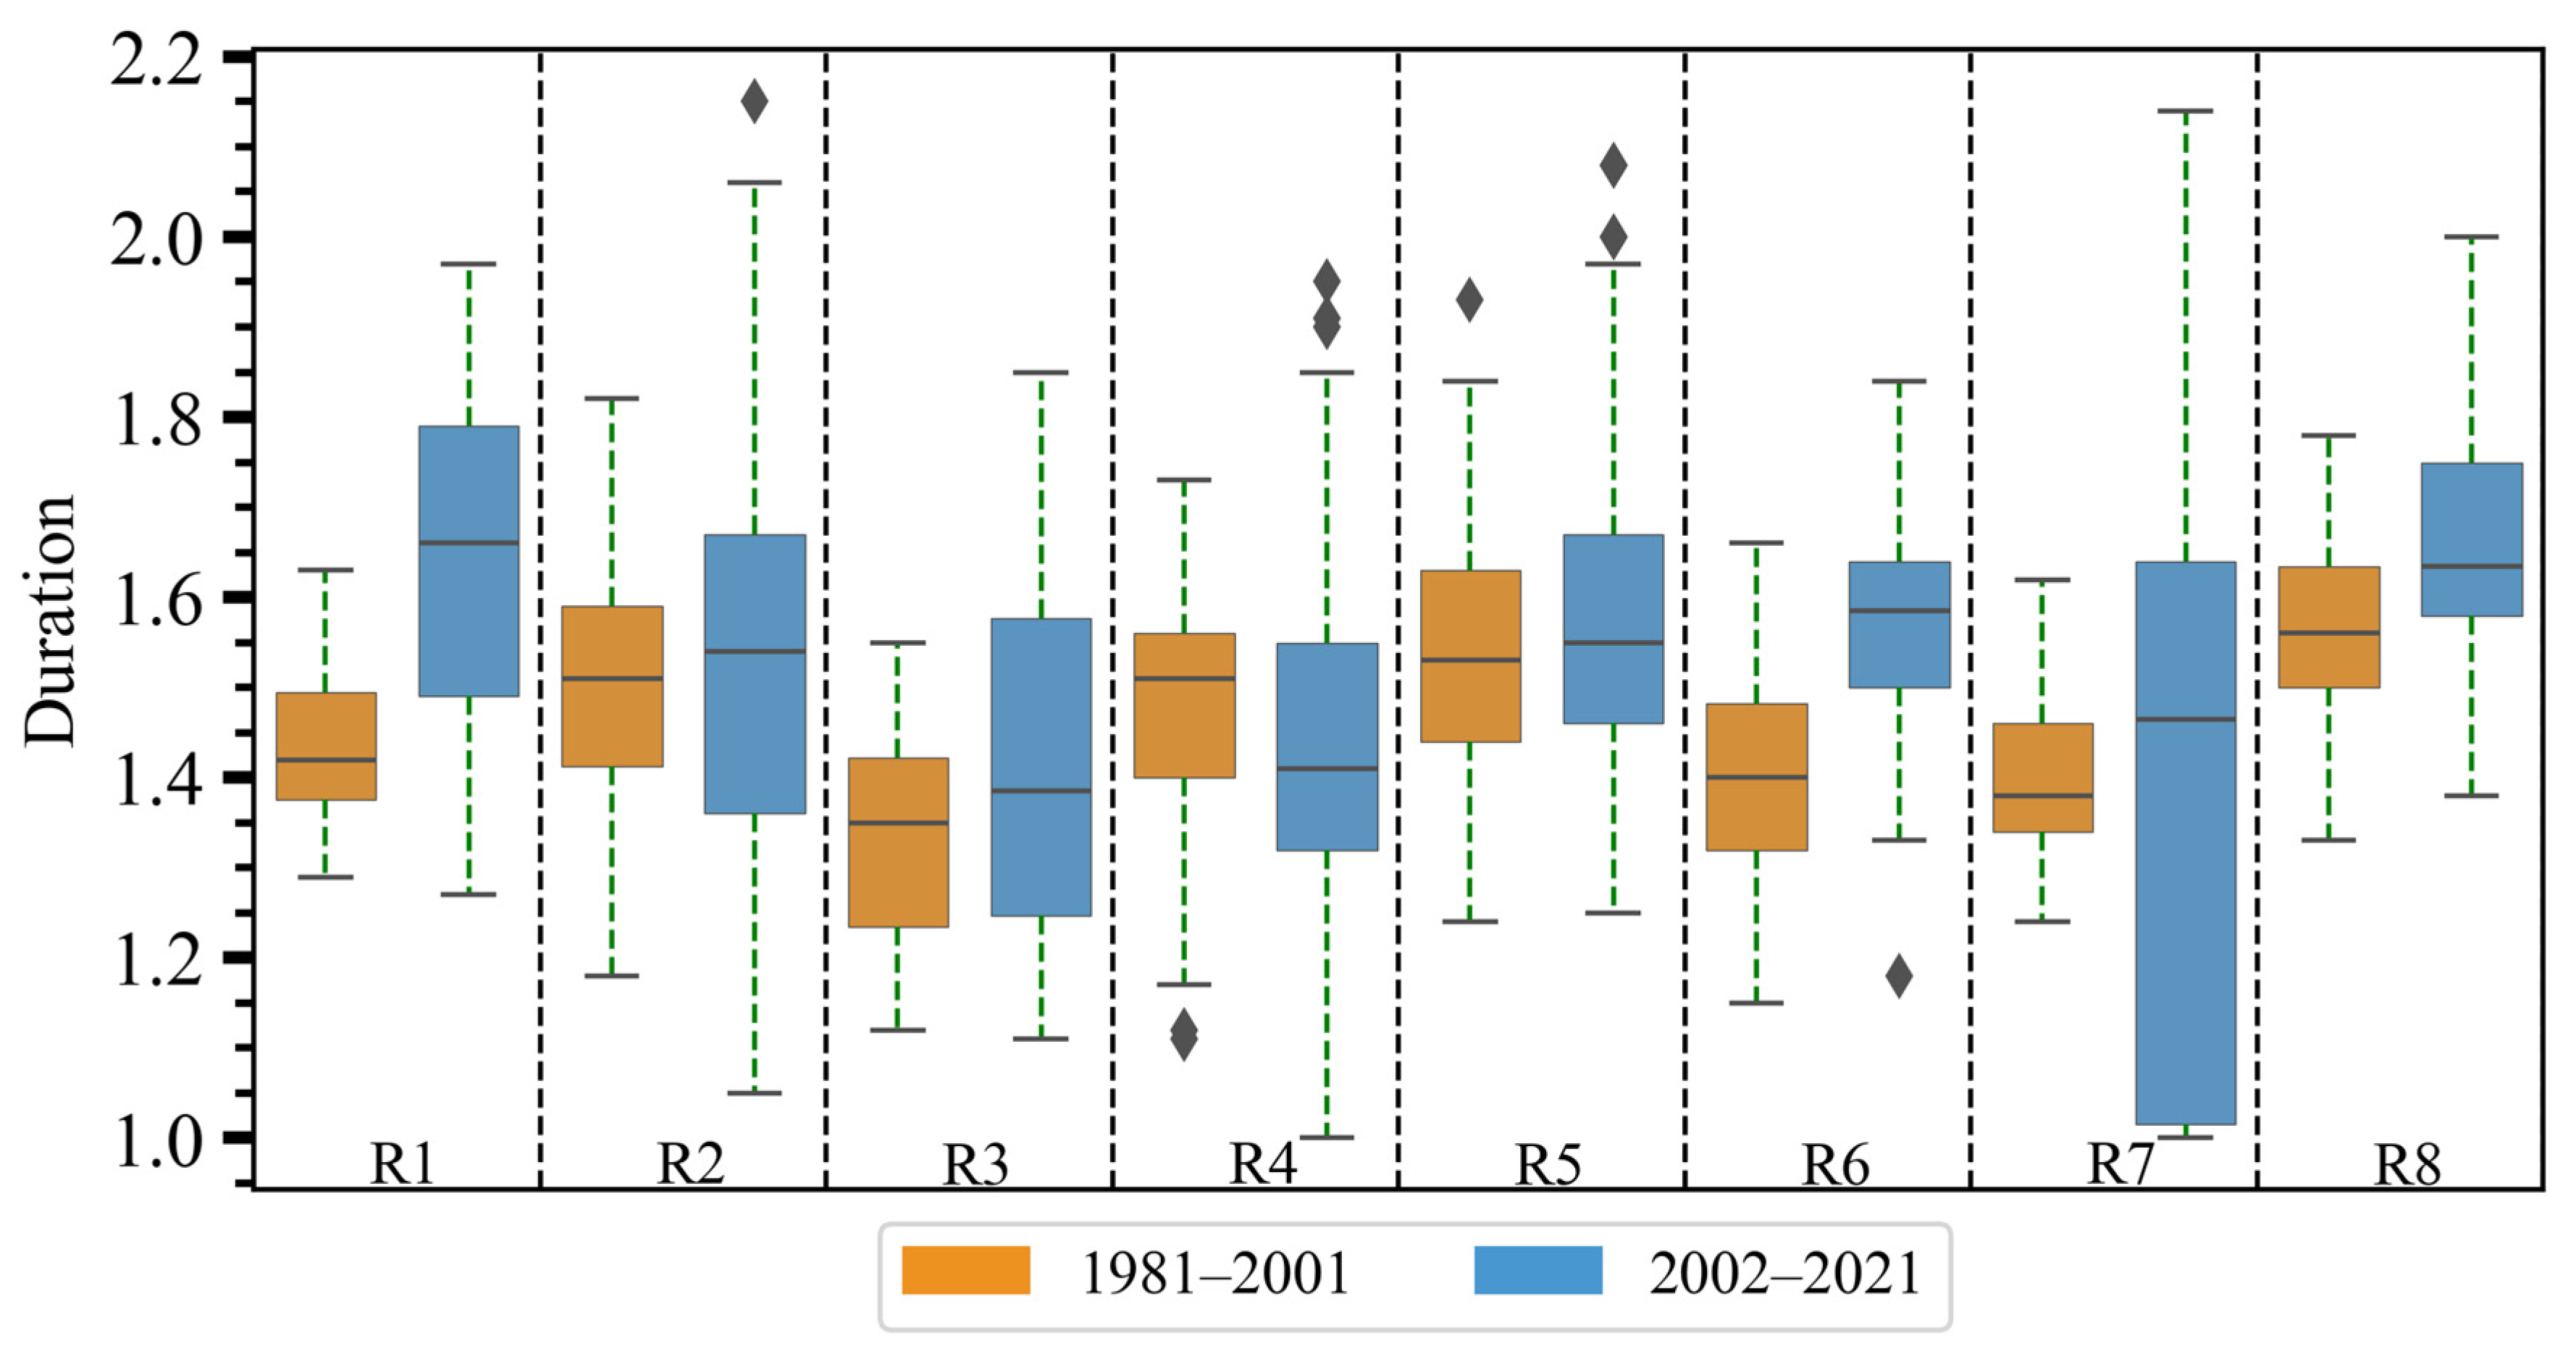
Further analysis based on a boxplot that averaged DD from each grid of the different climate zones shows varying occurrences of DD across the study region (Figure 5). For instance, R1 shows an increase in DD from 1.4 to 1.6 months during the last decade. On the contrary, R4 shows a decline in DD during recent decades as compared to the first study period. Generally, most regions show longer DD during the recent study period than in the first decades. Remarkably, R7 depicts large variability in DD during the recent decade, with a median value of 1.45. Overall, the effect of drought occurrences over the region is not homogenous, as some regions experience longer DD and DF than other locales.
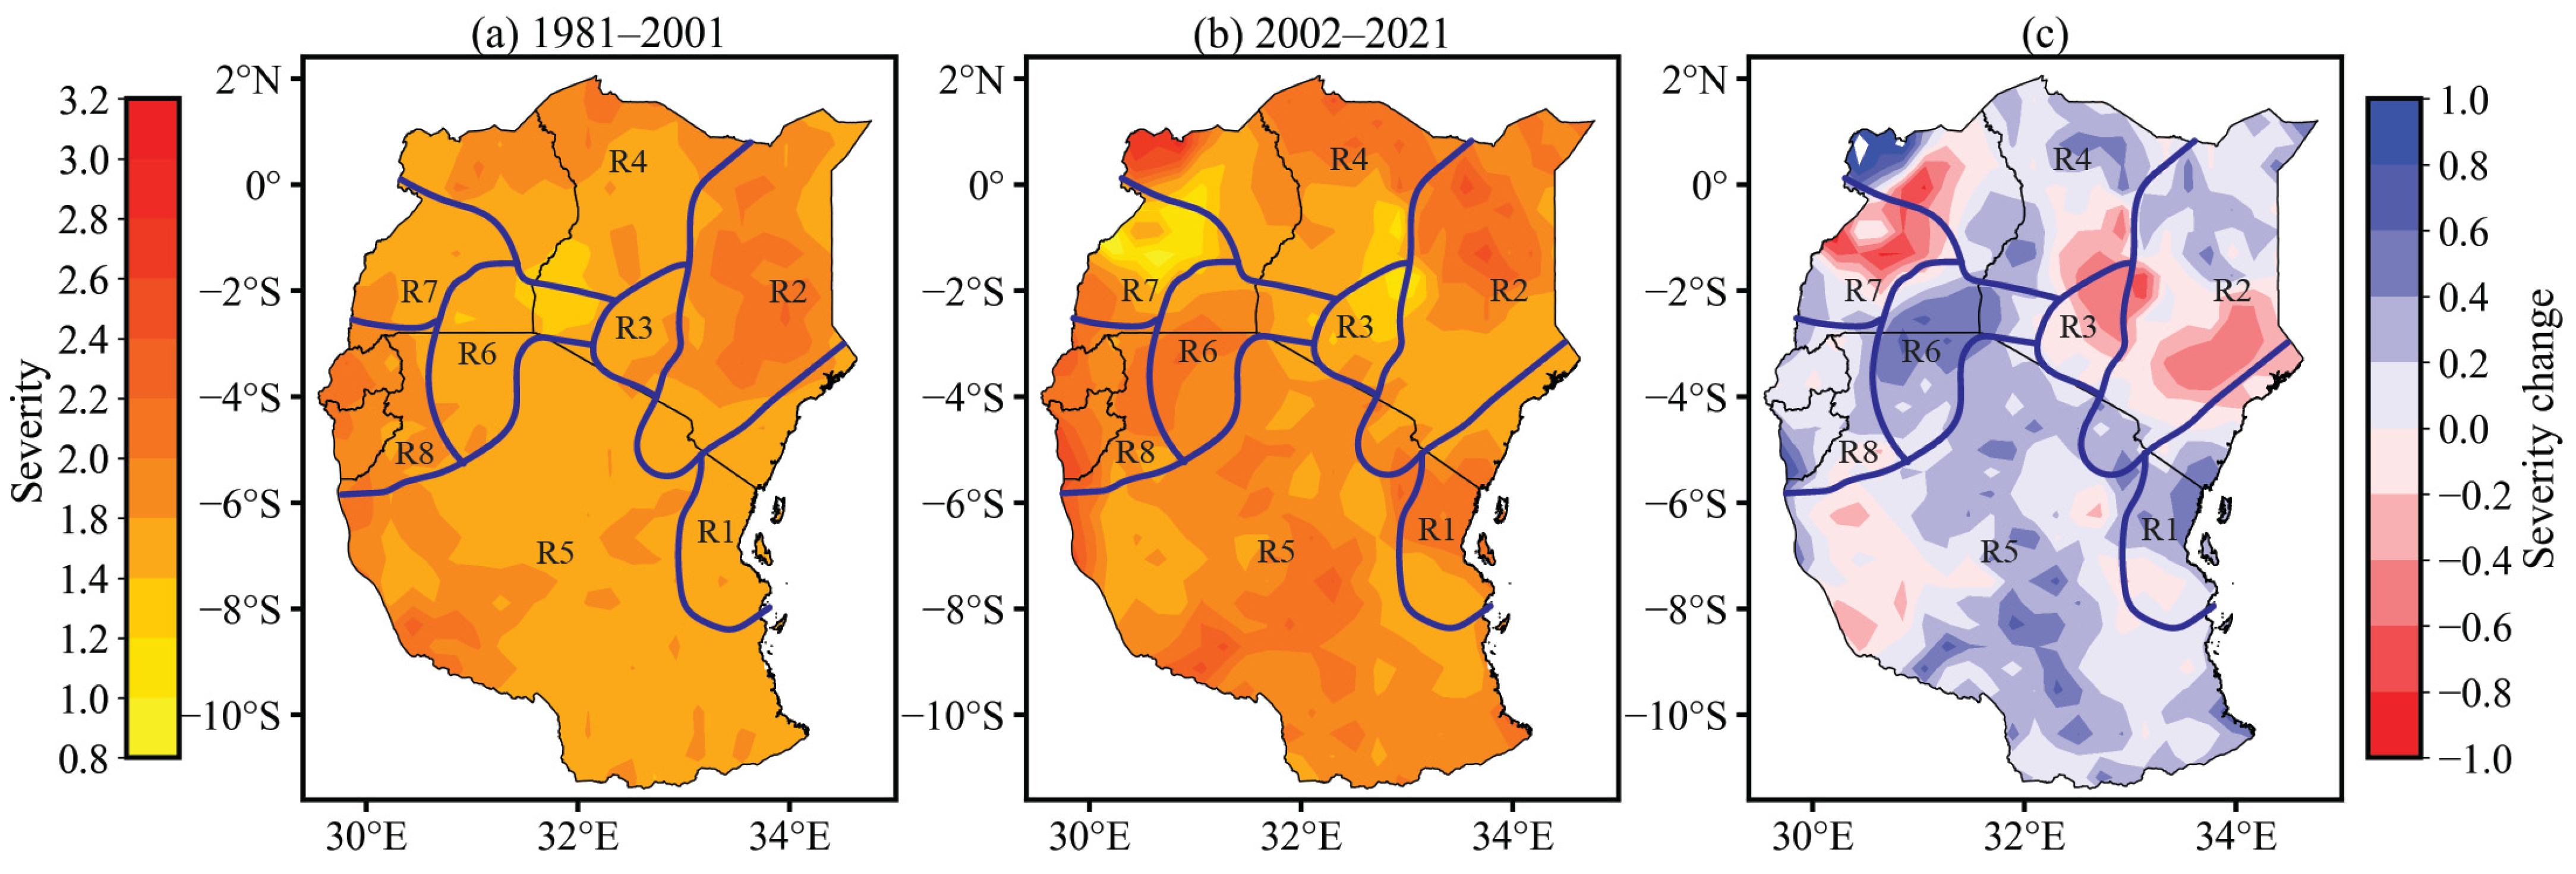
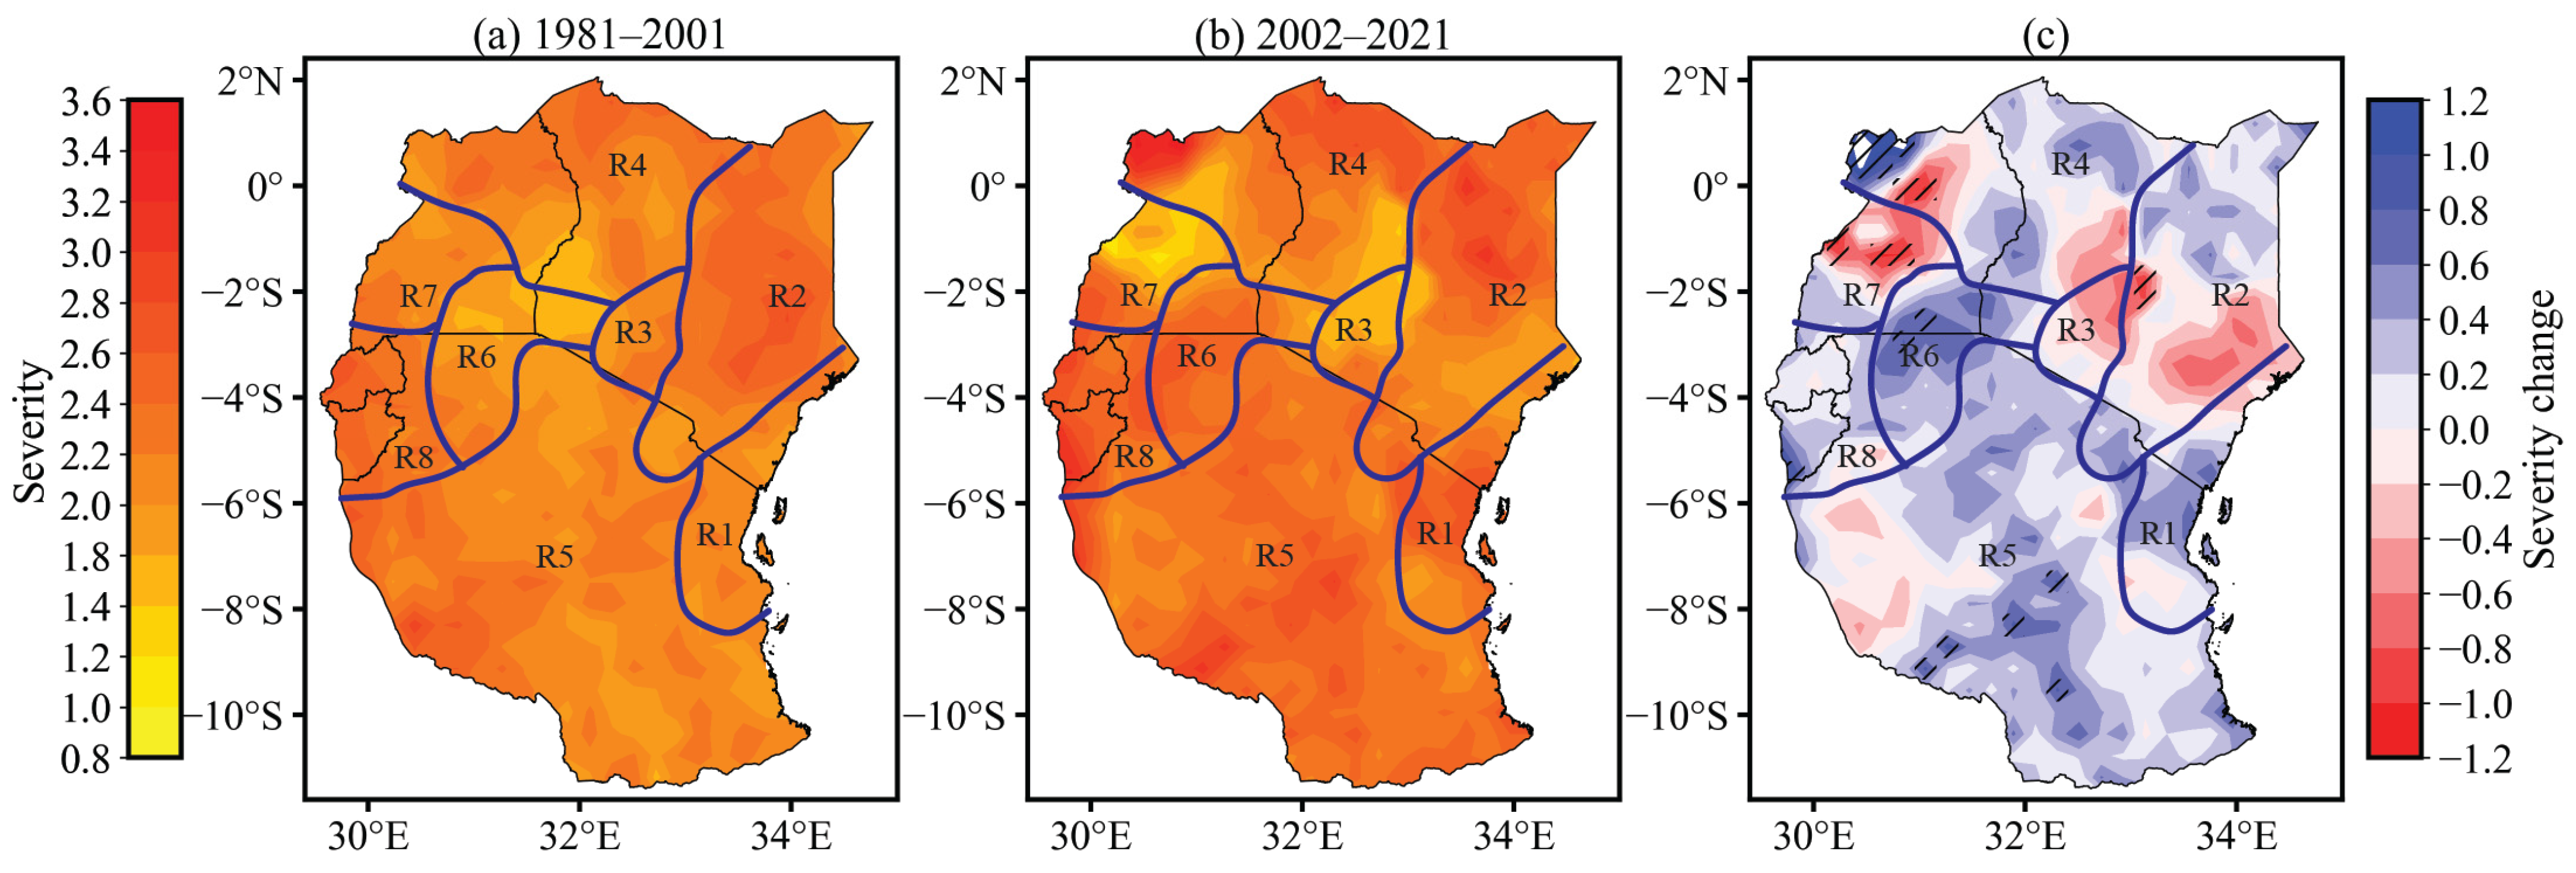
Finally, the study quantified the severity of recent drought evolution over different homogenous climate zones to analyze the magnitude of its effect during the last 40 years. Figure 6a,b, and Figure A3a,b show the spatial distribution of DS, while Figure 7 depicts average changes across all the eight regions distributed to represent diverse climate zones. The cumulative totals of SPEI thresholds below −1 on the duration extent over the study region show notable incidents of remarkable occurrences of DS across various regions. This is particularly evident in the SPEIbase v.2.8 data as compared to the CHIRPS_GLEAM SPEI dataset. Higher values of severe drought episodes (−2.8) are noted across the R2, R5, and R8 regions (Figure 6a,b and Figure A3a,b). These regions are mainly characterized by the ASAL climate, which experiences very little precipitation, higher temperatures, increased wind speed, and enhanced evapotranspiration. During the first twenty decades, less DS of 0.8 to 1.4 was recorded, especially across the R1, R3, and parts of the R6 region. However, these regions recorded an upsurge in the observed severity of drought during 2002–2021. Considering the changes in DS during different timescales and different regions, it can be observed that a significant occurrence of DS is detected in SPEIbase v2.8 products, particularly over R7, southern parts of R5, and towards the border of R3 and R2 (Figure 6c). Similar to DF and DD, analysis of possible significant occurrences of DS during the two periods exhibits insignificant change at a 90% significant level based on two-sample t-tests as depicted in the CHIRPS_GLEAM product (Figure A3c).

Figure 6.
Spatial distribution of DS over East Africa under the two historical periods (1981–2001, 2002–2021). The hatched area denotes the significance level at 90%. (c) Represents the severity change between the two periods (a) and (b).
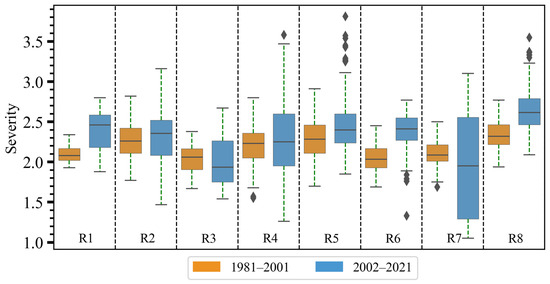
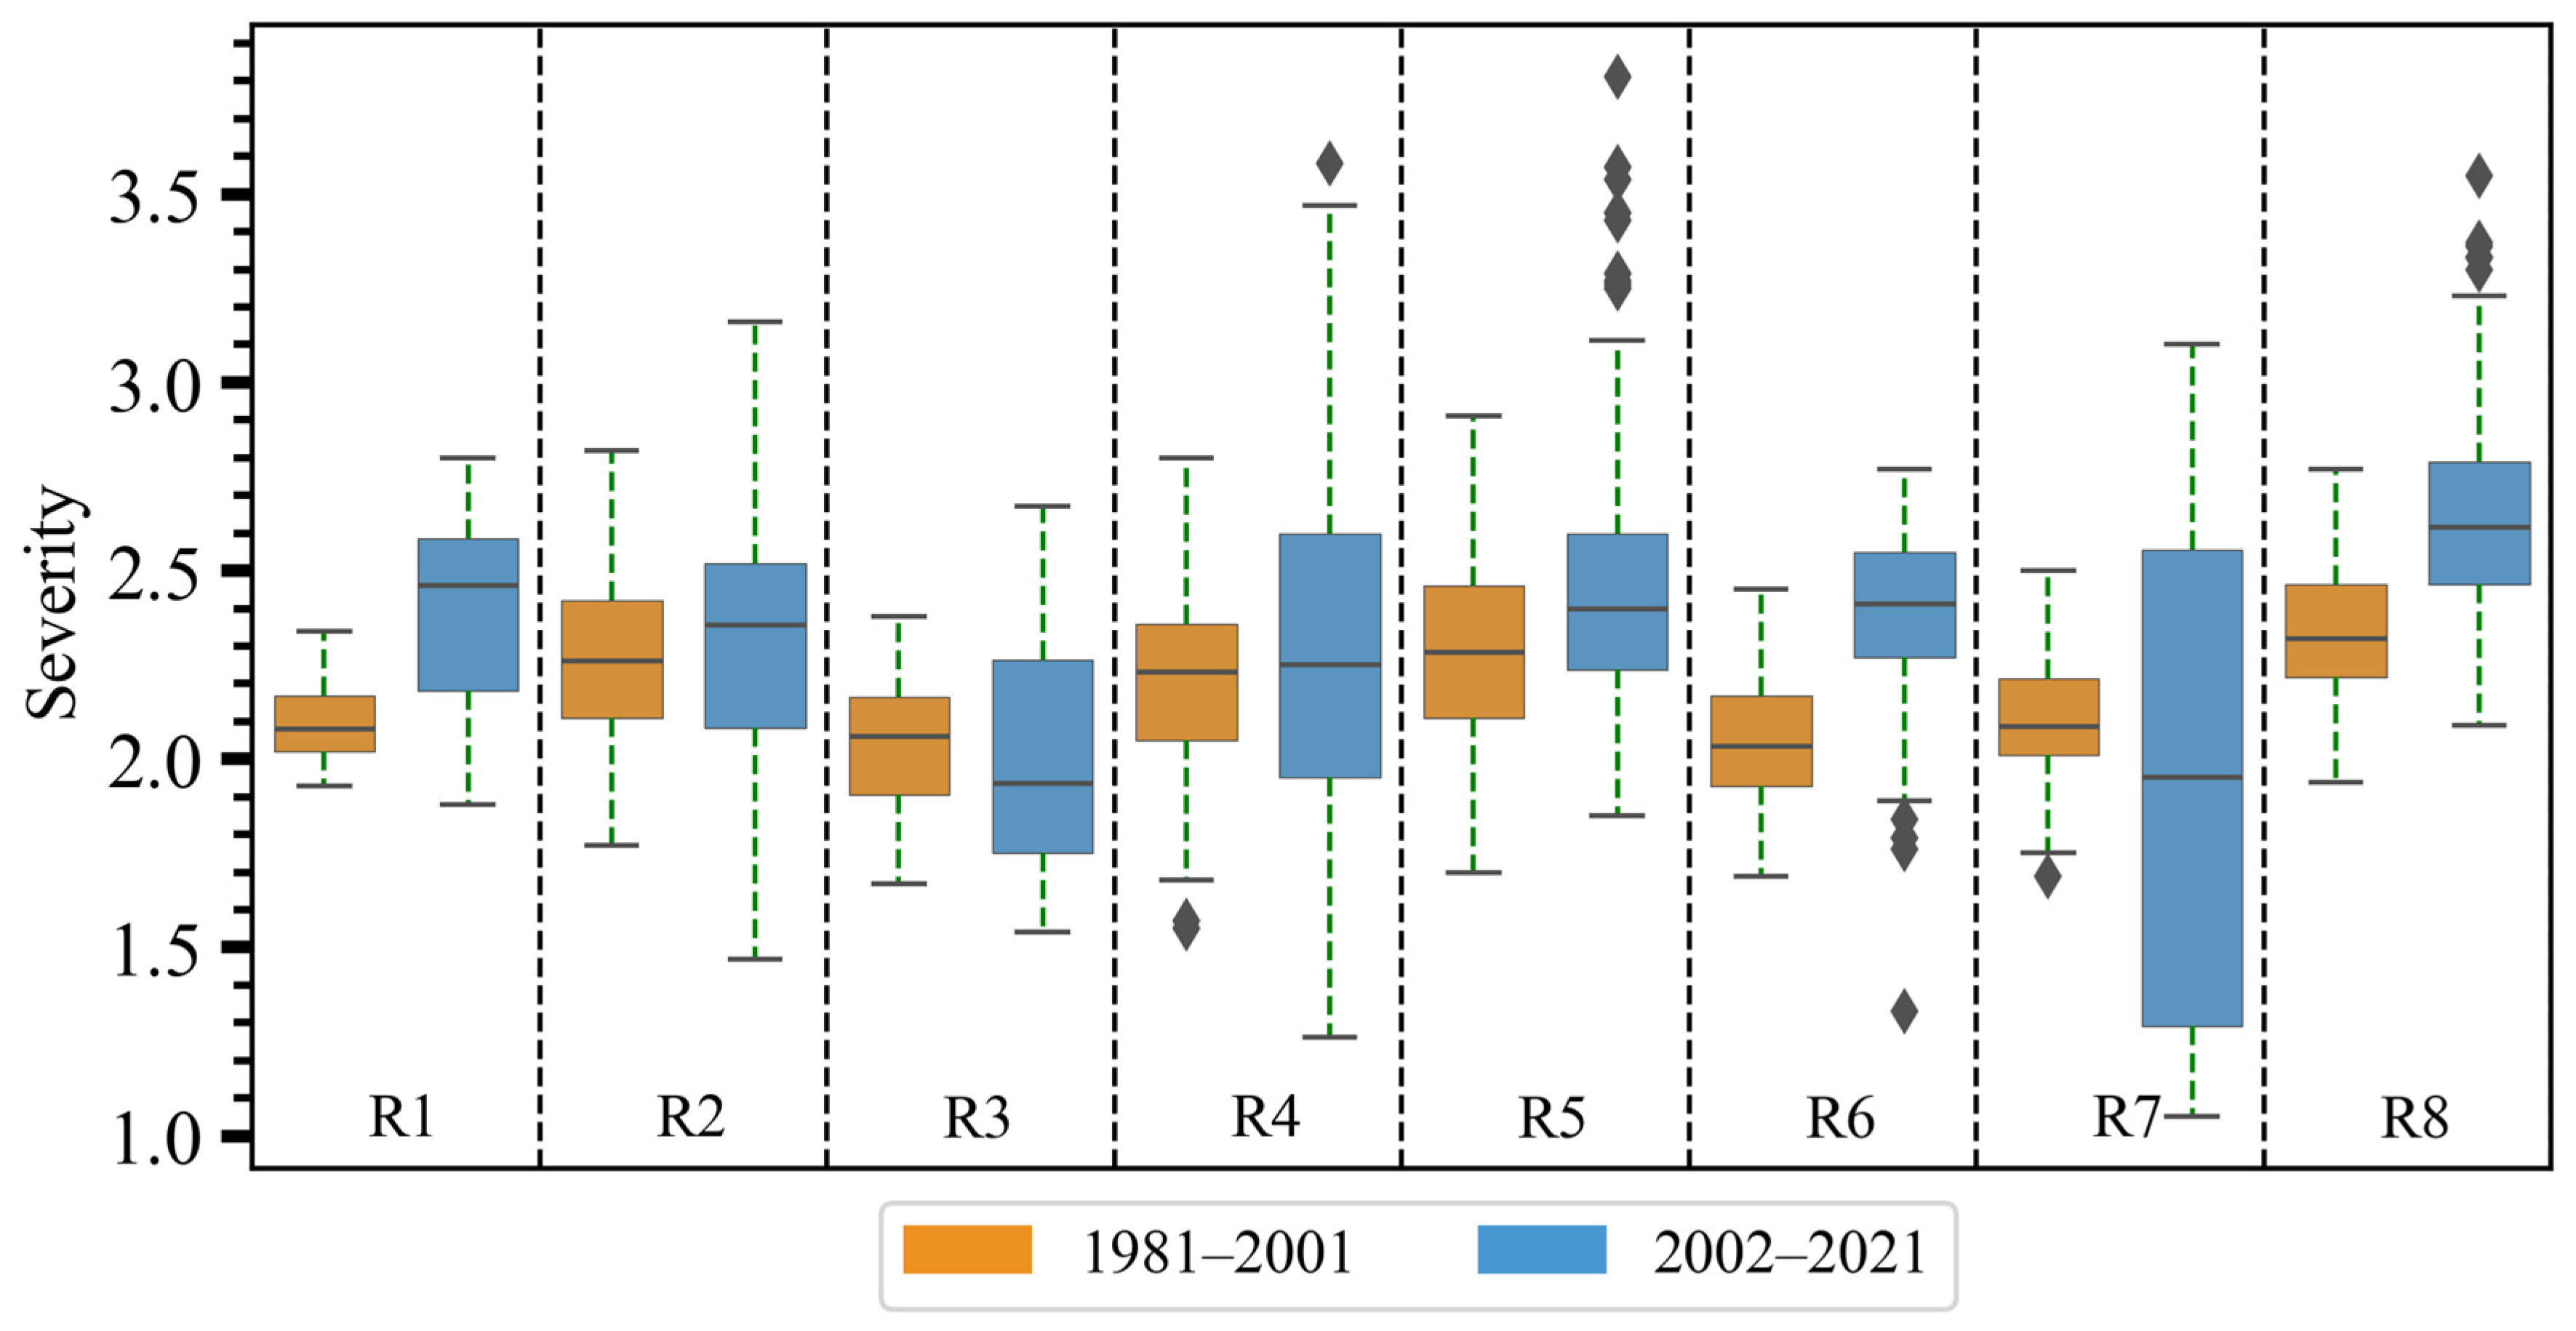
Figure 7.
Boxplot of DS using gridded data from 8 geographical regions of East Africa for two historical periods (1981–2001, 2002–2021).
Further comparison of the difference in the two time periods based on boxplot analysis shows varying changes along different sub-regions, as demonstrated in Figure 7. The median value for DS at R1 is 2.1 for the timescale 1981–2001, while during 2001–2021, it increased to 2.4. This shows a higher increment of up to 0.3 during the last twenty years. Small variability is observed at the R4 and R3 domains during the two scales, with a median value of 2.2. However, compared to other regions, R7 shows a large uncertainty in the occurrence of DS during the recent timescale as compared to the previous period. Overall, the East Africa region demonstrates evidence of drought footprints in terms of DD, DF, and DS, with pronounced changes relative to the past climate during recent decades. Nevertheless, some regions depict recovery patterns with reduced drought effects during recent decades compared to the historical period. This shows higher variability in drought incidents due to precipitation anomalies, temperature variation, and potential evaporation changes. The regions that consistently indicate a higher magnitude of drought effects are likely to suffer from water sustainability, which calls for a deeper analysis of the probability of success or failure of water resources and the rate of recovery from drought effects, as well as quantifying the expected consequences of being in drought-prone states for a more extended period.
3.2. Aggregated Reliability–Resiliency–Vulnerability Index (RRV)
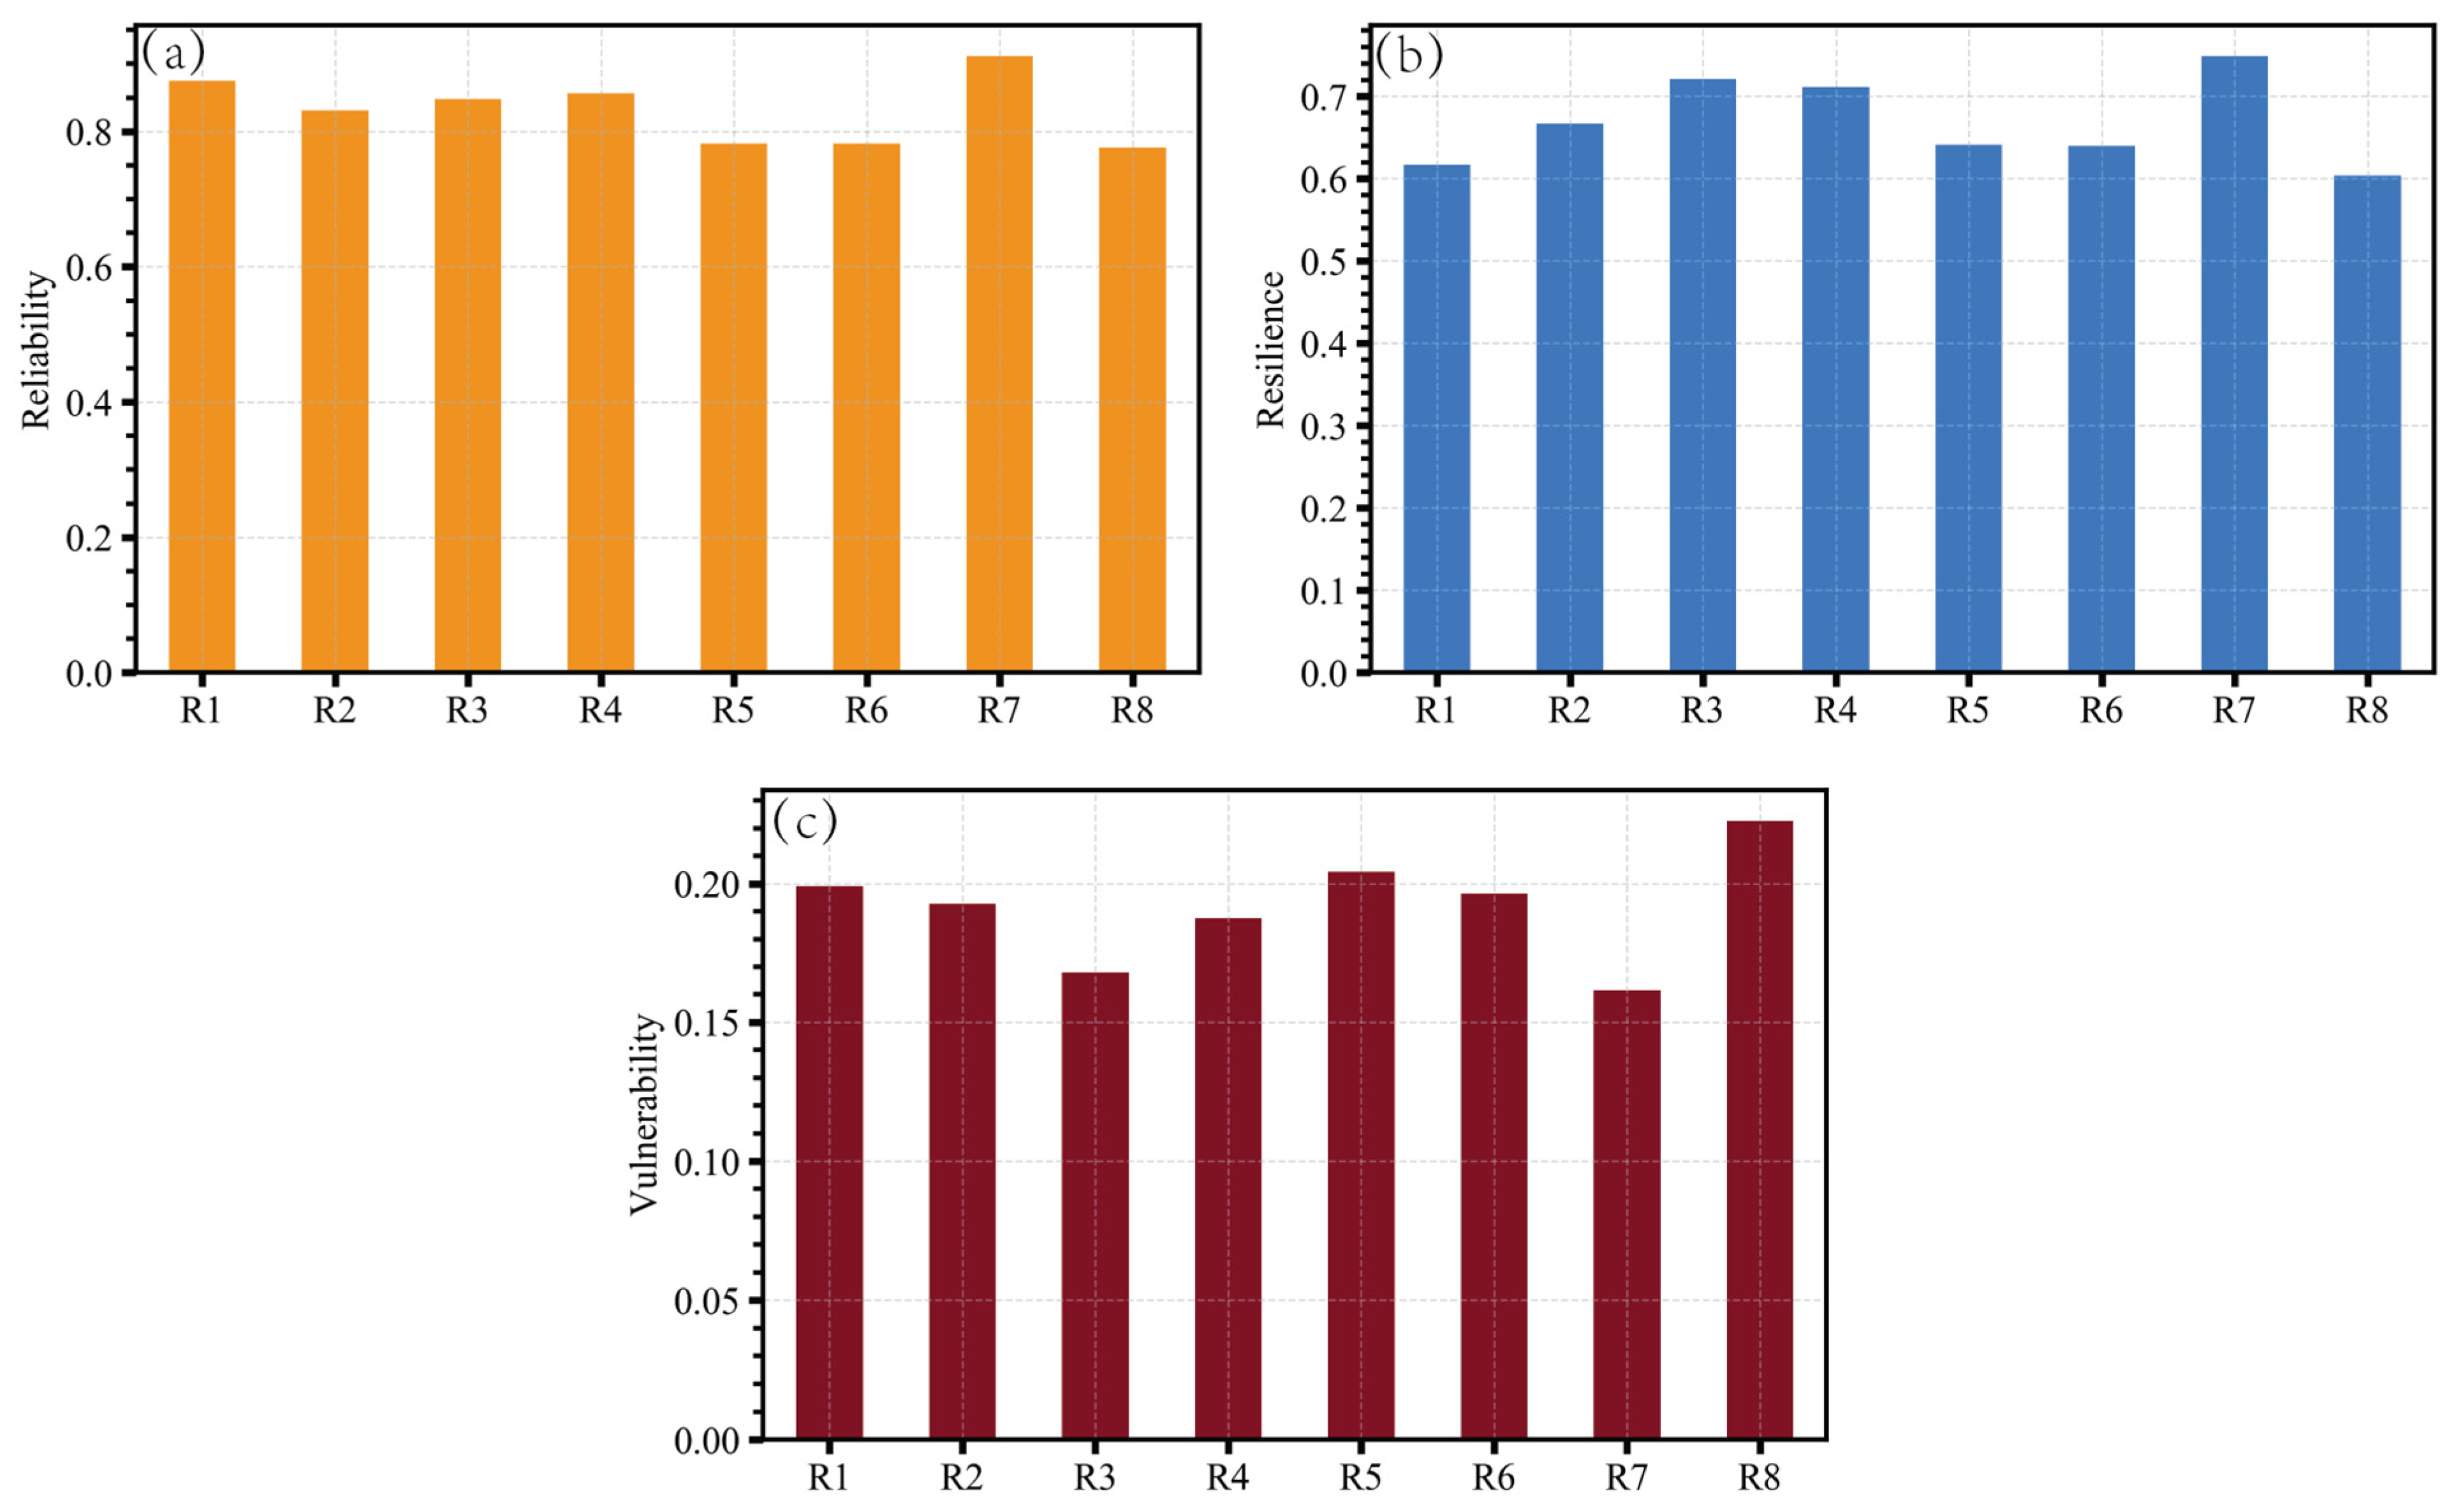
As the last step, the study analyzed the overall regional environmental health sensitivity to the observed drought events that have been experienced over the past few years based on SPEIbase v.2.8 datasets. This is because it depicted stronger signals of drought episodes over the study region than the CHIRPS_GLEAM products. The RRV index was used to determine how the region could withstand the impact of drought, how it could recover, or the overall consequences that might call for urgent actions to save livelihoods. Considering the reliability aspect (non-failure state), it can be noted from the analysis in Figure 8a that the majority of climate zones in East Africa depict relatively higher values despite the drought episodes. Moreover, the ability to recover from the drought effect, as indicated in Figure 8b, indicates that R3 and R7 are most resilient as compared to other locales. Conversely, Region 8 calls for closer monitoring as it depicts low resiliency to the shocks and impacts of drought. This is further evident by the higher values of the vulnerability index, as shown in Figure 8c.

Figure 8.
The average reliability (a), resilience (b), and vulnerability (c) of droughts in 8 geographical regions of East Africa during the period 1981–2021.
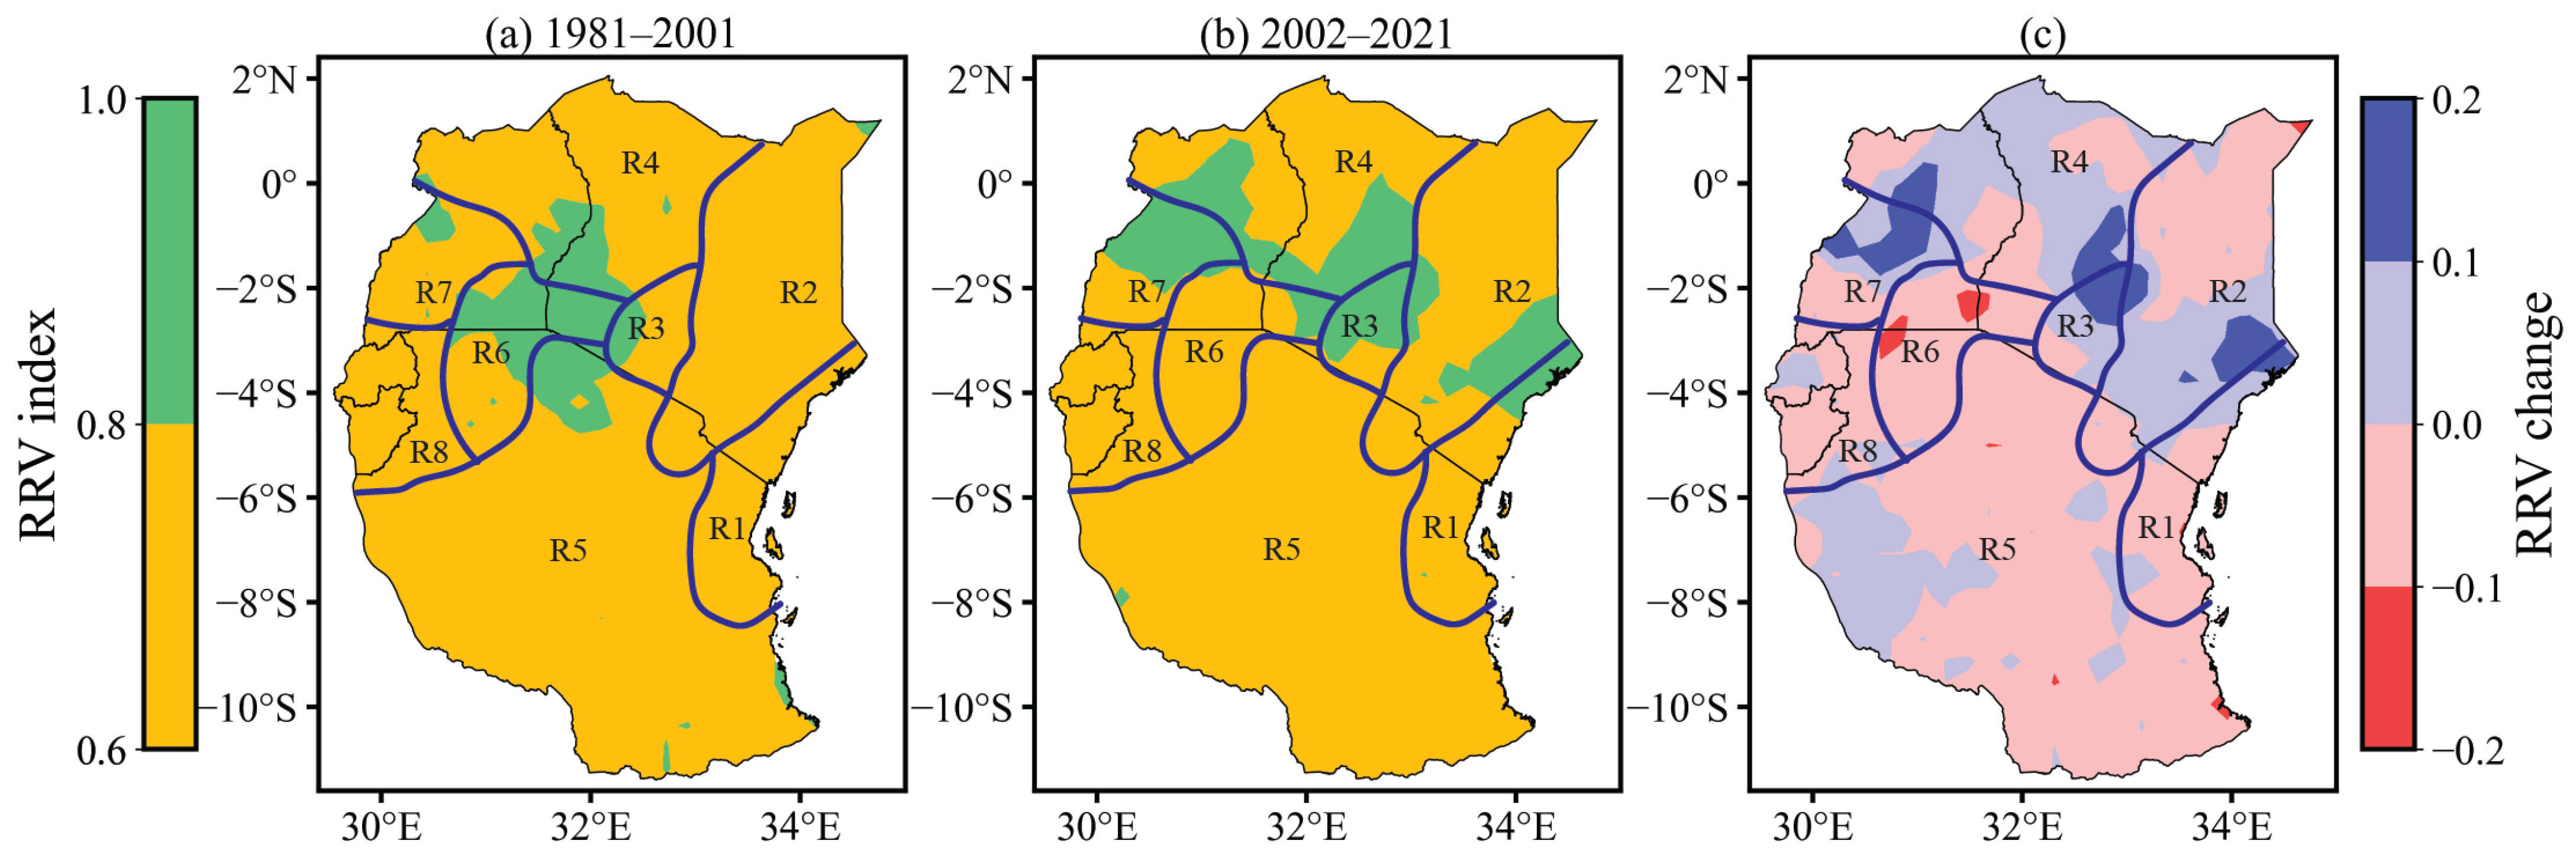
Consequently, the three indices are aggregated to examine the sustainability of the environment through the RRV framework, as presented in Figure 9a,b and Figure 10, respectively. Notably, it can be seen that RRV during the two study periods ranges from 0.6 to 0.8 and from 0.8 to 1.0. Regions 3 and 7 show noteworthy higher RRV values during the study period. This indicates that the sustainability index for these regions of East Africa is classified as high to very high, thus presenting a less vulnerable condition. Generally, most zones show RRV of 0.6 to 0.79, while parts of R1 (coastal belt region), R3 (highland and mountainous zone), and R6 (Lake Victoria belt) show RRV between 0.8 and 1.0 (very high). Comparing the spatial variance of RRV change during the two periods on how it has evolved and if the change is significant or otherwise, our analysis reveals that it has experienced positive but insignificant change along R2, R3, and R7 while lower to negative values of RRV values along R5 and R6, respectively (Figure 9c).

Figure 9.
Spatial distribution of the aggregated Reliability–Resiliency–Vulnerability (RRV) index estimated across 8 regions in East Africa under the two historical periods (1981–2001, 2002–2021). The hatched area denotes the significance level at 90%. (c) Represents the RRV change between the two periods (a) and (b).
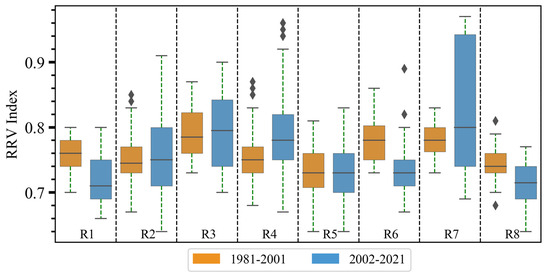
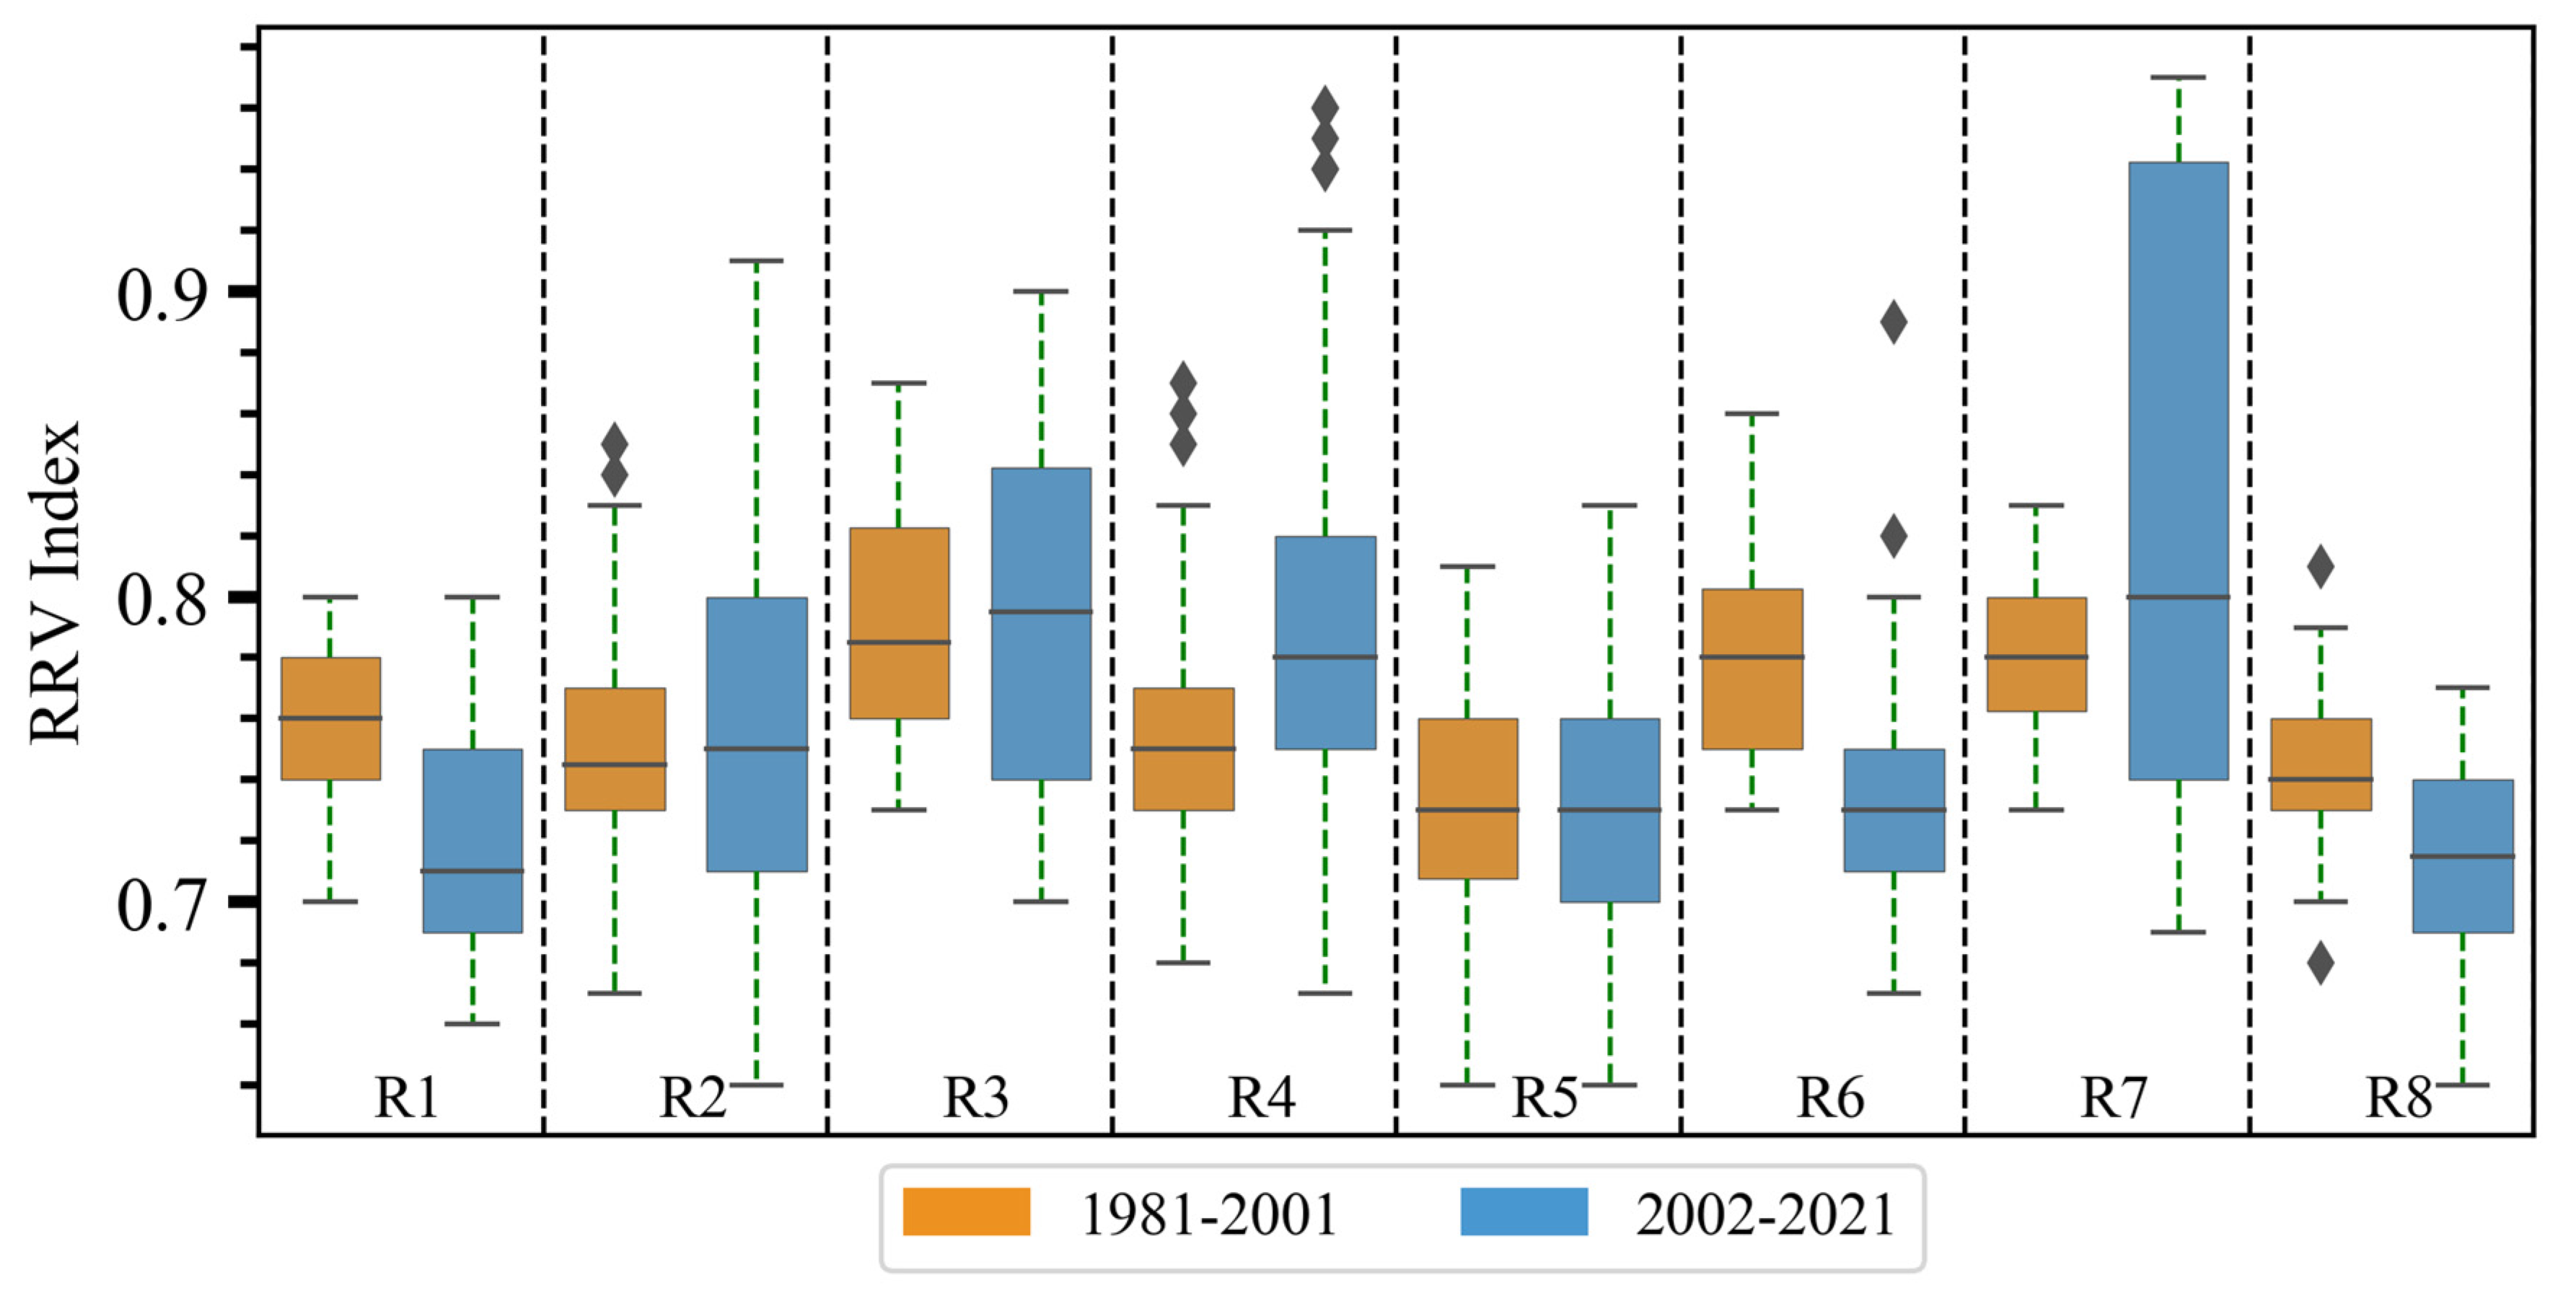
Figure 10.
Boxplot RRV using gridded data from 8 geographical regions of East Africa for two historical periods (1981–2001, 2002–2021).
Further analysis for each sub-region based on boxplot analysis shows a varying median range and distribution of the RRV index. For instance, Region 1 experienced a lower RRV with a median value of 0.76 from 1981 to 2001. However, the region has since recorded a decline in RRV to 0.70 during the recent period. A larger improvement in the RRV median is noted in R4 from 0.74 to 0.78 during the two timescales. This indicates better practices in water resource management and less drought impact, especially over the last twenty years. Region 5 exhibits a minor margin shift of RRV value in both study durations. Interestingly, Regions 1, 6, and 8 depict a noteworthy decline in RRV value, especially during the recent climate compared to 1981–2001. This necessitates immediate action to enact enhanced policies before further deterioration, which may result in outcomes that are inferior to those identified in the present study. Overall, the present study’s findings show a distinct variation in the RRV index over East Africa.
4. Discussion
In an attempt to quantify the effect of recurrent drought episodes on water sustainability over the East Africa region and seasonal rainfall failure, the study employed the concept of RRV [30], which aids in evaluating the performance of water resource systems. The East African population has experienced the detrimental impacts of all facets of drought (meteorological, hydrological, and agricultural) events during the past historical periods [14,15,46,47]. Considering the centennial timescales, drought episodes are reported to have amplified over the East Africa region from the 1990s to recent periods due to an abrupt decline in March to May rainfall [48]. Consequently, numerous drought events have been observed in diverse years, such as 2005–2008, 2010–2011, and even recently in 2022 [38,46,47,48]. The resultant impact on the economy, livestock, agriculture, and water resources is colossal, as previously estimated by the World Food Program. A recent study by [49] estimated that the drought event of 1980–2000 affected agriculture with losses amounting to USD 370 million. To this end, there is an urgent need to examine how the region is capable of enduring the ever-recurring droughts (reliability), how rapidly it recovers and regains from the drought effects (resiliency), and how severe the impact of the drought can be on resources (vulnerability).
To achieve this objective, the study first assessed the evolution of drought characteristics, such as DF, DD, and DS, which are useful in computing the RRV index. Following a recent study [50] that reported larger disparities amongst different datasets in representing drought events, the present study employed two different products in a bid to account for uncertainty in drought signals over the study region. Thus, the current study employed drought SPEI products sourced from open-source drought datasets of SPEIbase v.2.8 and CHIRPS_GLEAM datasets. The findings reveal varying changes in DF with SPEIbase v2.8, showing that the region has experienced up to 80% DF (Figure 2a,b), while CHIRPS_GLEAM products revealed lower values of DF at 70% (Figure A1a,b). However, in agreement with a recent study [50], the uncertainty in change is detected in the study established to show how large the change was between the two time periods, with findings showing substantial change along R7 and R3 in SPEIbase v2.8 products and insignificant in the CHIRPS_GLEAM products (Figure A1c). The study recommended the use of an ensemble to represent the drought change across different sub-regions to minimize the disparities among different products. Overall, it can be noted that some sub-climate zones in East Africa have suffered more frequent events (Figure 3). The findings align with previous studies that appraised the drought features and reported heightened drought frequency [51,52]. Moreover, analysis of DD established that most regions recorded an increase in drought duration during the recent decades as compared to previous decades, except for R4 (Figure 4 and Figure 5). Reference [53] established that the negative Indian Ocean Dipole was responsible for these dry conditions, especially the longest duration in 2021. On the other hand, [54] attributed the DD to the sea surface temperature anomalies along the tropical Pacific and Indian Ocean, leading to an extended DD during the October to December rainfall season. Lastly, the analysis of DS showed noteworthy severity of drought events along the R1 and 8 domains in comparison to other sub-climate zones during the current climate (Figure 6). Conversely, lower values of DS were reported across R3 and R7 during the period 1981–2001 (Figure 7). These findings, as they agree with all existing studies on drought analysis over East Africa, call for the need to estimate the impact on available water resources for better mitigation and adaptation policies. Meanwhile, studies that focused on drought impacts on different water basins did not consider their reliability, resiliency, or vulnerability [17,19,55,56]. Many studies have recently applied the RRV framework to quantify drought impacts, develop drought mitigation measures, and formulate watershed management plans. For instance, using soil moisture data, [31] characterized drought-proneness alone in the Malaprabha river basin in India. The study reported an increasing pattern (positive RRV) with an indication of decreasing RRV trends decades later. Across three distinct watersheds in Ireland, Portugal, and Iran, [23] estimated the variability of RRV concerning drought patterns and established a notable upsurge in vulnerability indicators. Similar analysis has been conducted across other regions of the globe [33,34,35].
Employing the RRV framework over the East Africa region to determine how the region can cope with the effects of drought revealed a median range of RRV of 0.61 to 0.80, indicating a sustainable situation during the study period. This indicates that despite the recorded drought incidences, the water catchments of lakes, rivers, and major water towers are not threatened and, thus, less vulnerable. Despite the robust analysis conducted for the present study, a few limitations are noted, thus calling for further improvement. The study did not consider future drought changes in the wake of global warming. Consequently, future studies should consider the changeability of RRV indicators concerning drought in future climates and also consider employing many variables, such as groundwater and surface water, to better understand the conclusions leading to sustainable levels of watershed health.
5. Conclusions
The analysis presented in this study provides valuable insights into quantifying drought impacts using the Reliability–Resiliency–Vulnerability (RRV) framework over East Africa. By examining drought characteristics, including DF, DD, and DS, it becomes apparent that the region has experienced significant variations in drought patterns over the past four decades. The findings reveal that East Africa has experienced recurrent drought events, with some regions showing higher susceptibility than others. It is worth noting that the different drought products show varying signals of drought events, which calls for identifying products that show closer values of drought events as observed in situ or employing an ensemble of different products to minimize uncertainty. Moreover, the disparities amongst different products in capturing drought signals call for employing an ensemble of different drought products or utilizing different datasets to account for drought presentation uncertainty. Generally, Regions 1 and 8 showed more frequent drought occurrences compared to other regions, indicating a heightened vulnerability to drought conditions. Moreover, there has been an increasing pattern of DD over recent decades, particularly in Regions 1, 6, and 8. Furthermore, the severity of drought episodes has intensified in certain climatic zones, notably Regions 2 and 5, characterized by arid and semi-arid climates. These regions experienced severe droughts with limited precipitation, higher temperatures, and increased evapotranspiration, highlighting the challenges faced by communities reliant on these systems. Notably, R7 exhibited the largest variability in drought characteristics during recent decades compared to earlier decades. Amidst these concerning trends, certain regions demonstrate signs of recovery from historical drought impacts (R3), underscoring resilience to adverse climatic conditions. Importantly, this study emphasizes the significance of incorporating reliability, resiliency, and vulnerability considerations when assessing drought impacts, as traditional analyses may overlook critical aspects of resource management. The application of the RRV framework reveals a relatively sustainable situation during the study period, suggesting that major water catchments remain less vulnerable despite recorded drought incidences. The region’s capacity to endure recurrent droughts (reliability) may be ascribed to the replenishment of soil moisture resulting from precipitation events, notably during the October to December season when rainfall is influenced by the positive Indian Ocean Dipole mode or during El Niño-Southern Oscillation (ENSO) events, which deliver substantial rainfall to replenish the land following periods of drought.
In conclusion, it is essential to acknowledge the study’s limitations, including the absence of consideration for future drought changes in the context of global warming and quantifying the exposure to the observed drought incidences. Future research efforts should strive to address these limitations by integrating additional variables such as groundwater and surface water dynamics while also evaluating the variability of RRV indicators in the face of projected climate changes.
Author Contributions
Conceptualization, B.O.A. and Z.H.; methodology, Z.H. and H.B.; software, H.B.; validation, B.O.A.; formal analysis, B.O.A.; investigation, B.O.A. and H.B.; resources, A.R.; data curation, Z.H. and H.B.; writing—original draft preparation, D.A., K.R.P. and B.O.A.; writing—review and editing, R.M.; visualization, H.B.; supervision, B.O.A.; project administration, B.O.A.; funding acquisition, A.R. All authors have read and agreed to the published version of the manuscript.
Funding
This research received no external funding. The APC was funded by discount vouchers from the journal.
Data Availability Statement
Publicly available datasets were analyzed in this study. This data can be found here: [SPEIbase v2.8; https://digital.csic.es/handle/10261/268088], accessed on 5 February 2024; CHIRPS_GLEAMCEDA [https://doi.org/10.5285/ac43da11867243a1bb414e1637802dec], accessed on 10 February 2024; ERA5 [https://cds.climate.copernicus.eu/cdsapp#!/dataset/reanalysis-era5-land?tab=form], accessed on 7 February 2024.
Acknowledgments
The authors express their appreciation to the developers of the Global SPEI database for making them publicly available for drought research. Also, we remain grateful to the institutions that provided the enabling environment and facilities for conducting research.
Conflicts of Interest
The authors declare no conflicts of interest.
Appendix A
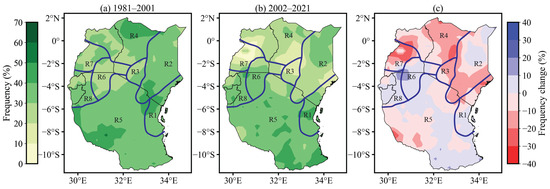
Figure A1.
Spatial distribution of DF (%) under the two historical periods (1981–2001, 2002–2021). (c) Represents the frequency change between the two periods (a) and (b).
Figure A1.
Spatial distribution of DF (%) under the two historical periods (1981–2001, 2002–2021). (c) Represents the frequency change between the two periods (a) and (b).
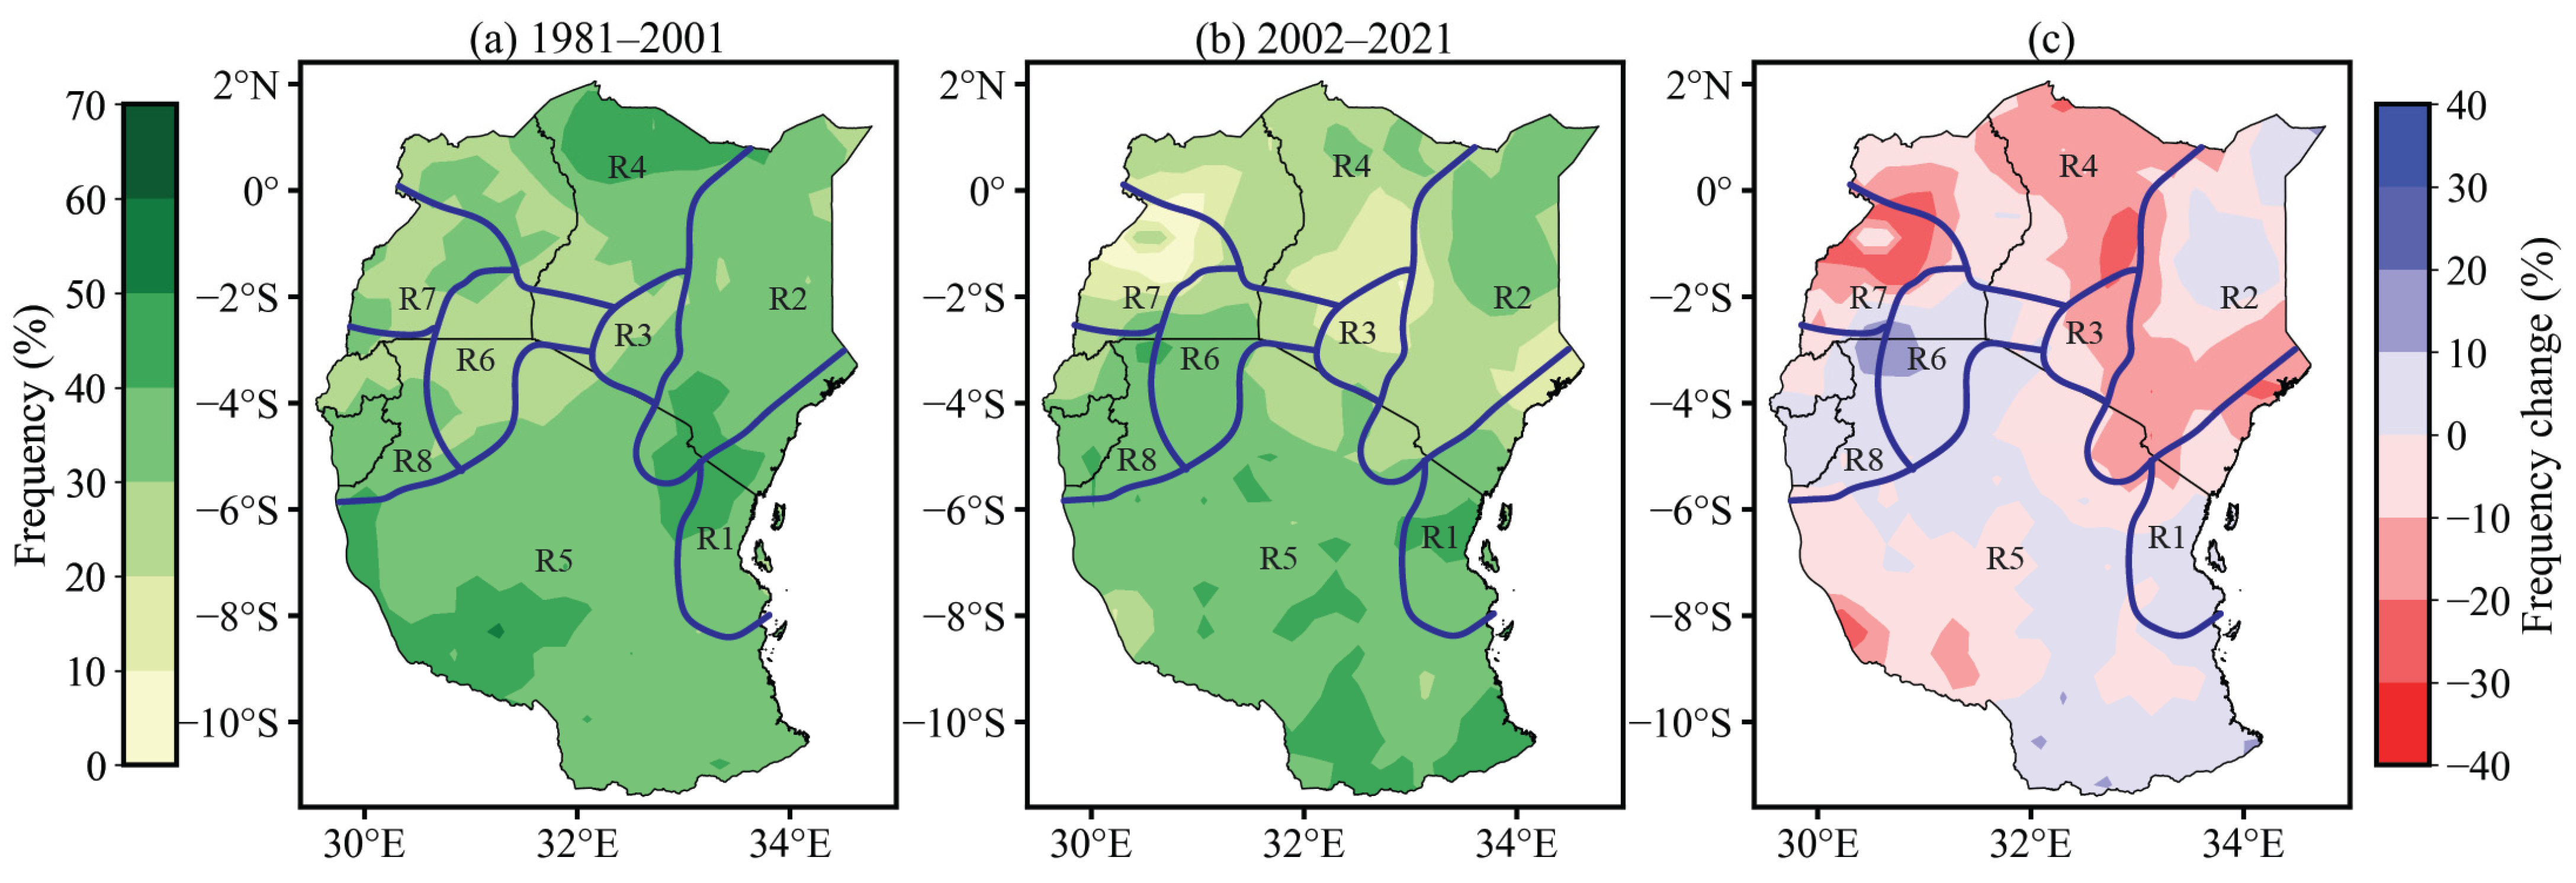

Figure A2.
Spatial distribution of DD over East Africa under the two historical periods (1981– 2001, 2002–2021). (c) Represents the duration change between the two periods (a) and (b).
Figure A2.
Spatial distribution of DD over East Africa under the two historical periods (1981– 2001, 2002–2021). (c) Represents the duration change between the two periods (a) and (b).
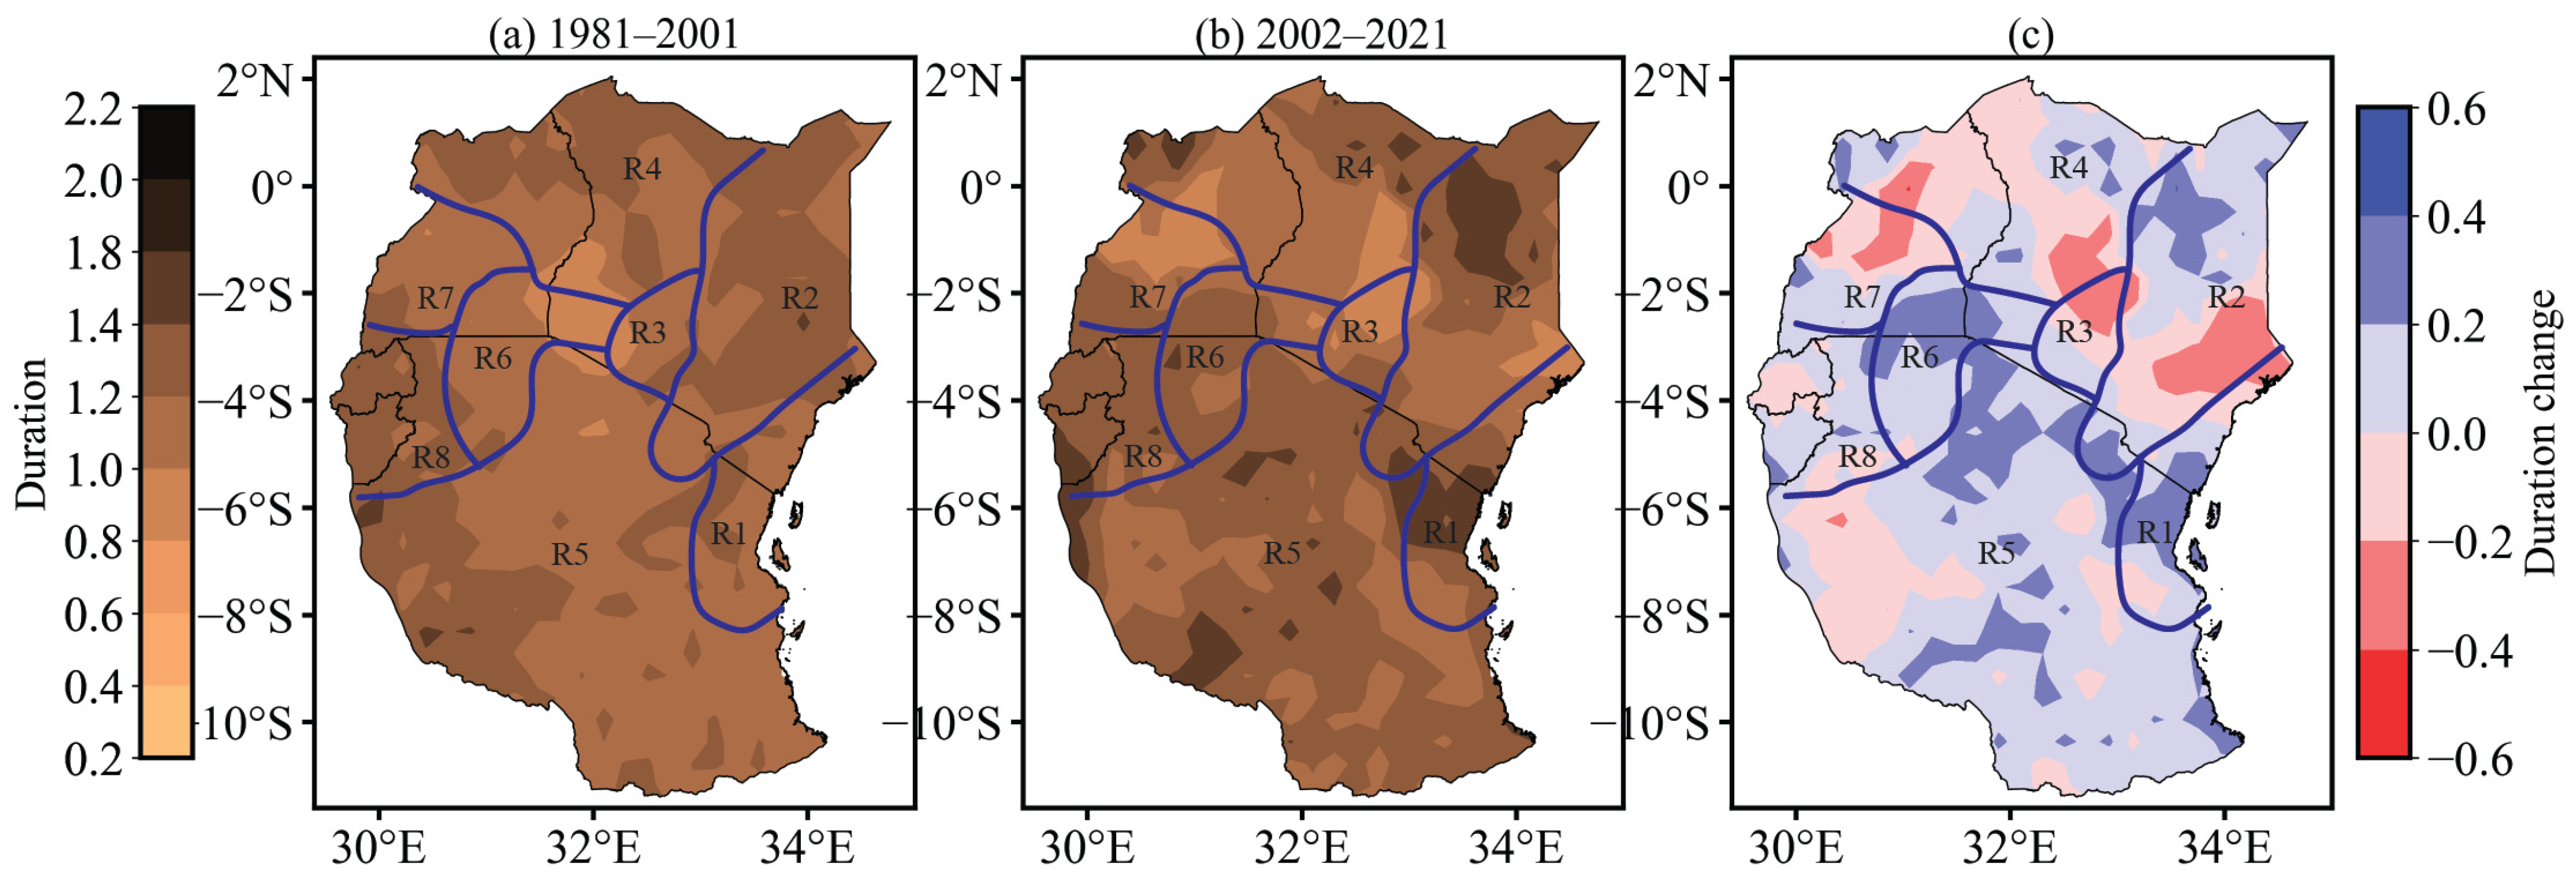

Figure A3.
Spatial distribution of DS over East Africa under the two historical periods (1981–2001, 2002–2021). (c) Represents the severity change between the two periods (a) and (b).
Figure A3.
Spatial distribution of DS over East Africa under the two historical periods (1981–2001, 2002–2021). (c) Represents the severity change between the two periods (a) and (b).
References
- Sharif, M. Simulation of Extreme Precipitation Events Using an Improved K-Nearest Neighbor Model. In Proceedings of the World Environmental and Water Resources Congress 2023, Henderson, NV, USA, 21–24 May 2023; American Society of Civil Engineers: Reston, VA, USA, 2023; pp. 381–389. [Google Scholar]
- World Meteorological Organization. Standardized Precipitation Index User Guide; Svoboda, M., Hayes, M., Wood, D., Eds.; WMO-No. 1090; World Meteorological Organization: Geneva, Switzerland, 2012. [Google Scholar]
- CRED. 2021 Disasters in Numbers; CRED: Brussels, Belgium, 2022; Available online: https://cred.be/sites/default/files/2021_EMDAT_report.pdf (accessed on 7 February 2024).
- Wang, R.; Zhang, X.; Guo, E.; Cong, L.; Wang, Y. Characteristics of the Spatial and Temporal Distribution of Drought in Northeast China, 1961–2020. Water 2024, 16, 234. [Google Scholar] [CrossRef]
- Slavková, J.; Gera, M.; Nikolova, N.; Siman, C. Standardized Precipitation and Evapotranspiration Index Approach for Drought Assessment in Slovakia—Statistical Evaluation of Different Calculations. Atmosphere 2023, 14, 1464. [Google Scholar] [CrossRef]
- Anghel, C.G.; Ilinca, C. Hydrological Drought Frequency Analysis in Water Management Using Univariate Distributions. Appl. Sci. 2023, 13, 3055. [Google Scholar] [CrossRef]
- Wu, X.; Xu, H.; He, H.; Wu, Z.; Lu, G.; Liao, T. Agricultural Drought Monitoring Using an Enhanced Soil Water Deficit Index Derived from Remote Sensing and Model Data Merging. Remote Sens. 2024, 16, 2156. [Google Scholar] [CrossRef]
- Kadam, C.M.; Bhosle, U.V.; Holambe, R.S. A Comprehensive Assessment of Agricultural Drought. Disaster Adv. 2022, 15, 24–39. [Google Scholar] [CrossRef]
- Udmale, P.; Ichikawa, Y.; Manandhar, S.; Ishidaira, H.; Kiem, A.S. Farmers’ perception of drought impacts, local adaptation and administrative mitigation measures in Maharashtra State, India. Int. J. Disaster Risk Reduct. 2014, 10, 250–269. [Google Scholar] [CrossRef]
- Tripathy, K.P.; Mukherjee, S.; Mishra, A.K.; Mann, M.E.; Williams, A.P. Climate change will accelerate the high-end risk of compound drought and heatwave events. Proc. Natl. Acad. Sci. USA 2023, 120, e2219825120. [Google Scholar] [CrossRef] [PubMed]
- Mushtaq, B.; Bandh, S.A.; Shafi, S. Management of Water Resources. In Environmental Management; Springer: Singapore, 2020; pp. 1–46. [Google Scholar]
- Kusmambetov, K.D.; Suleimenova, S.Z. Water Resources as the Material Basis for Further Strategic Development of the Republic of Kazakhstan. J. Environ. Manag. Tour. 2022, 13, 99–106. [Google Scholar] [CrossRef] [PubMed]
- Opere, A.; Omwoyo, A.; Mueni, P.; Arango, M. Impact of Climate Change on Water Resources in Eastern Africa. In Research Anthology on Environmental and Societal Impacts of Climate Change; IGI Global: Hershey, PA, USA, 2022; pp. 1150–1174. [Google Scholar]
- Ayugi, B.; Tan, G.; Niu, R.; Dong, Z.; Ojara, M.; Mumo, L.; Babaousmail, H.; Ongoma, V. Evaluation of meteorological drought and flood scenarios over Kenya, East Africa. Atmosphere 2020, 11, 307. [Google Scholar] [CrossRef]
- Omondi, O.A.; Lin, Z. Trend and spatial-temporal variation of drought characteristics over equatorial East Africa during the last 120 years. Front. Earth Sci. 2023, 10, 1064940. [Google Scholar] [CrossRef]
- Kalladath, N.; Rasheed, A.; Otieno, V.; Misiani, H.; Ouma, J.; Otenyo, E.; Amdihun, A. Automatic generation of impact-based drought forecast, implications for early warning and action in East Africa. In Proceedings of the EGU General Assembly 2023, Vienna, Austria, 23–28 April 2023. [Google Scholar] [CrossRef]
- Nguvana, M.; Abiodun, B.J.; Otieno, F. Projecting drought characteristics over East Africa basins at specific global warming levels. Atmos. Res. 2019, 228, 41–54. [Google Scholar] [CrossRef]
- Haile, G.G.; Tang, Q.; Baniya, B. Spatial Drought Patterns in East Africa. In Climate Risk and Sustainable Water Management; Cambridge University Press: Cambridge, UK, 2022; pp. 47–64. ISBN 9781108787291. [Google Scholar]
- Ojara, M.A.; Lou, Y.; Aribo, L.; Namumbya, S.; Uddin, M.J. Dry spells and probability of rainfall occurrence for Lake Kyoga Basin in Uganda, East Africa. Nat. Hazards 2020, 100, 493–514. [Google Scholar] [CrossRef]
- Kamei, A. Who Walks for Water? Water Consumption and Labor Supply Response to Rainfall Scarcity in Uganda. SSRN Electron. J. 2022, 2003–2005. [Google Scholar] [CrossRef]
- Busolo, J.; Nzeyimana, I.; Jones, O.; Huber-Lee, A.; Kemp-Benedict, E.; Joyce, B. A Water-Resilient Economy: Hydro-Macroeconomic and Climate Change Analysis in Rwanda; SEI: Oaks, PA, USA, 2023; Volume 10. [Google Scholar] [CrossRef]
- Mishra, A.K.; Singh, V.P. A review of drought concepts. J. Hydrol. 2010, 391, 202–216. [Google Scholar] [CrossRef]
- Vinnarasi, R.; Dhanya, C.T.; Kumar, H. Tracing Time-Varying Characteristics of Meteorological Drought through Nonstationary Joint Deficit Index. J. Clim. 2023, 36, 4203–4217. [Google Scholar] [CrossRef]
- Han, J.; Zhang, J.; Yang, S.; Cao, D.; Ahmed Prodhan, F.; Pangali Sharma, T.P. A new composite index for global soil plant atmosphere continuum drought monitoring combing remote-sensing based terrestrial water storage and vapor pressure deficit anomalies. J. Hydrol. 2022, 615, 128622. [Google Scholar] [CrossRef]
- Kumari, P.; Rehana, S.; Singh, S.K.; Inayathulla, M. Development of a new agro-meteorological drought index (SPAEI-Agro) in a data-scarce region. Hydrol. Sci. J. 2023, 68, 1301–1322. [Google Scholar] [CrossRef]
- Elameen, A.M.; Jin, S.; Olago, D. Identification of Drought Events in Major Basins of Africa from GRACE Total Water Storage and Modeled Products. Photogramm. Eng. Remote Sens. 2023, 89, 221–232. [Google Scholar] [CrossRef]
- He, L.; Tong, L.; Zhou, Z.; Gao, T.; Ding, Y.; Ding, Y.; Zhao, Y.; Fan, W. A Drought Index: The Standardized Precipitation Evapotranspiration Irrigation Index. Water 2022, 14, 2133. [Google Scholar] [CrossRef]
- Stefanidis, S.; Dimitra, R.; Nikolaos, P. Drought severity and trends in a Mediterranean oak forest. Hydrology 2023, 10, 167. [Google Scholar] [CrossRef]
- Wei, W.; Liu, T.; Zhou, L.; Wang, J.; Yan, P.; Xie, B.; Zhou, J. Drought-Related Spatiotemporal Cumulative and Time-Lag Effects on Terrestrial Vegetation across China. Remote Sens. 2023, 15, 4362. [Google Scholar] [CrossRef]
- Hashimoto, T.; Stedinger, J.R.; Loucks, D.P. Reliability, resiliency, and vulnerability criteria for water resource system performance evaluation. Water Resour. Res. 1982, 18, 14–20. [Google Scholar] [CrossRef]
- Maity, R.; Sharma, A.; Nagesh Kumar, D.; Chanda, K. Characterizing Drought Using the Reliability-Resilience-Vulnerability Concept. J. Hydrol. Eng. 2013, 18, 859–869. [Google Scholar] [CrossRef]
- Sadeghi, S.H.; Hazbavi, Z. Spatiotemporal variation of watershed health propensity through reliability-resilience-vulnerability based drought index (case study: Shazand Watershed in Iran). Sci. Total Environ. 2017, 587–588, 168–176. [Google Scholar] [CrossRef] [PubMed]
- Hazbavi, Z.; Baartman, J.E.M.; Nunes, J.P.; Keesstra, S.D.; Sadeghi, S.H. Changeability of reliability, resilience and vulnerability indicators with respect to drought patterns. Ecol. Indic. 2018, 87, 196–208. [Google Scholar] [CrossRef]
- Asefa, T.; Clayton, J.; Adams, A.; Anderson, D. Performance evaluation of a water resources system under varying climatic conditions: Reliability, Resilience, Vulnerability and beyond. J. Hydrol. 2014, 508, 53–65. [Google Scholar] [CrossRef]
- Hong, X.; Basirialmahjough, M.; He, Y.; Moudi, M. Investigation of Drought Risk Using a Dynamic Optimization Framework in Regional Water Allocation Procedure With Different Streamflow Scenarios. Front. Environ. Sci. 2022, 10, 813239. [Google Scholar] [CrossRef]
- Fooladi, M.; Golmohammadi, M.H.; Safavi, H.R.; Singh, V.P. Application of meteorological drought for assessing watershed health using fuzzy-based reliability, resilience, and vulnerability. Int. J. Disaster Risk Reduct. 2021, 66, 102616. [Google Scholar] [CrossRef]
- Sung, J.H.; Chung, E.S.; Shahid, S. Reliability-Resiliency-Vulnerability approach for drought analysis in South Korea using 28 GCMs. Sustainability 2018, 10, 3043. [Google Scholar] [CrossRef]
- Indeje, M.; Semazzi, F.H.M.; Ogallo, L.J. ENSO signals in East African rainfall seasons. Int. J. Clim. 2000, 20, 19–46. [Google Scholar] [CrossRef]
- Ongoma, V.; Chen, H. Temporal and spatial variability of temperature and precipitation over East Africa from 1951 to 2010. Meteorol. Atmos. Phys. 2017, 129, 131–144. [Google Scholar] [CrossRef]
- Funk, C.; Harrison, L.; Segele, Z.; Rosenstock, T.; Steward, P.; Anderson, C.L.; Coughlan de Perez, E.; Maxwell, D.; Endris, H.S.; Koch, E.; et al. Tailored Forecasts Can Predict Extreme Climate Informing Proactive Interventions in East Africa. Earth’s Futur. 2023, 11, e2023EF003524. [Google Scholar] [CrossRef]
- Vicente-Serrano, S.M.; Beguería, S.; López-Moreno, J.I. A multiscalar drought index sensitive to global warming: The standardized precipitation evapotranspiration index. J. Clim. 2010, 23, 1696–1718. [Google Scholar] [CrossRef]
- Vicente-Serrano, S.M.; Beguería, S.; López-Moreno, J.I.; Angulo, M.; El Kenawy, A. A new global 0.5° gridded dataset (1901–2006) of a multiscalar drought index: Comparison with current drought index datasets based on the palmer drought severity index. J. Hydrometeorol. 2010, 11, 1033–1043. [Google Scholar] [CrossRef]
- Gebrechorkos, S.H.; Peng, J.; Dyer, E.; Miralles, D.G.; Vicente-Serrano, S.M.; Funk, C.; Beck, H.E.; Asfaw, D.T.; Singer, M.B.; Dadson, S.J. Global high-resolution drought indices for 1981–2022. Earth Syst. Sci. Data 2023, 15, 5449–5466. [Google Scholar] [CrossRef]
- Hersbach, H.; Bell, B.; Berrisford, P.; Hirahara, S.; Horányi, A.; Muñoz-Sabater, J.; Nicolas, J.; Peubey, C.; Radu, R.; Schepers, D.; et al. The ERA5 global reanalysis. Q. J. R. Meteorol. Soc. 2020, 146, 1999–2049. [Google Scholar] [CrossRef]
- Hammad, Z.; Chung, E.U. Spatiotemporal variability of future water sustainability using reliability resilience vulnerability framework. Theor. Appl. Clim. 2024, 1–16. [Google Scholar] [CrossRef]
- Nicholson, S.E. A detailed look at the recent drought situation in the Greater Horn of Africa. J. Arid Environ. 2014, 103, 71–79. [Google Scholar] [CrossRef]
- Gebremeskel, G.; Tang, Q.; Sun, S.; Huang, Z.; Zhang, X.; Liu, X. Droughts in East Africa: Causes, impacts and resilience. Earth-Sci. Rev. 2019, 193, 146–161. [Google Scholar] [CrossRef]
- Lyon, B.; Dewitt, D.G. A recent and abrupt decline in the East African long rains. Geophys. Res. Lett. 2012, 39, 1–5. [Google Scholar] [CrossRef]
- AghaKouchak, A. A multivariate approach for persistence-based drought prediction: Application to the 2010–2011 East Africa drought. J. Hydrol. 2015, 526, 127–135. [Google Scholar] [CrossRef]
- Lim Kam Sian, K.T.C.; Onyutha, C.; Ayugi, B.O.; Njouenwet, I.; Ongoma, V. Drought severity across Africa: A comparative analysis of multi-source precipitation datasets. Nat. Hazards 2024, 1–31. [Google Scholar] [CrossRef]
- Uhe, P.; Philip, S.; Kew, S.; Shah, K.; Kimutai, J.; Mwangi, E.; van Oldenborgh, G.J.; Singh, R.; Arrighi, J.; Jjemba, E.; et al. Attributing drivers of the 2016 Kenyan drought. Int. J. Clim. 2018, 38, e554–e568. [Google Scholar] [CrossRef]
- Polong, F.; Chen, H.; Sun, S.; Ongoma, V. Temporal and spatial evolution of the standard precipitation evapotranspiration index (SPEI) in the Tana River Basin, Kenya. Theor. Appl. Clim. 2019, 138, 777–792. [Google Scholar] [CrossRef]
- Funk, C.; Hoell, A.; Shukla, S.; Bladé, I.; Liebmann, B.; Roberts, J.B.; Robertson, F.R.; Husak, G. Predicting East African spring droughts using Pacific and Indian Ocean sea surface temperature indices. Hydrol. Earth Syst. Sci. 2014, 18, 4965–4978. [Google Scholar] [CrossRef]
- Doi, T.; Behera, S.K.; Yamagata, T. On the Predictability of the Extreme Drought in East Africa During the Short Rains Season. Geophys. Res. Lett. 2022, 49, e2022GL100905. [Google Scholar] [CrossRef]
- Lyon, B. Seasonal drought in the Greater Horn of Africa and its recent increase during the March-May long rains. J. Clim. 2014, 27, 7953–7975. [Google Scholar] [CrossRef]
- Onyutha, C.; Acayo, G.; Nyende, J. Analyses of precipitation and evapotranspiration changes across the Lake Kyoga Basin in East Africa. Water 2020, 12, 1134. [Google Scholar] [CrossRef]
Disclaimer/Publisher’s Note: The statements, opinions and data contained in all publications are solely those of the individual author(s) and contributor(s) and not of MDPI and/or the editor(s). MDPI and/or the editor(s) disclaim responsibility for any injury to people or property resulting from any ideas, methods, instructions or products referred to in the content. |
© 2024 by the authors. Licensee MDPI, Basel, Switzerland. This article is an open access article distributed under the terms and conditions of the Creative Commons Attribution (CC BY) license (https://creativecommons.org/licenses/by/4.0/).