
Serrations as a Passive Solution for Turbomachinery Noise Reduction

Abstract
:1. Introduction
2. Calculation Methods and Models for Serrated Vanes (Interaction Noise)
2.1. Classic Blade
2.2. Leading Edge Serrated Blades
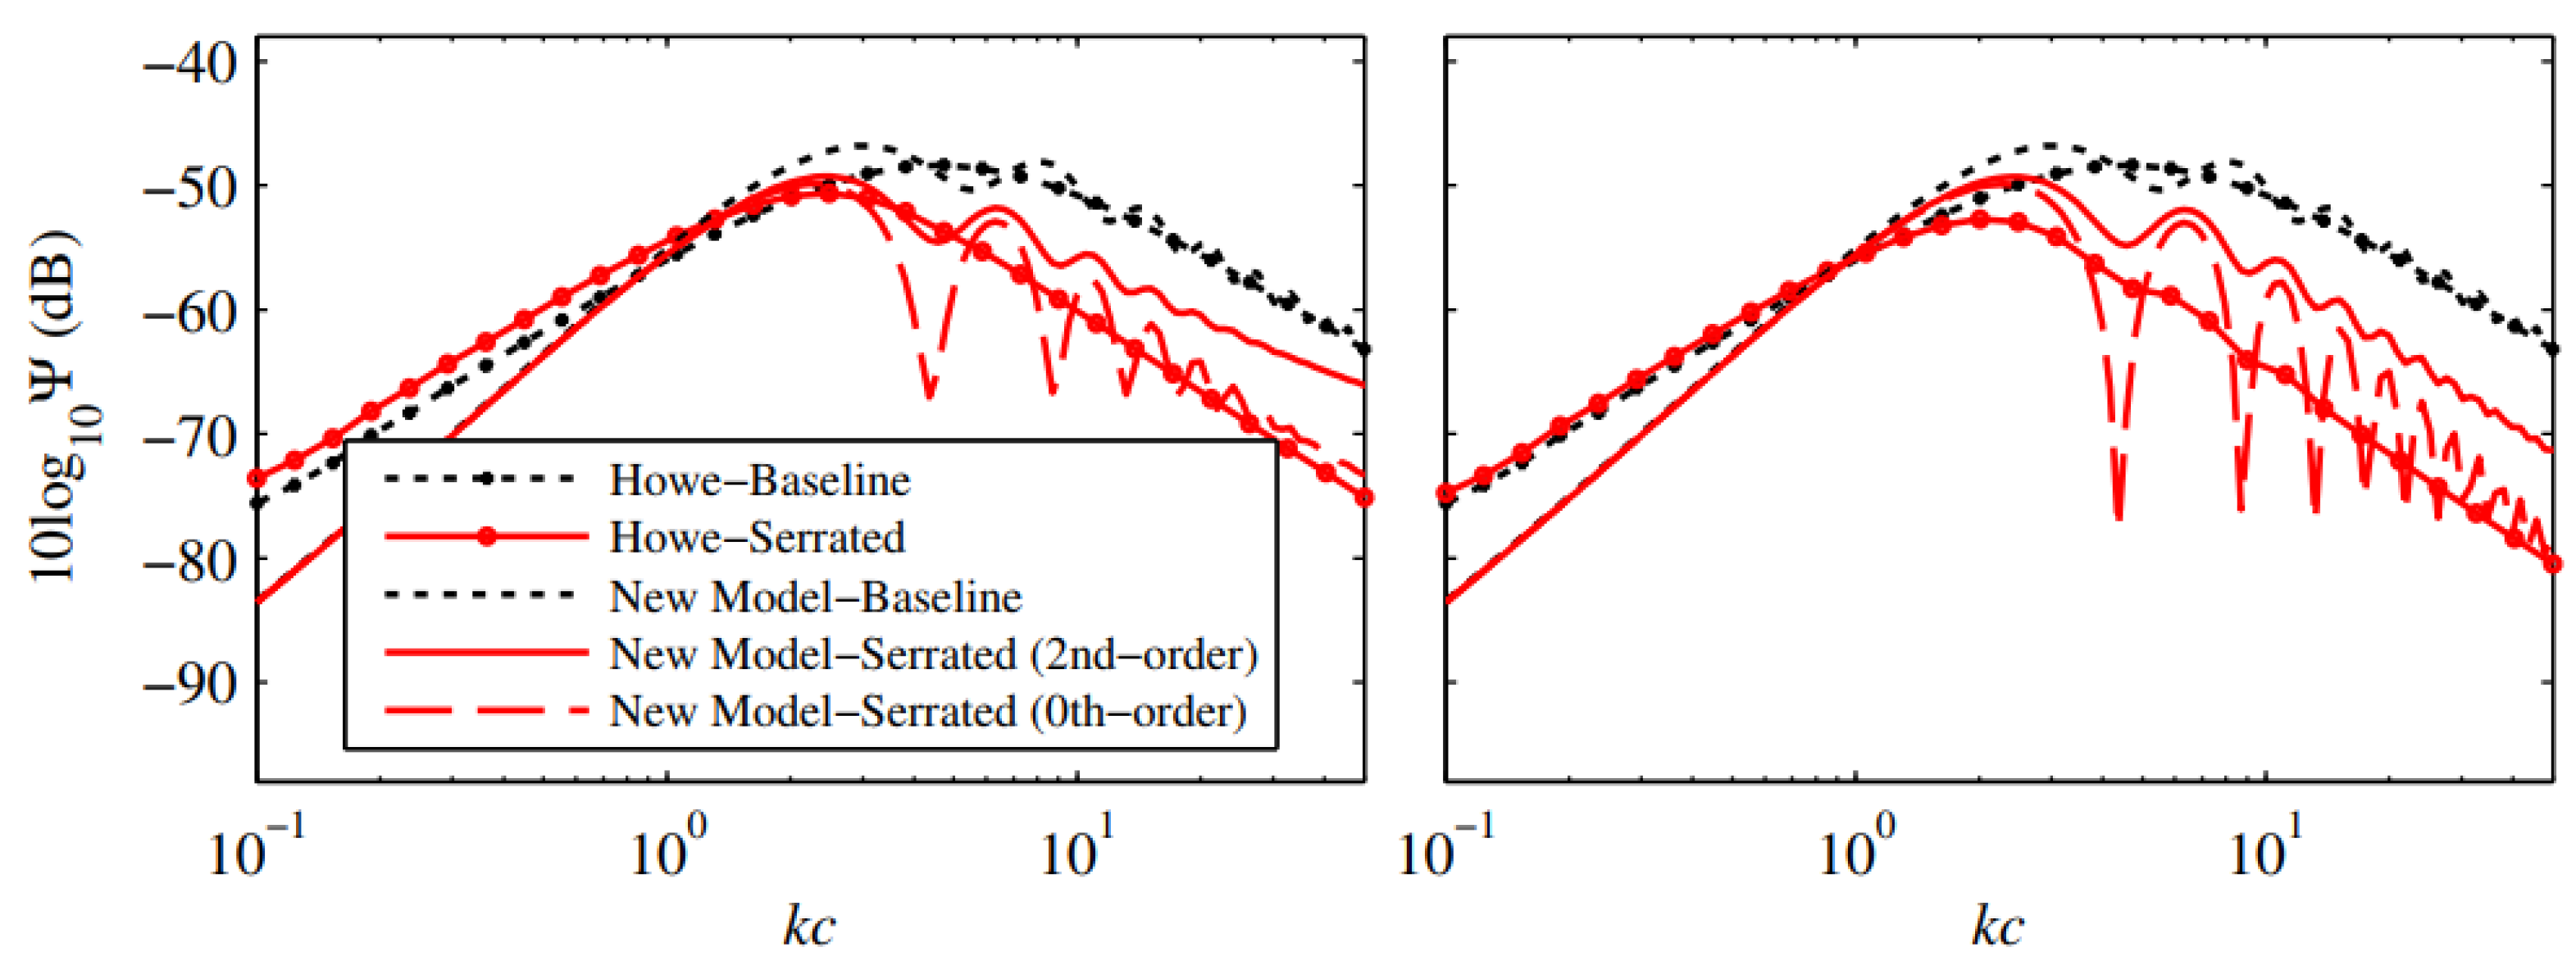
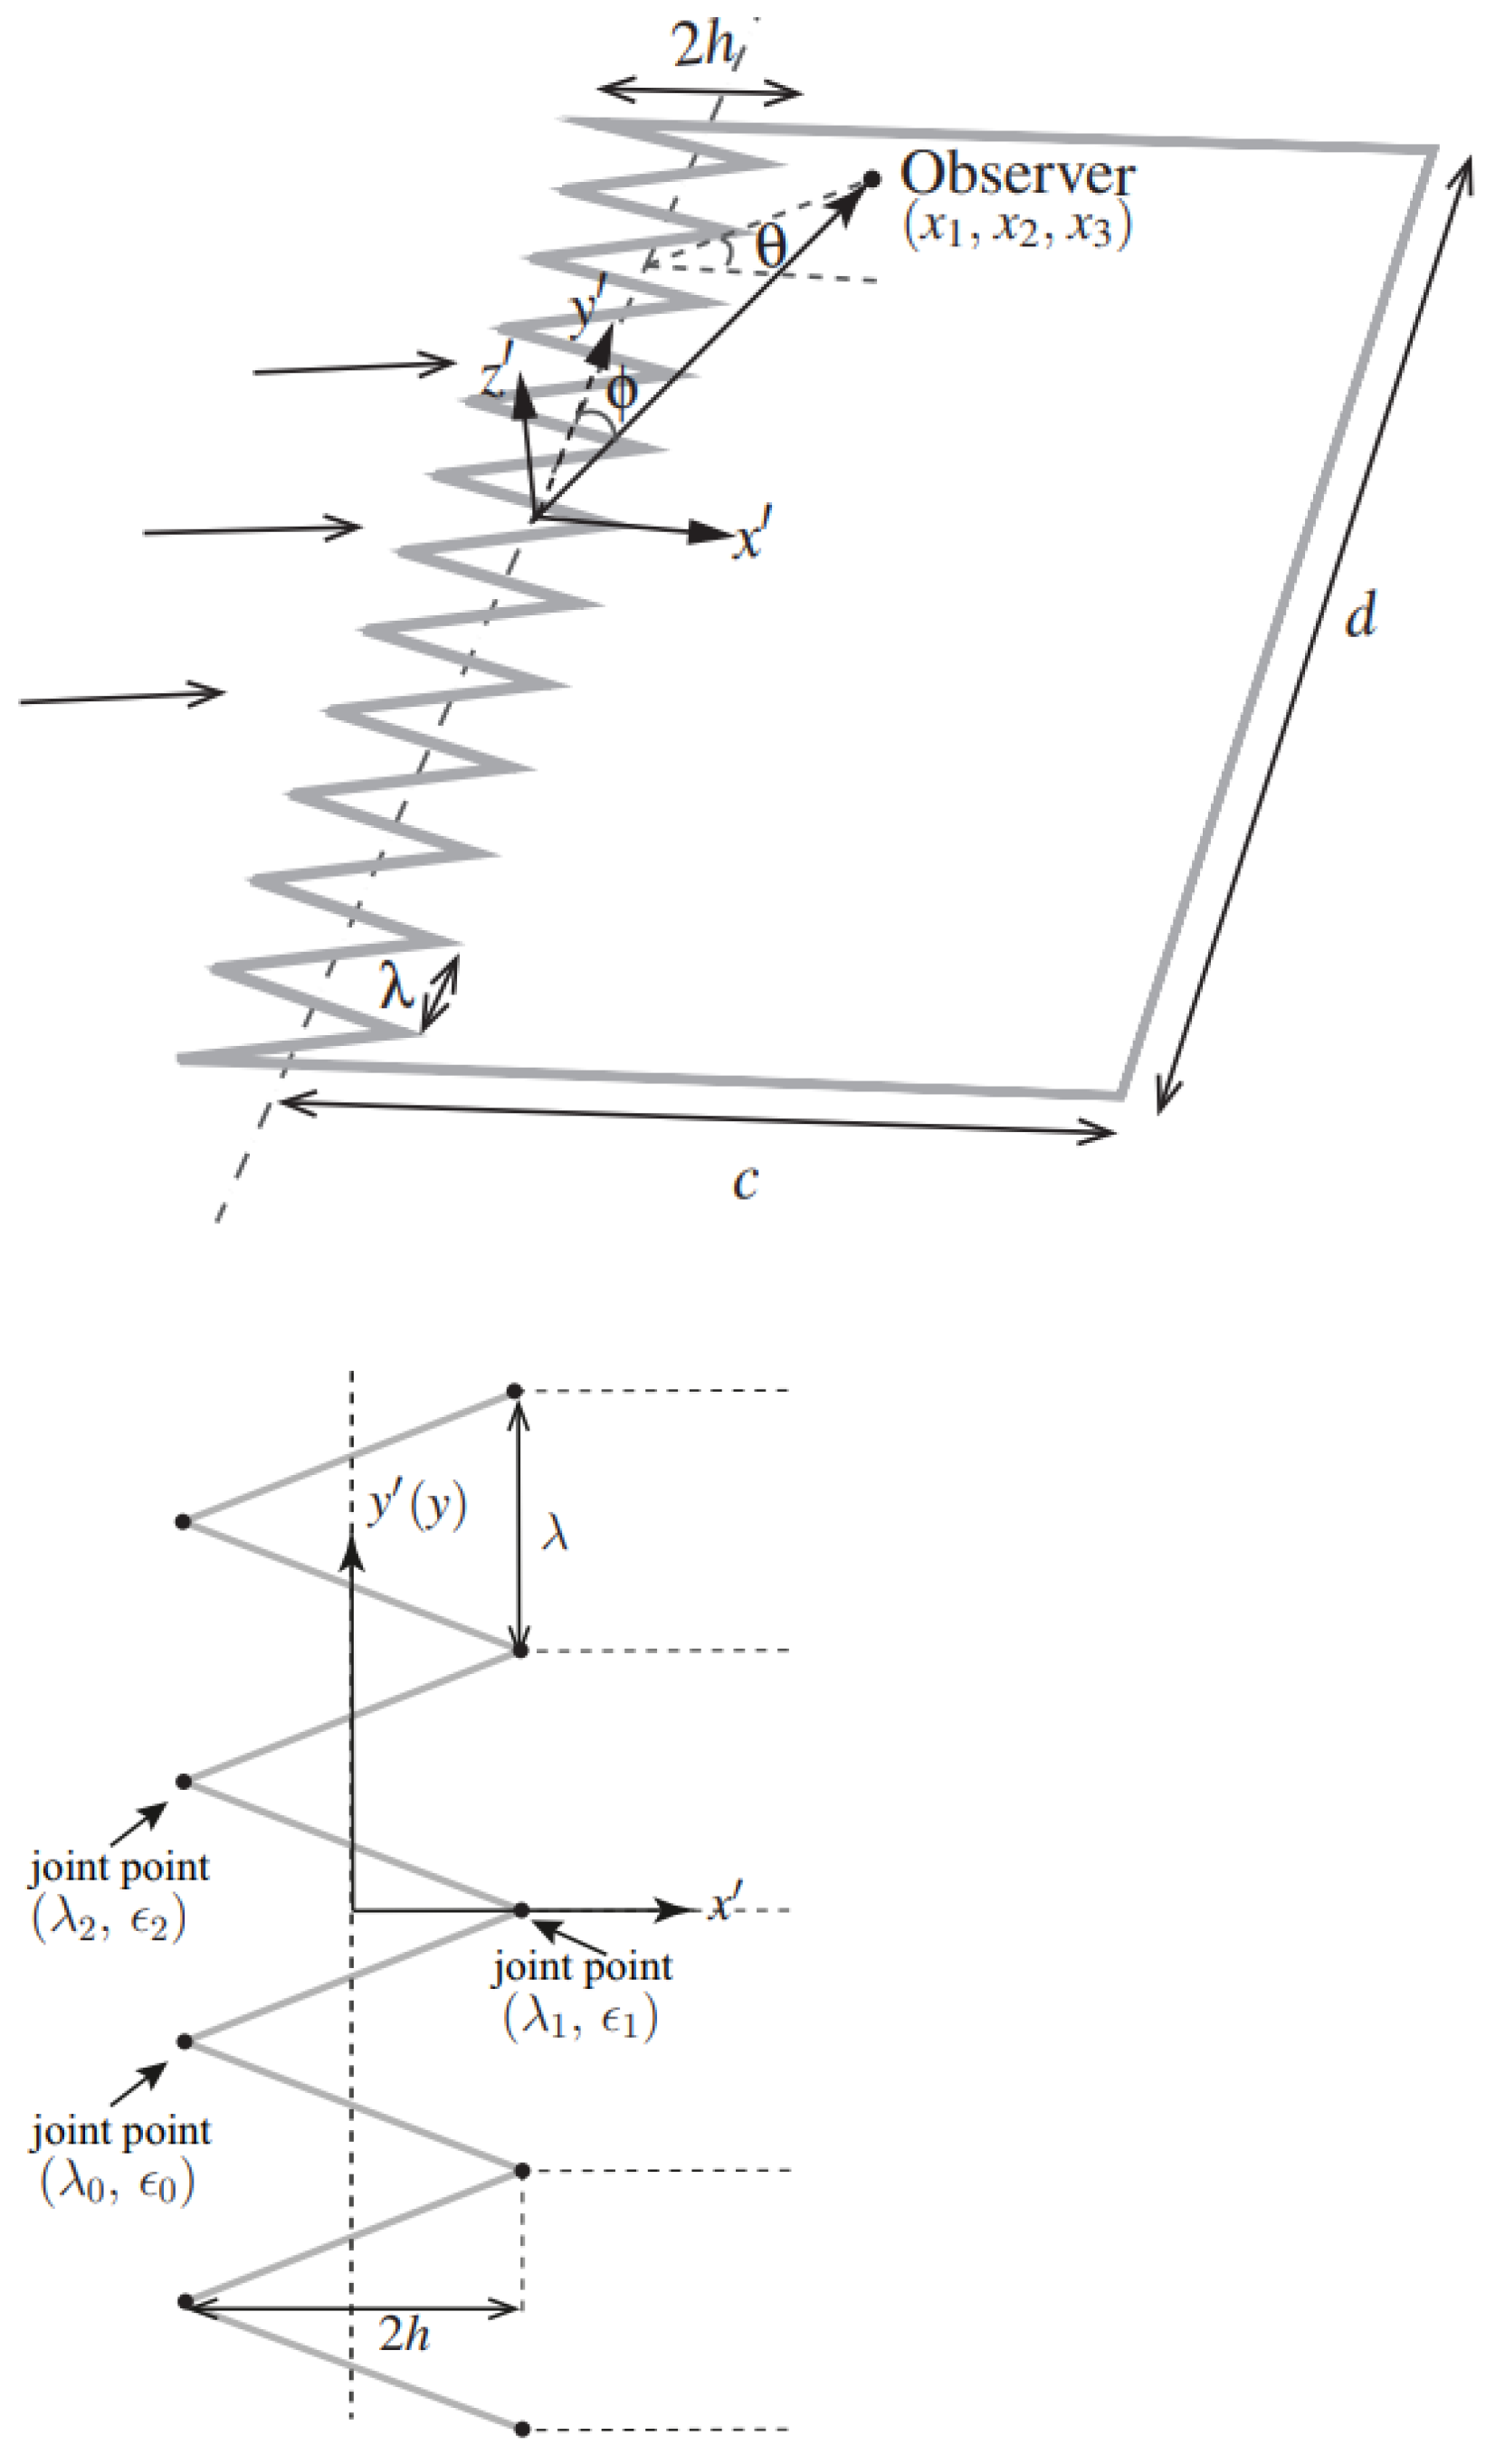
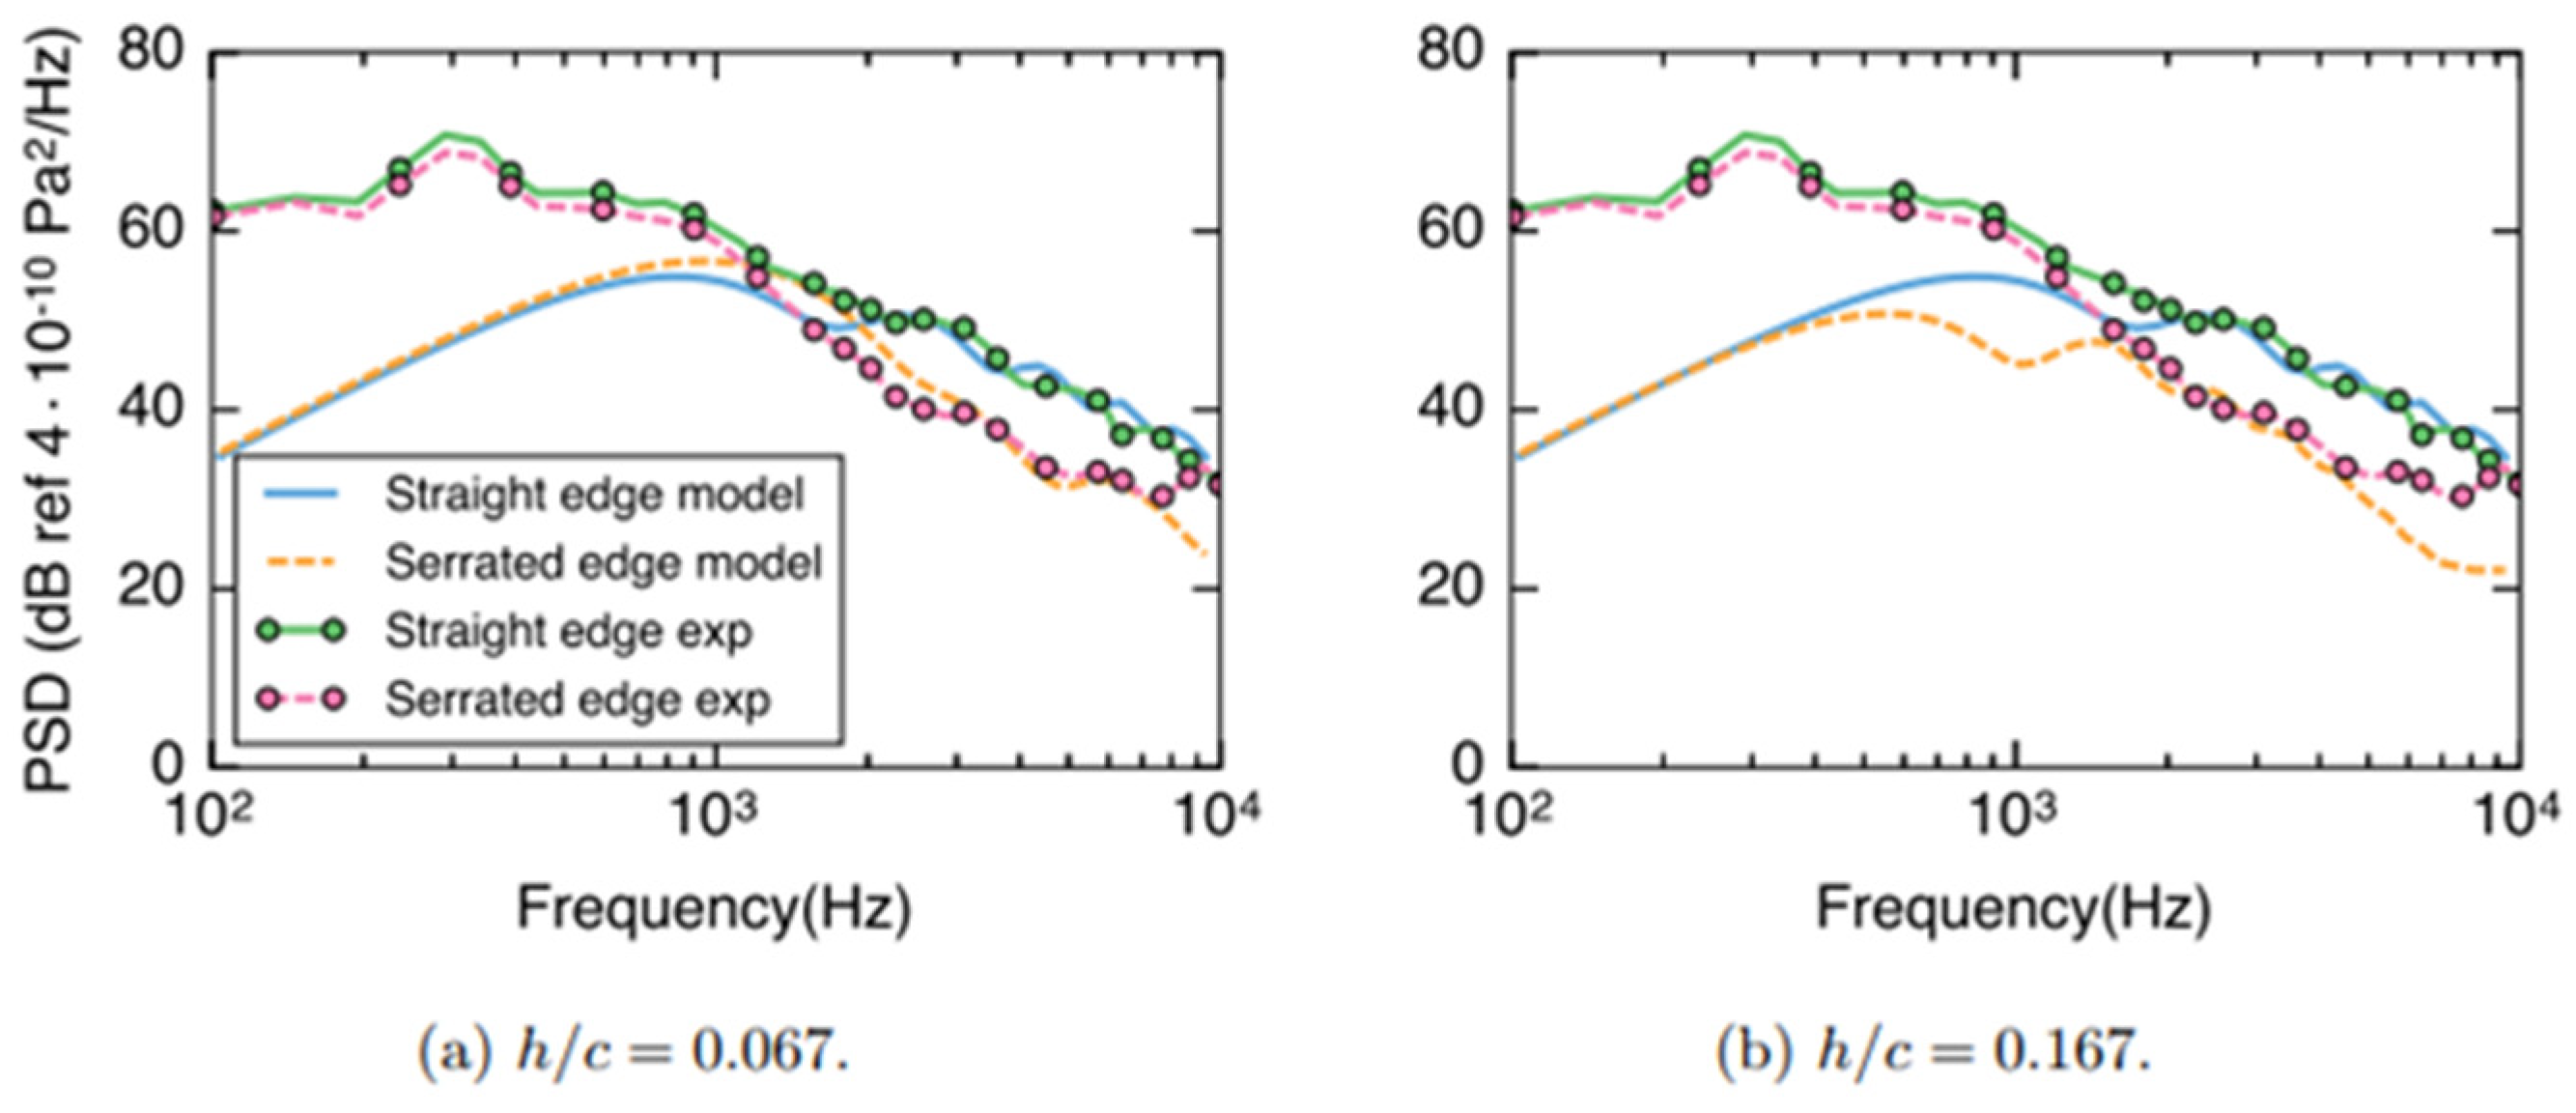
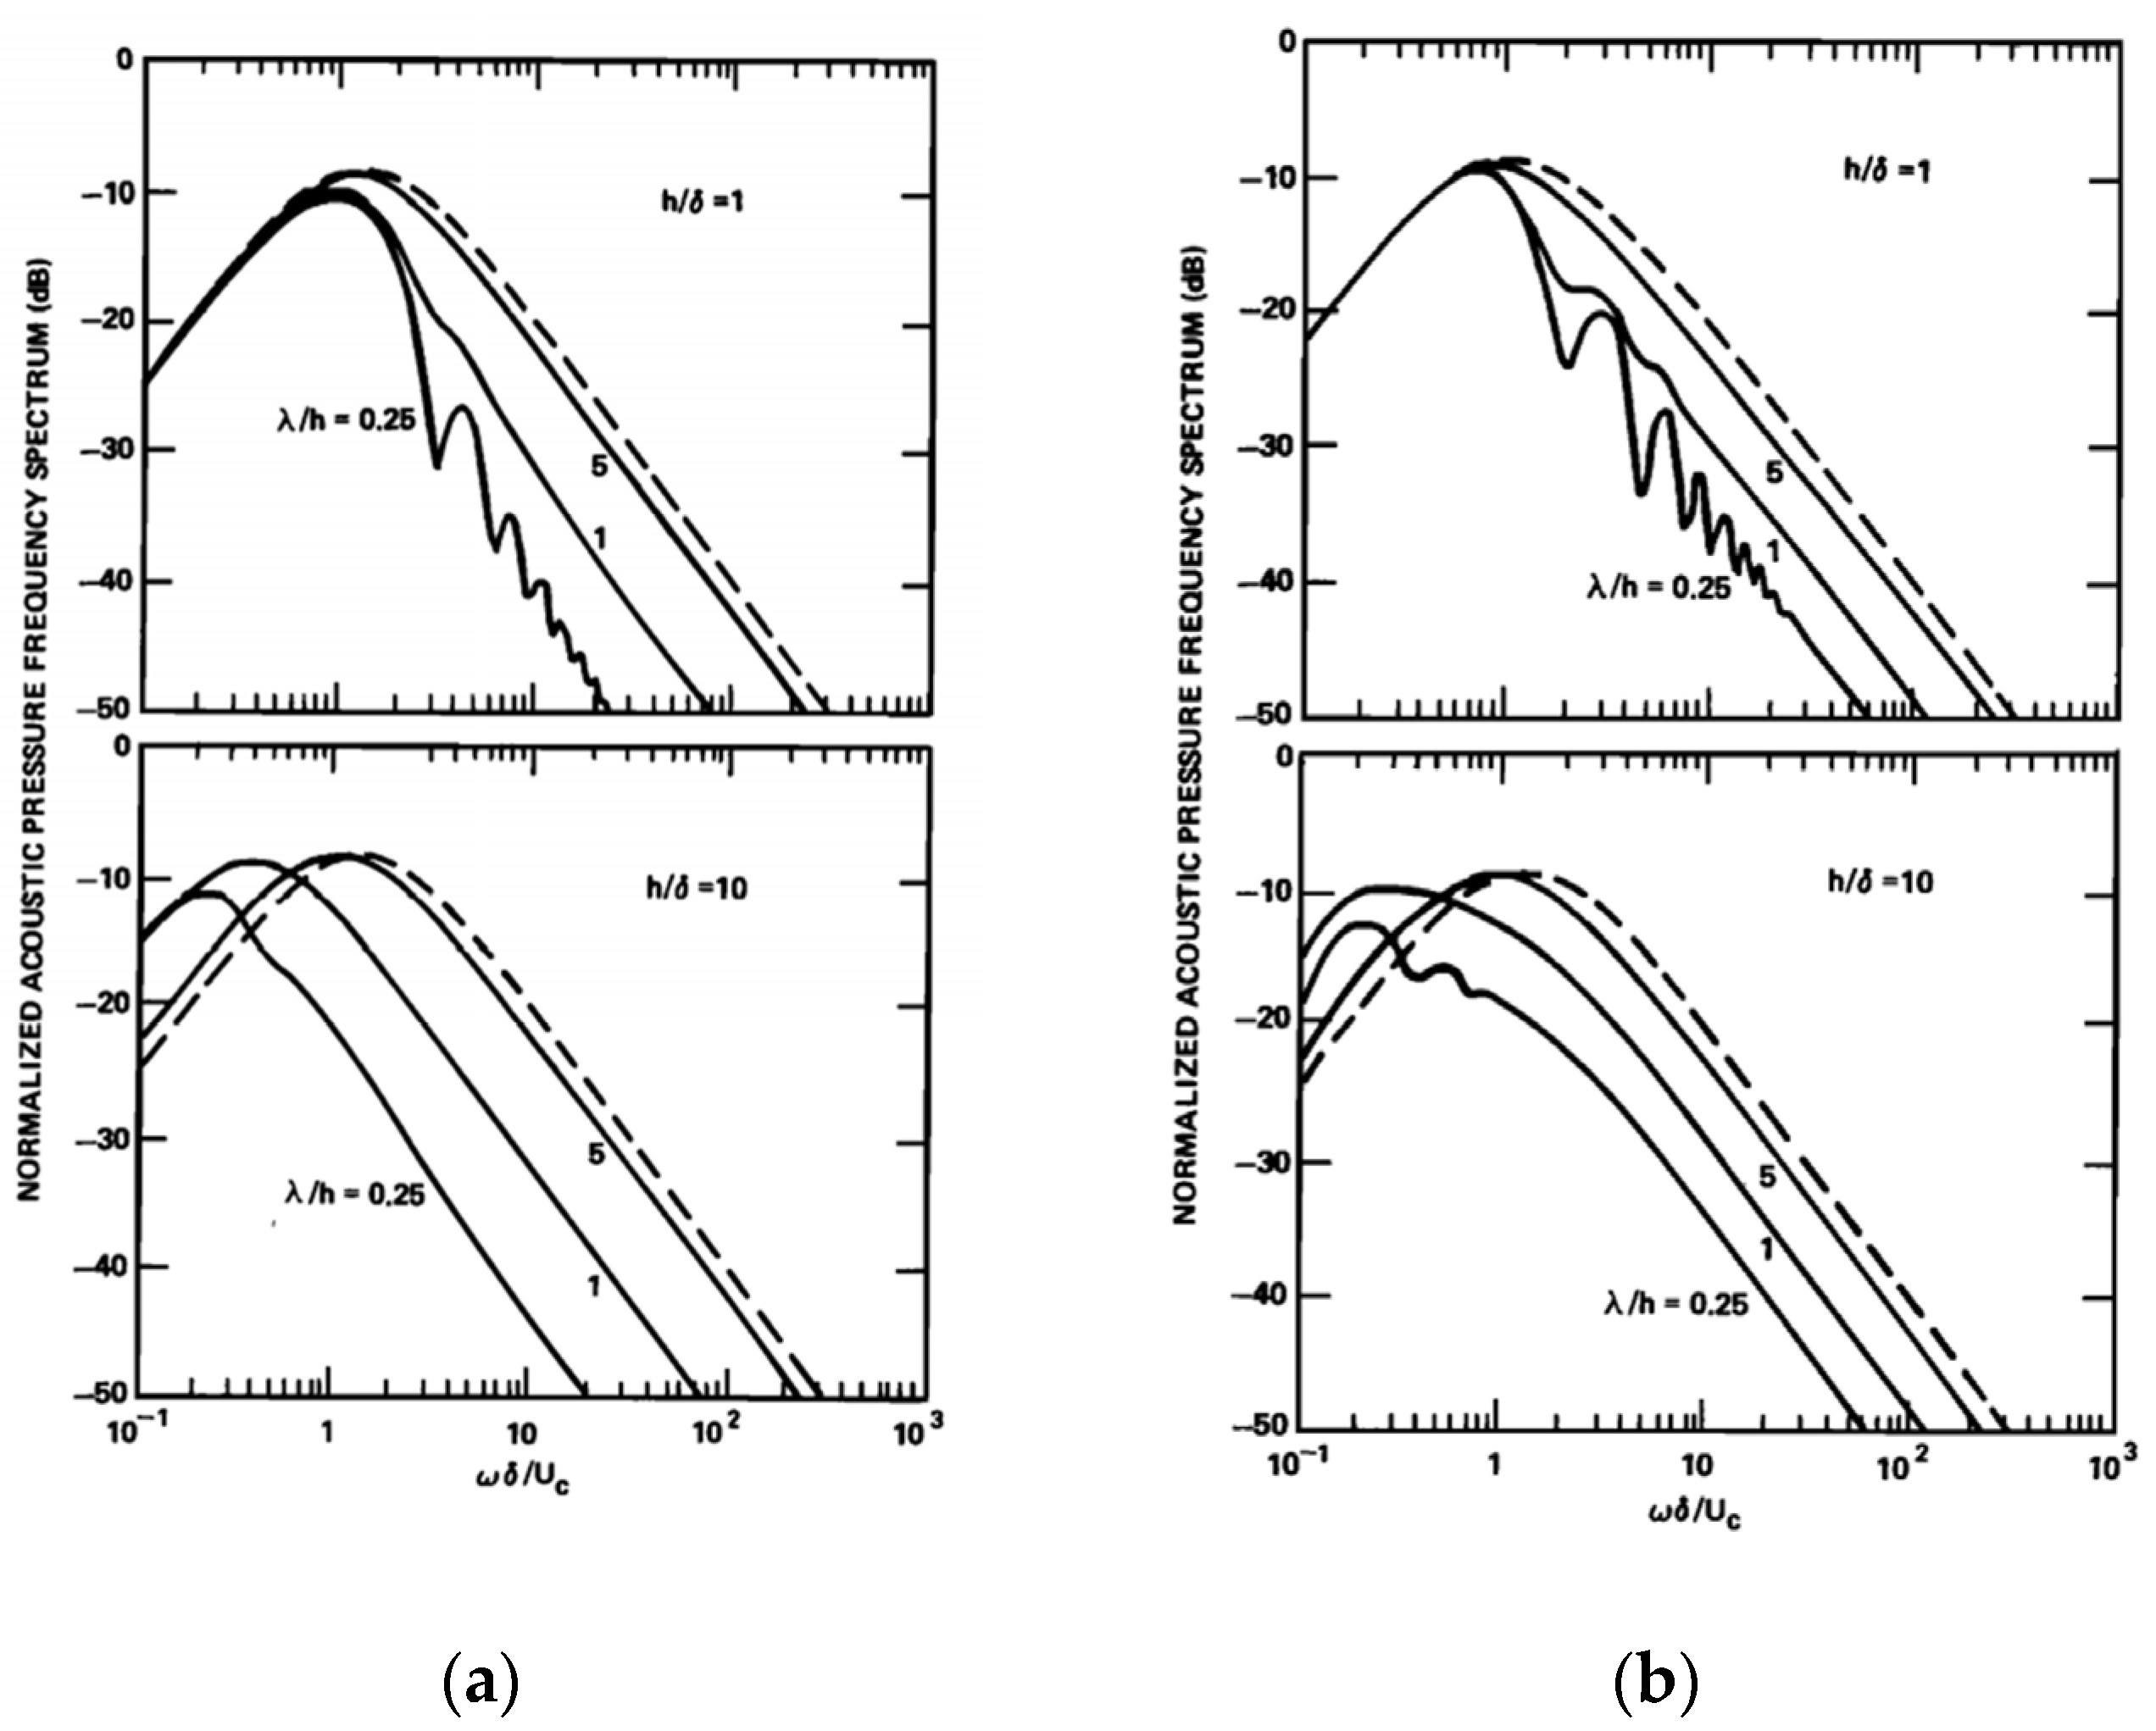
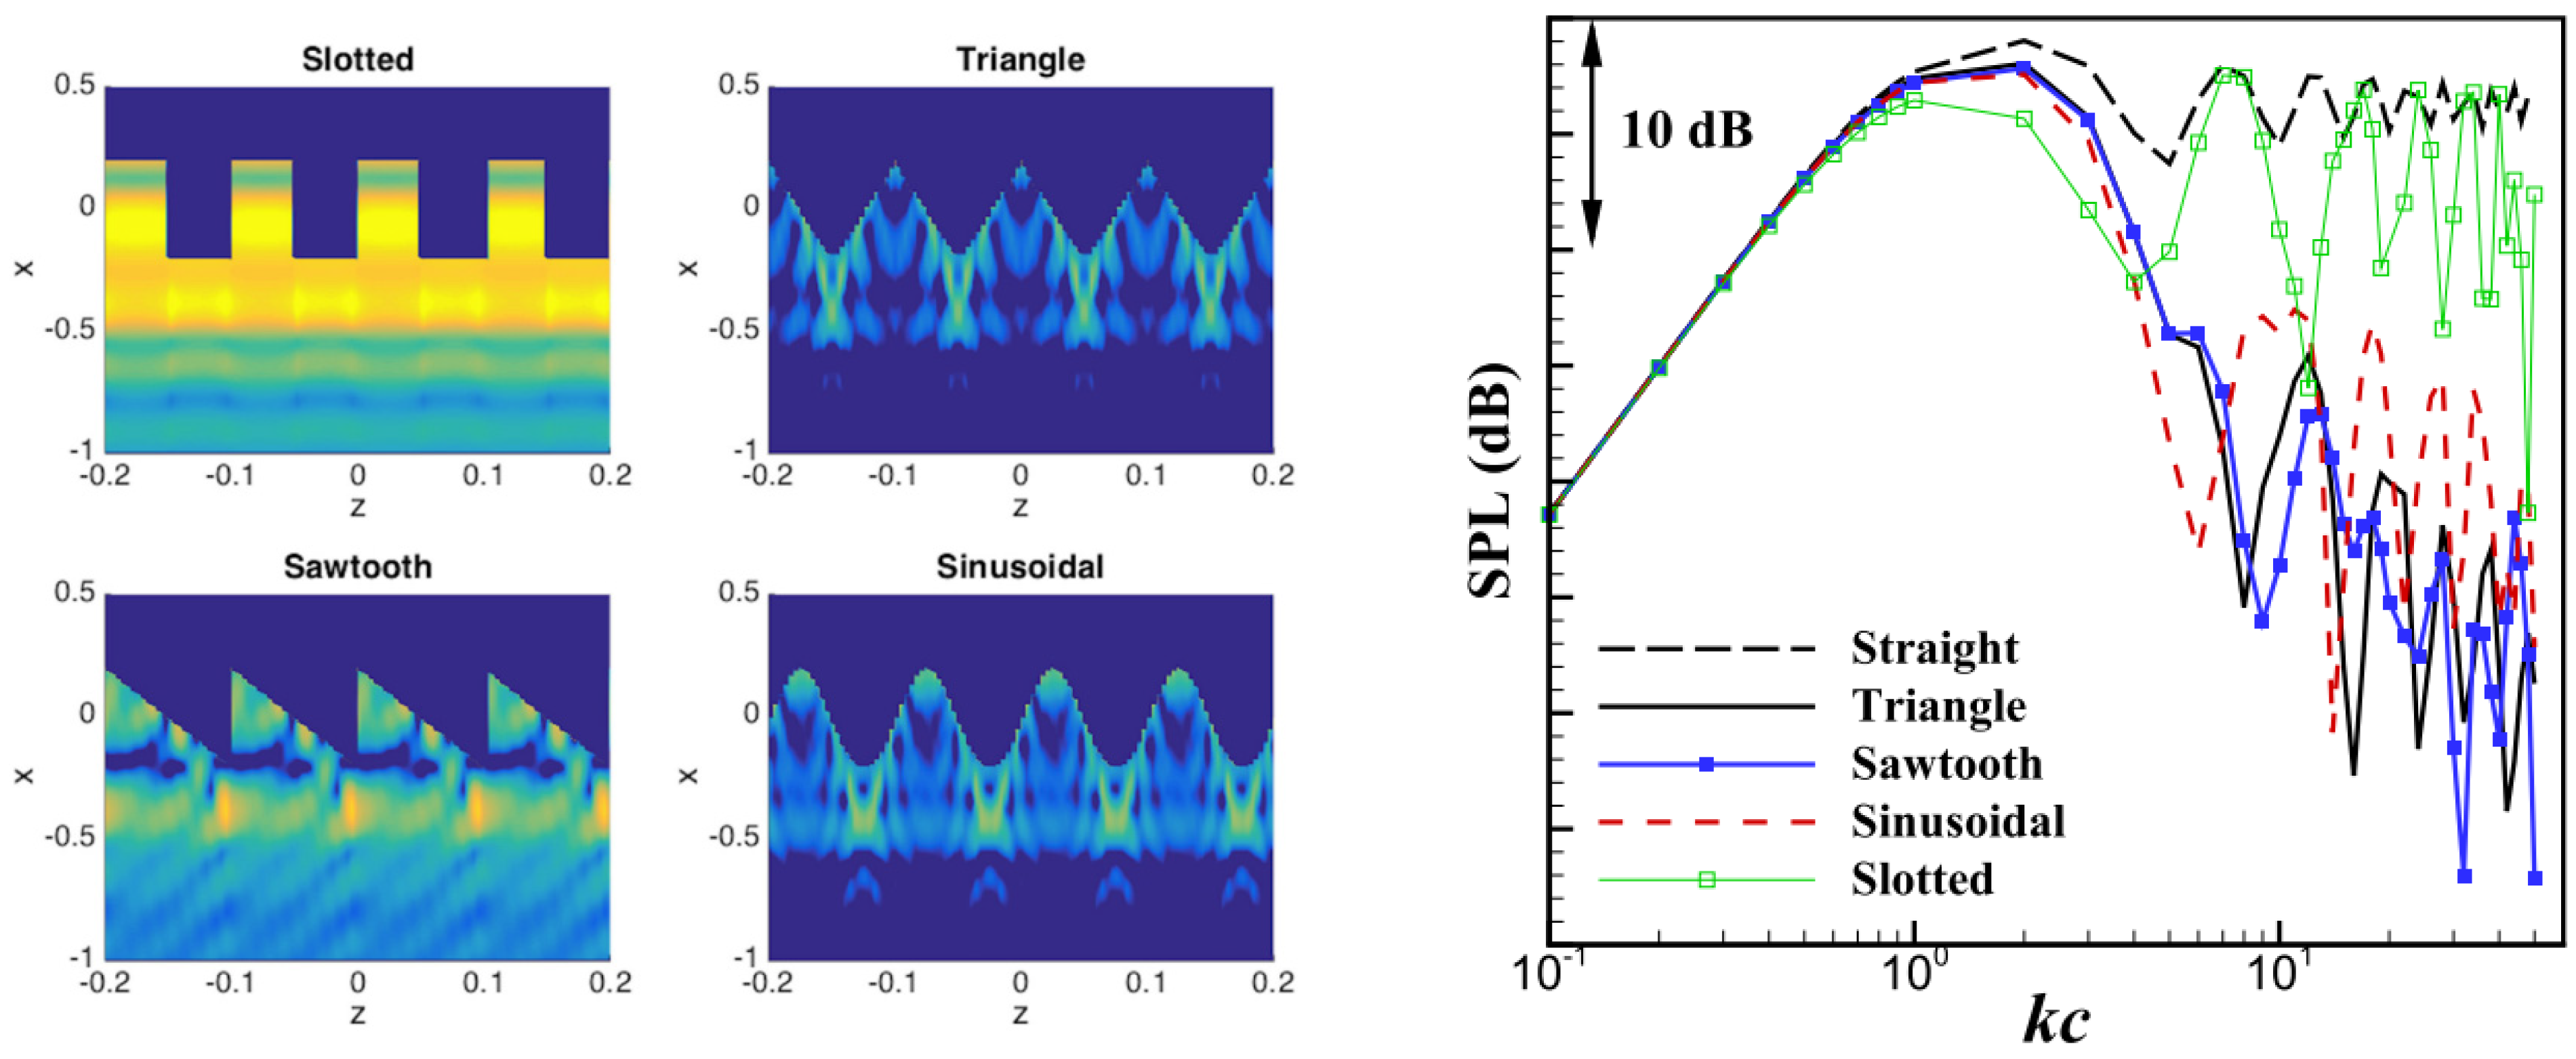
2.3. Trailing Edge Serrated Blades
- -
- expected acoustic spectrum
- -
- oscillatory function associated with the trailing edge
- -
- the term for solid surface pressure
- -
- function for Strouhal number
- -
- correlation of turbulence with lateral direction
- -
- function for estimating noise reduction at the trailing edge
2.4. Generating a Tonal Component
2.5. Generating Broadband Turbulence
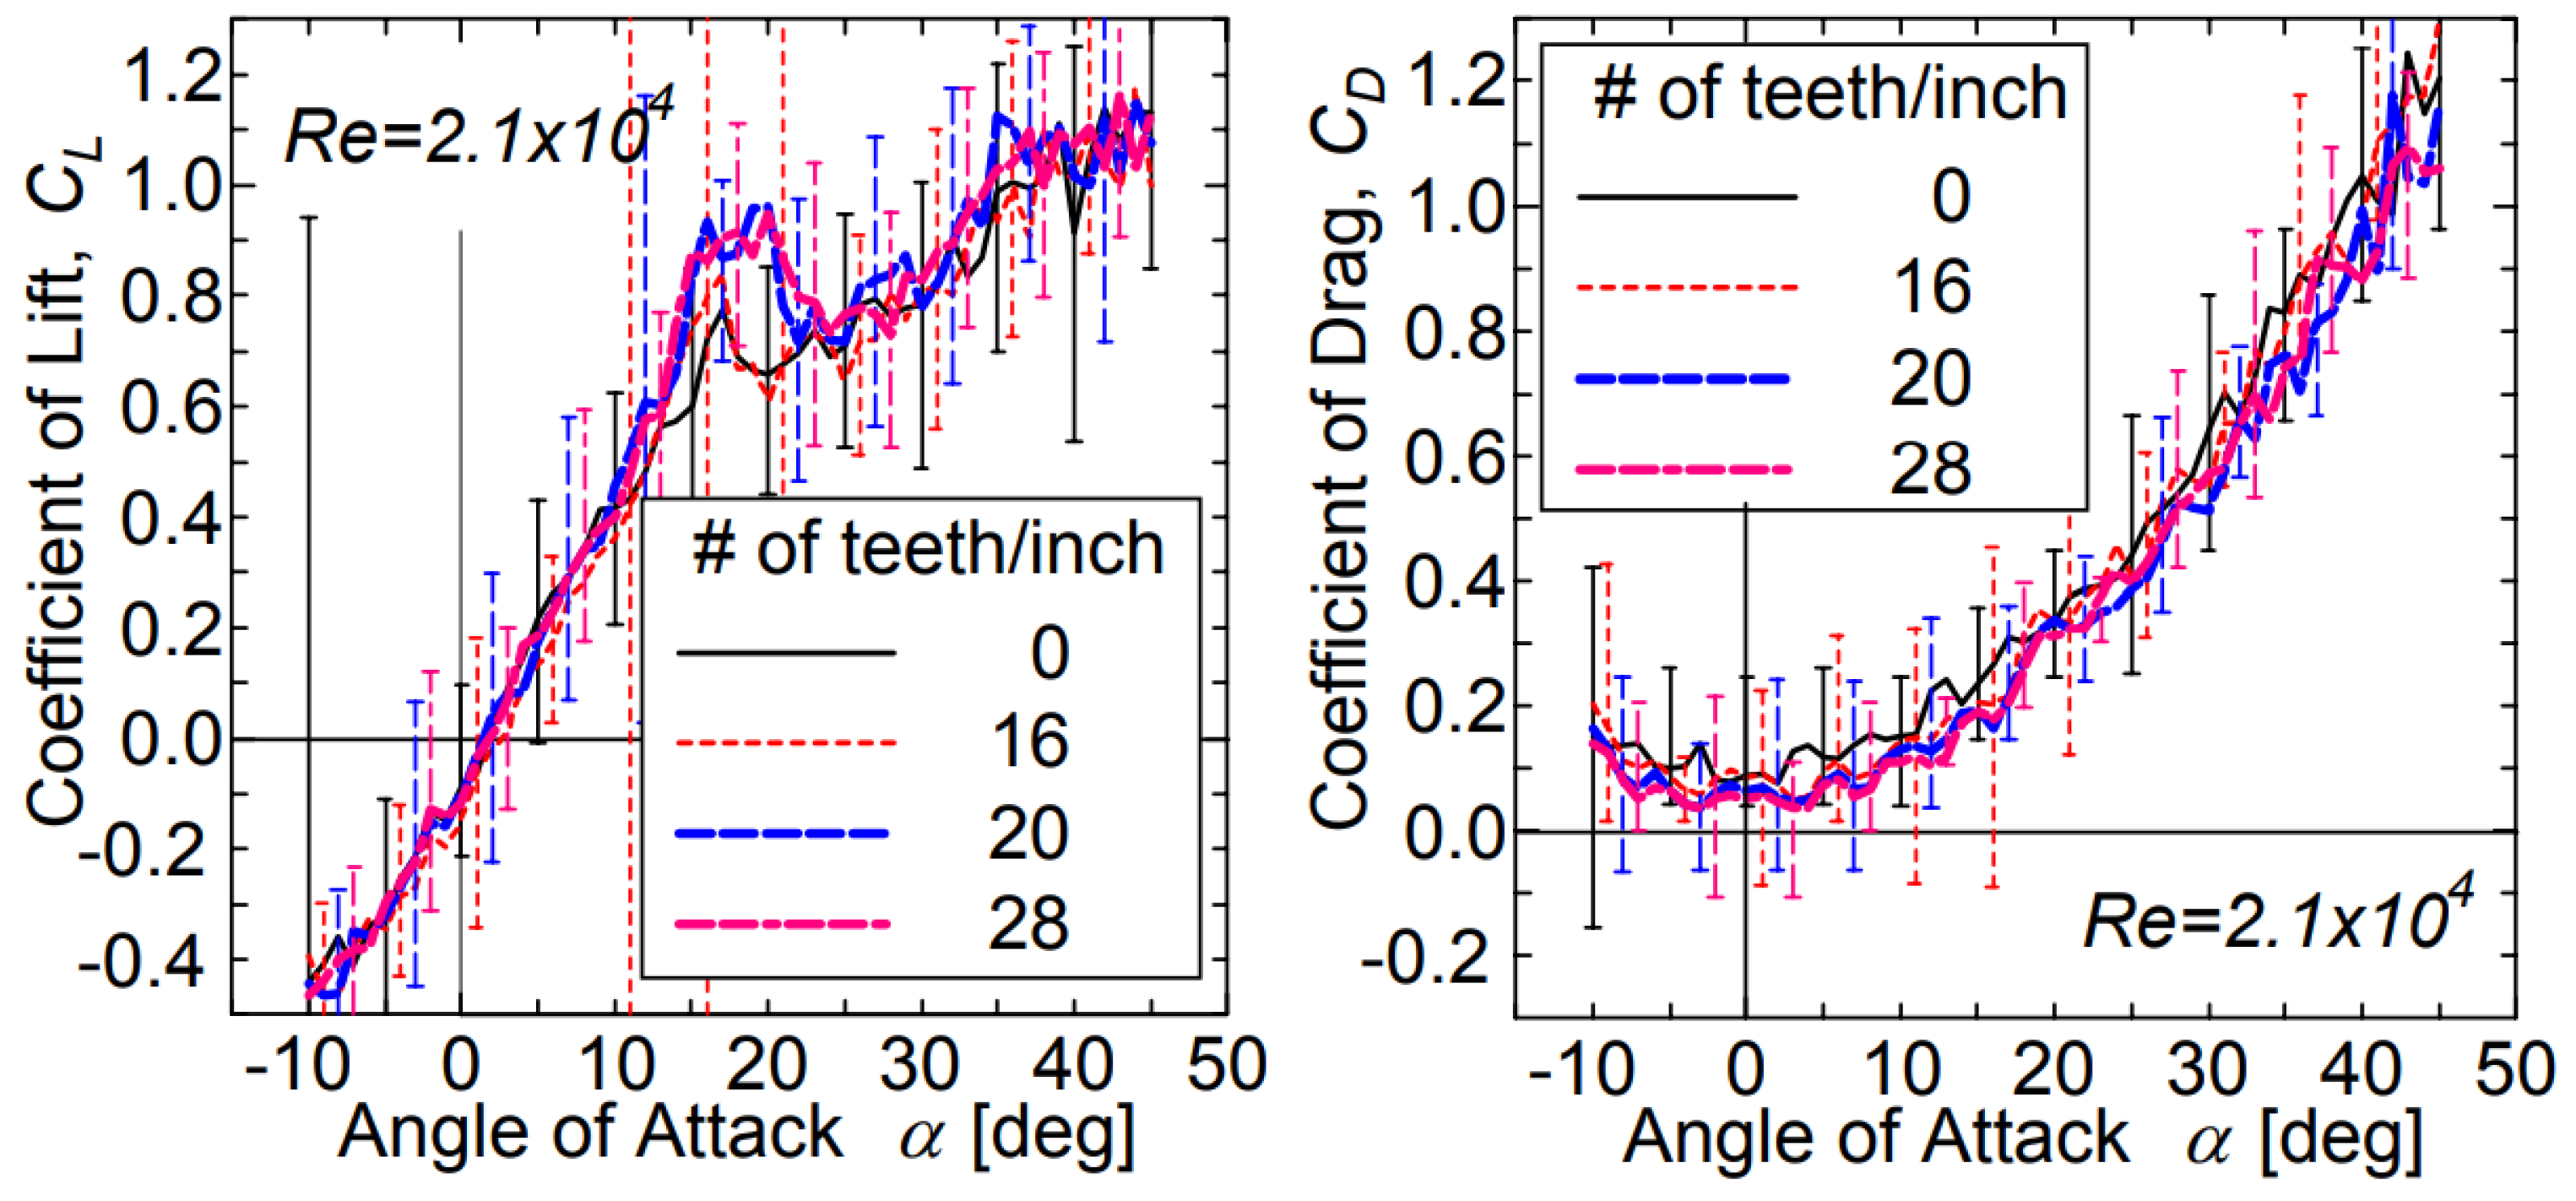
3. Aerodynamic Considerations
4. Configurations of Interest Identified in the Literature
5. Discussions
Author Contributions
Funding
Data Availability Statement
Conflicts of Interest
Nomenclature
| a0 | speed of sound [m/s] |
| c | chord length [m] |
| e | airfoil maximum thickness [m] |
| f | frequency [Hz] |
| h (or 2 h) | serration amplitude |
| h/δ | the dimensionless parameter of the serration amplitude [-] |
| h/λ | the dimensionless parameter associated with the serration angle [-] |
| k | wave number [m−1] |
| M | Mach number [-] |
| L | airfoil length [m] |
| Re | Reynolds number [-] |
| Stδ | Strouhal number [-] |
| U0 | (averaged) speed of the jet [m/s] |
| Uc | convection speed [m/s] |
| δ | turbulent boundary layer thickness [m] |
| λ | serration pitch [m] |
| θ | observer angle [°] |
| ω | angular frequency [rad/Hz] |
| ωδ/Uc | dimensionless frequency parameter [-] |
| Λ | turbulence integral length scale [m] |
| BPF | blade passing frequency [Hz] |
| PSD | power spectal density [W/Hz] |
| SPL | sound pressure level [dB] |
| OASPL | overall sound pressure level [dB] |
| Other notations and abbreviations were defined throughout the paper. | |
References
- Document 02002L0049-20210729, DIRECTIVE 2002/49/EC of the European Parliament and of the Council of 25 June 2002 Relating to the Assessment and Management of Environmental Noise. 2002. Available online: https://eur-lex.europa.eu/legal-content/EN/TXT/?uri=CELEX%3A02002L0049-20210729 (accessed on 16 February 2024).
- Law No. 121 on the Assessment and Management of Ambient Noise, Romanian Parliament, Romania, 3 July 2019. Available online: https://www.caa.ro/w.htm/pages/legislatie-mediu (accessed on 16 February 2024).
- Document 32008R0216, Regulation (EC) No 216/2008 of the European Parliament and of the Council of 20 February 2008 on Common Rules in the Field of Civil Aviation and Establishing a European Aviation Safety Agency, and Repealing Council Directive 91/670/EEC, Regulation (EC) No 1592/2002 and Directive 2004/36/EC (Text with EEA Relevance), OJ L 79, 19.03.2008. Available online: https://eur-lex.europa.eu/legal-content/EN/TXT/?qid=1474978980580&uri=CELEX%3A32008R0216 (accessed on 16 February 2024).
- Document 32012R0748, Commission Regulation (EU) No 748/2012 of 3 August 2012 Laying down Implementing Rules for the Airworthiness and Environmental Certification of Aircraft and Related Products, Parts and Appliances, as well as for the Certification of Design and Production Organisations (Recast) Text with EEA Relevance, OJ L 224, 21.8.2012, pp. 1–85. Available online: https://eur-lex.europa.eu/legal-content/EN/TXT/?qid=1473415871666&uri=CELEX%3A32012R0748 (accessed on 16 February 2024).
- Document 32014R0598, Regulation (EU) No 598/2014 of the European Parliament and of the Council of 16 April 2014 on the Establishment of Rules and Procedures with Regard to the Introduction of Noise-Related Operating Restrictions at Union Airports within a Balanced Approach and Repealing Directive 2002/30/EC, OJ L 173, 12.6.2014, pp. 65–78. Available online: https://eur-lex.europa.eu/legal-content/EN/TXT/?uri=celex%3A32014R0598 (accessed on 16 February 2024).
- Document 32006L0093, Directive 2006/93/EC of the European Parliament and of the Council of 12 December 2006 on the Regulation of the Operation of Aeroplanes Covered by Part II, Chapter 3 , Volume 1 of Annex 16 to the Convention on International Civil Aviation, Second Edition (1988) (Codified Version) (Text with EEA Relevance), OJ L 374, 27.12.2006, pp. 1–4. Available online: https://eur-lex.europa.eu/legal-content/EN/TXT/?uri=CELEX%3A32006L0093 (accessed on 16 February 2024).
- Curle, N. The influence of solid boundaries upon aerodynamic sound. Proc. R. Soc. London. Ser. A. Math. Phys. Sci. 1955, 231, 505–514. [Google Scholar] [CrossRef]
- Turner, J.M.; Kim, J.W. Quadrupole noise generated from a low-speed aerofoil in near- and full-stall conditions. J. Fluid Mech. 2022, 936, A34. [Google Scholar] [CrossRef]
- Lighthill, M.J. On Sound Generated Aerodynamically. I. General Theory. Proc. R. Soc. London. Ser. A Math. Phys. Sci. 1952, 211, 564–587. [Google Scholar]
- Amiet, R. Acoustic radiation from an airfoil in a turbulent stream. J. Sound Vib. 1975, 41, 407–420. [Google Scholar] [CrossRef]
- Tian, Y.; Cotté, B.; Chaigne, A. Wind Turbine Noise Modelling Based on Amiet’s Theory. In Proceedings of the 5th International Meeting on Wind Turbine Noise, Denver, CO, USA, 28–30 August 2013. [Google Scholar]
- Lyu, B.; Azarpeyvand, M. On the noise prediction for serrated leading edges. J. Fluid Mech. 2017, 826, 205–234. [Google Scholar] [CrossRef]
- Weger, M.; Wagner, H. Morphological Variations of Leading-Edge Serrations in Owls (Strigiformes). PLoS ONE 2016, 11, e0149236. [Google Scholar] [CrossRef] [PubMed]
- Clair, V.; Polacsek, C.; Le Garrec, T.; Reboul, G. CAA methodology to simulate turbulence-airfoil noise. In Proceedings of the 18th AIAA/CEAS Aeroacoustics Conference (33rd AIAA Aeroacoustics Conference), Colorado Springs, CO, USA, 4–6 June 2012. [Google Scholar] [CrossRef]
- Lau, A.S.; Haeri, S.; Kim, J.W. The effect of wavy leading edges on aerofoil–gust interaction noise. J. Sound Vib. 2013, 332, 6234–6253. [Google Scholar] [CrossRef]
- Narayanan, S. Airfoil Noise Reductions through Leading Edge Serrations; University of Southampton: Southampton, UK.
- Narayanan, S.; Joseph, P.; Haeri, S.; Kim, J.; Paruchuri, C.; Polacsek, C. Noise Reduction Studies from the Leading Edge of Serrated Flat Plates. In Proceedings of the 20th AIAA/CEAS Aeroacoustics Conference, Atlanta, GA, USA, 16–20 June 2014. [Google Scholar]
- Paruchuri, C.C.; Narayanan, S.; Joseph, P.; Kim, J.W. Leading edge serration geometries for significantly enhanced leading edge noise reductions. In Proceedings of the 22nd AIAA/CEAS Aeroacoustics Conference, Lyon, France, 30 May–1 June 2016. [Google Scholar] [CrossRef]
- Kim, J.W.; Haeri, S.; Joseph, P.F. On the reduction of aerofoil–turbulence interaction noise associated with wavy leading edges. J. Fluid Mech. 2016, 792, 526–552. [Google Scholar] [CrossRef]
- Biedermann, T.M.; Chong, T.P.; Kameier, F.; Paschereit, C.O. Airfoil Noise Subjected to Leading-Edge Serrations. AIAA J. 2017, 55, 3128–3142. [Google Scholar] [CrossRef]
- Amiet, R. Airfoil gust response and the sound produced by airfoil-vortex interaction. J. Sound Vib. 1986, 107, 487–506. [Google Scholar] [CrossRef]
- Paterson, W.; Amiet, R.K. Acoustic Radiation and Surface Pressure Response of an Airfoil Due to Incident Turbulence. NASA CR-2733. Available online: https://ntrs.nasa.gov/citations/19760025886 (accessed on 16 February 2024).
- Polacsek, C.; Clair, V.; Reboul, G.; Denia, H. Turbulence-Airfoil Interacțion Noise Reduction Using Wavy Leading Edge: An Experimental and Numerical Study; Institute of Noise Control Engineering/Japan & Acoustical Society of Japan: Osaka, Japan, 2011; pp. 170–180. [Google Scholar]
- Buszyk, M.; Polacsek, C.; Le Garrec, T.; Barrier, R.; Clair, V.; Salze, E.; Bailly, C. Aeroacoustic assessment of a rectilinear cascade with leading edge serrations: Predictions and measurements. Comput. Fluids 2024, 271, 106179. [Google Scholar] [CrossRef]
- Howe, M.S. Noise Produced by a Sawtooth Trailing Edge. J. Acoust. Soc. Am. 1991, 90, 482. [Google Scholar] [CrossRef]
- Al Tlua, B. Experimental Wind Tunnel Testing and Numerical Optimization Studies for Airfoil Trailing Edge Noise Reduction. Ph.D. Thesis, Ottawa-Carleton Institute for Mechanical and Aerospace Engineering, Ottawa, ON, Canada, 2021. [Google Scholar]
- Moreau, D.; Brooks, L.; Doolan, C. On the noise reduction mechanism of a flat plate serrated trailing edge at low-to-moderate Reynolds number. In Proceedings of the 18th AIAA/CEAS Aeroacoustics Conference (33rd AIAA Aeroacoustics Conference), Colorado Springs, CO, USA, 4–6 June 2012. [Google Scholar]
- Lyu, B.; Azarpeyvand, M.; Sinayoko, S. Prediction of noise from serrated trailingedges. J. Fluid Mech. 2016, 793, 168. [Google Scholar] [CrossRef]
- Lau, A.S.H.; Huang, X. The control of aerodynamic sound due to boundary layer pressure gust scattering by trailing edge serrations. J. Sound Vib. 2018, 432, 133–154. [Google Scholar] [CrossRef]
- Woodhead, P.C.; Chong, T.P.; Joseph, P.F.; Vathylakis, A. Aerofoil self-noise radiations subjected to serration flap angles. Exp. Fluids 2021, 62, 152. [Google Scholar] [CrossRef]
- Liu, X.; Azarpeyvand, M.; Theunissen, R. Aerodynamic and Aeroacoustic Performance of Serrated Airfoils. In Proceedings of the 21st AIAA/CEAS Aeroacoustics Conference, Dallas, TX, USA, 22–26 June 2015. [Google Scholar] [CrossRef]
- León, C.A.; Ragni, D.; Pröbsting, S.; Scarano, F.; Madsen, J. Flow topology and acoustic emissions of trailing edge serrations at incidence. Exp. Fluids 2016, 57, 1–17. [Google Scholar] [CrossRef]
- Chen, W.; Mao, L.; Xiang, K.; Tong, F.; Qiao, W. The Application of a Linear Microphone Array in the Quantitative Evaluation of the Blade Trailing-Edge Noise Reduction. Appl. Sci. 2021, 11, 57. [Google Scholar] [CrossRef]
- Ryi, J.; Choi, J. Estimation Method to Achieve a Noise Reduction Effect of Airfoil with a Serrated Trailing Edge for Wind Turbine Rotor. In Stability Control and Reliable Performance of Wind Turbines; InTech: Rijeka, Italy, 2018. [Google Scholar] [CrossRef]
- Teruna, C.; Avallone, F.; Casalino, D.; Ragni, D. Numerical investigation of leading edge noise reduction on a rod-airfoil configuration using porous materials and serrations. J. Sound Vib. 2020, 494, 115880. [Google Scholar] [CrossRef]
- Jiang, M.; Li, X.-D.; Zhou, J.-J. Experimental and numerical investigation on sound generation from airfoil-flow interaction. Appl. Math. Mech. 2011, 32, 765–776. [Google Scholar] [CrossRef]
- Greschner, B.; Peth, S.; Moon, Y.J.; Seo, J.H.; Jacob, M.C.; Thiele, F. Three-dimensional predictions of the rod wake-airfoil interacțion noise by hybrid methods. In Proceedings of the 14th International Congress on Sound and Vibration 2007, ICSV 2007, Cairns, Australia, 9–12 July 2007; Volume 2, pp. 1599–1610. [Google Scholar]
- Sreenivasan, A.A.R.; Iyer, B.K. Enhanced wall turbulence model for flow over cylinder at high Reynolds number. AIP Adv. 2019, 9, 095012. [Google Scholar] [CrossRef]
- Liu, L.; Zhang, L.; Wu, B.; Chen, B.; Aecom, P. Numerical and Experimental Studies on Grid-Generated Turbulence in Wind Tunnel. J. Eng. Sci. Technol. Rev. 2017, 10, 159–169. [Google Scholar] [CrossRef]
- Gruber, M. Airfoil Noise Reduction by Edge Treatments. Ph.D. Thesis, University of Southampton, Southampton, UK, 2012. Available online: https://eprints.soton.ac.uk/349012/ (accessed on 16 February 2024).
- Chaitanya, P.; Joseph, P.; Narayanan, S.; Vanderwel, C.; Turner, J.; Kim, J.W.; Ganapathisubramani, B. Performance and mechanism of sinusoidal leading edge serrations for the reduction of turbulence–aerofoil interaction noise. J. Fluid Mech. 2017, 818, 435–464. [Google Scholar] [CrossRef]
- Lyu, B.; Ayton, L.J. Rapid noise prediction models for serrated leading and trailing edges. J. Sound Vib. 2019, 469, 115136. [Google Scholar] [CrossRef]
- Paruchuri, C. Aerofoil Geometry Effects on Turbulence Interacțion Noise. Ph.D. Thesis, University of Southampton, Southampton, UK, 2017. Available online: https://eprints.soton.ac.uk/415884/ (accessed on 16 February 2024).
- Al-Okbi, Y.; Chong, T.P.; Stalnov, O. Leading Edge Blowing to Mimic and Enhance the Serration Effects for Aerofoil. Appl. Sci. 2021, 11, 2593. [Google Scholar] [CrossRef]
- Tong, F.; Qiao, W.; Chen, W.; Cheng, H.; Wei, R.; Wang, X. Numerical analysis of broadband noise reduction with wavy leading edge. Chin. J. Aeronaut. 2018, 31, 1489–1505. [Google Scholar] [CrossRef]
- Ito, S. Aerodynamic Influence of Leading-Edge Serrations on an Airfoil in a Low Reynolds Number—A Study of an Owl Wing with Leading Edge Serrations. J. Biomech. Sci. Eng. 2009, 4, 117–123. [Google Scholar] [CrossRef]
- Lacagnina, G.; Chaitanya, P.; Kim, J.-H.; Berk, T.; Joseph, P.; Choi, K.-S.; Ganapathisubramani, B.; Hasheminejad, S.M.; Chong, T.P.; Stalnov, O.; et al. Leading edge serrations for the reduction of aerofoil self-noise at low angle of attack, pre-stall and post-stall conditions. Int. J. Aeroacoustics 2020, 20, 130–156. [Google Scholar] [CrossRef]
- Liu, X.; Jawahar, H.K.; Azarpeyvand, M.; Theunissen, R. Wake Development of Airfoils with Serrated Trailing Edges. In Proceedings of the 22nd AIAA CEAS Aeroacoustics Conference [AIAA 2016-2817] American Institute of Aeronautics and Astronautics Inc. (AIAA), Lyon, France, 30 May–1 June 2016. [Google Scholar]
- Salama, Y. Experimental and Numerical Investigation of Bio-Inspired Airfoil Trailing-Edge Designs for Noise Reduction. Available online: https://repository.library.carleton.ca/concern/etds/k06988420 (accessed on 16 February 2024).
- Shyam, V.; Ameri, A.; Poinsatte, P.; Thurman, D.; Wroblewski, A.; Snyder, C. Application of Pinniped Vibrissae to Aeropropulsion. In Proceedings of the ASME Turbo Expo 2015: Turbine Technical Conference and Exposition, Montreal, QC, Canada, 15–19 June 2015. [Google Scholar] [CrossRef]
- Rajeshwaran, M.S.; Kushari, A. Experimental Study on the Flow Past Sinusoidal Leading Edge Serrations in a Compressor Cascade. In Proceedings of the ASME 2015 Gas Turbine India Conference, Hyderabad, India, 2–3 December 2015. [Google Scholar] [CrossRef]
- Smith, E.G.; Sowers, H.D. Cascade Tests of Serrated Leading Edge Blading at High Subsonic Speeds. NASA CR-2472; 1974. Available online: https://ntrs.nasa.gov/api/citations/19750003911/downloads/19750003911.pdf (accessed on 16 February 2024).
- Qiao, W.; Ji, L.; Tong, W.; Xu, K.; Chen, W. Application of Phased Array în the Study of Linear Cascade Noise Reduction on the Indoor Test Bed. In Proceedings of the 5th Berlin Beamforming Conference, Berlin, Germany, 19–20 February 2014. [Google Scholar]
- Craig, M.E. Trailing-Edge Blowing of Model Fan Blades for Wake Management. Master’s Thesis, Virginia Polytechnic Institute and State University, Blacksburg, VA, USA, 2005. Available online: https://vtechworks.lib.vt.edu/server/api/core/bitstreams/047d5593-a779-47d8-86a4-ee7ca22a75aa/content (accessed on 16 February 2024).
- Geiger, D. Comparative Analysis of Serrated Trailing Edge Designs on Idealized Aircraft Engine Fan Blades for Noise Reduction. Master’s Thesis, Virginia Polytechnic Institute and State University, Blacksburg, VA, USA, 2004. Available online: https://vtechworks.lib.vt.edu/items/6caef5e2-88ac-4037-b95c-7f5bfa4fbc51 (accessed on 16 February 2024).
- Ye, X.; Zheng, N.; Zhang, R.; Li, C. Effect of serrated trailing-edge blades on aerodynamic noise of an axial fan. J. Mech. Sci. Technol. 2022, 36, 2937–2948. [Google Scholar] [CrossRef]
- Teruna, C.; Ragni, D.; Avallone, F.; Casalino, D. A rod-linear cascade model for emulating rotor-stator interaction noise in turbofans: A numerical study. Aerosp. Sci. Technol. 2019, 90, 275–288. [Google Scholar] [CrossRef]
- Liu, X.; Zang, B.; Azarpeyvand, M. Wake-aerofoil interaction noise control with trailing-edge serrations. Exp. Therm. Fluid Sci. 2021, 130, 110510. [Google Scholar] [CrossRef]
- Alkhalifa, A.S.; Uddin, M.N.; Atkinson, M. Aerodynamic Performance Analysis of Trailing Edge Serrations on a Wells Turbine. Energies 2022, 15, 9075. [Google Scholar] [CrossRef]
- Polacsek, C.; Cader, A.; Buszyk, M.; Barrier, R.; Gea-Aguilera, F.; Posson, H. Aeroacoustic design and broadband noise predictions of a fan stage with serrated outlet guide vanes. Phys. Fluids 2020, 32, 107107. [Google Scholar] [CrossRef]
- Kumar, S.; Singh, S.K.; Jha, S.; Baskaran, K.; Srinivasan, K.; Narayanan, S. On the reductions of airfoil broadband noise through circular dimples. Appl. Acoust. 2024, 217, 109819. [Google Scholar] [CrossRef]
- Yang, C.; Liu, Y.; Zhang, X.; Bi, C. Hybrid control of aerofoil self-noise by coupling air blowing and trailing-edge serration. J. Sound Vib. 2024, 575, 118265. [Google Scholar] [CrossRef]
- Zhang, C.; Cheng, W.; Du, T.; Sun, X.; Shen, C.; Chen, Z.; Liang, D. Experimental and numerical study on noise reduction of airfoil with the bioinspired ridge-like structure. Appl. Acoust. 2023, 203, 109190. [Google Scholar] [CrossRef]
- Amirsalari, B.; Rocha, J. Recent Advances in Airfoil Self-Noise Passive Reduction. Aerospace 2023, 10, 791. [Google Scholar] [CrossRef]
- Fiscaletti, D.; Pereira, L.T.L.; Ragni, D. Finlet rails for the reduction of the trailing-edge noise. J. Sound Vib. 2024, 568, 118072. [Google Scholar] [CrossRef]


| Crt. No. | Serration Shape | Author, Year | Solution Type | Type of Turbulence | Results | Observations | ||
|---|---|---|---|---|---|---|---|---|
| 2D | 3D | Grid | Rod | |||||
| 1 |  Sinusoidal [15] | Lau et al. [15], 2013 | ☒ | - | - | LEA/λ ≈ 1 for maximum noise reduction (minimum LEA/λ ˃ 3) | Simulation, no grid, upstream pressure fluctuations model | |
| 2 | Triangular flat plate | Lyu et al. [12], 2017 | ☒ | ☒ | ωh/U >> 1 for significant noise reductions | Analytic model | ||
| 3 | Complex sinusoidal  [18] [18] | Chaitanya et al. [18], 2016 | ☒ | ☒ | htt/λ = 1 optimum (as a result of interferences) | experimental Umax ~ 80 m/s | ||
| 4 | Complex sinusoidal  [18] [18] | ☒ | Weak aerodynamic performances at low AoA | |||||
| 5 | Triangular cut-outs [18] [18] | ☒ | High lc/λ for low freq. performances (lc-cutout width) | |||||
| 6 | Triangular serration with slots  [18] [18] | ☒ | Optimum width– pitch ratio (here w/λ = 0.13) | |||||
| 7 | Triangular serration with slots  [18] [18] | ☒ | As good as 2D at fh/U > 0.8; low performances for fh/U > 0.8 | |||||
| 8 | Double triangular slots  [18] [18] | ☒ | Better with higher slot height; optimum reached as for straight slot | |||||
| 9 | Sinusoidal  [41] [41] | Chaitanya et al. [41], 2017 | ☒ | ☒ | Max. acoustic performance for λ/Λt ≈ 4; acoustic power reduction 10lg(Sth) + 10 [dB] | experimental Umax ~ 60 m/s | ||
| 10 | Sinusoidal  [20] [20] | Biedermann et al. [20], 2017 | ☒ | ☒ | Optimum as a function of turbulence parameters; low λ for low Tu | experimental Re ~ 105 (U ~ 61.4 m/s) | ||
| 11 | Various height slots 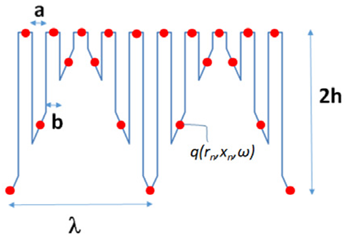 [43] [43] | Chaitanya [43], 2017 | ☒ | ☒ | Improved performance for f·(2 h)/U < 1 | experimental Umax ~ 60 m/s | ||
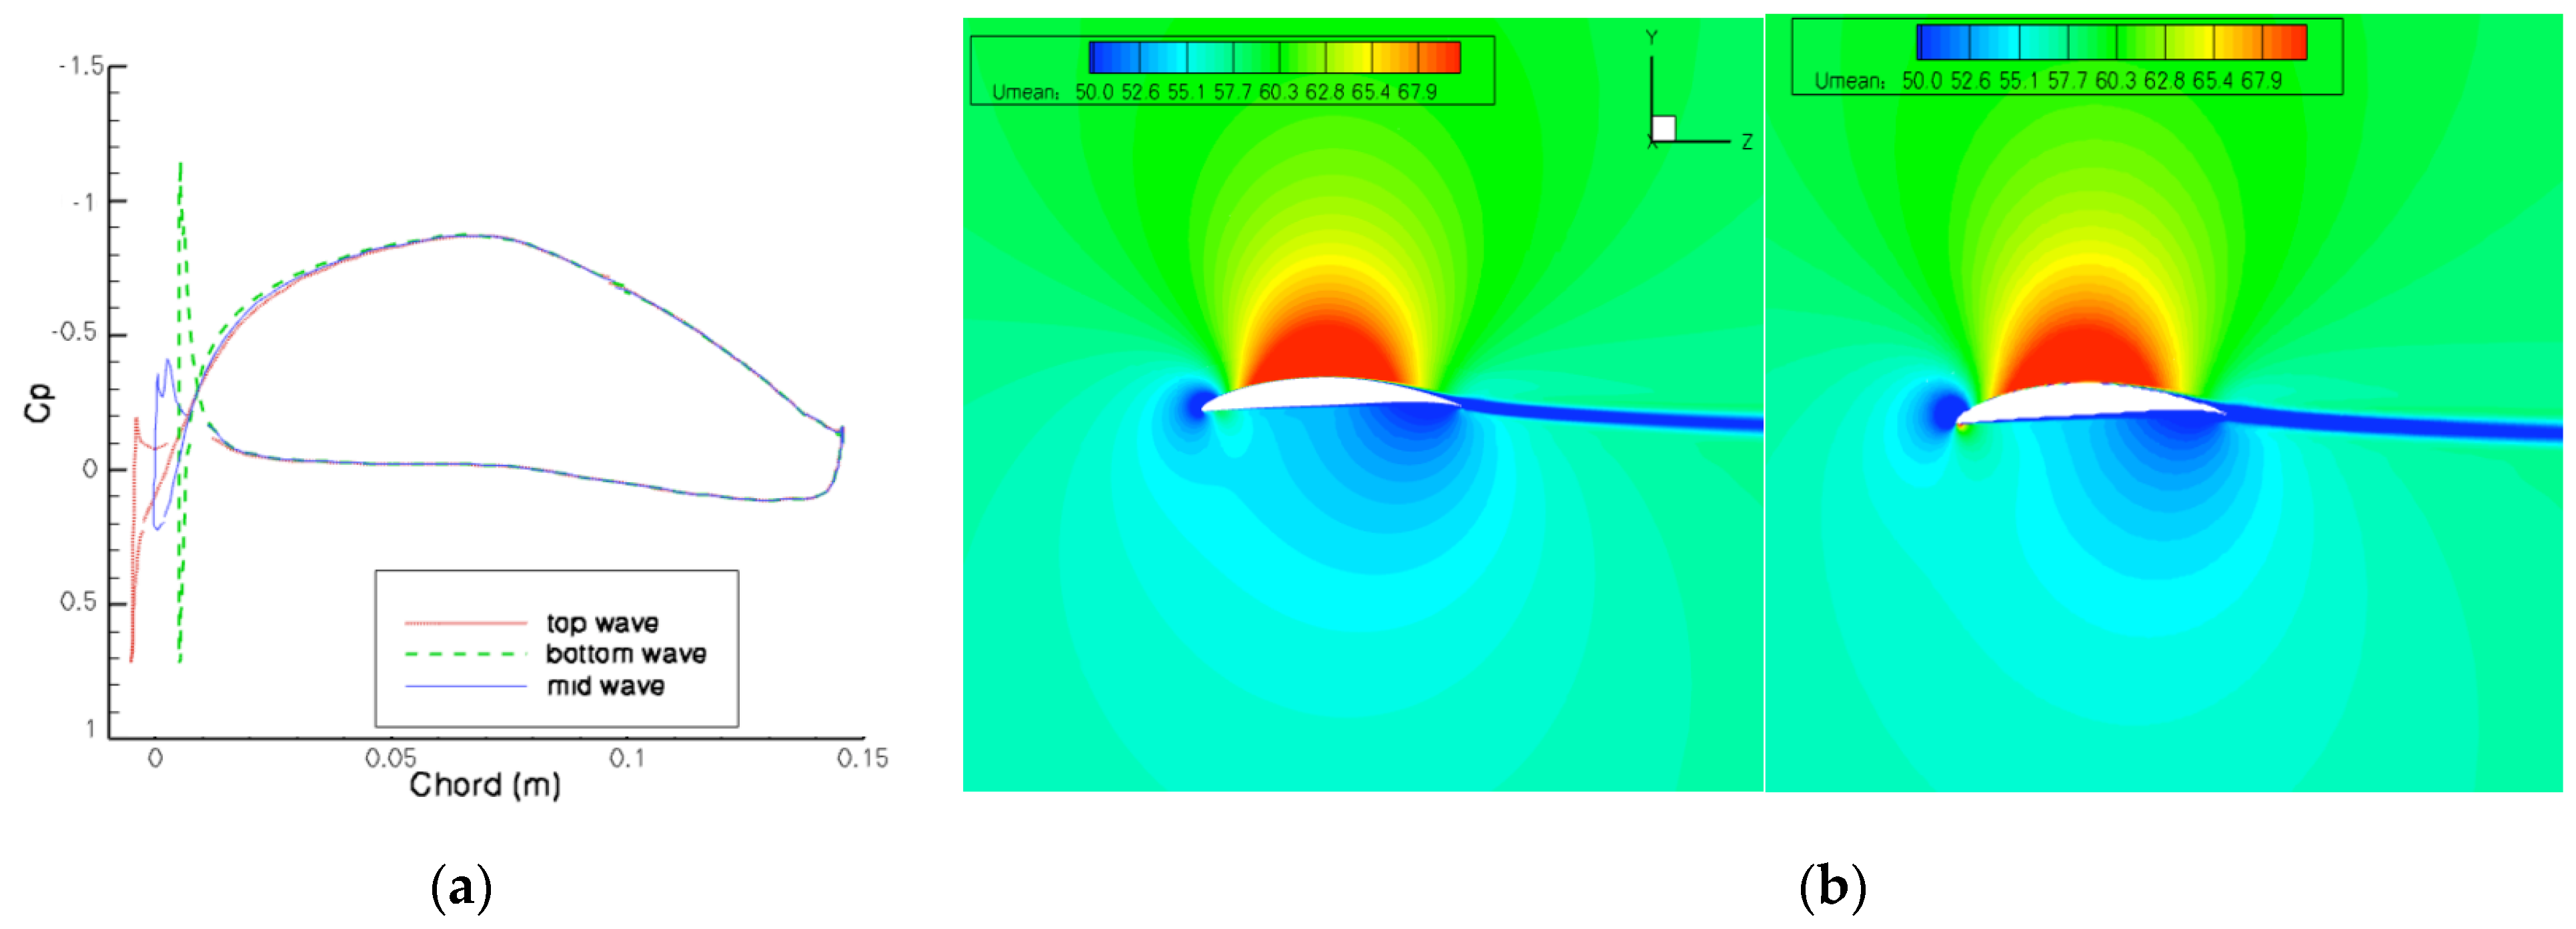
| 12 | Sinusoidal  [45] [45] | Tong et al. [45], 2018 | ☒ | ☒ | Lower arodynamic fluctuations due to wavy LE; no directivity impact | numerical Umax ~ 40 m/s Reflow ~ 4 × 10⁵ Rerod ~ 2.6 × 10⁴ | ||
| 13 | Sinusoidal  [16] [16] | Narayanan et al. [16], 2015 | ☒ | ☒ | Important noise reductions in the 1 < f·c/U < 3 range; similar for f > U/4 h | experimental Umax ~ 80 m/s | ||
| 14 | Sinusoidal  [14] [14] | Clair et al. [14], 2012 | ☒ | No lateral gust component can overestimate acoustic performance (below 3 kHz) | numerical; V.K. synthetic turbulence; Umax ~ 60 m/s | |||
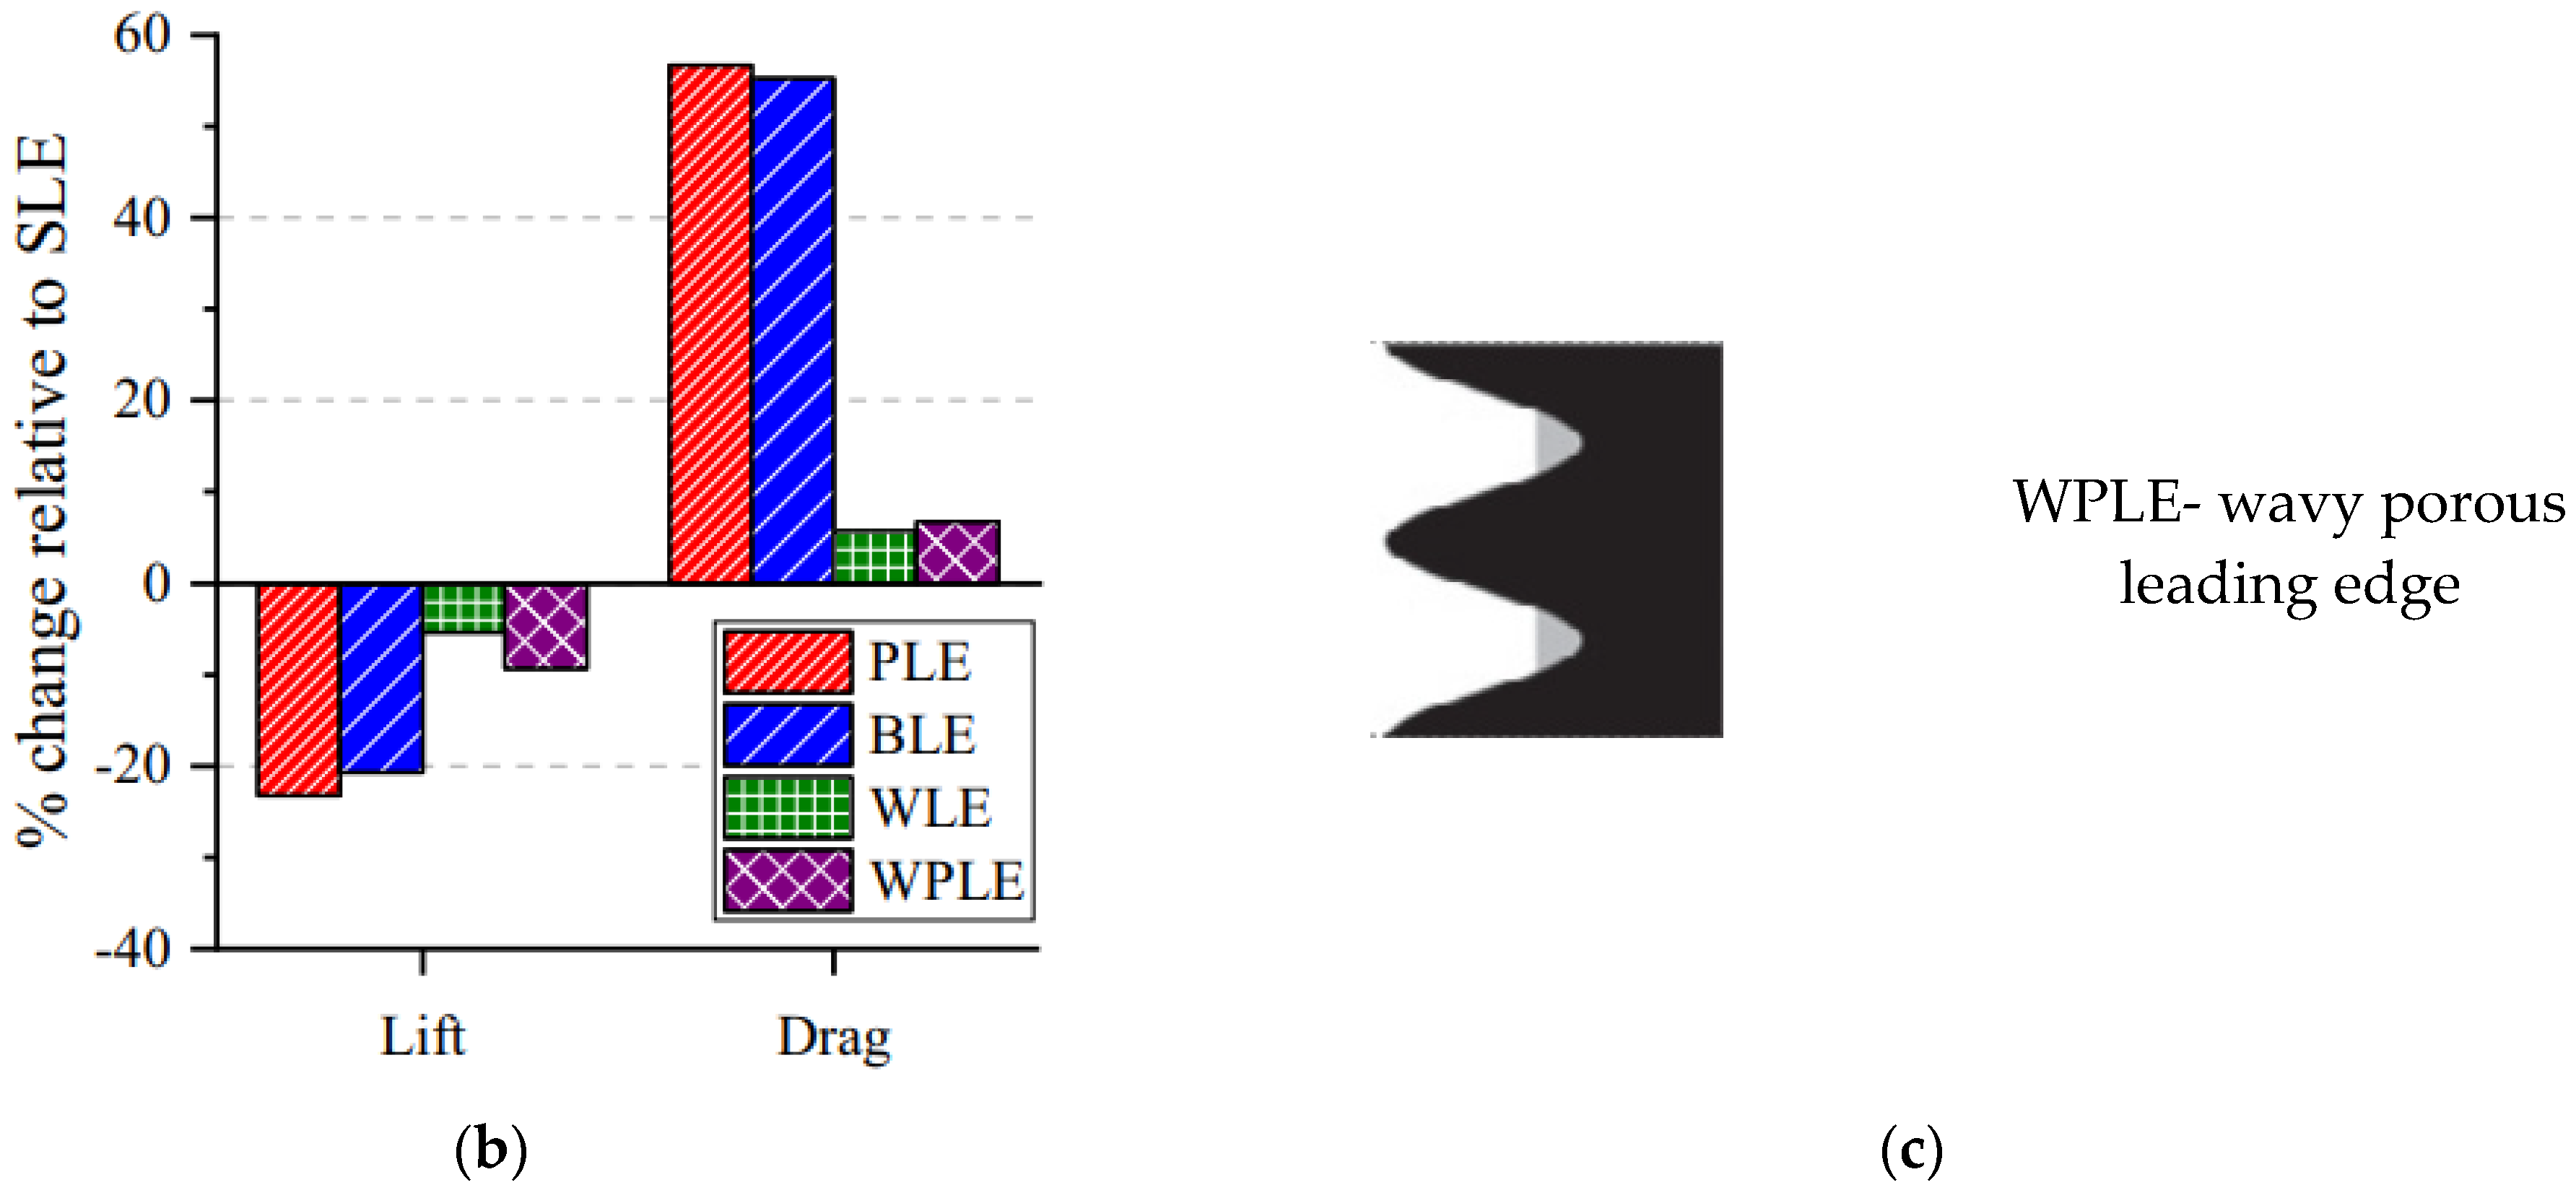
| 15 |  [35] [35] | Teruna et al. [35], 2020 | ☒ | ☒ | Adding porous material to LE further increased the serration effects | numerical; M = 0.22; Rerod ~ 4.8 × 10⁴ | ||
| 16 |  [46] [46] | S. ITO [46], 2009 | ☒ | Increased AoA range at low speeds; less violent laminar–turbulent transitions; low-intensity vorticies | experimental; no grid wind tunnel; Re ~ 5.5 × 10⁵ | |||
| 17 |  [23] [23] | Polacsek et al. [23], 2011 | Amiet’s theory cannot fully reproduce experiments, but the numerical approach is close | experimental and numerical; synthetic turbulence; Umax ~ 60 m/s | ||||
| 18 |  [19] [19] | Kim et al. [19] | ☒ | OASPL decreases linearly with h; increasing profile thickness alters noise reduction | numerical; synthetic turbulence; Umax ~ 80 m/s | |||
| 19 |  [47] [47] | Lacagnina [47], 2021 | ☒ | LE serations on 1/3 chord length; self-noise reduced by 3 dB; high λ—good in the mid-frequency area; low λ for less altered CL | Experimental, Re ~ 4 × 10⁵, Umax ~ 40 m/s | |||
| Crt. No. | Serration Shape | Author, Year | Solution Type | Results/Observations | ||
|---|---|---|---|---|---|---|
| 2D | 3D | |||||
| 1 |  [40] [40] | Gruber [40], 2012 | ☒ | Experimental; Umax ~ 80 m/s Noise increases at high frequencies, contrary to theory. Acoustic power reduction increases with decreasing λ/δ; in the high frequency range, OASPL is proportional to f−5 | ||
 [40] [40] | ||||||
 [40] [40] | ☒ | Performance depends very little on incidence (porosity 8–10%); poorer performance than the non-perforated version (at medium frequencies) | ||||
 [40] [40] | ||||||
 [40] [40] | ☒ | The reduction increases with increasing channel depth (at f > 500 Hz); the effect is maintained even at high f, up to 10 kHz; a smaller channel width is desirable | Umax ~ 80 m/s | |||
 [40] [40] | ☒ | Lower amplitude tends to achieve a better and more consistent reduction over a wider frequency band | Umax ~ 80 m/s | |||
| 2 |  [34] [34] | Ryi & Choi [34], 2018 | ☒ | Variants with λ/h = 2 perform better at low frequencies ~1 kHz (compared to λ/h = 1); aerodynamically, the same trend was identified (higher CL for high λ) | Experimental Umax ~ 30 m/s | |
| 3 | Triangular serrations | Lyu et al. [28], 2015 | ☒ | ωh/U >> 1 (Howe) = kc > 1; kh >> 1 for good performance; Higher ΔOASLP with increasing h/λ ratios; Very high h/λ ~ good at high f. | Analytical, imposed turbulence, M = 0.1 | |
| 4 |  [27] [27] | Moreau et al. [27], 2012 | ☒ | Stδ = 1 delimits noise reduction/increase zones; Narrow serrations: Stδ < 0.13; Wide serrations: Stδ < 0.2 | Experimental Umax ~ 38 m/s Re ~ (2–8.3) × 105 | |
| 5 | Triangular serrations | Howe [25], 1991 | ☒ | Noise reduction law: 10lg(1 + (2·2h/λ)2) [dB] for λ/h < 4 | Analythical | |
| 6 |  [31] [31] | Liu et al. [31], 2015 | ☒ | The PSD spectrum decreases in intensity near the serration root; Serrations do not modify the CZ = f(α) shape but lower the value | Experimental Umax ~ 50 m/s Re ~ (2–2.5) × 105 | |
| 7 |  [32] [32] | Leon et al. [32], 2016 | ☒ | Acoustic power depends on the flow deflection angle obtained by the serration Ψ ≈ Ψ0sin2(θ0 + γ) | Umax ~ 45 m/s | |
| 8 |  [48] [48] | Liu et al. [48], 2016 | ☒ | At high incidents, turbulent areas with high PSD move from above the chord line to below it | Experimental Umax ~ 60 m/s Re ~ 3 × 10⁵ | |
| 9 |  [26] [26] | Al Tlua [26], 2021 | ☒ | Triangular serrations reduce overall noise but add tonal components (which depend on U, 2h, λ, profile thickness, and background noise) | Experimental and numerical; Umax ~ 24 m/s Re ~ 5 × 10⁵ | |
| 10 |  [26] [26] | Woodhead et al. [26], 2021 | ☒ | When oriented downward, the serrations lose efficiency over the whole frequency range. Facing upwards, 3 areas of interest are distinguished: low-perf low frequencies; medium frequencies-redistribution of turbulent; and rising performance areas | Experimental and numerical; Umax ~ 24 m/s Re ~ 2.96 × 10⁵ | |
| 11 |  [49]  [49] [49] | Salama [49], 2021 | ☒ | Synthetic turbulence ("Vortex Method”); RANS and LES simulations; At low AoA, below 1 dB noise reduction in the range 200–10,000 Hz (experimentally confirmed) | Experimental and numerical; Umax ~ 24 m/s Re ~ 5 × 10⁵ | |
| Crt. No. | Serration Shape | Author, Year | Solution Type | Results/Observations | |
|---|---|---|---|---|---|
| 2D | 3D | ||||
| 1 |  [40] [40] | Gruber [40], 2012 | ☒ | Experimental; Umax ~ 80 m/s; LE + TE (tandem) serrations; OAPWL decreases with decreasing Λ/λ (especially for Λ/λ < 0.3); optimal LE shape λ ≥ 3Λ | |
| 2 |  [50] [50] | Alimeri et al. [50], 2015 | ☒ | Experimental and numerical; Re ~ 105 The stator pressure loss coefficient is better over the entire range of −37°–10° using wavy surface vanes | |
| 3 |  [51] [51] | Rajeshwaran & Kushari [51], 2015 | ☒ | Experimental, Umax ~ 35 m/s; LE serrations; cascade, flow visualization with oleic acid and titanium dioxide; lowest velocity is behind the serration root; pressure losses are proportional to the frontal area of the vane; flow separation point moves backwards so that overall the vane delays the occurrence of stall compared to the reference | |
| 4 |  [52] [52] | Smith & Sowers [52], 1974 | ☒ | Experimental, Umax ~ 0.87; LE serrations; configuration with 2 or 6 vanes in cascade; vanes with c = 5 cm; serration amplitude must be above 6%·c; 2h/λ < 1.5; improvements on both flow and noise | |
| 5 |  [53] [53] | Qiao et al. [53], 2014 | ☒ | Experimental, Re ~ 5 × 10⁵; Umax ~ 50 m/s TE serrations; λ/h = 0.5 much better than λ/h = 1; the range of frequencies in which noise reduction is achieved widens as fluid velocity increases | |
| 6 |  [54] [54] | Craig [54], 2005 | ☒ | Experimental, Re ~ 3.8 × 10⁵, Umax ~ 25 m/s; cascade; slots at LE and TE through which air is blown; tonal component of interest reduced by more than 20 dB in some combinations; unstable separations at too low or too high flow rates; an optimum was identified at a 2.5% blown flow rate | |
| 7 |  [55] [55] | Geiger [55], 2004 | ☒ | Experimental, Re ~ 3.9 × 10⁵, Umax ~ 25 m/s; TE serrations; cascade; periodic aerodynamic spanwise behavior; smaller amplitudes were found to perform better (better blade loading, less turbulent structures) | |
| 8 |  [56] [56] | Ye et al. [56], 2022 | ☒ | Numerical, Δp* = 2244 Pa, Q = 37.1 m3/s; serrated rotor; noise reduction in the low frequency area; in the area of interest, the reduction is 6.7 dB with over 20 dB reduction in the tonal component; the serrations break up the large swirls into smaller formations that dissipate better | |
| 9 |  [57] [57] | Teruna et al. [57], 2019 | ☒ | Numerical, Umax ~ 75 m/s; rod–cascade configuration; the rod can impact the flow similar to what a real stator stage experiences; greater reductions can be achieved by “treating” the aerodynamic surface | |
| 10 |  [47] [47] | Liu et al. [47], 2019 | ☒ | Experimental setup: maximum flow velocity approximately Umax ~ 30 m/s; trailing edge (TE) serrations implemented; configured in tandem; observed noise reductions exceeding 9 dB at frequencies below 1.5 kHz; rapid decay of turbulent structures | |
| 11 |  [58] [58] | Liu et al. [58], 2021 | Experimental, Umax ~ 30 m/s; TE serrations; tandem configuration; sharper blades behaved better; pressure fluctuations recorded on the blade show that the first 30% of the chord length determines the blade loading (very easily influenced by the forward blade wake) | ||
| 12 |  [59] [59] | Alkhalifa et al. [59], 2022 | ☒ | Numerical, Wells turbine; full or partial serration; better behavior of a partially serrated blade (efficiency) | |
| 13 |  [60] [60] | Polacsek et al. [60], 2022 | Numerical, Umax ~ 120(..193)m/s; 2 h/c limit is 0.15; 4–6 dB reduction based on empirical observations on the variation in serration parameters | ||
Disclaimer/Publisher’s Note: The statements, opinions and data contained in all publications are solely those of the individual author(s) and contributor(s) and not of MDPI and/or the editor(s). MDPI and/or the editor(s) disclaim responsibility for any injury to people or property resulting from any ideas, methods, instructions or products referred to in the content. |
© 2024 by the authors. Licensee MDPI, Basel, Switzerland. This article is an open access article distributed under the terms and conditions of the Creative Commons Attribution (CC BY) license (https://creativecommons.org/licenses/by/4.0/).
Share and Cite
Totu, A.-G.; Cican, G.; Crunțeanu, D.-E. Serrations as a Passive Solution for Turbomachinery Noise Reduction. Aerospace 2024, 11, 292. https://doi.org/10.3390/aerospace11040292
Totu A-G, Cican G, Crunțeanu D-E. Serrations as a Passive Solution for Turbomachinery Noise Reduction. Aerospace. 2024; 11(4):292. https://doi.org/10.3390/aerospace11040292
Chicago/Turabian StyleTotu, Andrei-George, Grigore Cican, and Daniel-Eugeniu Crunțeanu. 2024. "Serrations as a Passive Solution for Turbomachinery Noise Reduction" Aerospace 11, no. 4: 292. https://doi.org/10.3390/aerospace11040292