2.1. Drag Coefficient Model
Particle motion is affected by a variety of forces such as drag, gravity, buoyancy, virtual mass, basset history force, and lift. For traditional supercooled droplets generally only needs to consider its drag. But, since the size of ice crystals is much larger than traditional supercooled droplets, this paper considers both drag and gravity, in contrast, the size of other forces can be ignored.
The non-spherical characteristics of ice crystals determine that their drag coefficient model is different from that of supercooled droplets. There are many scholars who have studied the drag coefficient of non-spherical particles through experiments and obtained the drag coefficient relation equation by data fitting method. Typical relational equations commonly used include: “Haider and Levenspiel Model [
16]”, “Ganser Model [
17]”, “Holzer and Sommerfeld Model [
18]”, and “Xianzhi-Song Model [
19]” (
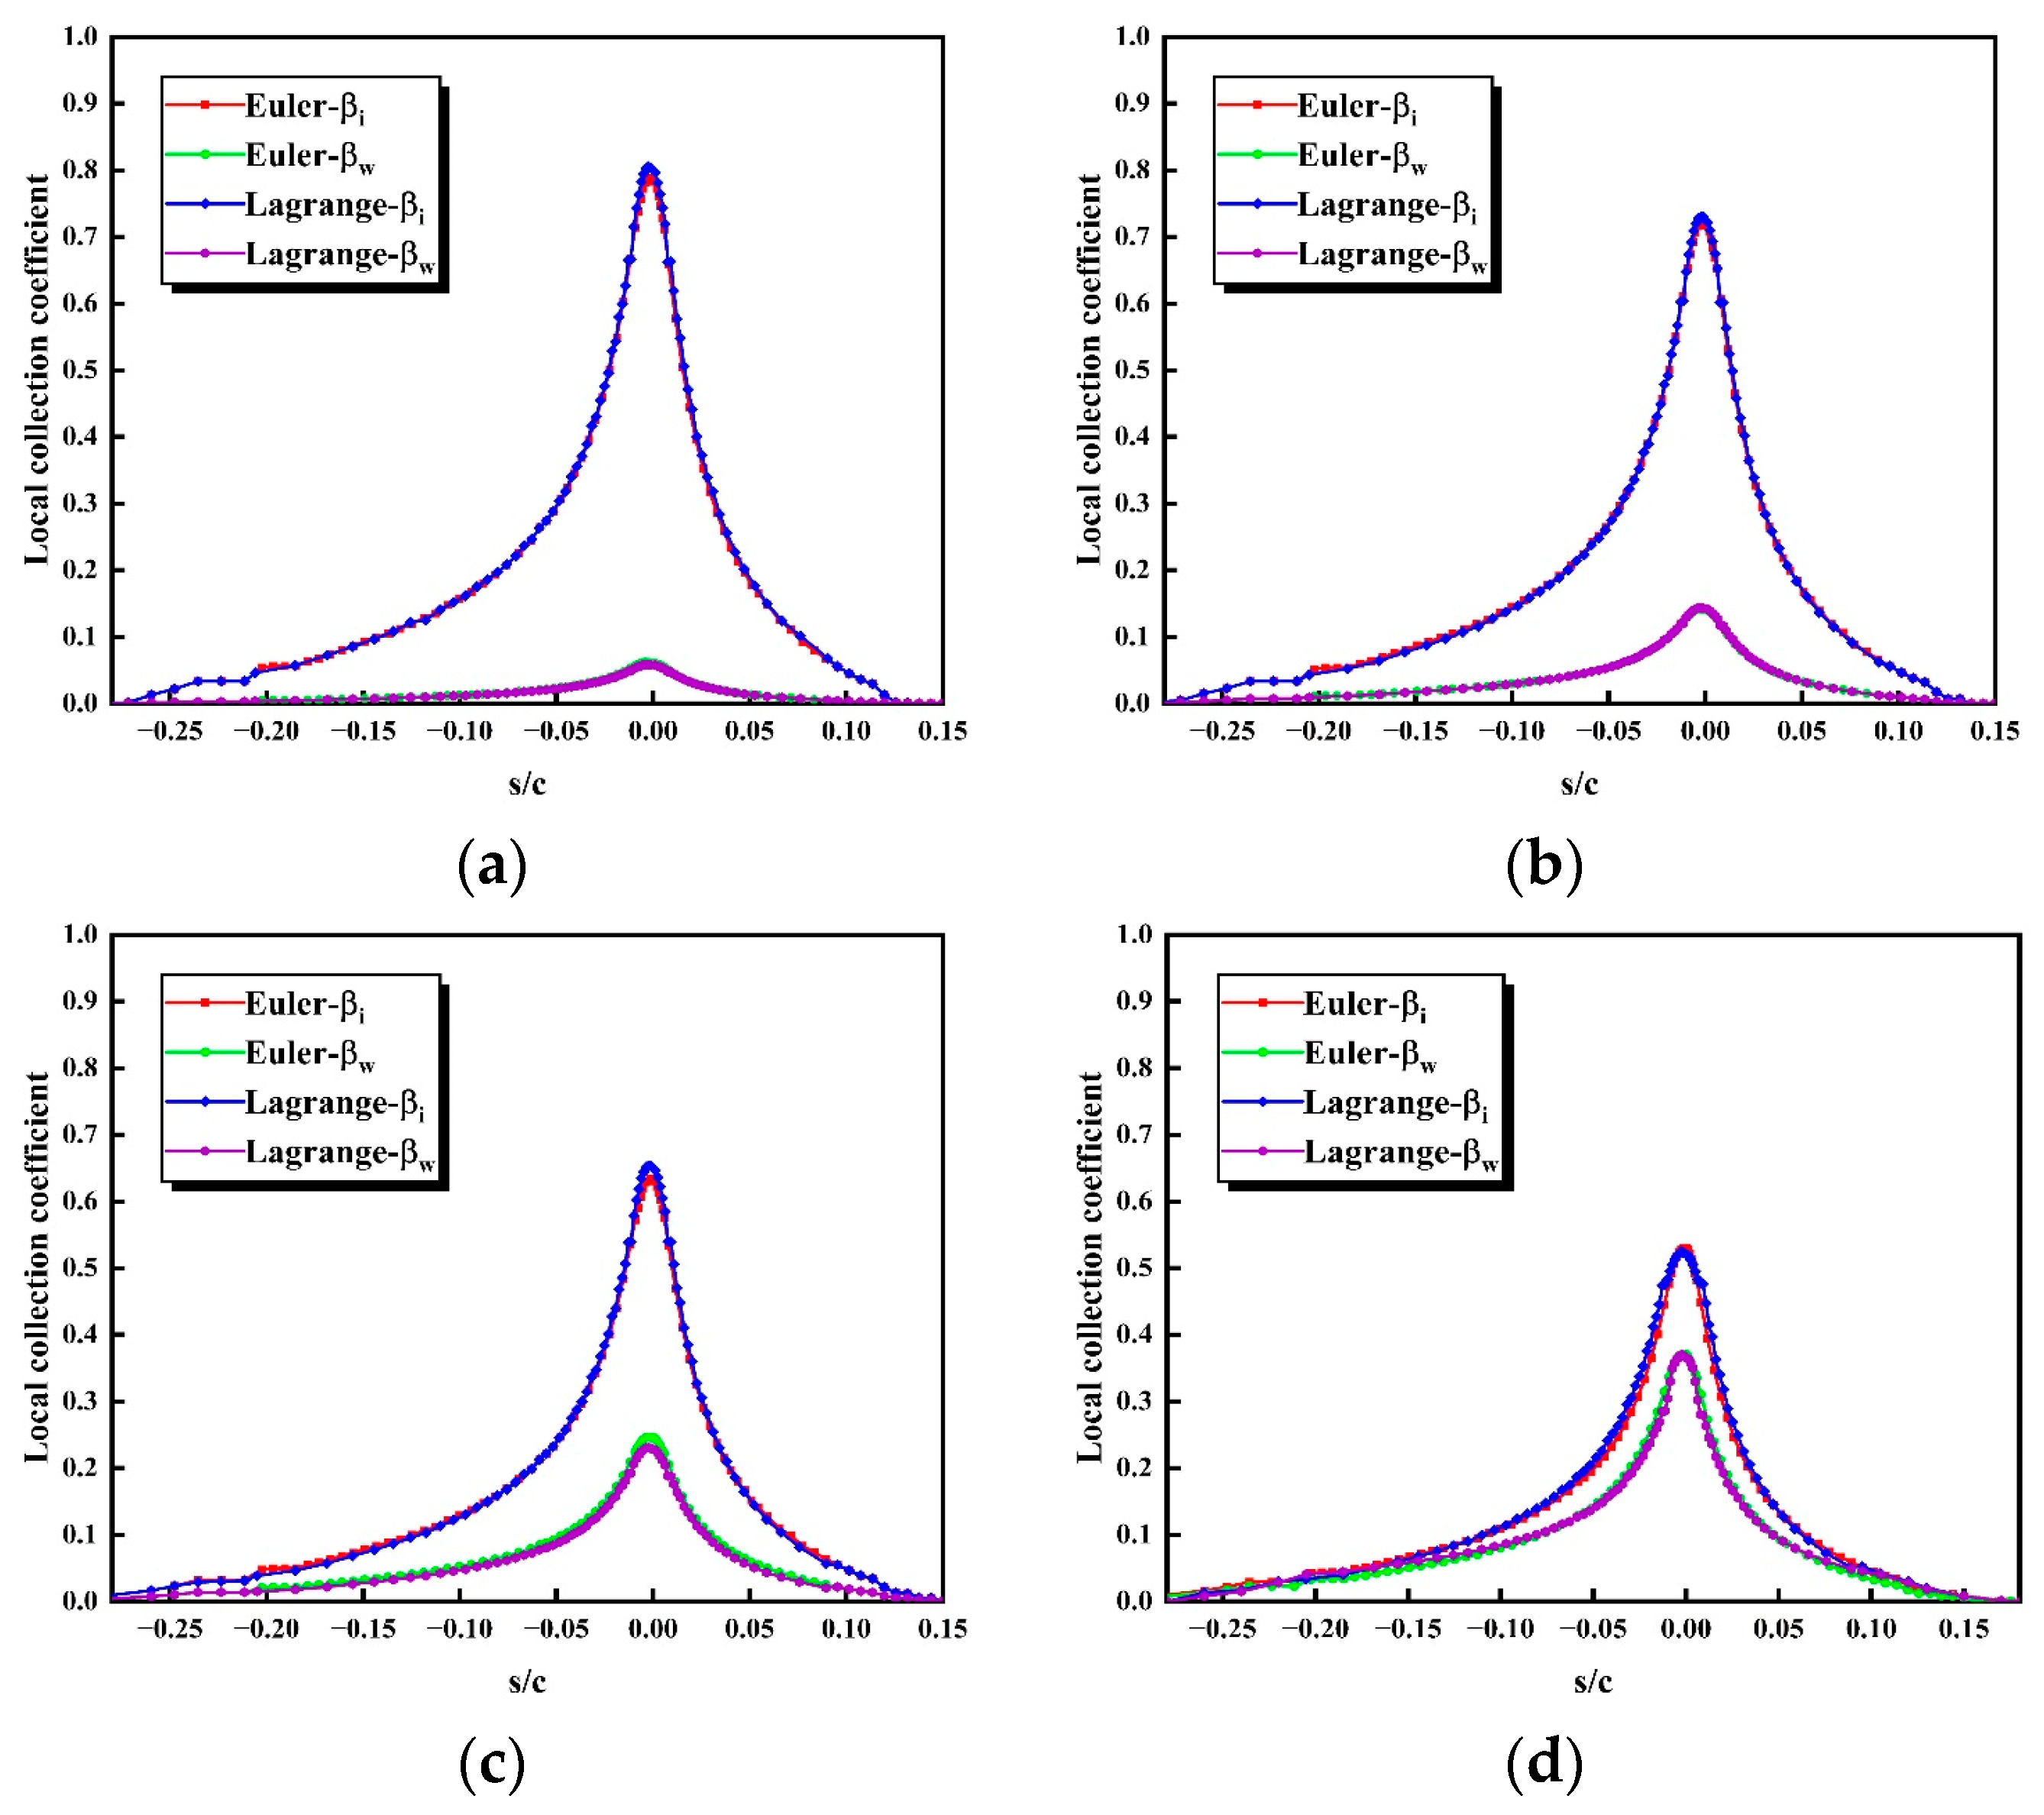
Table 1). In this paper, the local collection coefficients of NACA0012 airfoils under different drag models are calculated by Eulerian and Lagrangian methods, respectively, according to the calculation conditions of the benchmark test case (
Table 2). It is compared with the widely used relation for the drag coefficient of spherical particles proposed by Clift and Gauvin [
20], and the results are shown in
Figure 1.
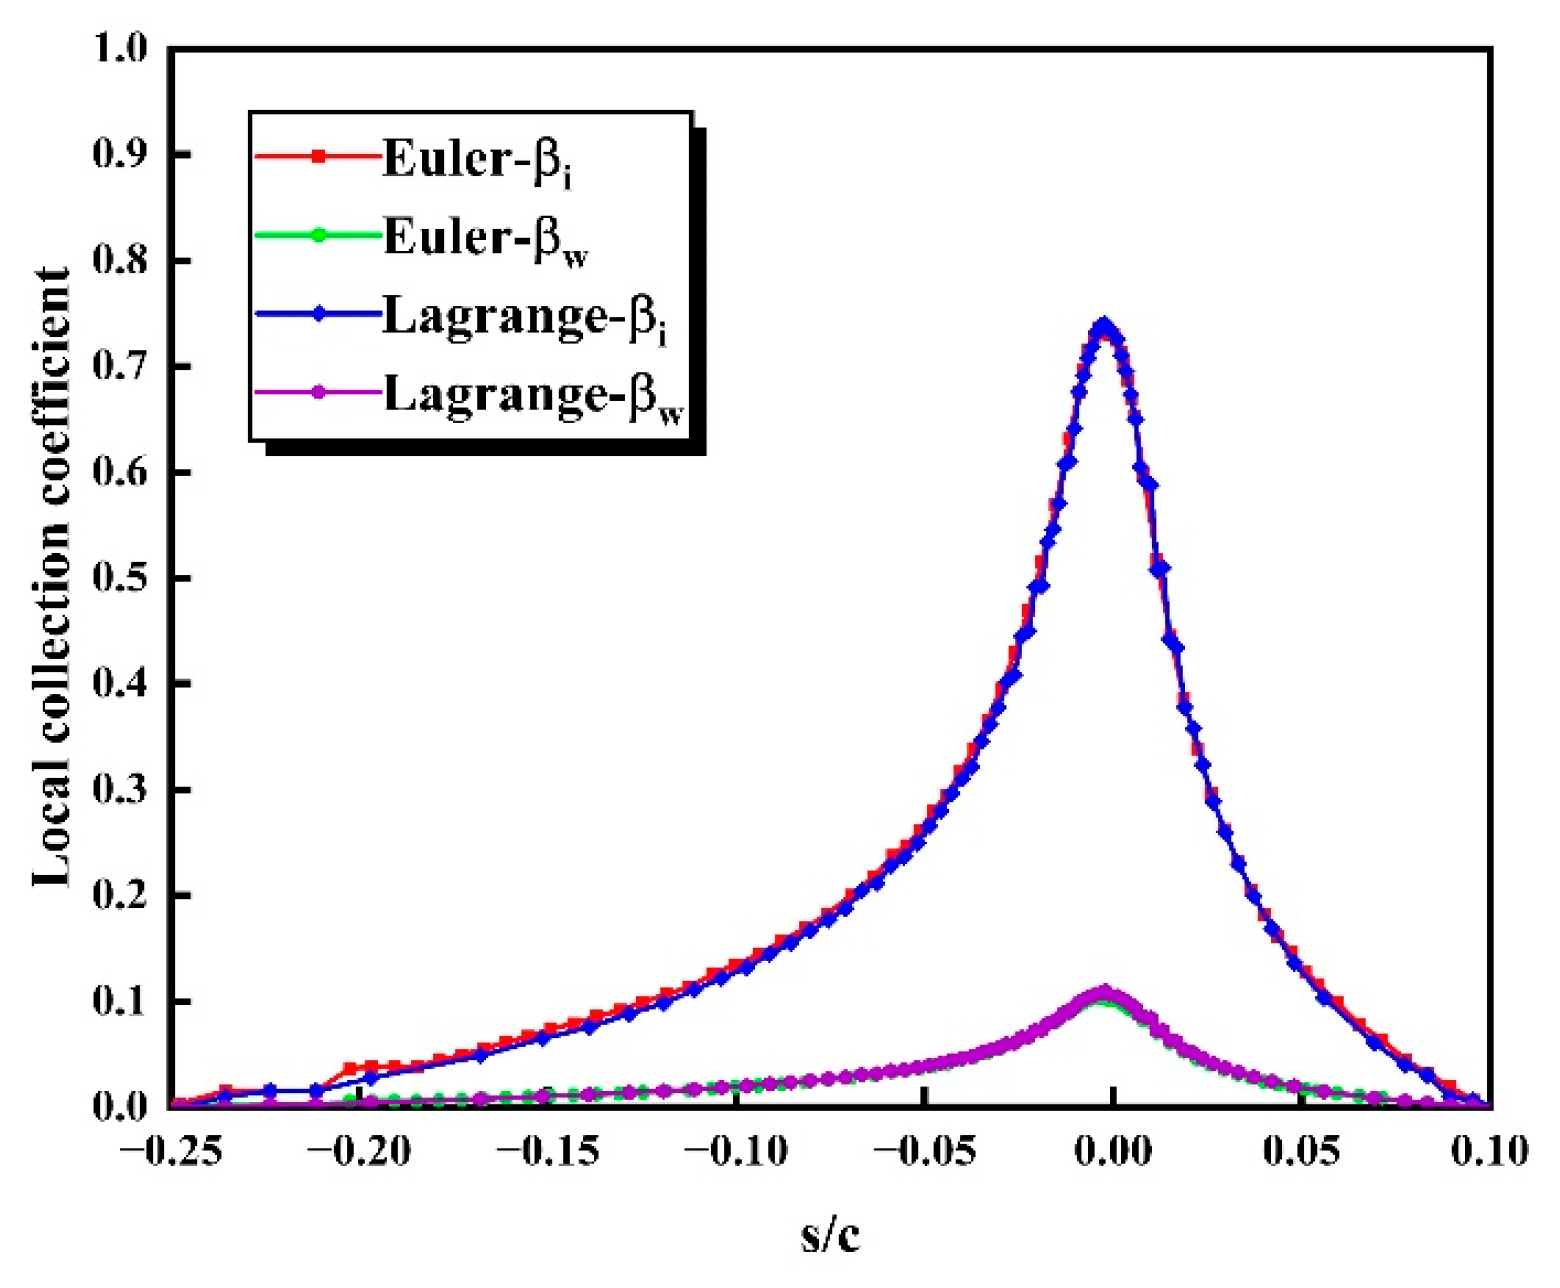
As can be seen from the
Figure 1, the horizontal axis represents the ratio of the arc length from the local position to the leading edge of the airfoil to the chord length of the airfoil,
/
. And the positive values of
/
represent the upper surface of airfoil, the negative values represent the lower surface, and values equal to 0 represent the leading edge of the airfoil. The results obtained by the two numerical calculation methods are basically consistent. Moreover, the impingement limits and local collection coefficients of “Holzer and Sommerfeld Model”, “Ganser Model”, “Haider and Levenspiel Model” are basically the same. However, the results of “Xianzhi-Song Model” are close to those of “Clift and Gauvin Model”, but different from those of other three models. The difference of the local ice crystal collection coefficient at the leading edge is about 5.99%, and the difference of the upper impingement limit is about 59.24%, the lower impingement limit is about 27.66%. Due to the lack of experimental data, it is impossible to judge the accuracy of these drag coefficient models, and in the subsequent work of this paper, the “Ganser Model” is chosen because it is relatively simple and the most widely used.
2.2. Convective Heat Transfer Model
The non-spherical characteristics of ice crystals also determine the convective heat transfer characteristics different from supercooled droplets. However, the effect of particle shape on convective heat transfer is much less studied than the effect of particle shape on the drag coefficient. Due to the difficulty of experimental measurement, numerical and analog methods have been used to study the convective heat transfer characteristics of non-spherical particles. Typical Nusselt number relations include: “Richter and Nikrityuk Model [
21]”, ”Comer and Kleinstreuer Model [
22]”and “Villedieu Model [
13]” (
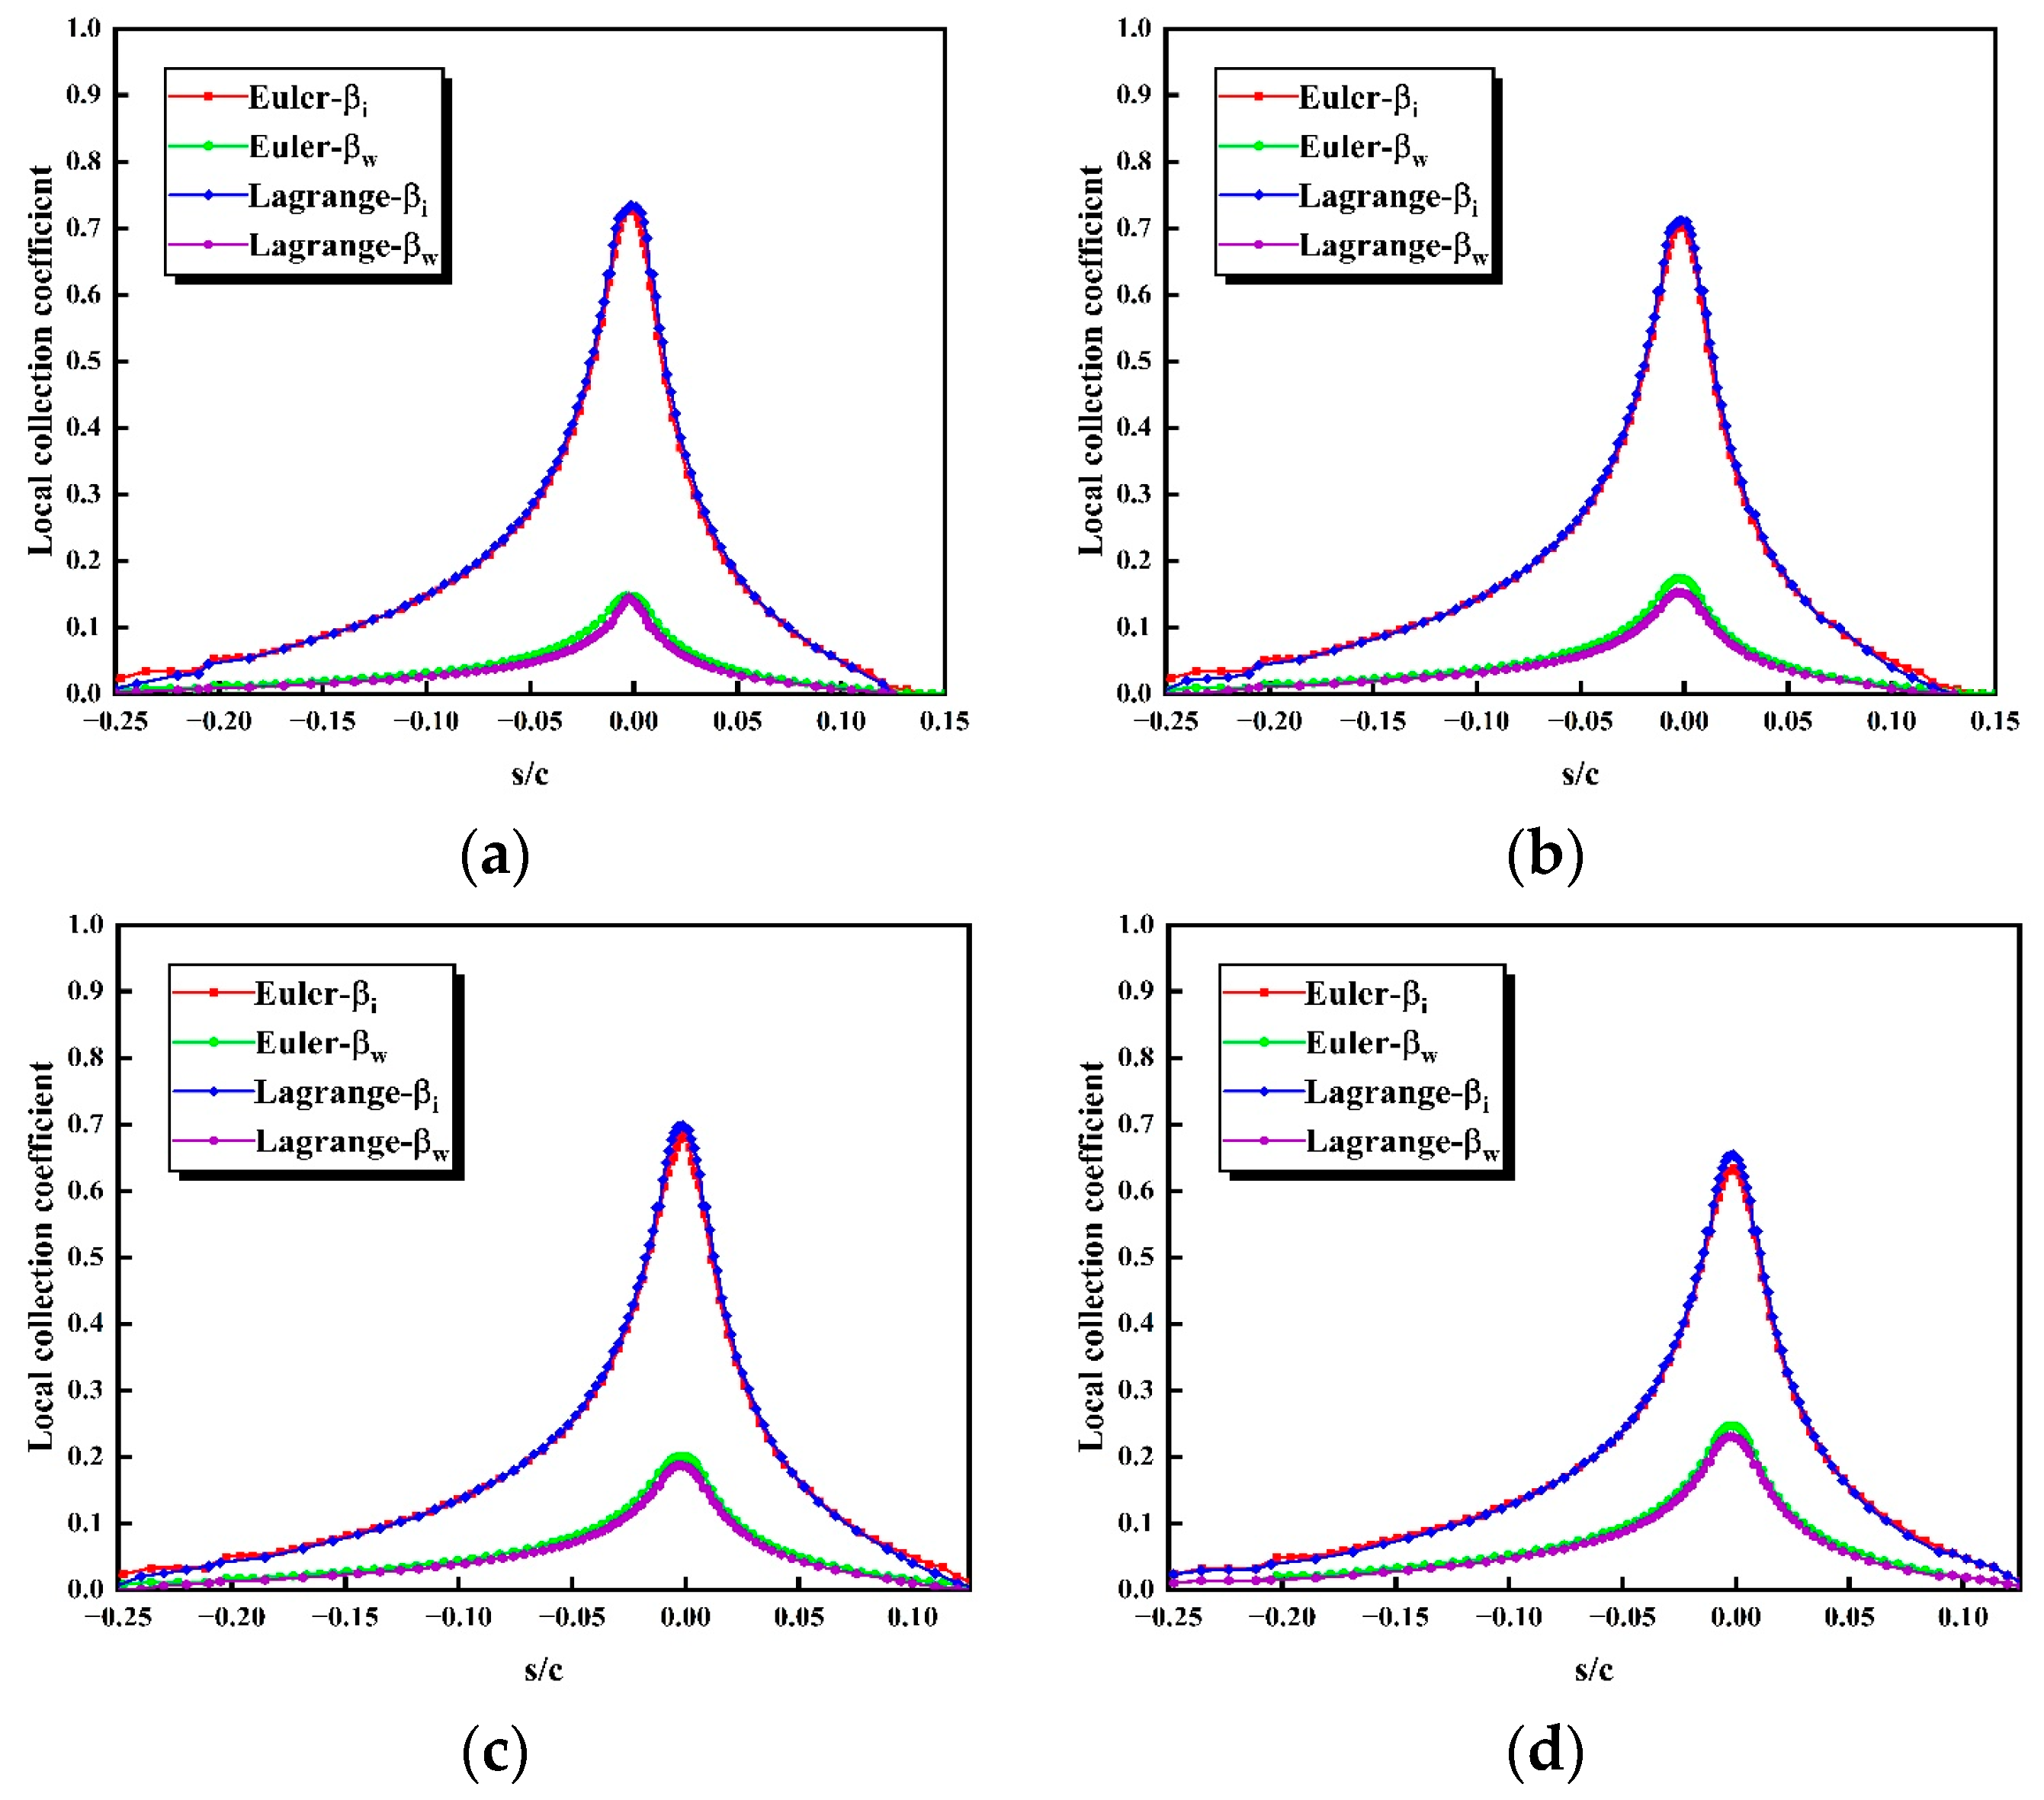
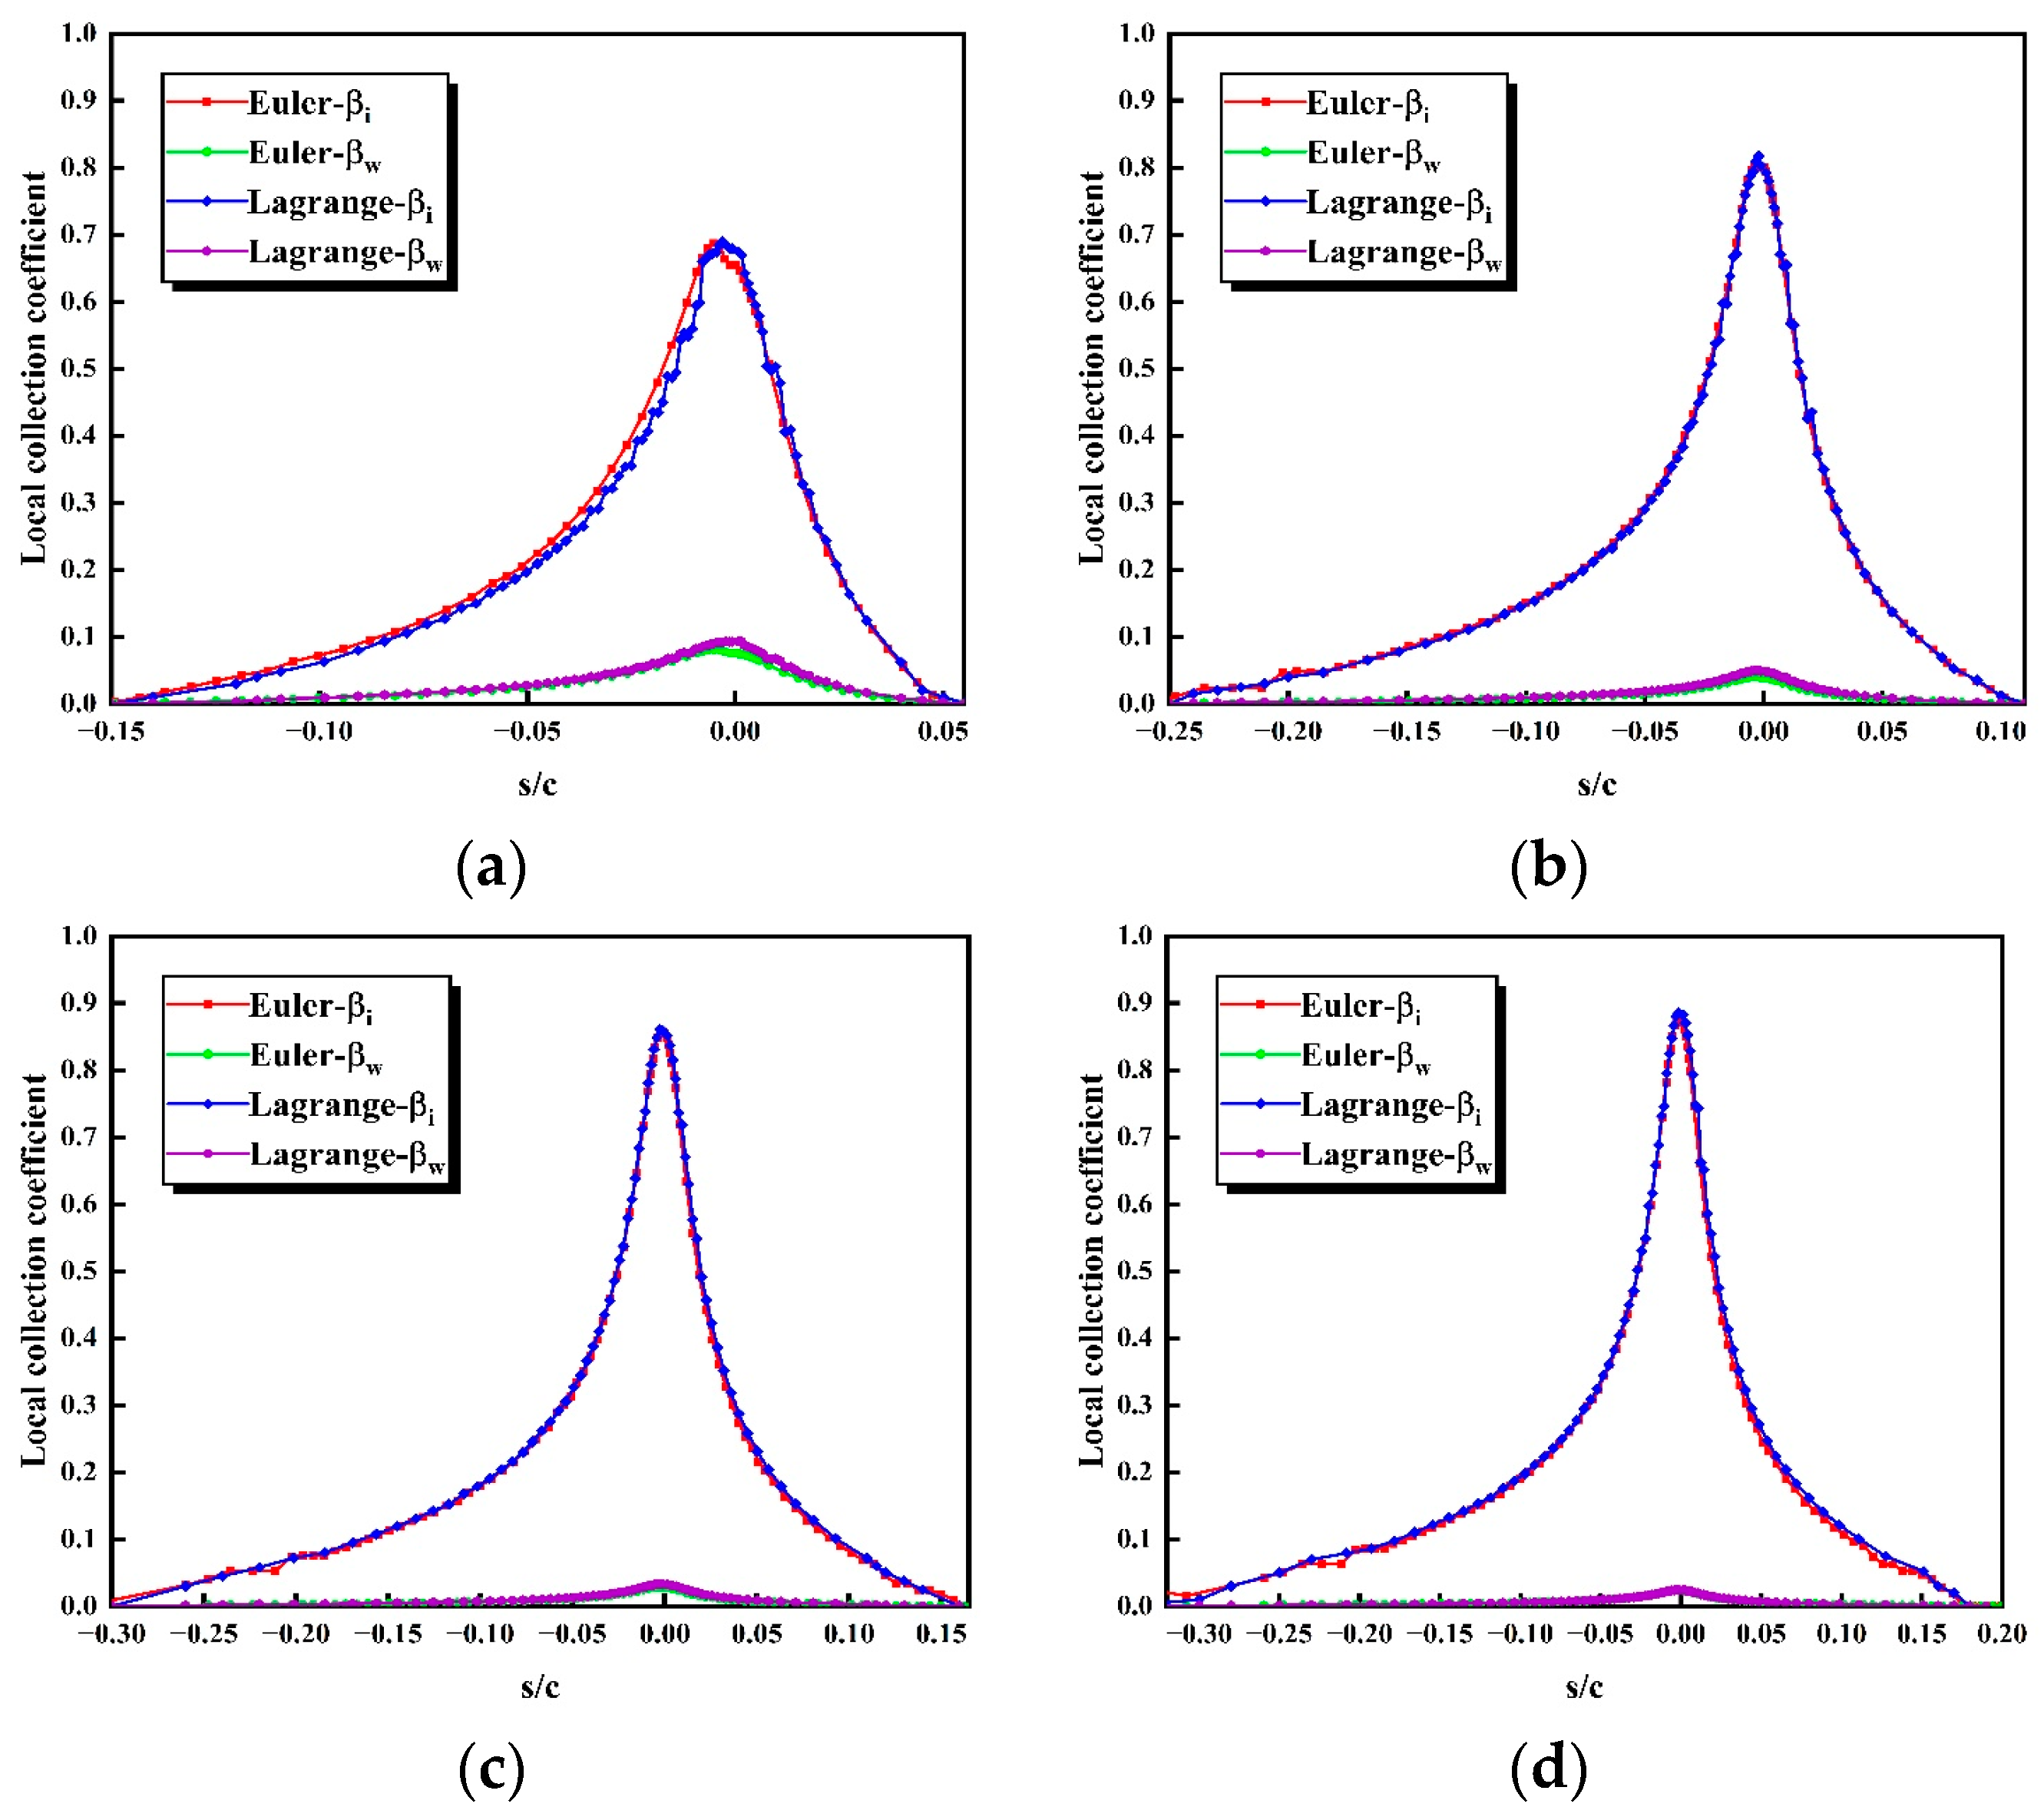
Table 3). In this paper, the local collection coefficients of NACA0012 airfoils under different convective heat transfer models are calculated by Eulerian and Lagrangian methods, respectively, according to the calculation conditions of the benchmark test case (
Table 2). It is compared with the widely used relation for the convective heat transfer model of spherical particles proposed by Ranz and Marshall [
23], and the results are shown in
Figure 2.
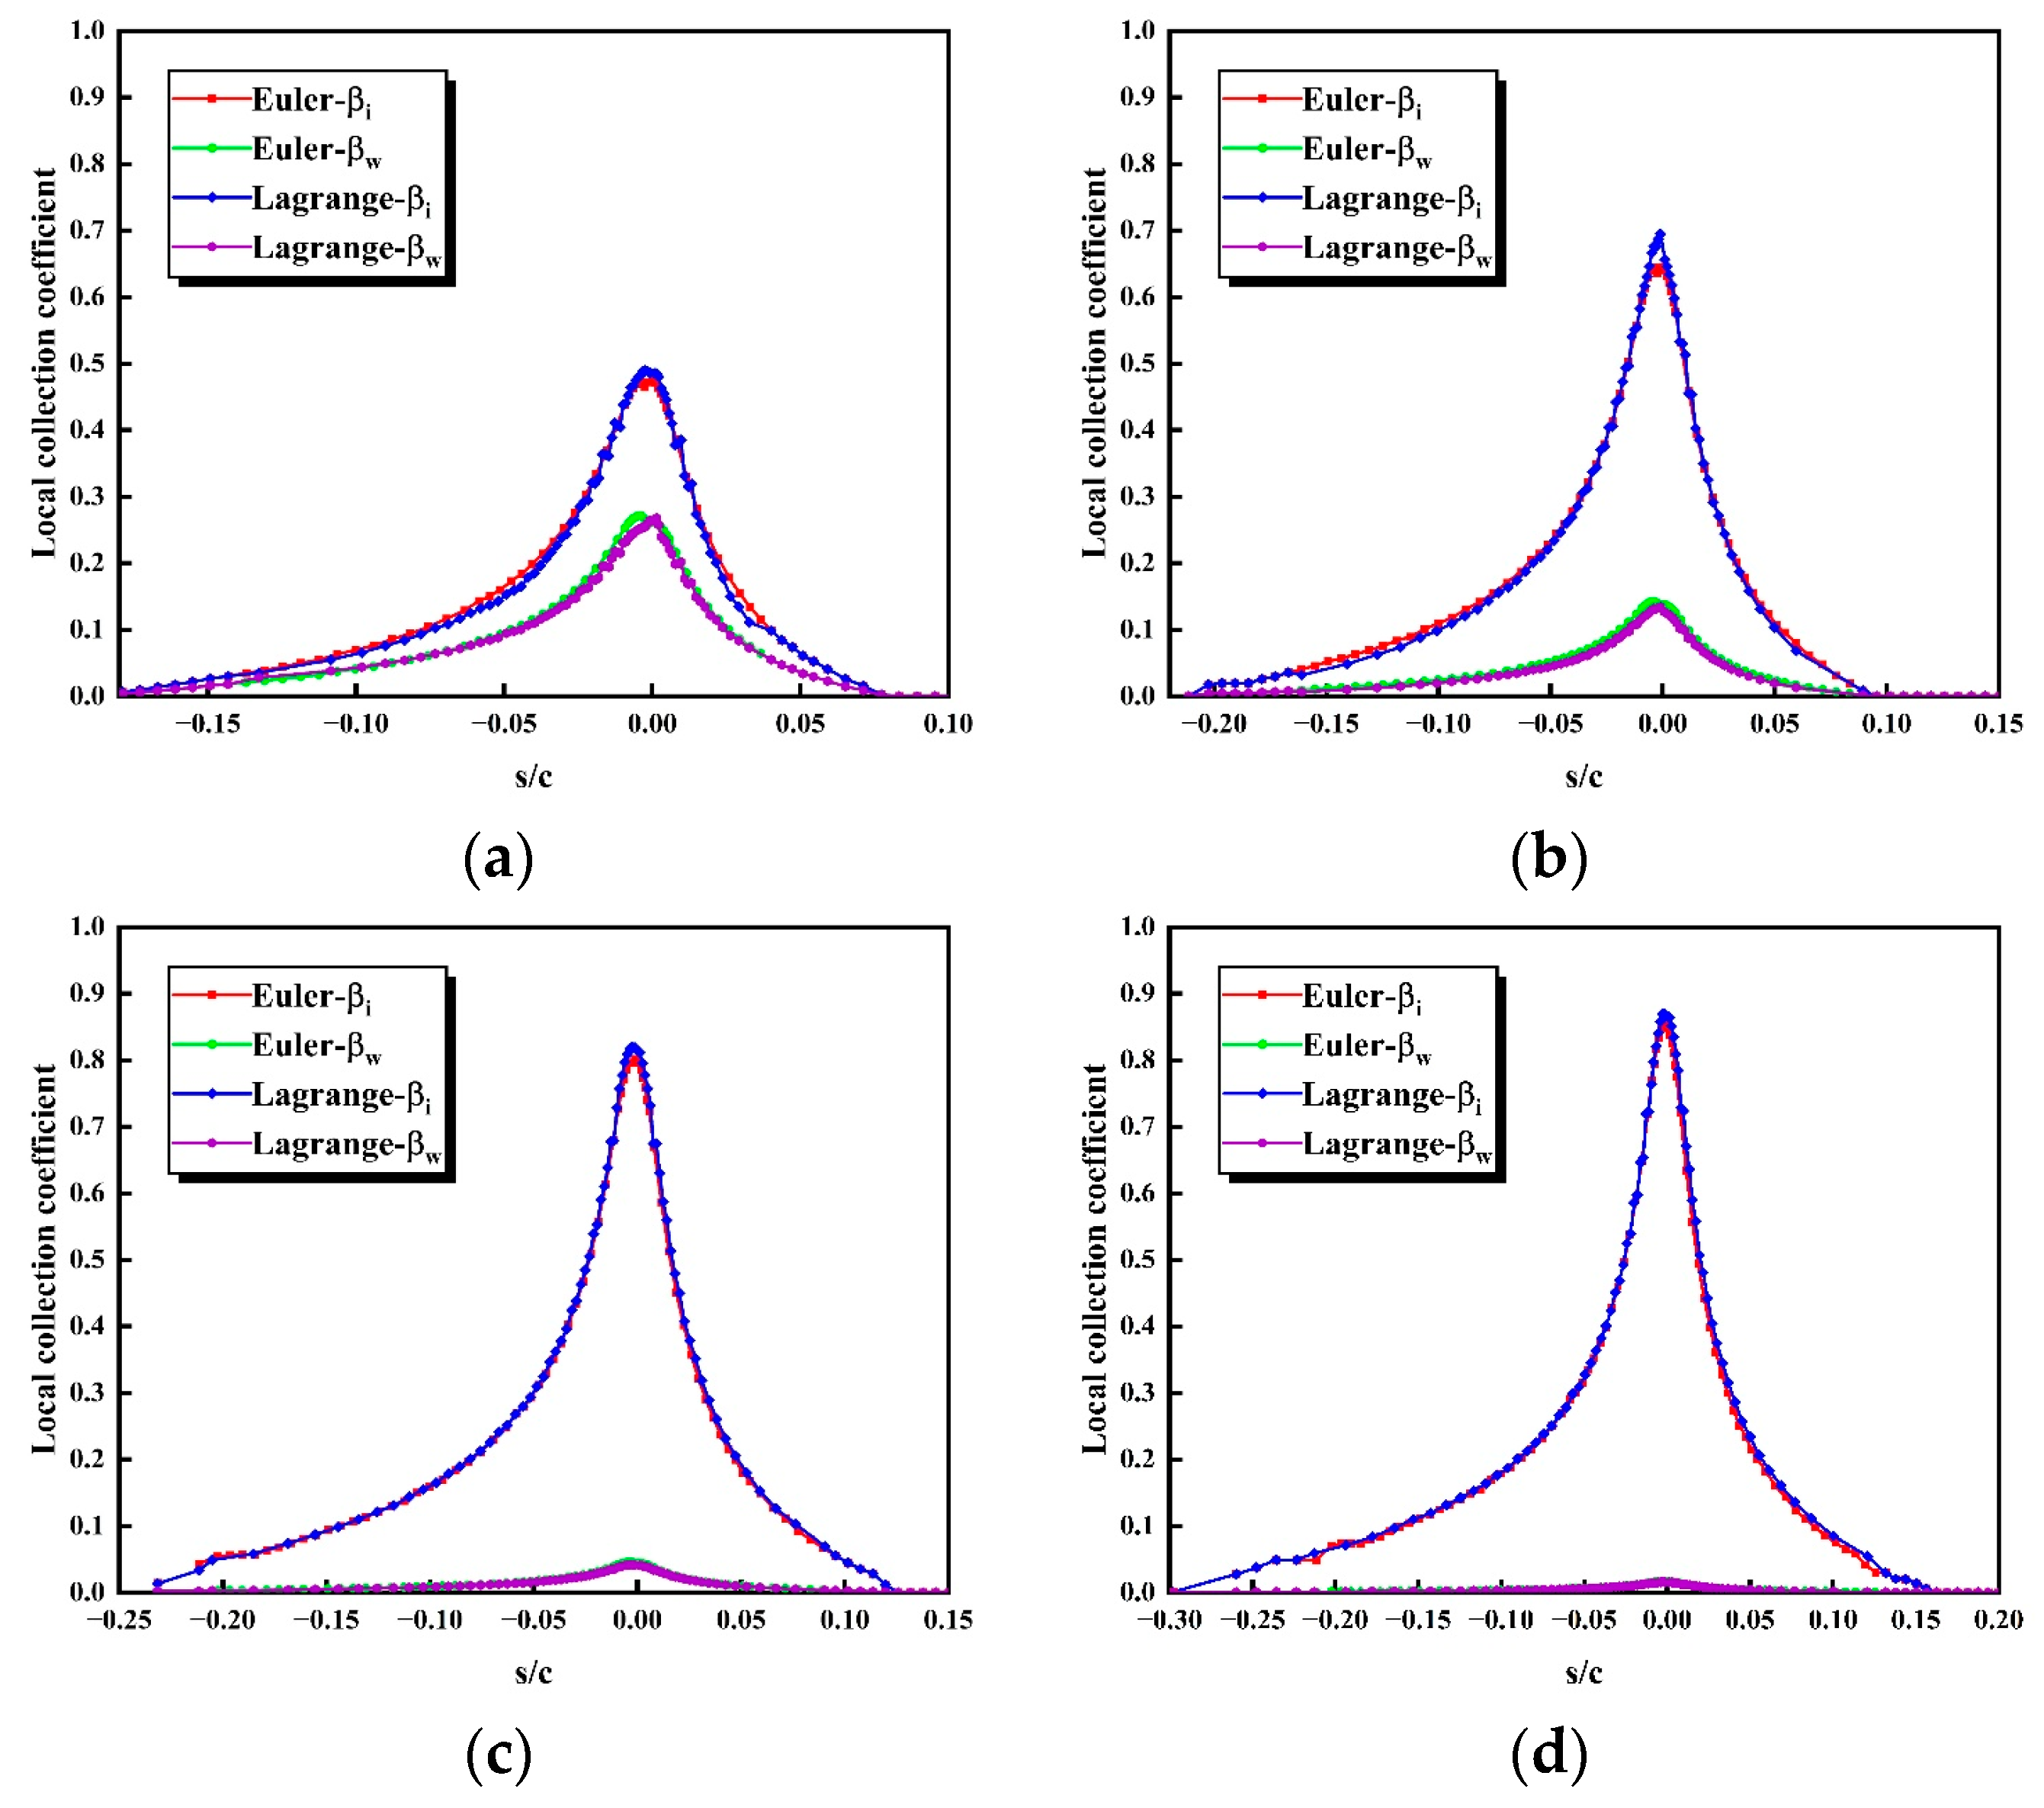
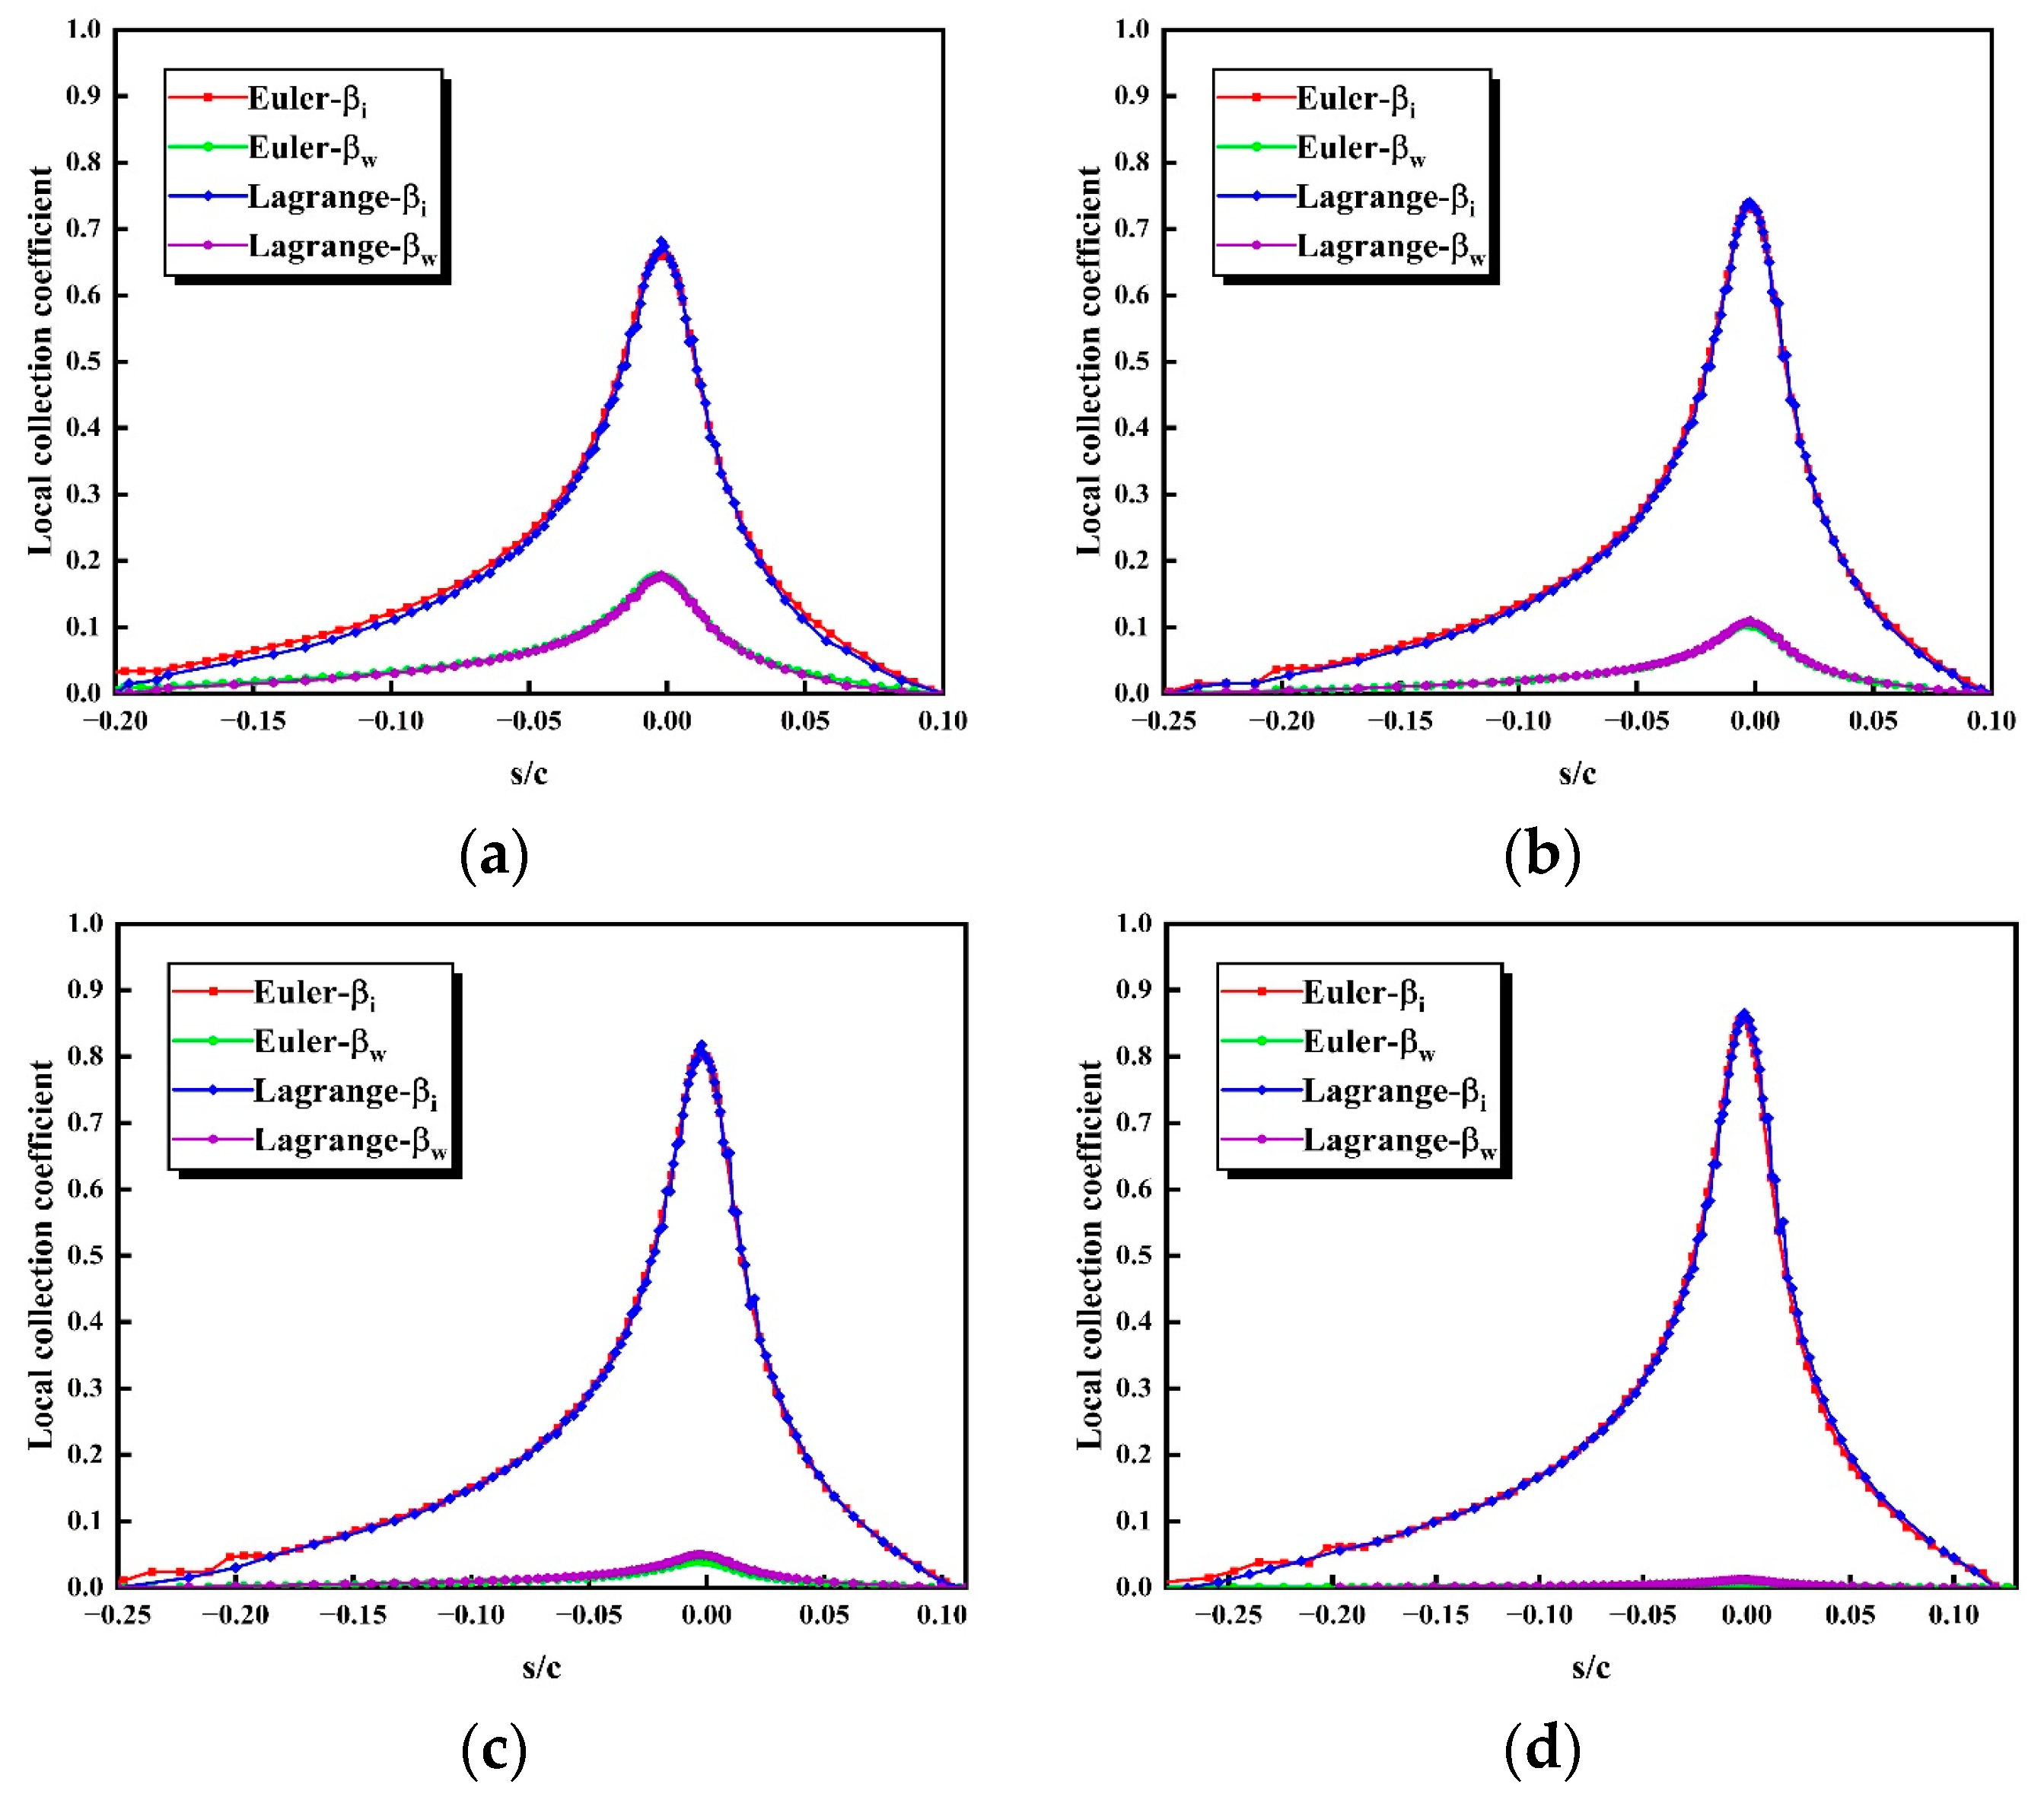
As can be seen from the
Figure 2, the results obtained by the two numerical calculation methods are basically consistent. Moreover, the impingement limits and local collection coefficients of “Richter and Nikrityuk Model”, “Comer and Kleinstreuer Model” and “Villedieu Model” are basically the same. However, the results of the spherical “Ranz and Marshall Model” differ significantly from those of the other three models. The main differences are as follows: the local collection coefficient of unmelted ice crystals in the area near the leading edge and the lower wing surface decreases to a certain extent, and the local collection coefficient of melted water increases to a certain extent, and the error at the leading edge is about 10.04%. This indicates that the Nusselt number obtained by the “Ranz and Marshall Model” is larger than the other three non-spherical models, resulting in a high melting rate, which is consistent with the conclusion of Noder [
24]. In the subsequent work of this paper, the “Villedieu Model” is chosen because it is the most widely used.
2.3. Phase Transition Model
The temperature of the ice crystal particles will change during the movement due to the warm airflow around, and the energy exchange with the airlow is calculated by the following formula:
where,
represents the heat conductivity coefficient of air,
refer to the particle equivalent diameter,
and
refer to the temperature of air and particle, respectively.
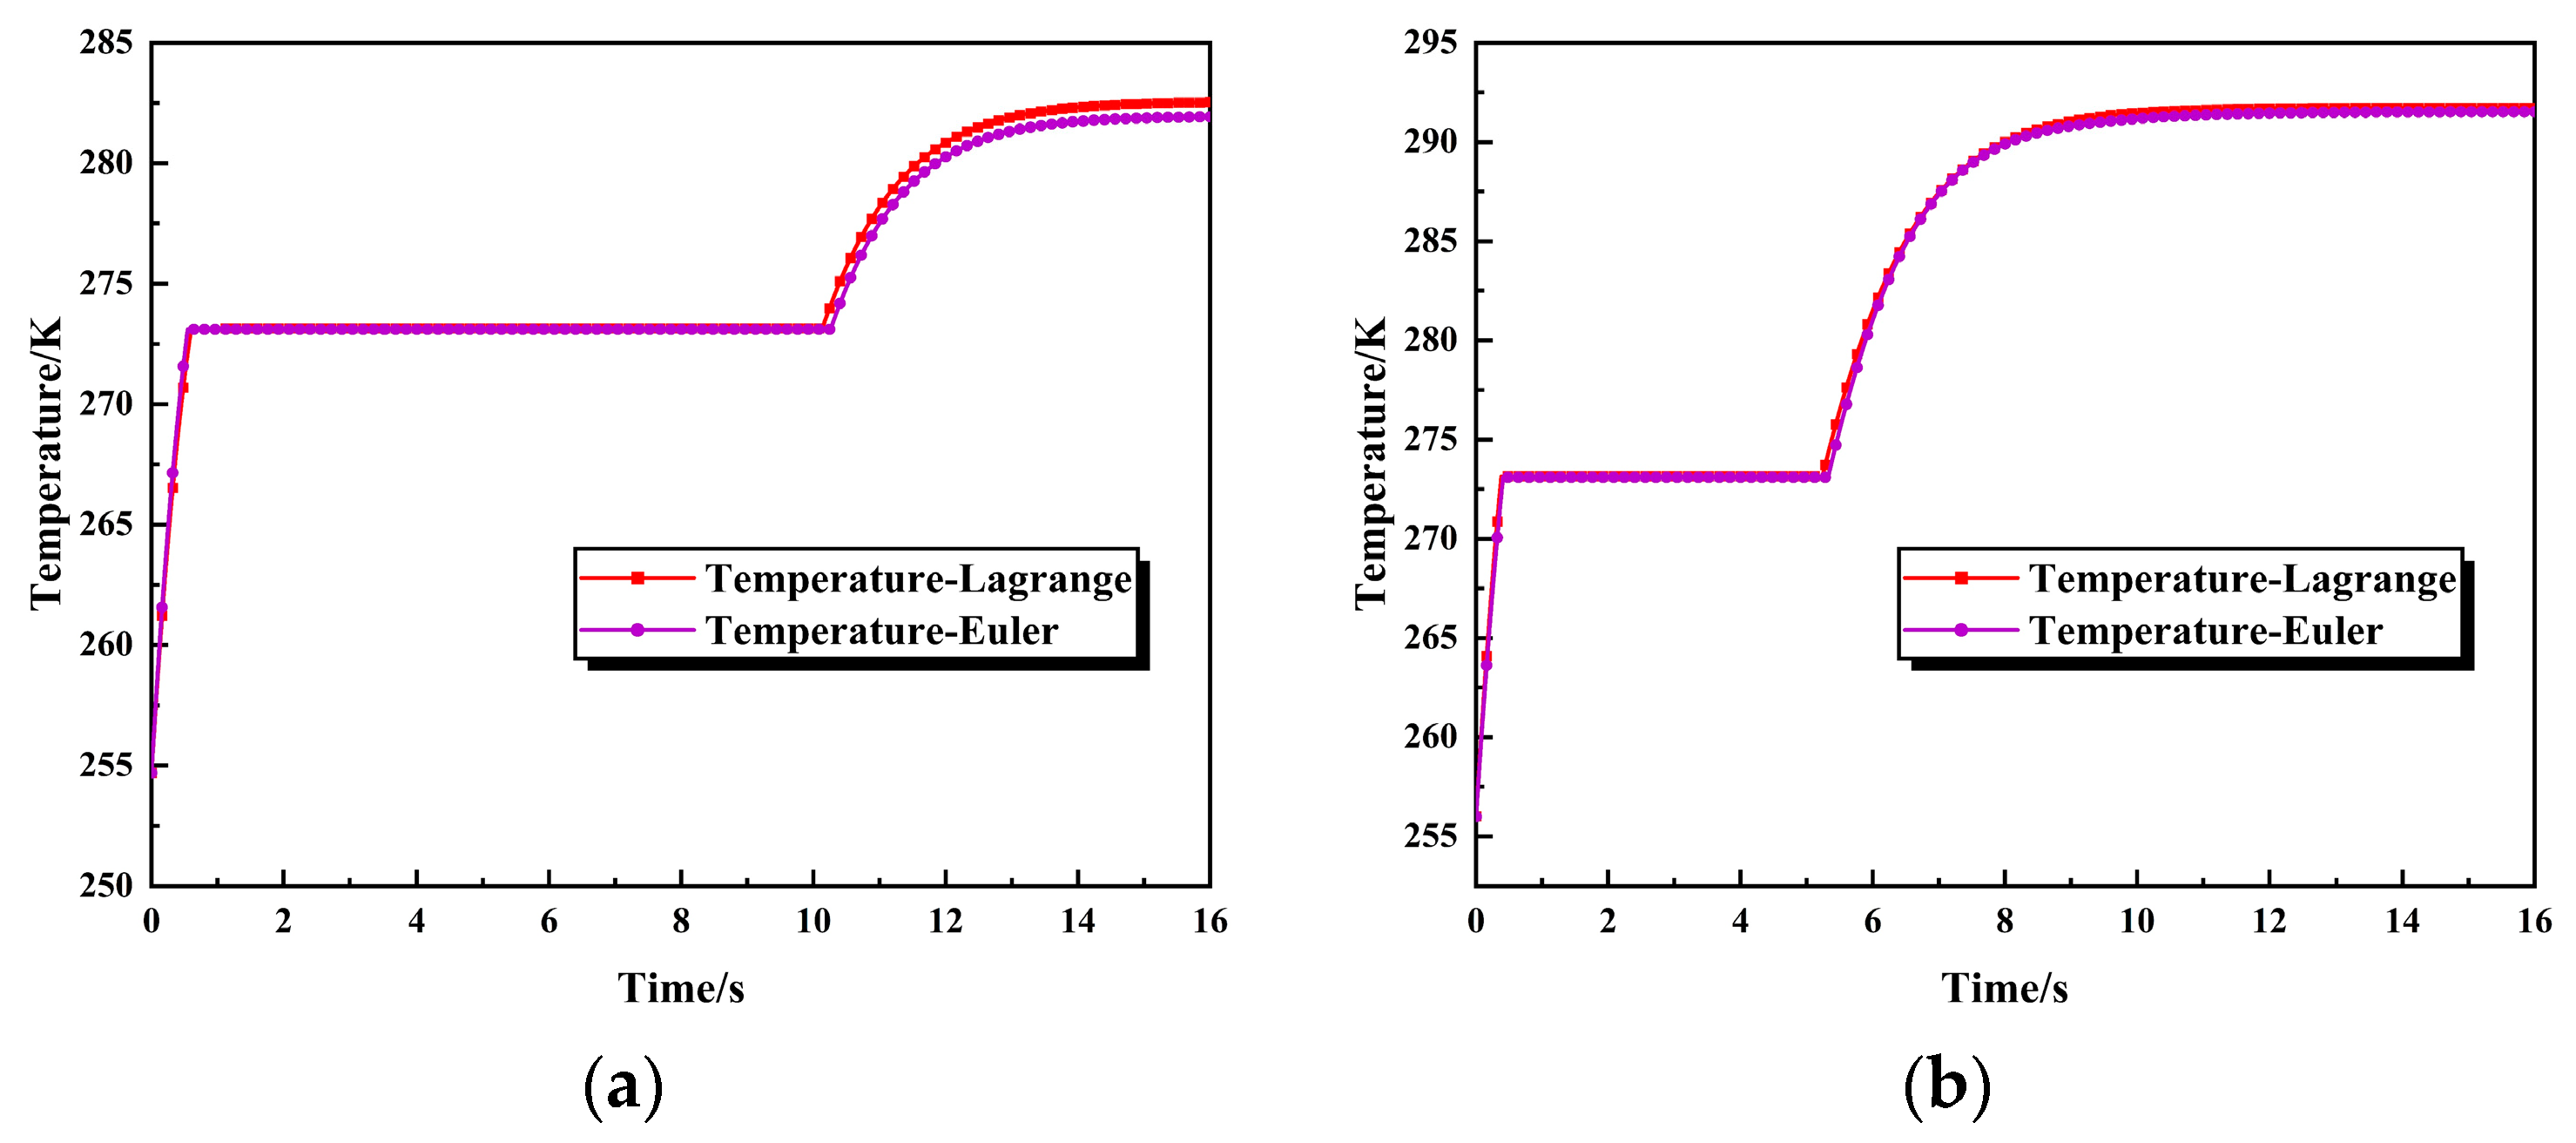
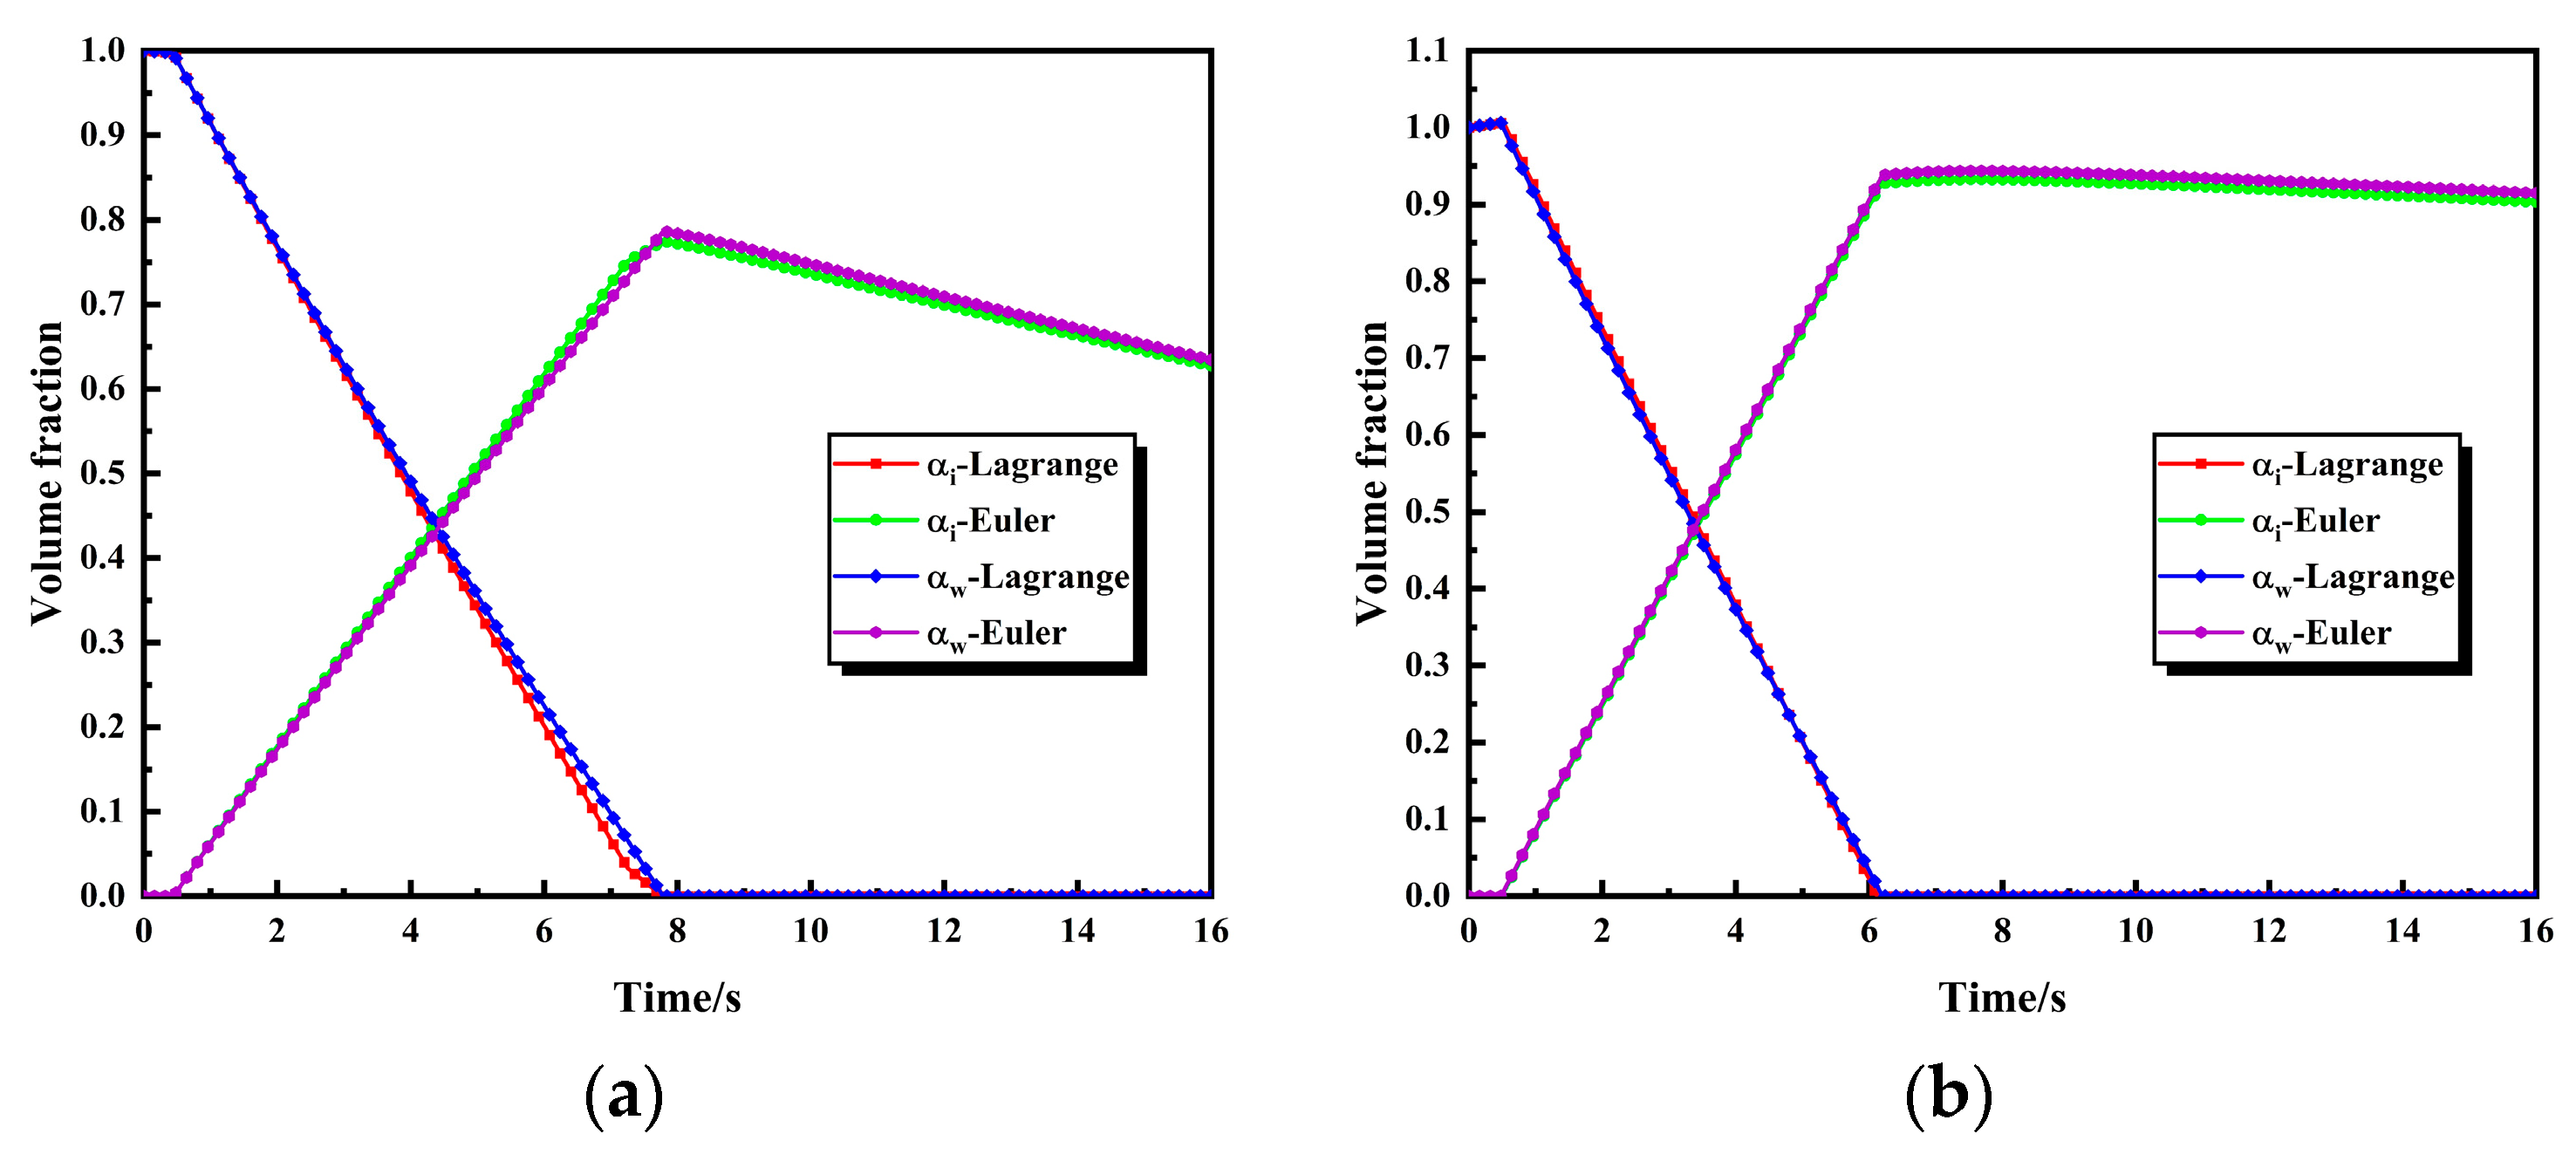
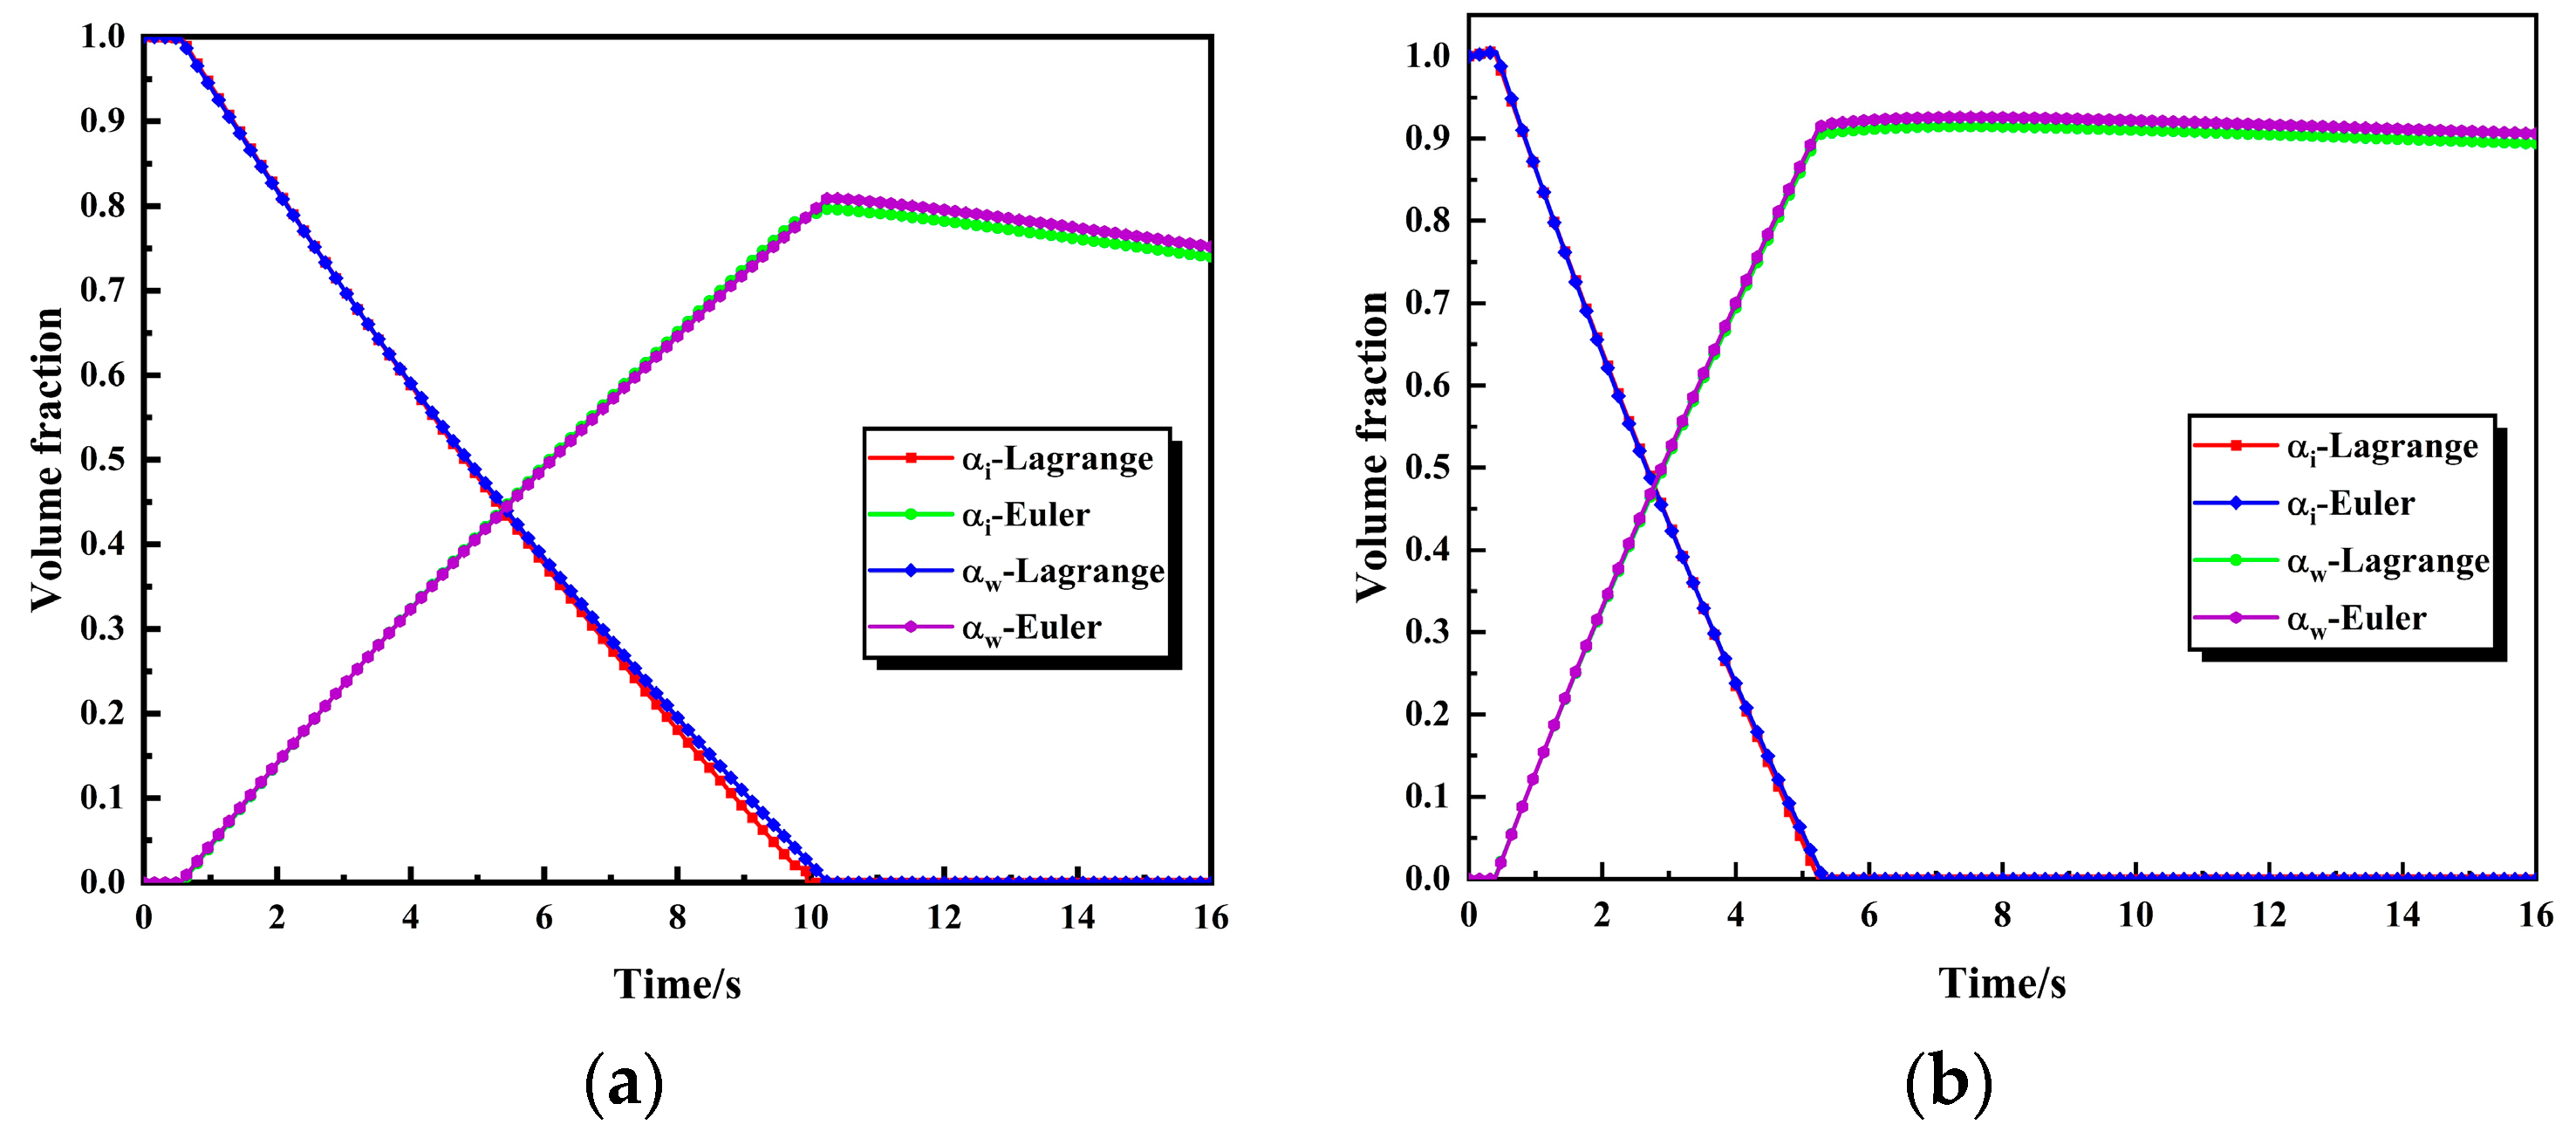
According to the temperature of ice crystals, the phase transition process of ice crystals is divided into three stages:
The first stage, when the particle temperature is below the melting temperature, the particles are pure solid ice crystals, which will undergo sublimation or deposition, and the temperature continues to rise until it reaches the melting temperature.
The second stage, when the particle temperature is equal to the melting temperature, the particles are a mixture of ice and water, which will undergo melt and evaporation or condensation. It is also believed that the phase transition phenomena all start from the outermost side, and that the melting water film surrounds the inner ice crystal nucleus and will not shed from it.
The third stage, when the particle temperature is higher the melting temperature, the particles are pure liquid droplets, which will undergo evaporation or condensation. Due to the continuous heat exchange with the surrounding air, the temperature of the particles continues to rise until they reach dynamic equilibrium or completely evaporate.
The shape evolution of non-spherical ice crystal during phase transition process is shown in
Figure 3. In the first stage, there is sublimation or deposition on the surface of the solid ice crystal, and in the second and third stages, there is evaporation or condensation on the surface of the water film. In this paper, the processes of sublimation, deposition, evaporation and condensation are described by mass diffusion equation. The mass diffusion phenomenon is caused by the difference of vapor content between the ice crystal surface and the air flow environment. According to the evaporation model proposed by Crowe et al. [
25], the mass flux applied to icing conditions with low evaporation rate is as follows:
where,
is Sherwood number, its expression is:
where,
is Schmidt number, its expression is:
where,
is the vapor diffusivity in the air, the empirical formula proposed by Schirmer is adopted:
where,
, and
refers to air pressure.
and
represent the mass fraction of the particle surface and the steam in the free flow, respectively. And the steam mass fraction is expressed as follows:
where,
and
represent the quality of water vapor and air in the air stream, respectively.
and
represent molar mass of water vapor and air, respectively.
and
represent the volume fraction of water vapor and air, respectively.
refers to vapor pressure.
When we calculate
,
refers to the vapor pressure
on the surface of the particle, it can be considered as the saturated vapor pressure corresponding to the particle temperature
,
. According to the saturation vapor pressure formula proposed by Sonntag [
26], it can be obtained:
where,
and
refer to the saturated vapor pressure on the ice surface and water film surface, respectively.
When we calculate , refers to the vapor pressure of free flow , it can be considered as: . Where, refers to relative humidity. is the saturated vapor pressure corresponding to the ambient temperature of the air flow around the ice crystal particles.
In the second stage, the ice crystals will melt, and the melt water film will evaporate or condense. In that, the heat absorbed by the ice crystals from the environment is entirely used for the latent heat of melting of the ice crystals and the latent heat of evaporation or condensation of the water film. According to the energy balance, the following relationship is obtained:
where,
and
represent evaporation flux and melt flux, respectively.
and
represent the latent heat of evaporation and melting, respectively.
With the mass diffusion equation, we can derive the melting mass flux of ice crystals:
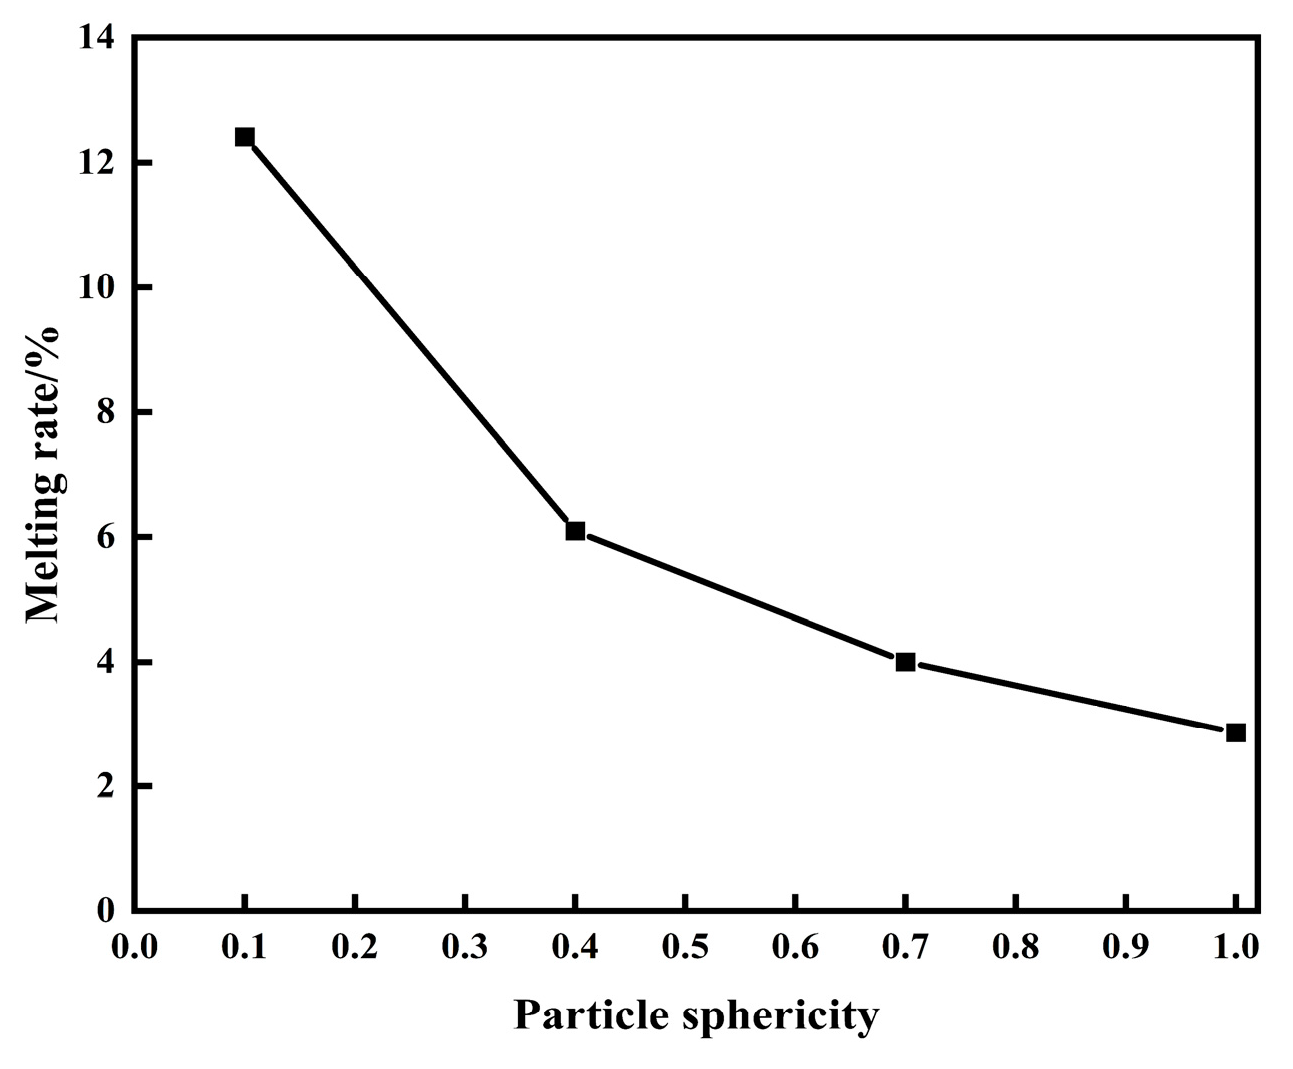
In the first stage of the phase transition process, the particles always remain pure solid ice crystals, the sphericity maintains the initial sphericity, and the density is that of solid ice. In the third stage, the particles always remain pure liquid droplets with sphericity of 1 and density of liquid water. In the second phase, the particle is a mixed solid-liquid state, and the calculation of sphericity and density depends on the solid-liquid ratio of the mixed state, the calculation formula is as follows:
where,
refers to the initial sphericity of ice crystals.
and
refer to the density of ice and water, respectively.


