
Structural Damage Assessment of an Airfoil Anti-Icing System under Hailstorm Conditions


Abstract
:1. Introduction
2. Materials and Methods
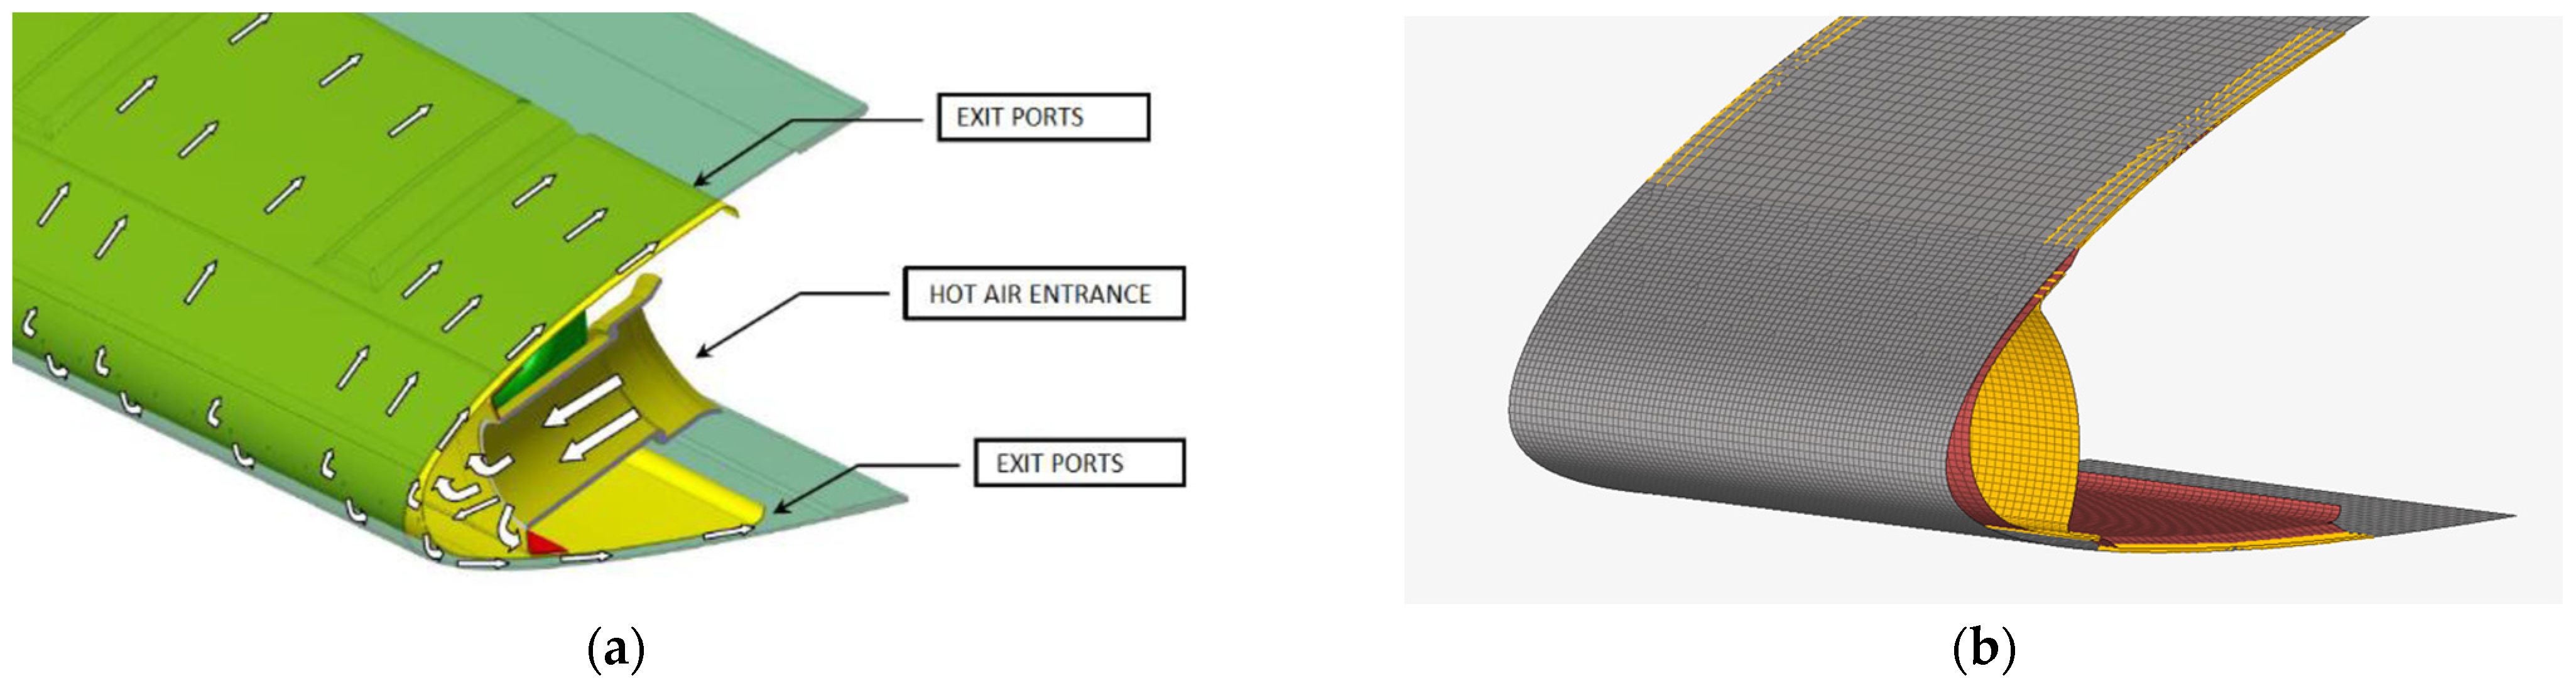
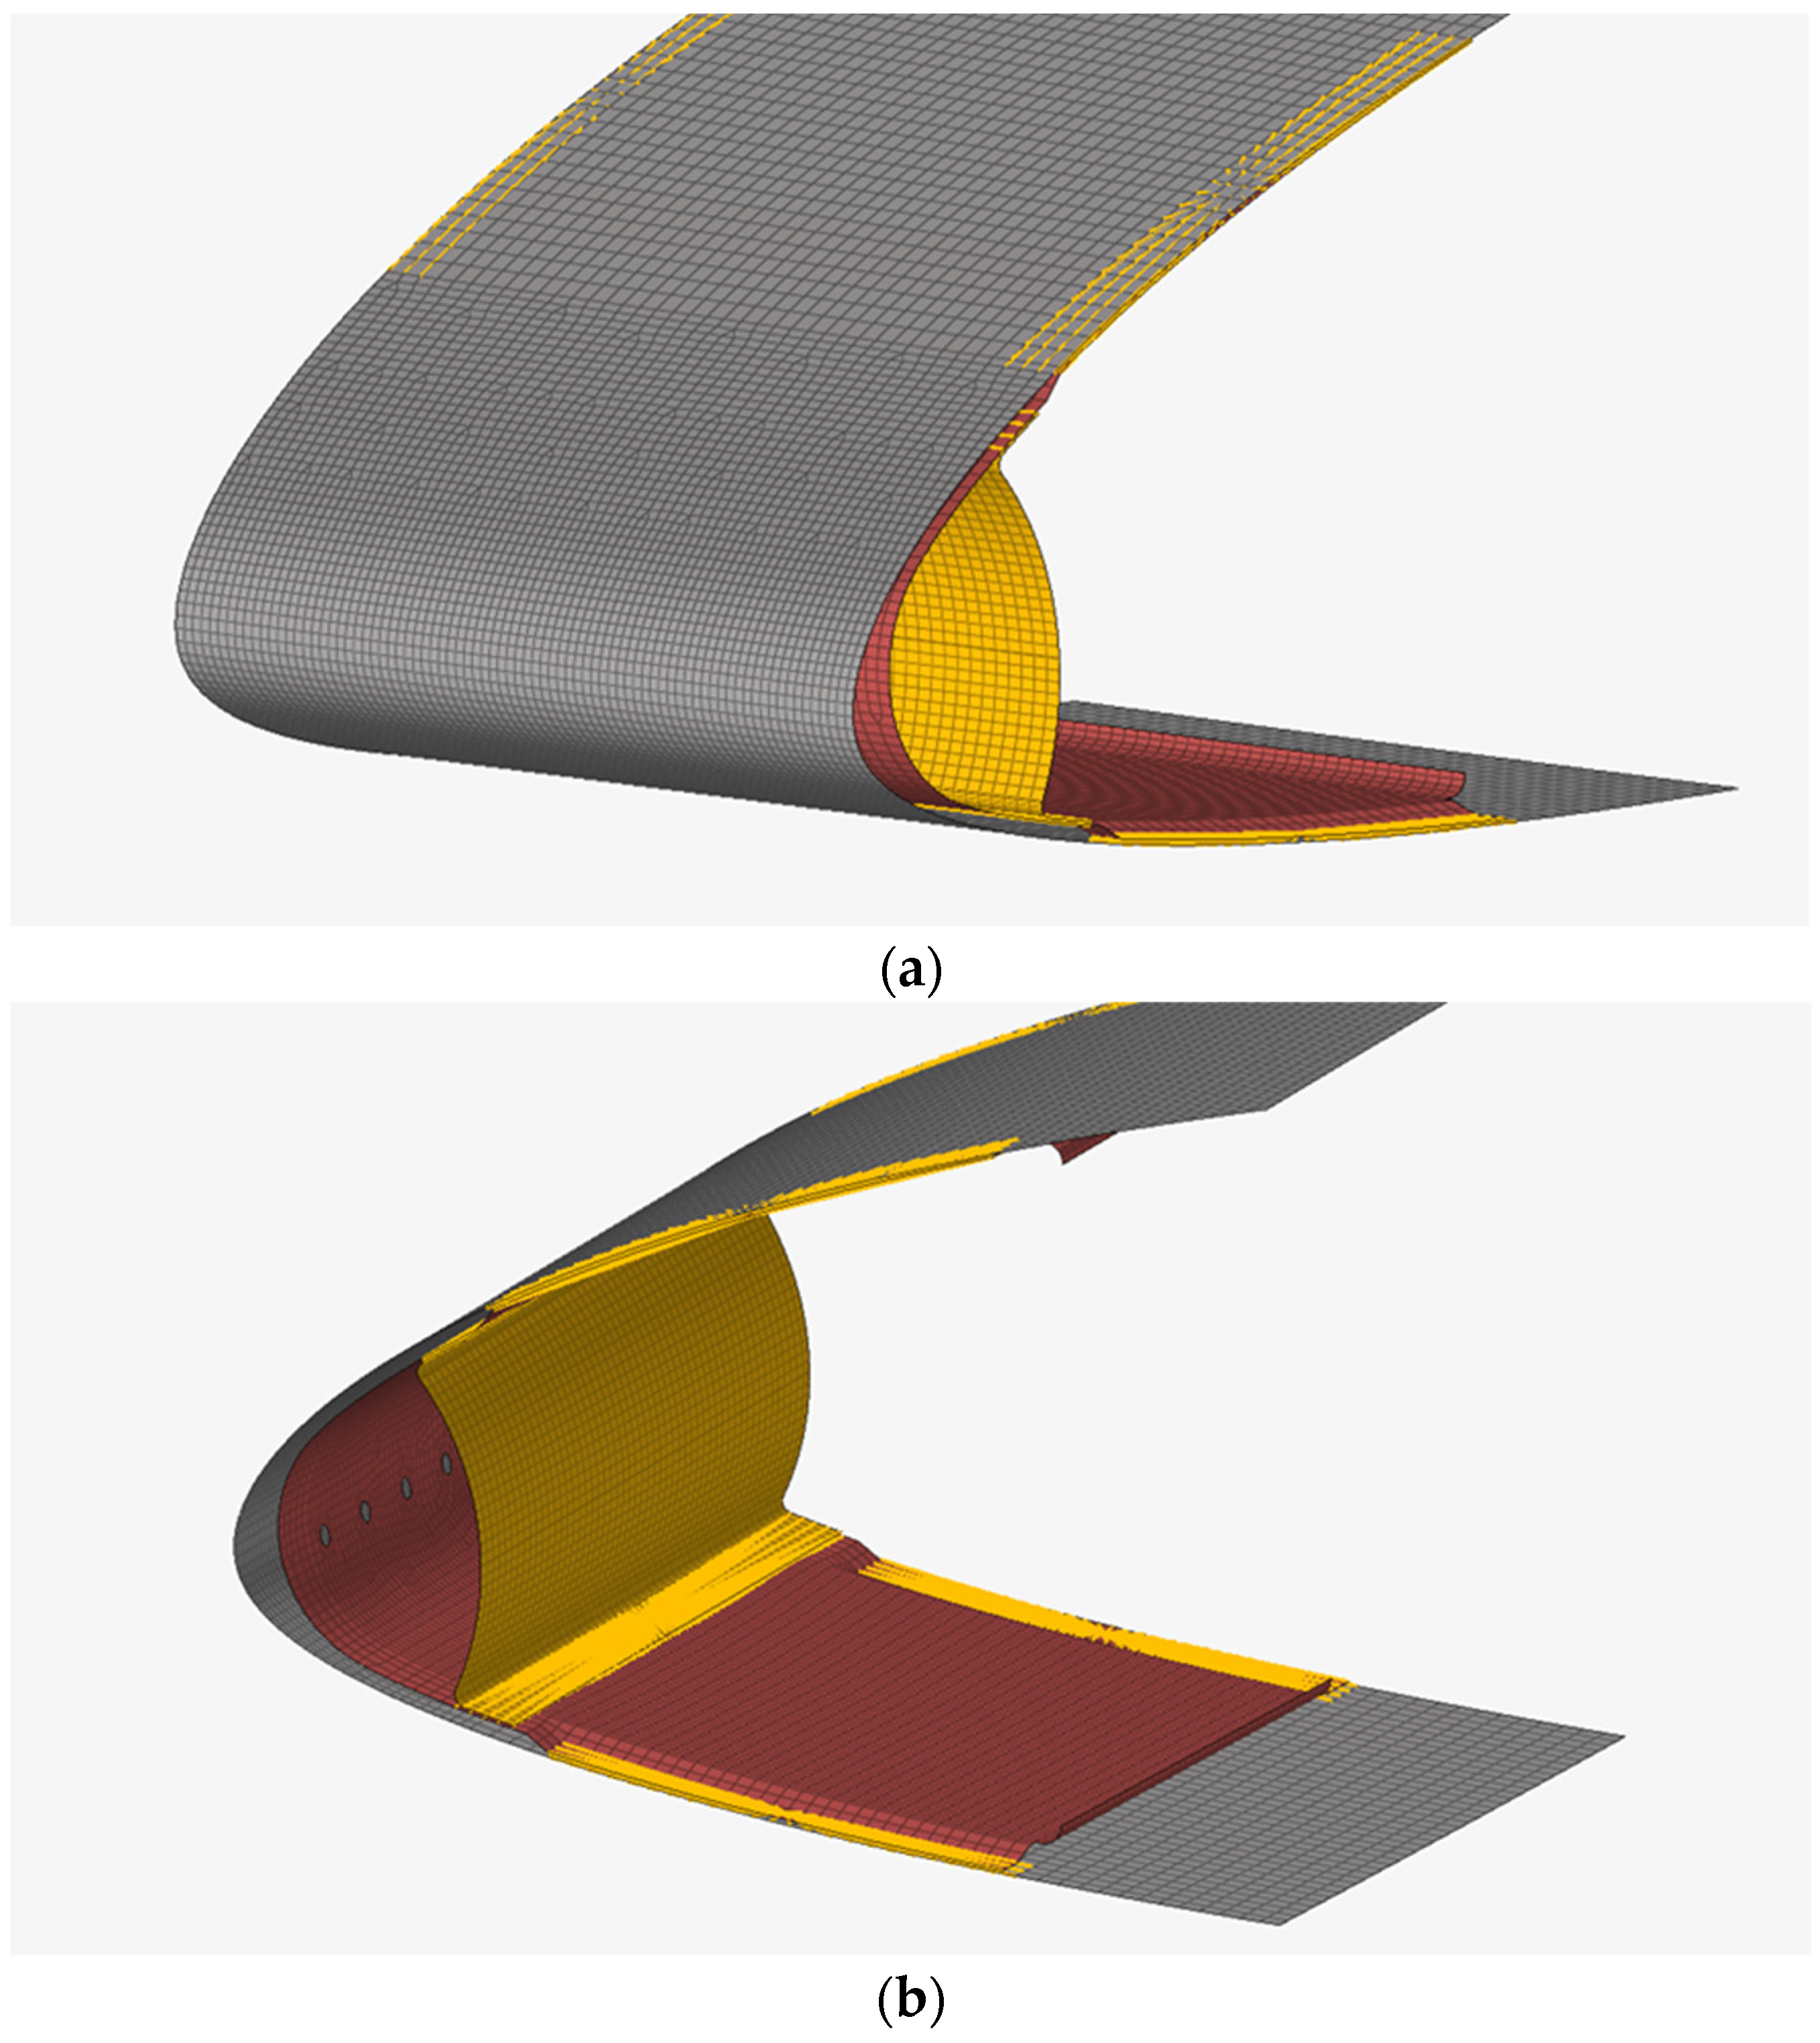
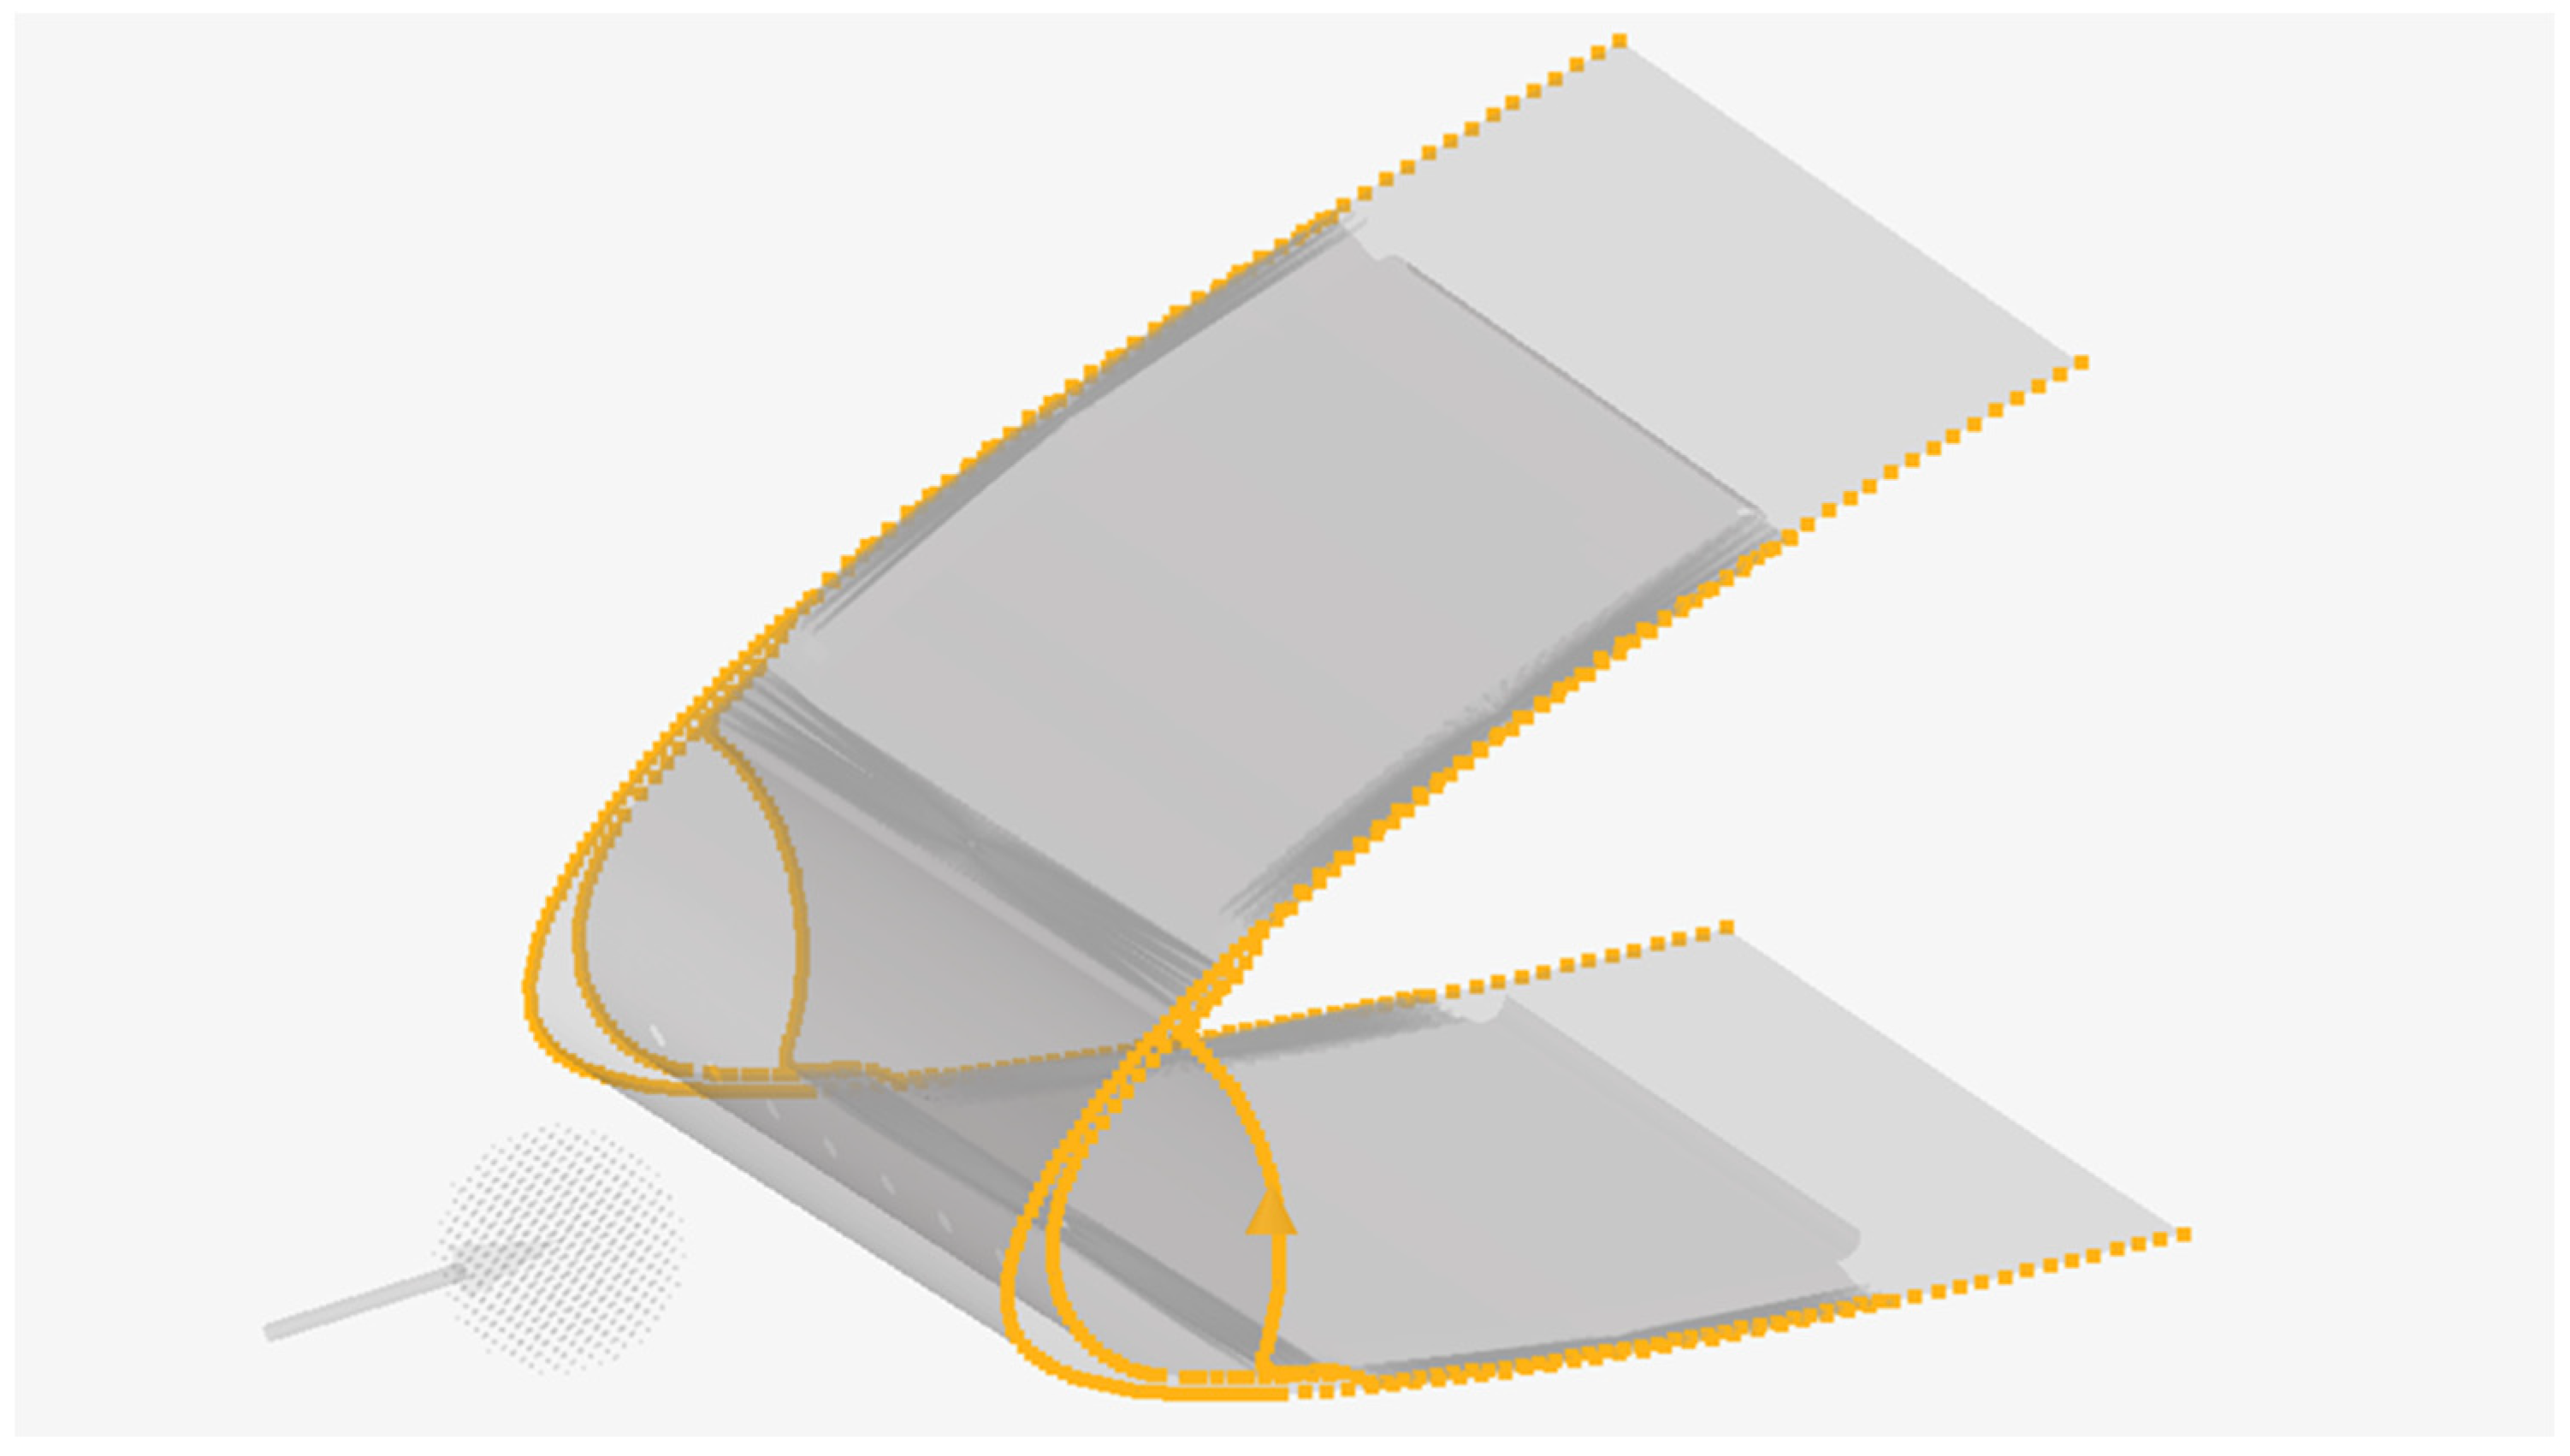
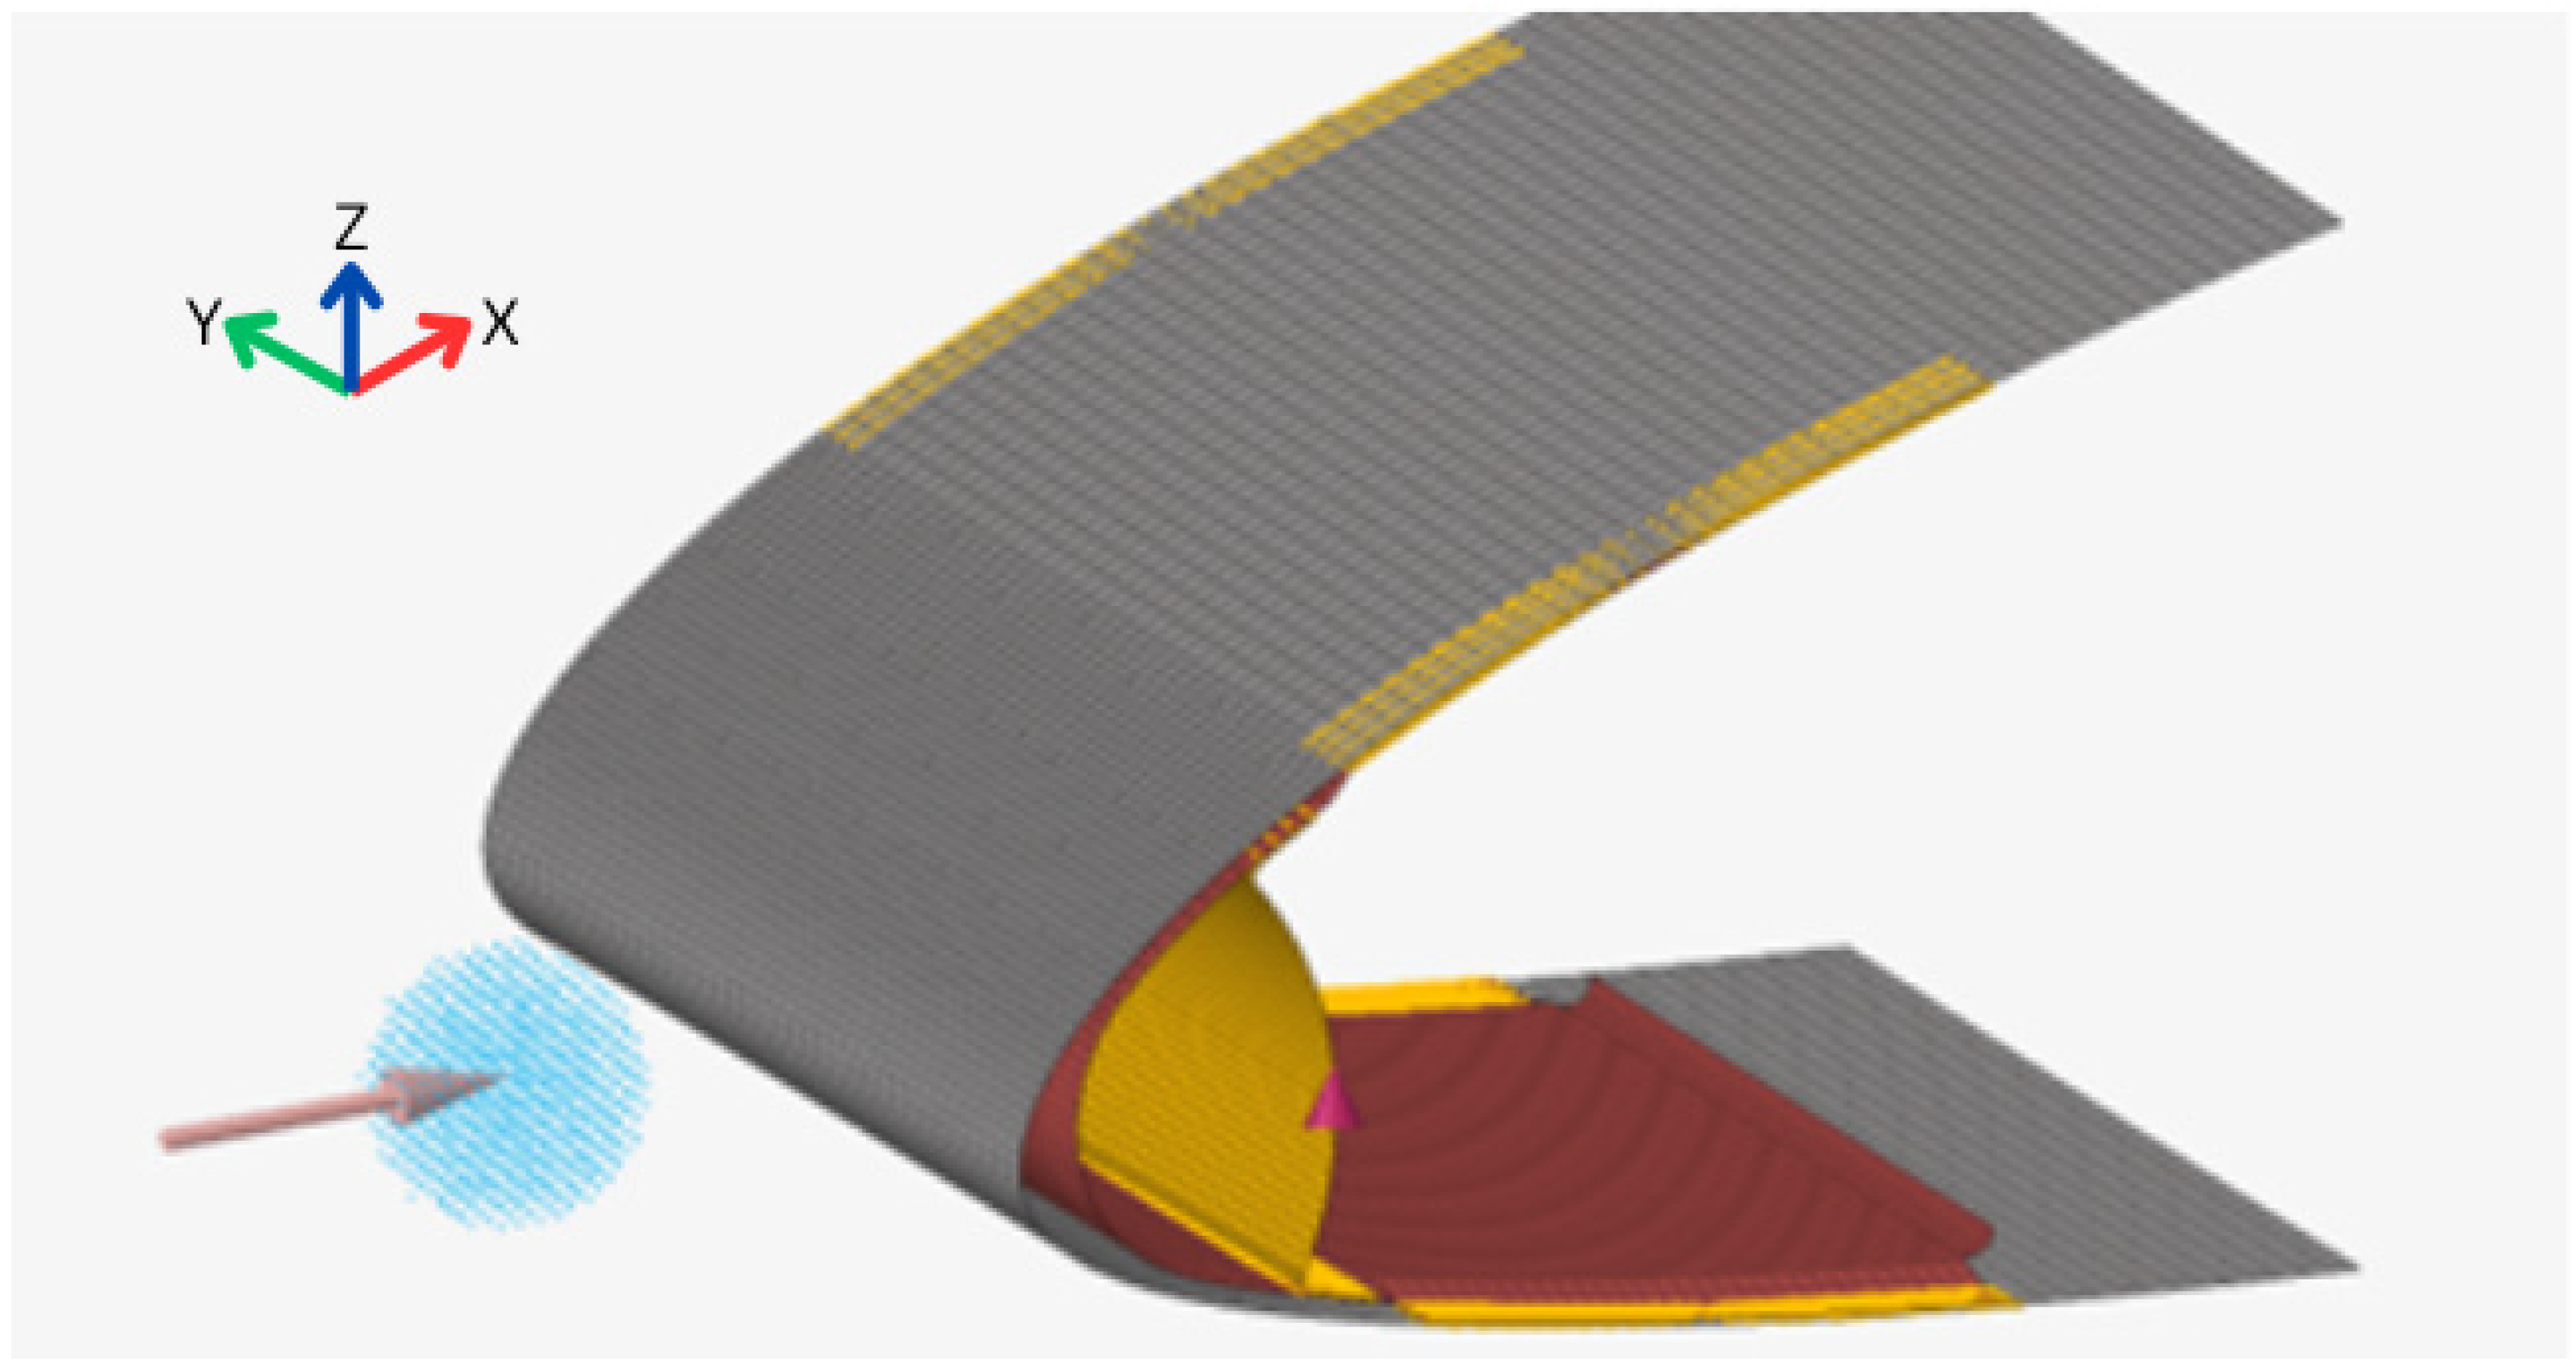
2.1. Model Description and Setup
- The leading edge;
- The anti-icing system.
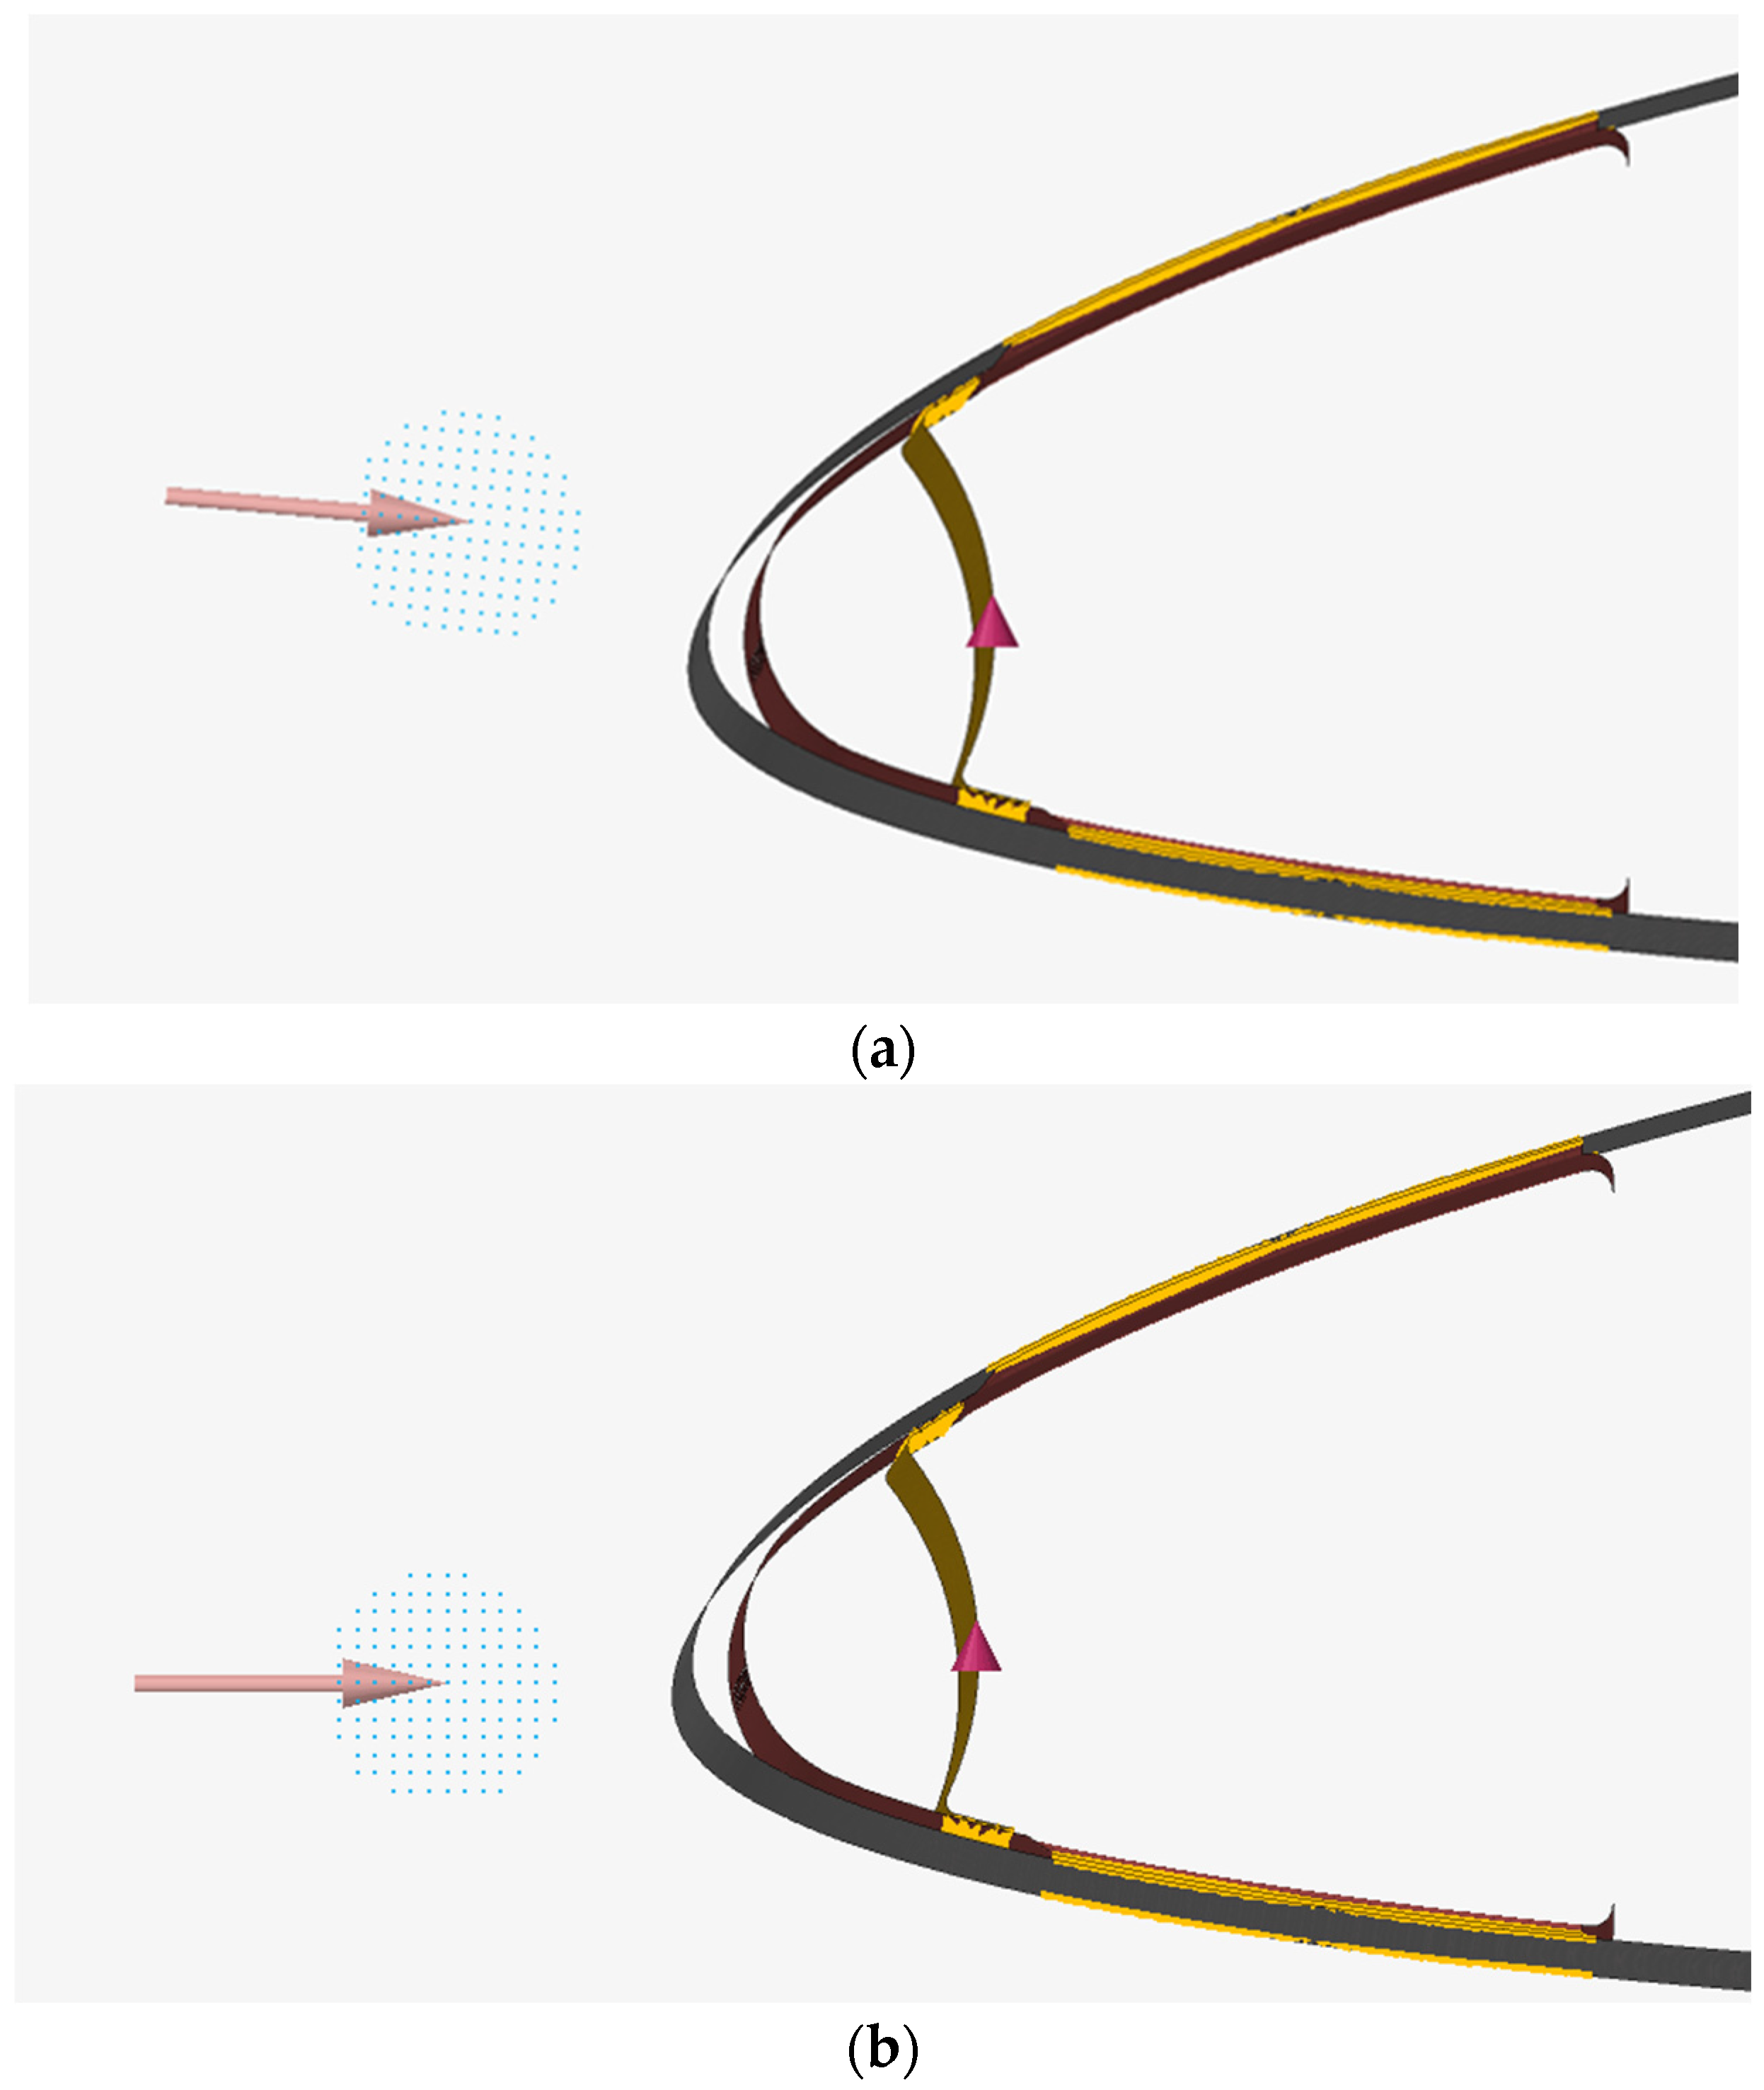
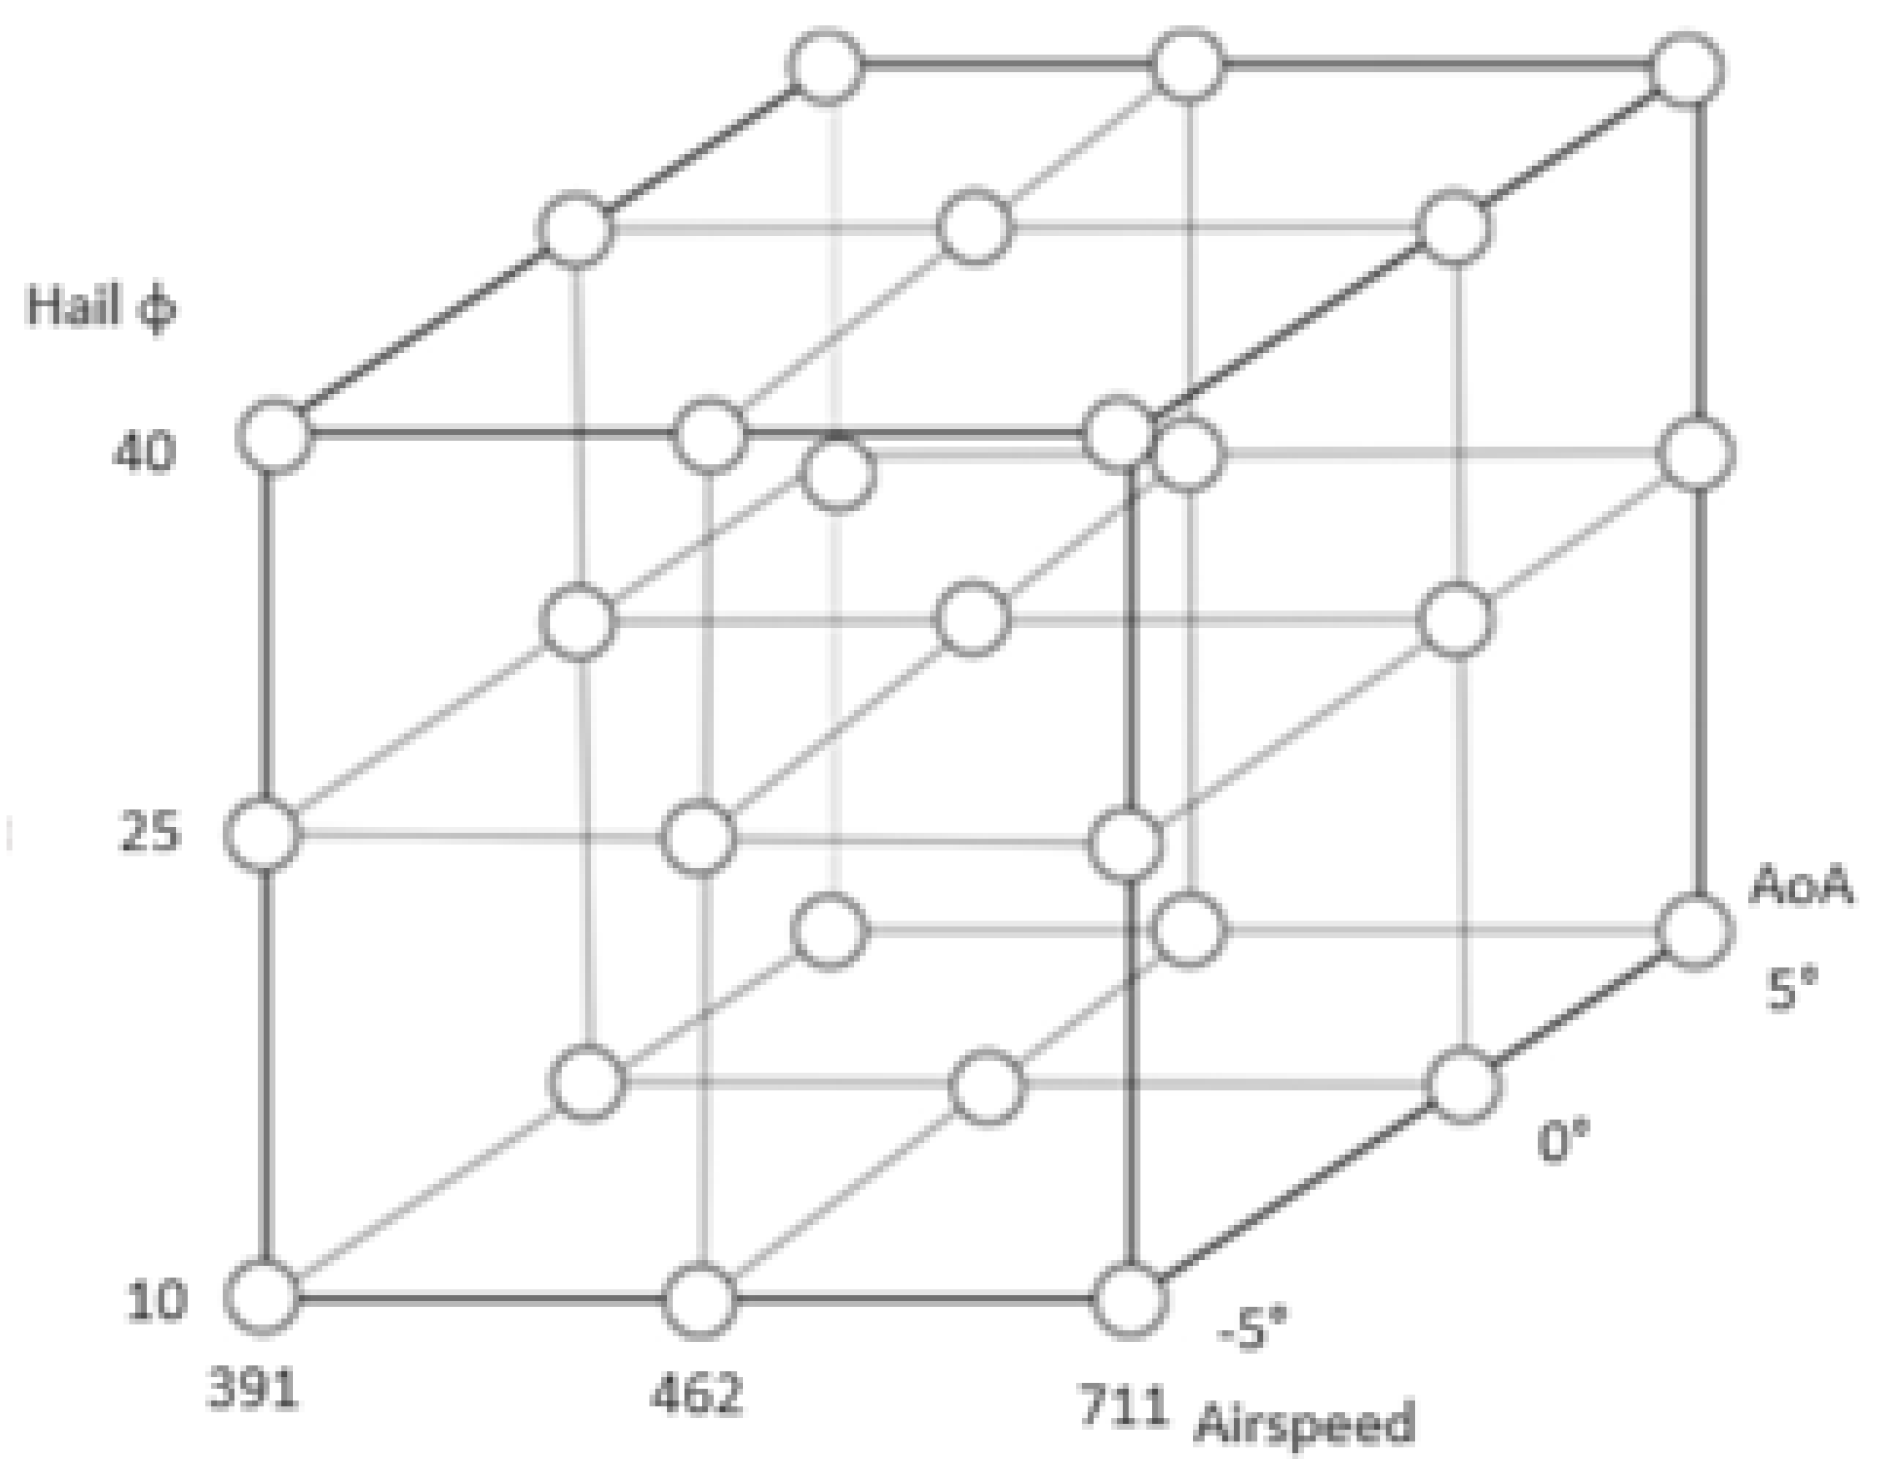
2.2. DOE Setup Description
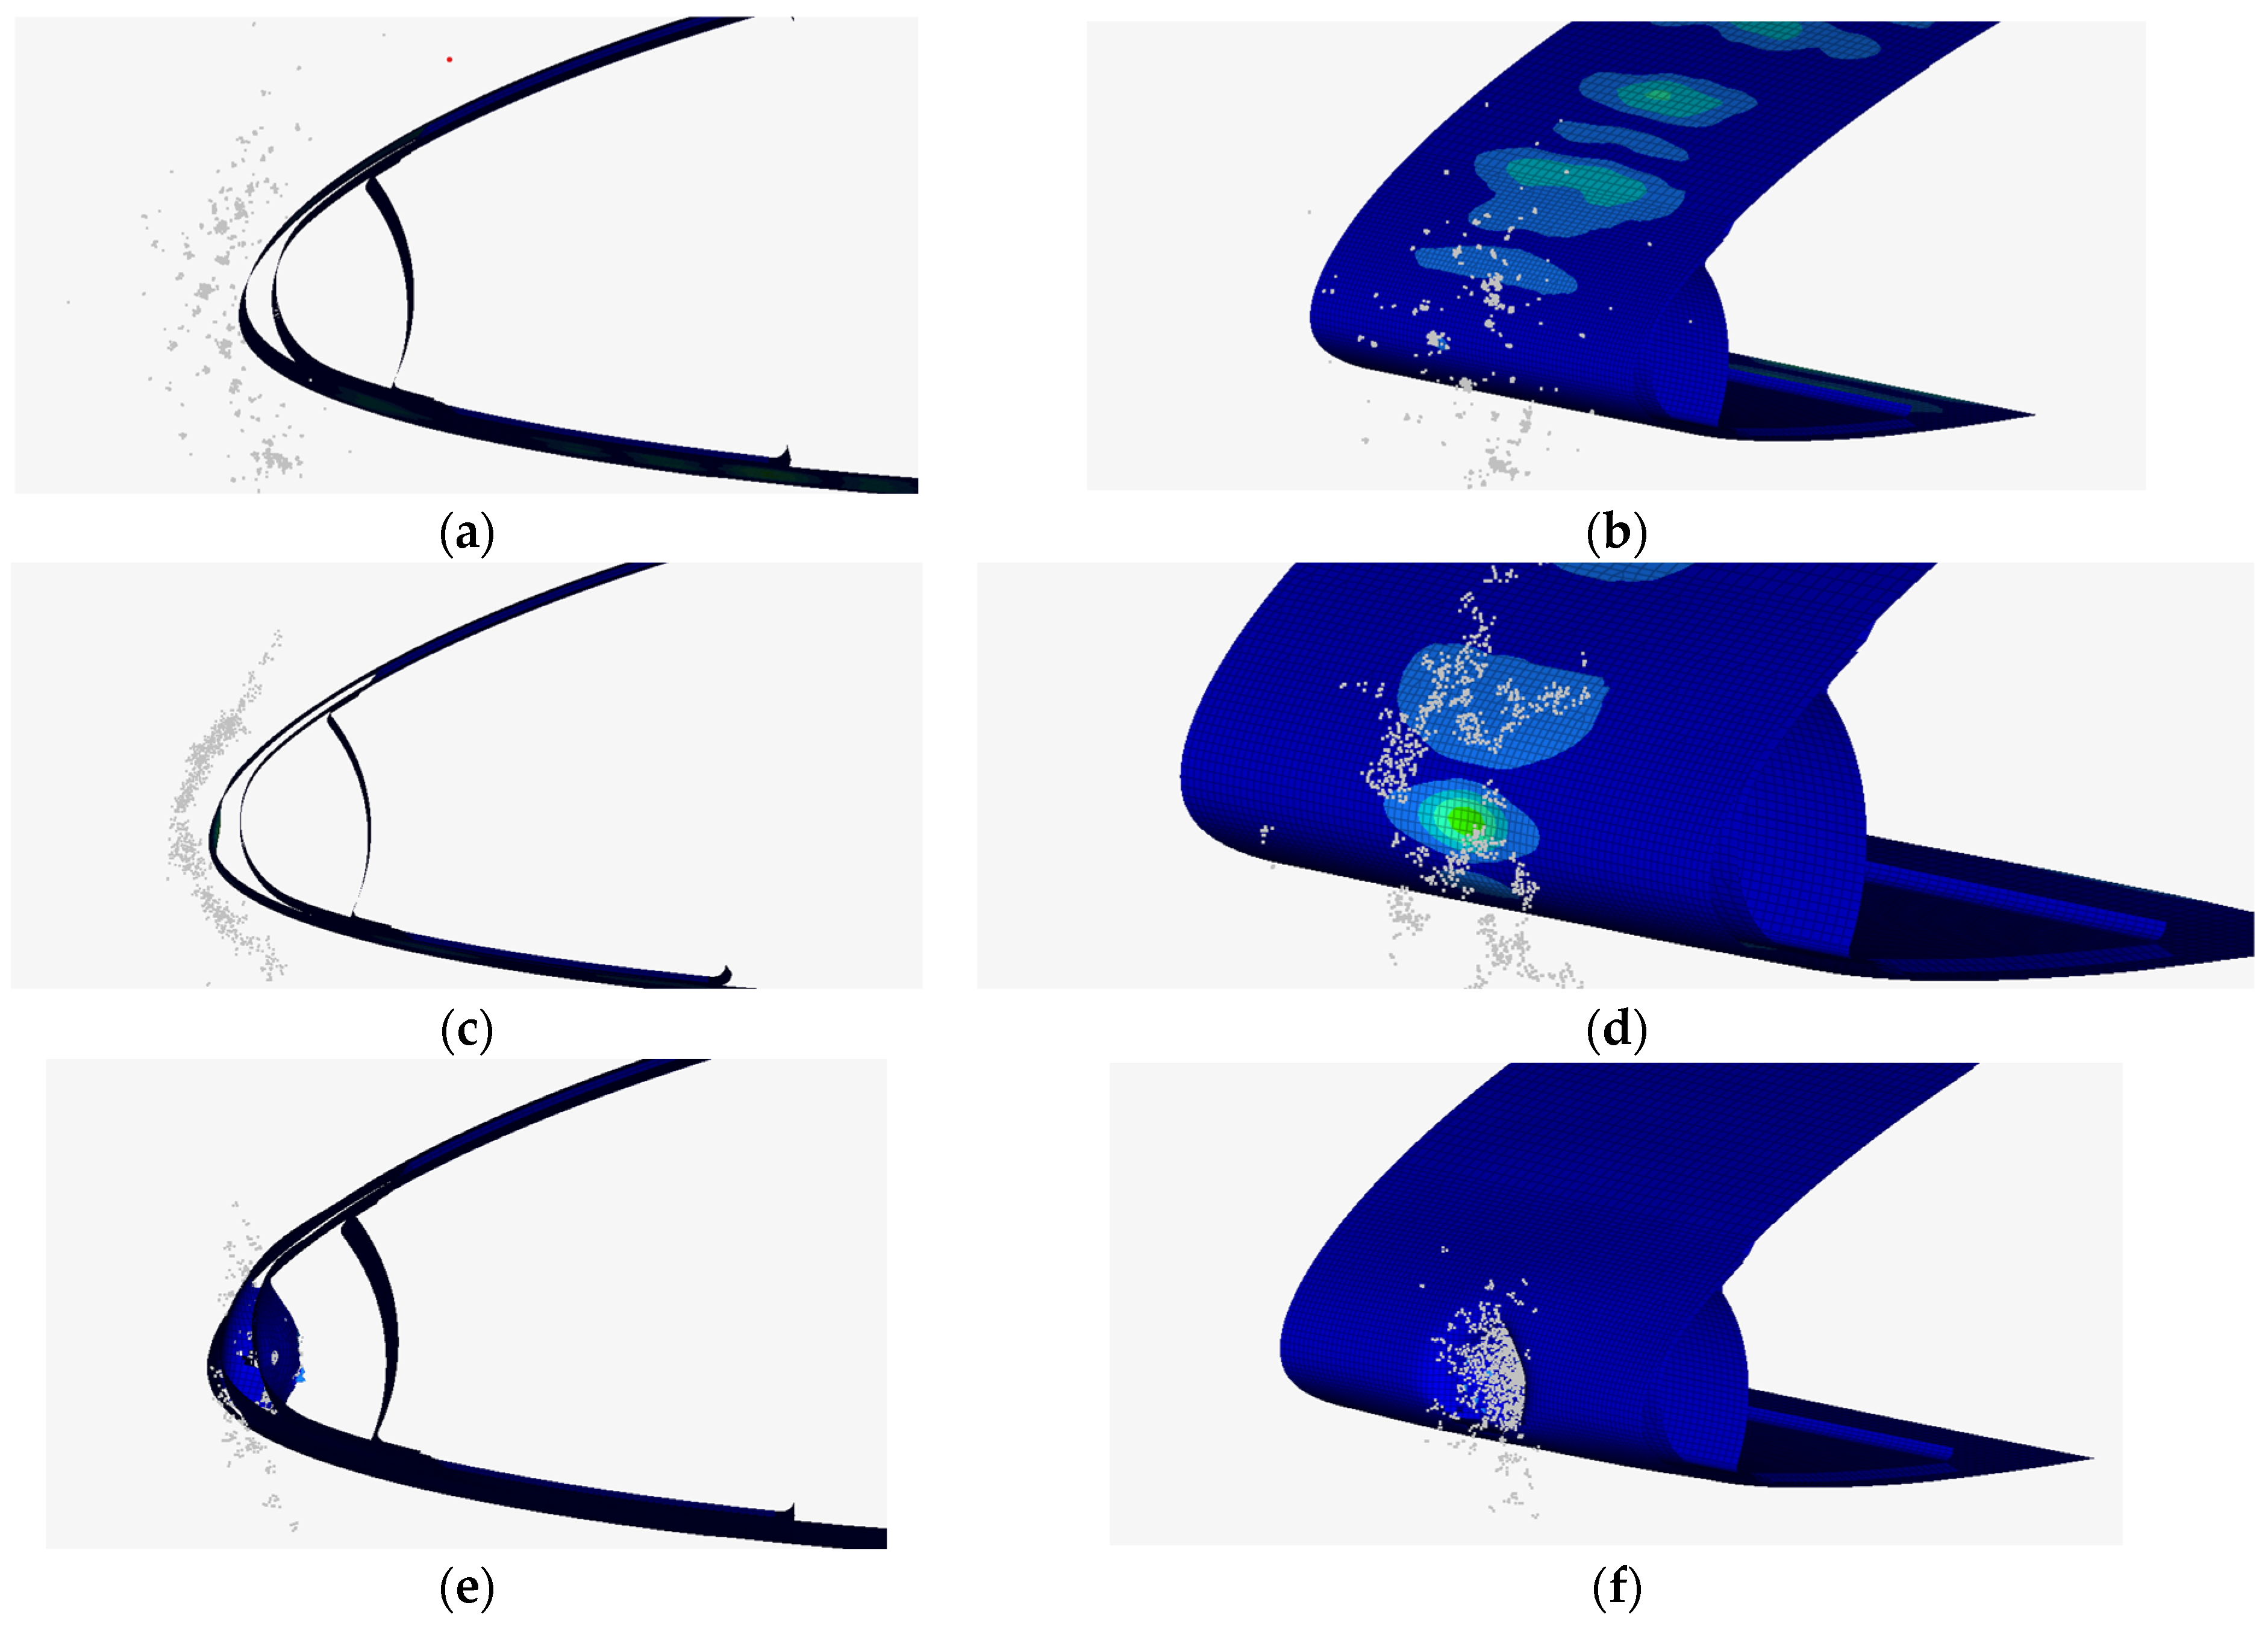
3. Results
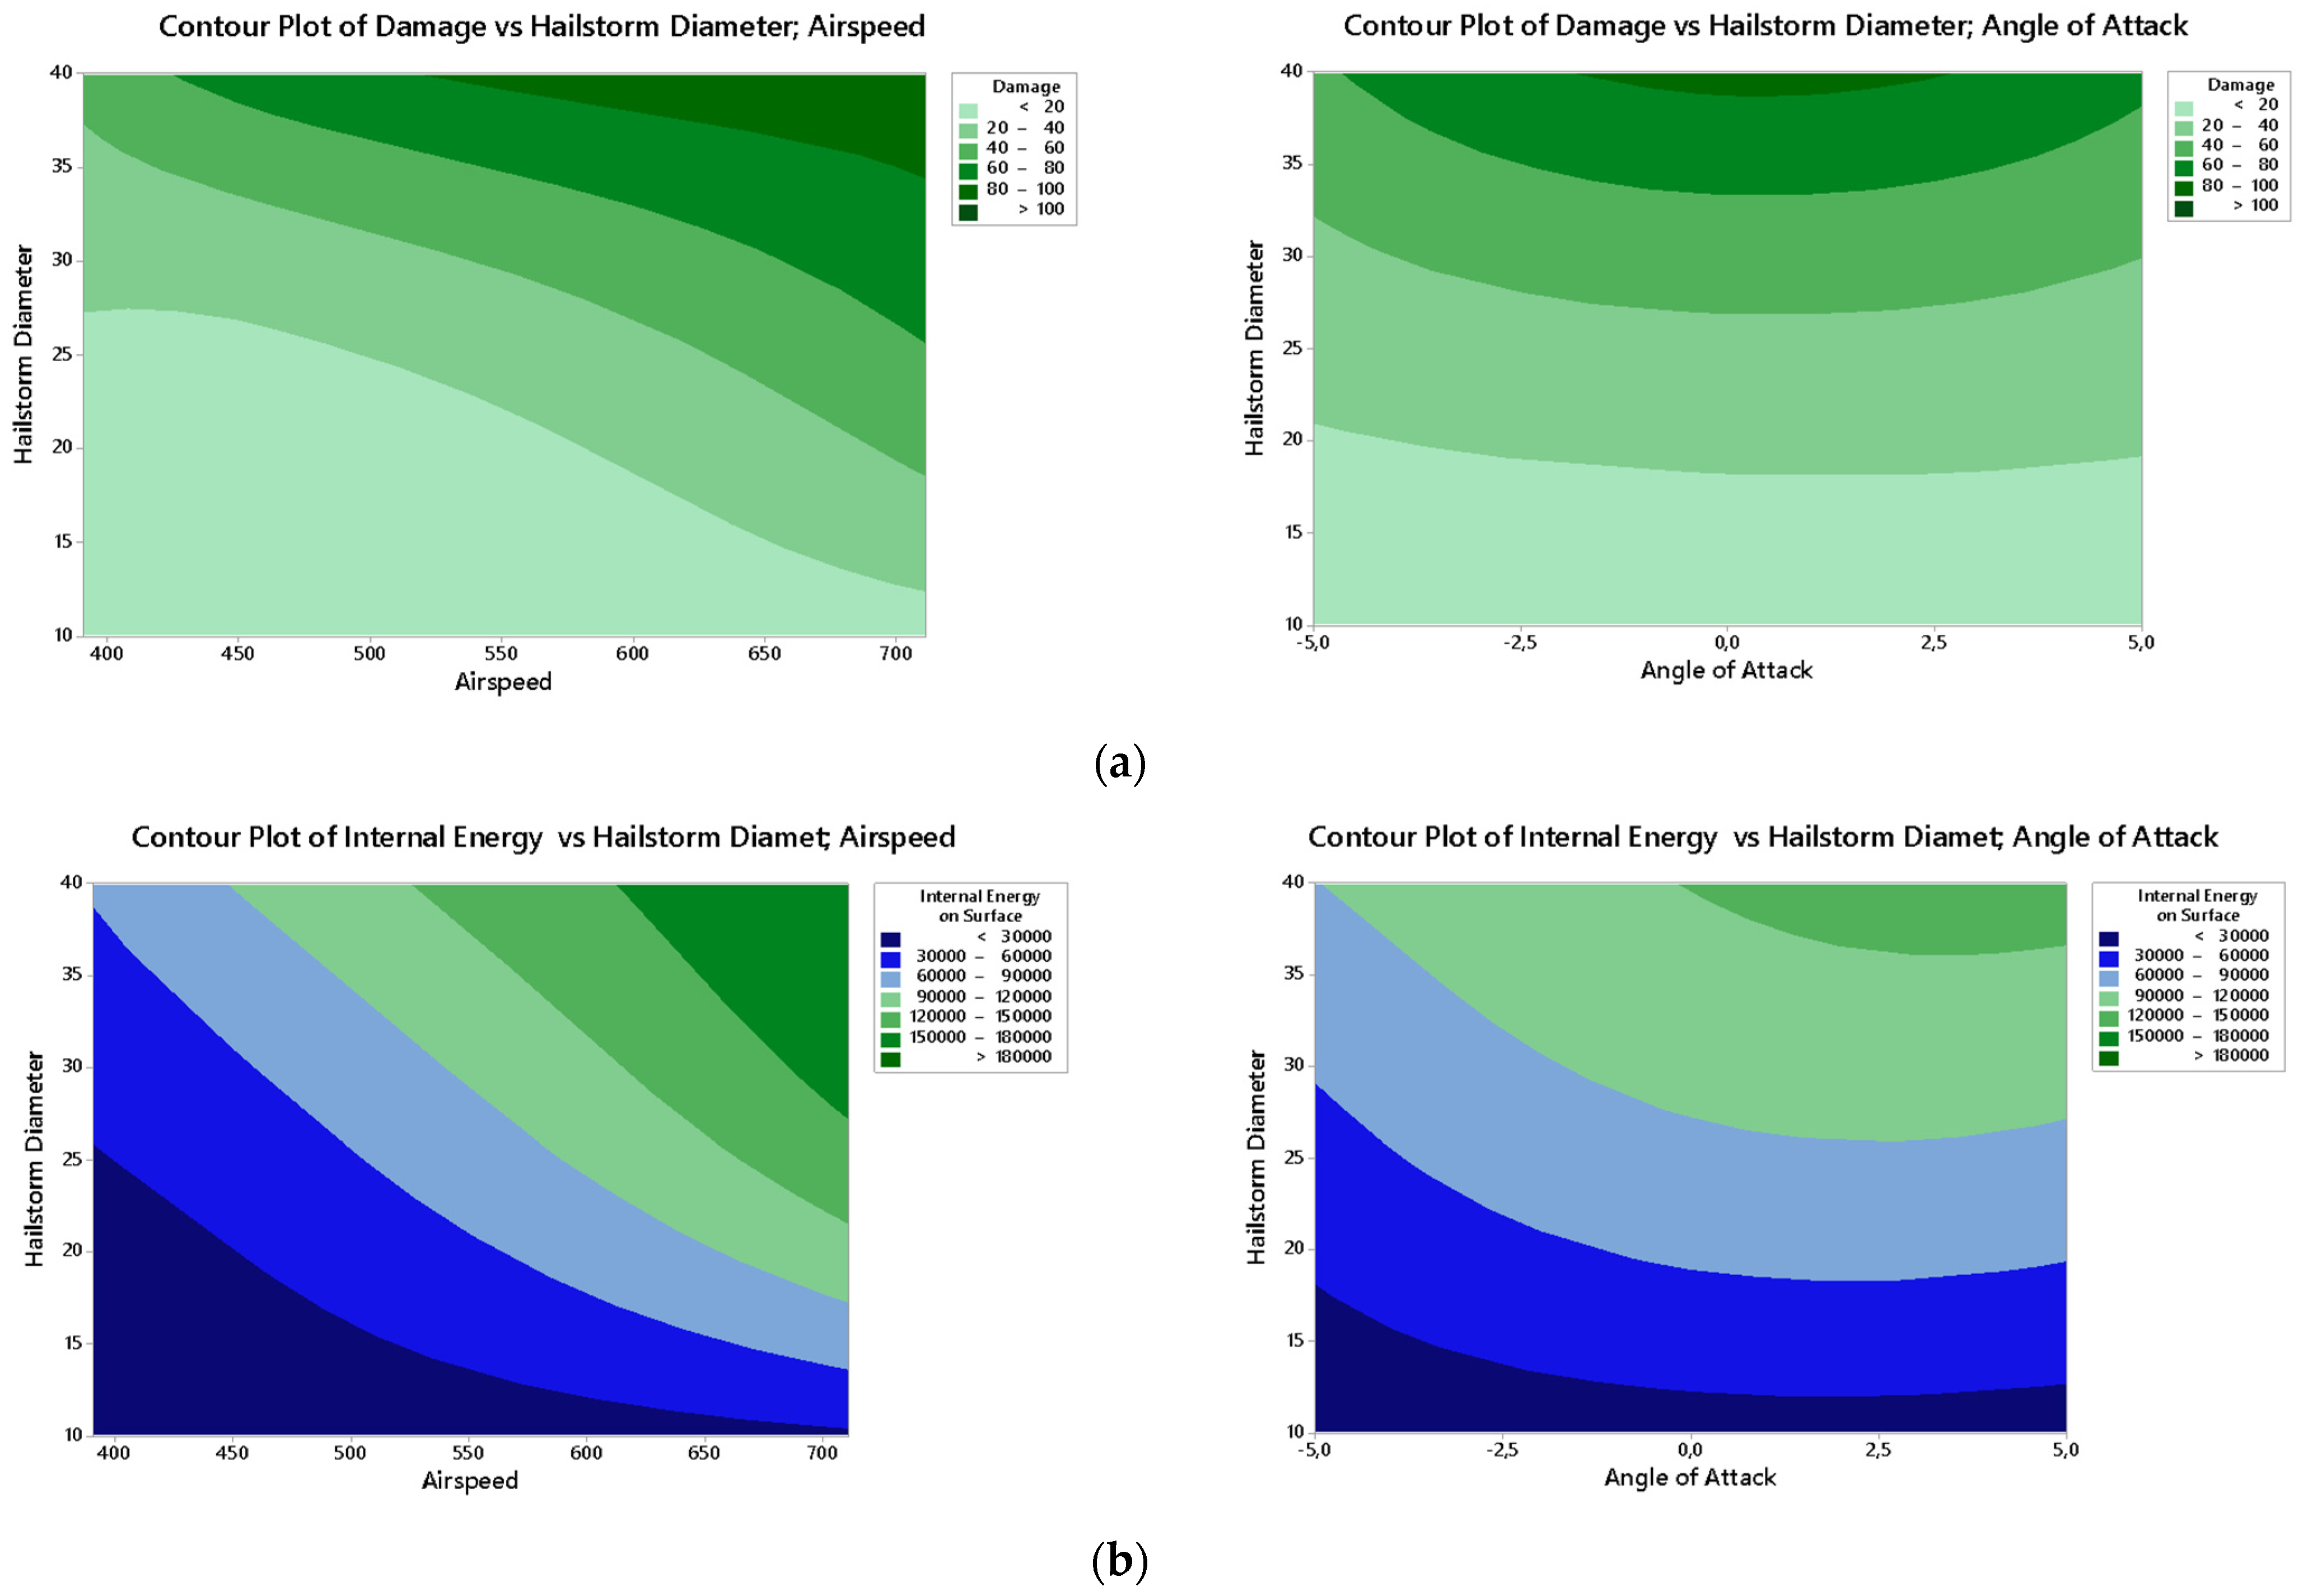
3.1. Risk Map
3.2. DOE Results
3.3. Risk Maps
4. Conclusions
Author Contributions
Funding
Data Availability Statement
Acknowledgments
Conflicts of Interest
Appendix A

Appendix B
References
- Laird, H.B. Aircraft Encounters with Severe Hailstorms. Weatherwise 1954, 7, 27–41. [Google Scholar] [CrossRef]
- Saha, S.L.K.R. Hailstones and their effects on aircraft. MAUSAM 1961, 12, 419–430. [Google Scholar] [CrossRef]
- Baltaci, H.; Akkoyunlu, B.O.; Tayanc, M. An Extreme Hailstorm on 27 July 2017 in Istanbul, Turkey: Synoptic Scale Circulation and Thermodynamic Evaluation. Pure Appl. Geophys. 2018, 175, 3727–3740. [Google Scholar] [CrossRef]
- Jennings, G. Australia Assesses Damage to P-8A MMA Aircraft Caused by Hailstorm. IHS Jane’s Defence Weekly, 13 January 2022; Volume 59. [Google Scholar]
- Aircraft damage during a severe hailstorm west of Helsinki, Finland, 21 July 2001. J. Meteorol. 2003, 28.
- Gensini, A.V. Severe convective storms in a changing climate. In Climate Change and Extreme Events; Elsevier: Amsterdam, The Netherlands, 2021. [Google Scholar] [CrossRef]
- Webb, J.; Elsom, D.; Meaden, G. Severe hailstorms in Britain and Ireland, a climatological survey and hazard assessment. Atmos. Res. 2008, 93, 587–606. [Google Scholar] [CrossRef]
- Zhang, Y.; Wang, B.; Bai, C.; Liu, X.; Guo, J. Anti-impact characteristics and contrastive study of typical aircraft structures against hail and simulated bird projectile. Zhendong Yu Chongji/J. Vib. Shock. 2021, 40, 27–40. [Google Scholar] [CrossRef]
- Zhang, C.; Fang, X.; Liu, J.; Mao, C. Hail ice impact simulation and damage response analysis in composite laminates. Mech. Adv. Mater. Struct. 2023, 30, 498–509. [Google Scholar] [CrossRef]
- Lavoie, M.-A.; Ensan, M.N.; Gakwaya, A. Development of an efficient numerical model for hail impact simulation based on experimental data obtained from pressure sensitive film. Mech. Res. Commun. 2011, 38, 72–76. [Google Scholar] [CrossRef]
- Zhou, J.; Zhao, Z.; Shi, Y.; Wang, X.; Chen, X.; Shan, C. Hail impact responses and residual tensile properties of CFRP T-joints. Chin. J. Aeronaut. 2023, 36, 430–443. [Google Scholar] [CrossRef]
- Zhang, C.; Fang, X.; Curiel-Sosa, J.L.; Bui, T.Q.; Mao, C. Damage in hybrid corrugated core sandwich structures under high velocity hail ice impact: A numerical study. Def. Technol. 2023, 27, 217–236. [Google Scholar] [CrossRef]
- SNeidigk, O.; Roach, D.P.; Duvall, R.L.; Rice, T.M. Detection and Characterization of Hail Impact Damage in Carbon Fiber Aircraft Structure; Federal Aviation Administration: Washington, DC, USA, 2017. [Google Scholar]
- Anghileri, M.; Castelletti, L.M.L.; Invernizzi, F.; Mascheroni, M. A numerical model for hail impact analysis. In Proceedings of the 30th European Rotorcraft Forum, Florence, Italy, 13–15 September 2005. [Google Scholar]
- Goraj, Z. An overview of the deicing and anti-icing technologies with prospects for the future. In Proceedings of the 24th International Congress of the Aeronautical Sciences, Yokohama, Japan, 29 August–3 September 2004. [Google Scholar]
- Zhang, Y.; Shi, Y.; Xu, J. Hail impact on composite structures of civil aircrafts. In Proceedings of the ICCM International Conferences on Composite Materials, International Committee on Composite Materials, Xi’an, China, 20–25 August 2017. [Google Scholar]
- Souter, R.K.; Emerson, J.B. Summary of Available Hail Literature and the Effect of Hail on Aircraft in Flight; NACA Technical Note 2734; National Advisory Committee for Aeronautics: Washington, DC, USA, 1952; pp. 1–33. [Google Scholar]
- Gultepe, I.; Sharman, R.; Williams, P.D.; Zhou, B.; Ellrod, G.; Minnis, P.; Trier, S.; Griffin, S.; Yum, S.S.; Gharabaghi, B.; et al. A Review of High Impact Weather for Aviation Meteorology. Pure Appl. Geophys. 2019, 176, 1869–1921. [Google Scholar] [CrossRef]
- Matos, N.; Gomes, M.; Infante, V. Numerical modelling of soft body impacts: A review. Eng. Fail. Anal. 2023, 153, 107595. [Google Scholar] [CrossRef]
- Goraj, Z.J.; Kustron, K. Review of current research trends in bird strike and hail impact simulations on wing leading edge. Aircr. Eng. Aerosp. Technol. 2018, 90, 602–612. [Google Scholar] [CrossRef]
- Zhu, S.; Peng, W.; Shao, Y.; Li, S. Experimental and numerical study on the high-velocity hail impact performance of carbon fiber aluminum alloy laminates. Int. J. Impact Eng. 2023, 179, 104664. [Google Scholar] [CrossRef]
- Vacca, A. P180 main wing anti-ice system: Analysis and improvements. 2013. [Google Scholar]
- Durakovic, B. Design of experiments application, concepts, examples: State of the art. Period. Eng. Nat. Sci. 2017, 5. [Google Scholar] [CrossRef]
- Johnson, C.J. Anti Icing Duct. U.S. Patent 2320870, 1 June 1943. [Google Scholar]
- Bici, M.; Brischetto, S.; Campana, F.; Ferro, C.G.; Seclì, C.; Varetti, S.; Maggiore, P.; Mazza, A. Development of a multifunctional panel for aerospace use through SLM additive manufacturing. Procedia CIRP 2018, 67, 215–220. [Google Scholar] [CrossRef]
- Inc. Altair Engineering. Hypermesh. Available online: https://2021.help.altair.com/2021.2/hwsolvers/rad/topics/solvers/rad/rad_user_guide_intro_c.htm#overview_ref_guide_rad_c (accessed on 5 May 2024).
- Imran, M.; Khan, A.A. Characterization of Al-7075 metal matrix composites: A review. J. Mater. Res. Technol. 2019, 8, 3347–3356. [Google Scholar] [CrossRef]
- Sharma, P.; Chandel, P.; Bhardwaj, V.; Singh, M.; Mahajan, P. Ballistic impact response of high strength aluminium alloy 2014-T652 subjected to rigid and deformable projectiles. Thin-Walled Struct. 2018, 126, 205–219. [Google Scholar] [CrossRef]
- Field, P.R.; Hand, W.; Cappelluti, G.; McMillan, A.; Foreman, A.; Stubbs, D.; Willows, M. Hail Threat Standardisation (EASA); EASA: Köln, Germany, 2008. [Google Scholar]
- Meng, S.; Taddei, L.; Lebaal, N.; Roth, S. Advances in ballistic penetrating impact simulations on thin structures using Smooth Particles Hydrodynamics: A state of the art. Thin-Walled Struct. 2021, 159, 107206. [Google Scholar] [CrossRef]
- Stellingwerf, R.F.; Wingate, C.A. Impact modeling with smooth particle hydrodynamics. Int. J. Impact Eng. 1993, 14, 707–718. [Google Scholar] [CrossRef]
- Montgomery, D.C. Design and Analysis of Experiments; John Wiley & Sons, Inc.: Sedona, AZ, USA, 2013; p. 684. [Google Scholar]
- Myers, R.H.; Montgomery, D.C.; Anderson-Cook, C.M. Response Surface Methodology: Process and Product Optimization Using Designed Experiments; John Wiley & Sons: Hoboken, NJ, USA, 2016. [Google Scholar]
- Rusu, M.; Soare, I. Comparative risk assessment in applicative aerospace projects using different approaches. INCAS Bull. 2018, 10, 233–246. [Google Scholar] [CrossRef]


| Description | Value | |
|---|---|---|
| Law type | M2 Plastic-Johnson Zeril | |
| Density | 2.88 × 10⁻⁹ | Ton/mm3 |
| Young modulus | 71,700 | N/mm2 |
| Poisson coefficient | 0.33 | |
| a coefficient | 510 | |
| b coefficient | 421.08 | |
| n coefficient | 0.634 | |
| εp max | 0.108 | |
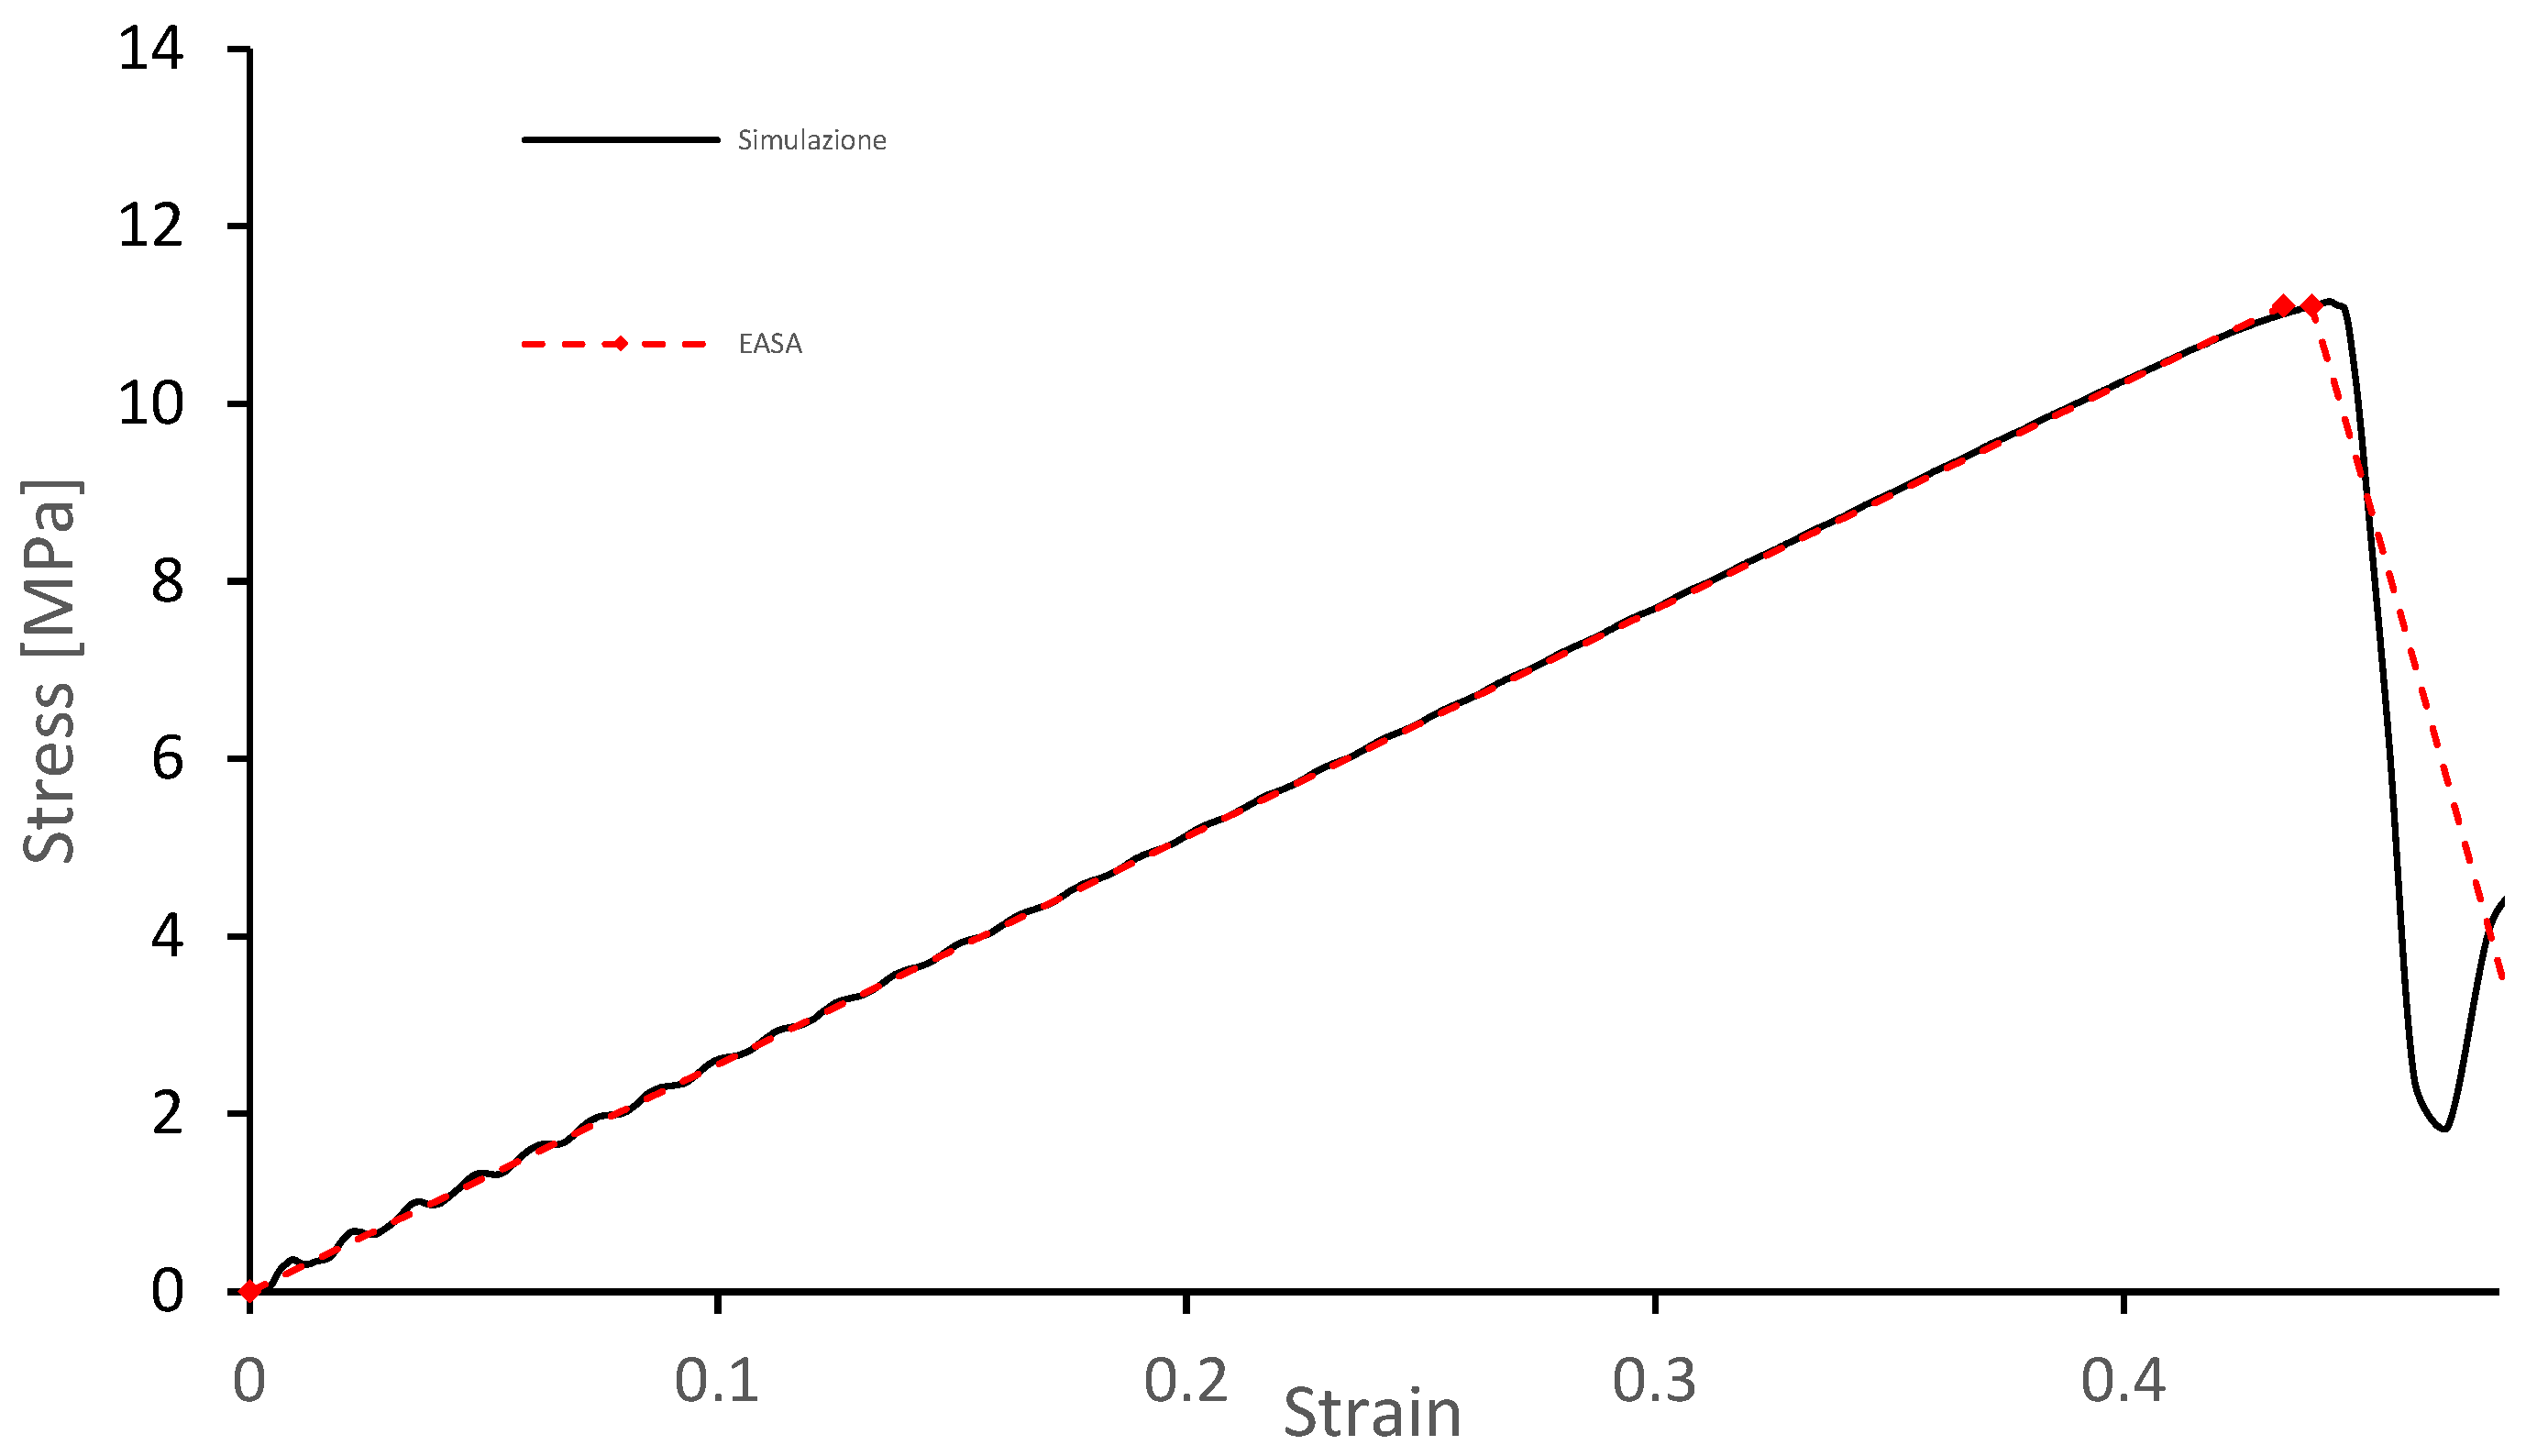
| Description | Value | |
|---|---|---|
| Law type | M4 Hyd Johnson Cook | |
| Density | 9.167 × 10⁻¹⁰ | Ton/mm3 |
| Young modulus | 2450 | MPa |
| Poisson coefficient | 0.33 | |
| a coefficient | 11.15 | |
| b coefficient | 0 | |
| n coefficient | 1 | |
| σmax | 11.15 | MPa |
| Pmin | −11.15 | |
| Description | Value | |
|---|---|---|
| Card_Image | P1 shell | |
| Ishell | 24 | |
| Number of integrations (N) | 5 | |
| Ithick | 1 | |
| Iplas | 1 | |
| Thickness anti-ice | 0.6 | mm |
| Thickness leading edge | 1 | mm |
| Description | Value | |
|---|---|---|
| Quadratic bulk viscosity | 2 × 10⁻³⁰ | |
| Linear bulk viscosity | 1 × 10⁻³⁰ | |
| Mass of the particle | Variable | |
| Smoothing length (h) | Variable | |
| Description | Vx | Vy | Vz | |||
|---|---|---|---|---|---|---|
| −5° direction | 127.84 | m/s | 0 | m/s | 11.18 | m/s |
| 0° direction | 128.33 | m/s | 0 | m/s | 0 | m/s |
| +5° direction | 127.84 | m/s | 0 | m/s | −11.18 | m/s |
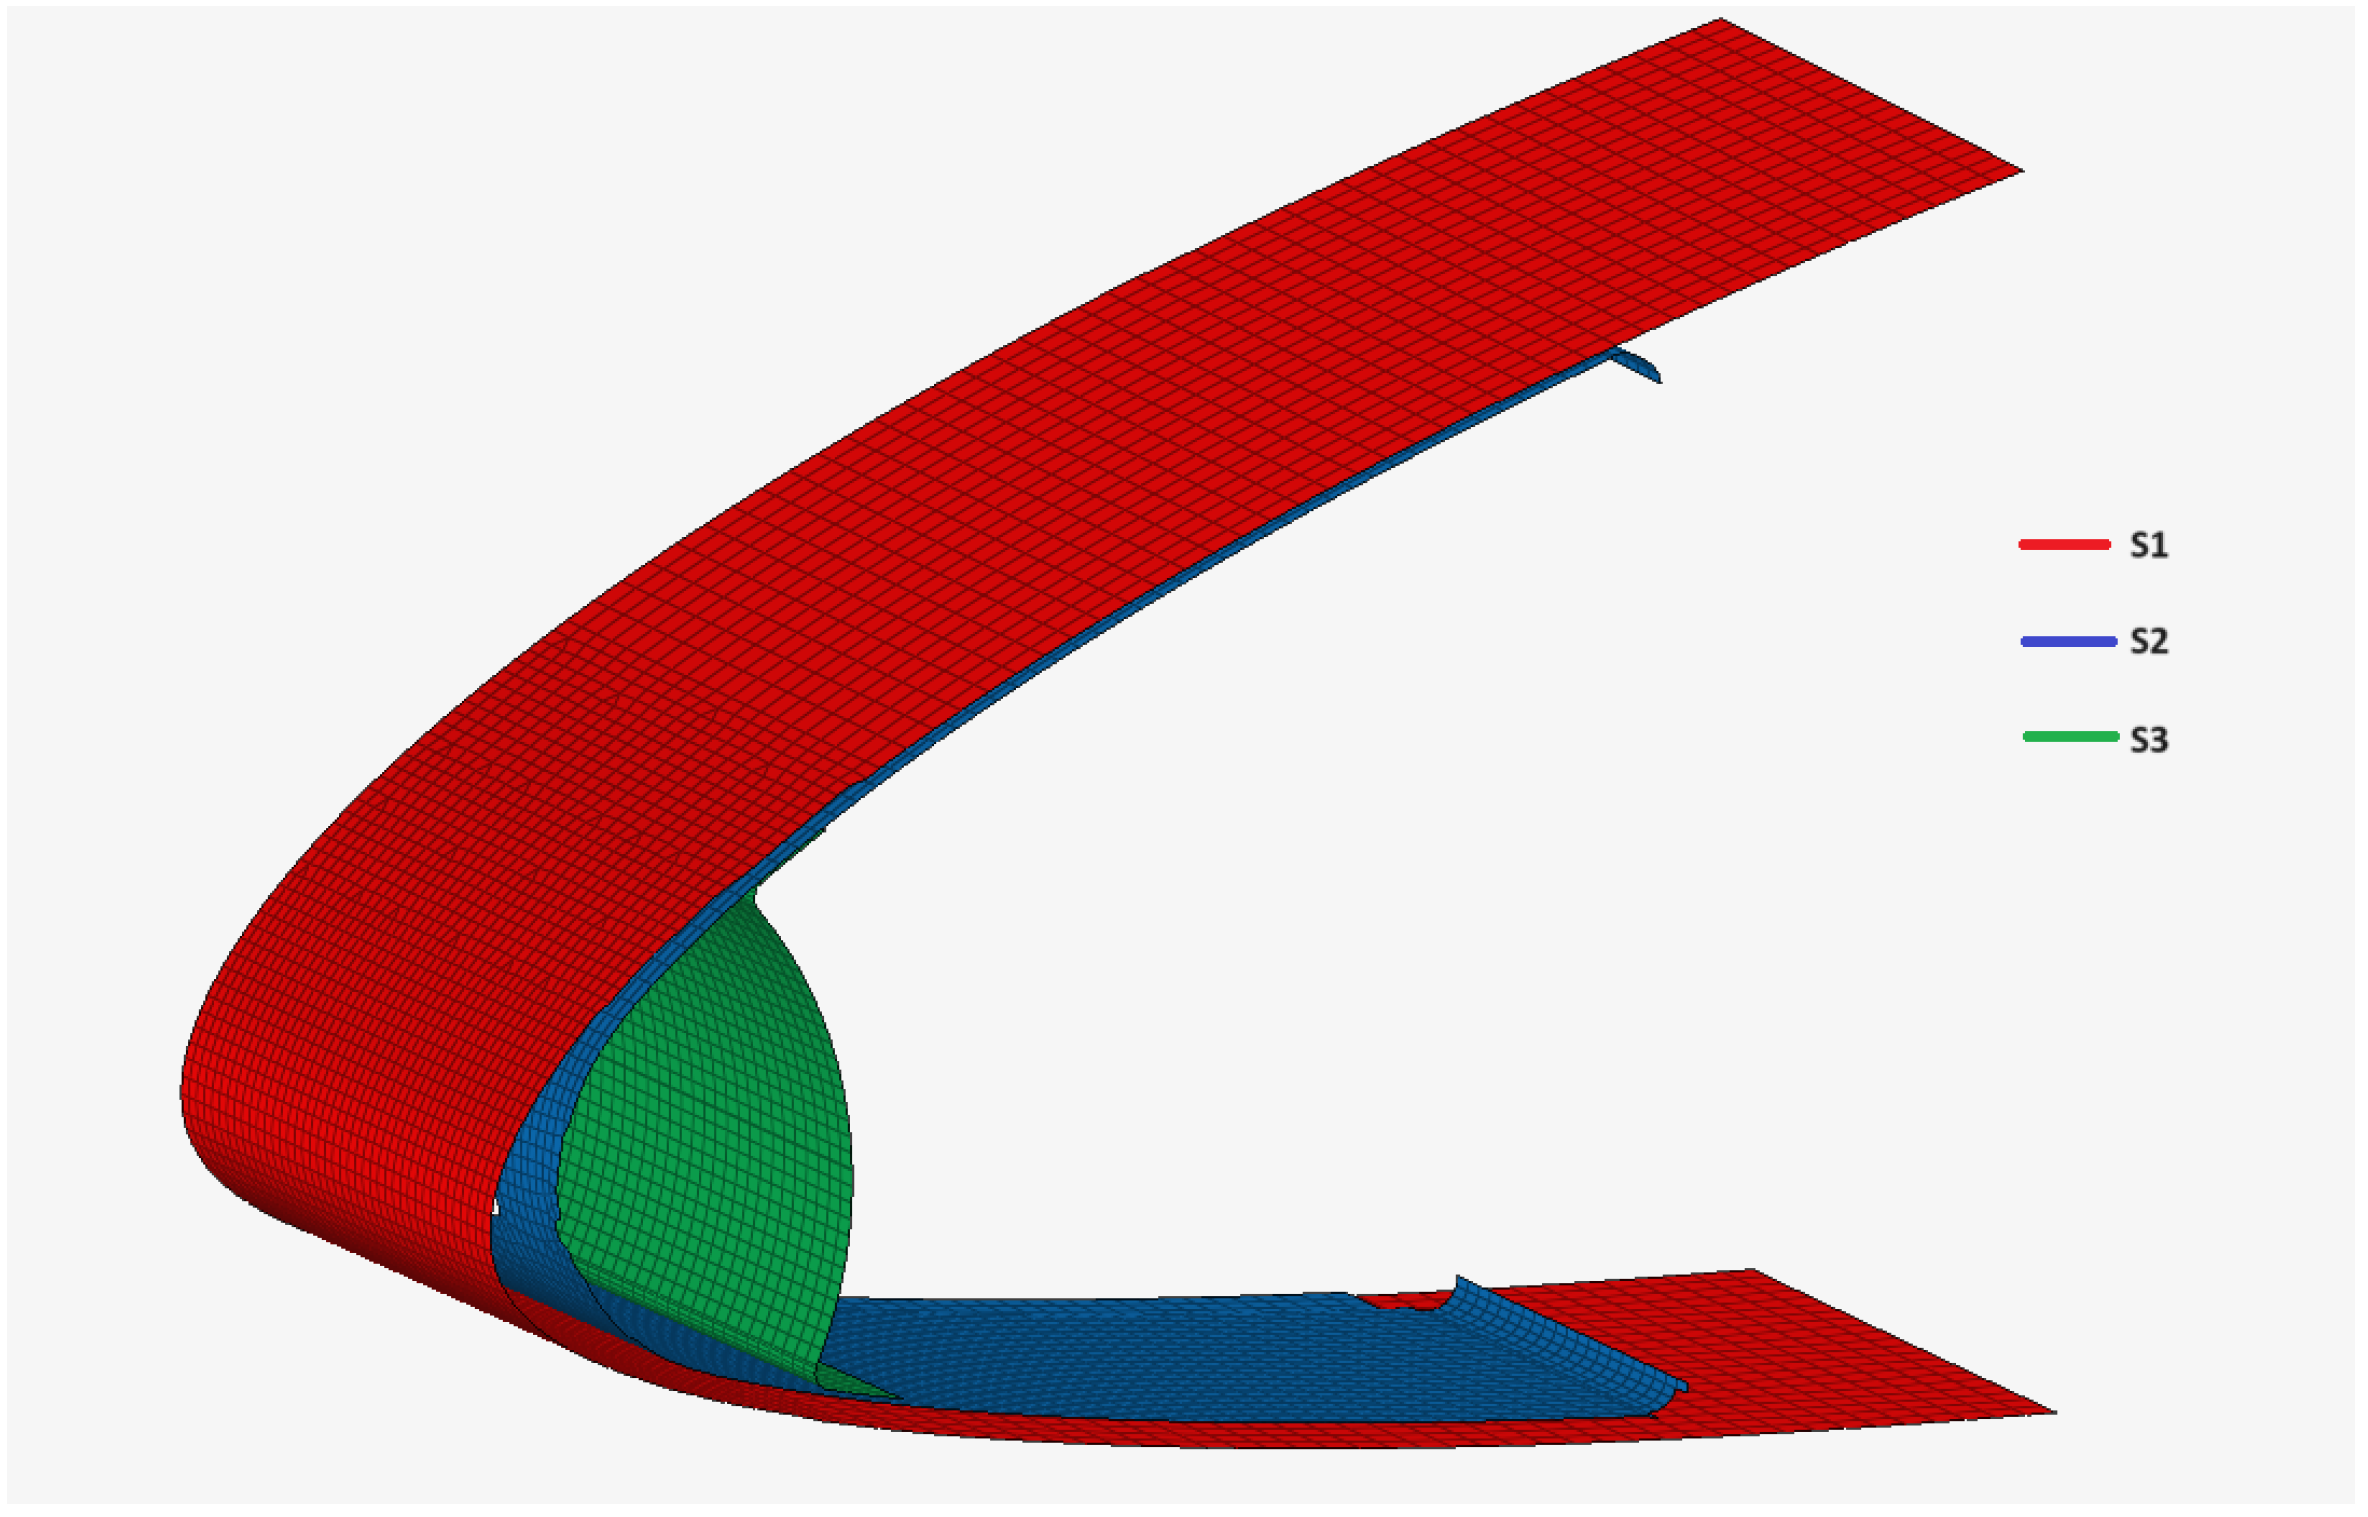
| S1 | S2 | S3 | |
|---|---|---|---|
| Elastic damage | 5 | 5 | 5 |
| Plastic damage | 10 | 15 | 10 |
| Rupture | 15 | 20 | 15 |
| Total | 30 | 40 | 30 |
| 100 | |||
| S1 | S2 | S3 | |||||||||
|---|---|---|---|---|---|---|---|---|---|---|---|
| ϕH (mm) | V (m/s) | α (deg) | Elastic | Plastic | Rupture | Elastic | Plastic | Rupture | Elastic | Plastic | Rupture |
| 10 | 108.6 | −5 | 1 | 0 | 0 | 0 | 0 | 0 | 0 | 0 | 0 |
| 0 | 1 | 0 | 0 | 0 | 0 | 0 | 0 | 0 | 0 | ||
| 5 | 1 | 0 | 0 | 0 | 0 | 0 | 0 | 0 | 0 | ||
| 128.3 | −5 | 1 | 0 | 0 | 0 | 0 | 0 | 0 | 0 | 0 | |
| 0 | 1 | 0 | 0 | 0 | 0 | 0 | 0 | 0 | 0 | ||
| 5 | 1 | 0 | 0 | 0 | 0 | 0 | 0 | 0 | 0 | ||
| 197.5 | −5 | 1 | 0 | 0 | 0 | 0 | 0 | 0 | 0 | 0 | |
| 0 | 1 | 1 | 0 | 0 | 0 | 0 | 0 | 0 | 0 | ||
| 5 | 1 | 1 | 0 | 0 | 0 | 0 | 0 | 0 | 0 | ||
| 25 | 108.6 | −5 | 1 | 1 | 0 | 0 | 0 | 0 | 0 | 0 | 0 |
| 0 | 1 | 1 | 0 | 0 | 0 | 0 | 0 | 0 | 0 | ||
| 5 | 1 | 1 | 0 | 1 | 0 | 0 | 0 | 0 | 0 | ||
| 128.3 | −5 | 1 | 1 | 0 | 0 | 0 | 0 | 0 | 0 | 0 | |
| 0 | 1 | 1 | 0 | 0 | 0 | 0 | 0 | 0 | 0 | ||
| 5 | 1 | 1 | 0 | 1 | 0 | 0 | 0 | 0 | 0 | ||
| 197.5 | −5 | 1 | 1 | 1 | 1 | 1 | 0 | 0 | 0 | 0 | |
| 0 | 1 | 1 | 1 | 1 | 1 | 1 | 1 | 0 | 0 | ||
| 5 | 1 | 1 | 1 | 1 | 1 | 0 | 0 | 0 | 0 | ||
| 40 | 108.6 | −5 | 1 | 1 | 0 | 1 | 1 | 0 | 0 | 0 | 0 |
| 0 | 1 | 1 | 1 | 1 | 1 | 1 | 0 | 0 | 0 | ||
| 5 | 1 | 1 | 0 | 1 | 1 | 0 | 0 | 0 | 0 | ||
| 128.3 | −5 | 1 | 1 | 1 | 1 | 1 | 0 | 0 | 0 | 0 | |
| 0 | 1 | 1 | 1 | 1 | 1 | 1 | 1 | 1 | 0 | ||
| 5 | 1 | 1 | 1 | 1 | 1 | 1 | 1 | 0 | 0 | ||
| 197.5 | −5 | 1 | 1 | 1 | 1 | 1 | 1 | 1 | 1 | ||
| 0 | 1 | 1 | 1 | 1 | 1 | 1 | 1 | 1 | 1 | ||
| 5 | 1 | 1 | 1 | 1 | 1 | 1 | 1 | 1 | 0 | ||
| ϕH (mm) | V (m/s) | A (deg) | Damage |
|---|---|---|---|
| 10 | 108.6 | −5 | 5 |
| 0 | 5 | ||
| 5 | 5 | ||
| 128.3 | −5 | 5 | |
| 0 | 5 | ||
| 5 | 5 | ||
| 197.5 | −5 | 5 | |
| 0 | 15 | ||
| 5 | 15 | ||
| 25 | 108.6 | −5 | 15 |
| 0 | 15 | ||
| 5 | 20 | ||
| 128.3 | −5 | 15 | |
| 0 | 15 | ||
| 5 | 20 | ||
| 197.5 | −5 | 50 | |
| 0 | 75 | ||
| 5 | 50 | ||
| 40 | 108.6 | −5 | 35 |
| 0 | 70 | ||
| 5 | 35 | ||
| 128.3 | −5 | 50 | |
| 0 | 85 | ||
| 5 | 75 | ||
| 197.5 | −5 | 85 | |
| 0 | 100 | ||
| 5 | 85 |
| ϕH | V | α | Kinetic Energy | Internal Energy | Conversion Rate |
|---|---|---|---|---|---|
| 10 | 108.6 | −5 | 2.83 | 0.33 | 0.12 |
| 0 | 2.83 | 0.75 | 0.27 | ||
| 5 | 2.83 | 0.63 | 0.22 | ||
| 128.3 | −5 | 3.95 | 0.46 | 0.12 | |
| 0 | 3.95 | 1.05 | 0.27 | ||
| 5 | 3.95 | 0.86 | 0.22 | ||
| 197.5 | −5 | 9.35 | 1.02 | 0.11 | |
| 0 | 9.35 | 2.62 | 0.28 | ||
| 5 | 9.35 | 2.53 | 0.27 | ||
| 25 | 108.6 | −5 | 44.18 | 16.07 | 0.36 |
| 0 | 44.18 | 7.94 | 0.18 | ||
| 5 | 44.18 | 17.75 | 0.40 | ||
| 128.3 | −5 | 61.68 | 12.66 | 0.21 | |
| 0 | 61.68 | 29.19 | 0.47 | ||
| 5 | 61.68 | 25.65 | 0.42 | ||
| 197.5 | −5 | 146.08 | 43.23 | 0.30 | |
| 0 | 146.08 | 84.72 | 0.58 | ||
| 5 | 146.08 | 77.61 | 0.53 | ||
| 40 | 108.6 | −5 | 180.96 | 44.89 | 0.25 |
| 0 | 180.96 | 102.24 | 0.57 | ||
| 5 | 180.96 | 91.82 | 0.51 | ||
| 128.3 | −5 | 252.64 | 75.94 | 0.30 | |
| 0 | 252.64 | 130.71 | 0.52 | ||
| 5 | 252.64 | 153.97 | 0.61 | ||
| 197.5 | −5 | 598.35 | 215.69 | 0.36 | |
| 0 | 598.35 | 221.94 | 0.37 | ||
| 5 | 598.35 | 239.46 | 0.40 |
Disclaimer/Publisher’s Note: The statements, opinions and data contained in all publications are solely those of the individual author(s) and contributor(s) and not of MDPI and/or the editor(s). MDPI and/or the editor(s) disclaim responsibility for any injury to people or property resulting from any ideas, methods, instructions or products referred to in the content. |
© 2024 by the authors. Licensee MDPI, Basel, Switzerland. This article is an open access article distributed under the terms and conditions of the Creative Commons Attribution (CC BY) license (https://creativecommons.org/licenses/by/4.0/).
Share and Cite
Ferro, C.G.; Cellini, A.; Maggiore, P. Structural Damage Assessment of an Airfoil Anti-Icing System under Hailstorm Conditions. Aerospace 2024, 11, 520. https://doi.org/10.3390/aerospace11070520
Ferro CG, Cellini A, Maggiore P. Structural Damage Assessment of an Airfoil Anti-Icing System under Hailstorm Conditions. Aerospace. 2024; 11(7):520. https://doi.org/10.3390/aerospace11070520
Chicago/Turabian StyleFerro, Carlo Giovanni, Alessandro Cellini, and Paolo Maggiore. 2024. "Structural Damage Assessment of an Airfoil Anti-Icing System under Hailstorm Conditions" Aerospace 11, no. 7: 520. https://doi.org/10.3390/aerospace11070520