
Effect of Multicoaxial Injectors on Nitrogen Film Cooling in a GCH4/GO2 Thrust Chamber for Small-Scale Methane Rocket Engines: A CFD Study


Abstract
:1. Introduction
2. Computational Setup
2.1. Injector, Combustor, and Nozzle Configuration
2.2. Injector Configuration
2.2.1. SR5 Base Case Configuration
2.2.2. Single-Row (SR) Configuration of Multiple Injectors
2.2.3. Multiple-Row (MR) Configuration of Multiple Injectors
2.3. Numerical Method
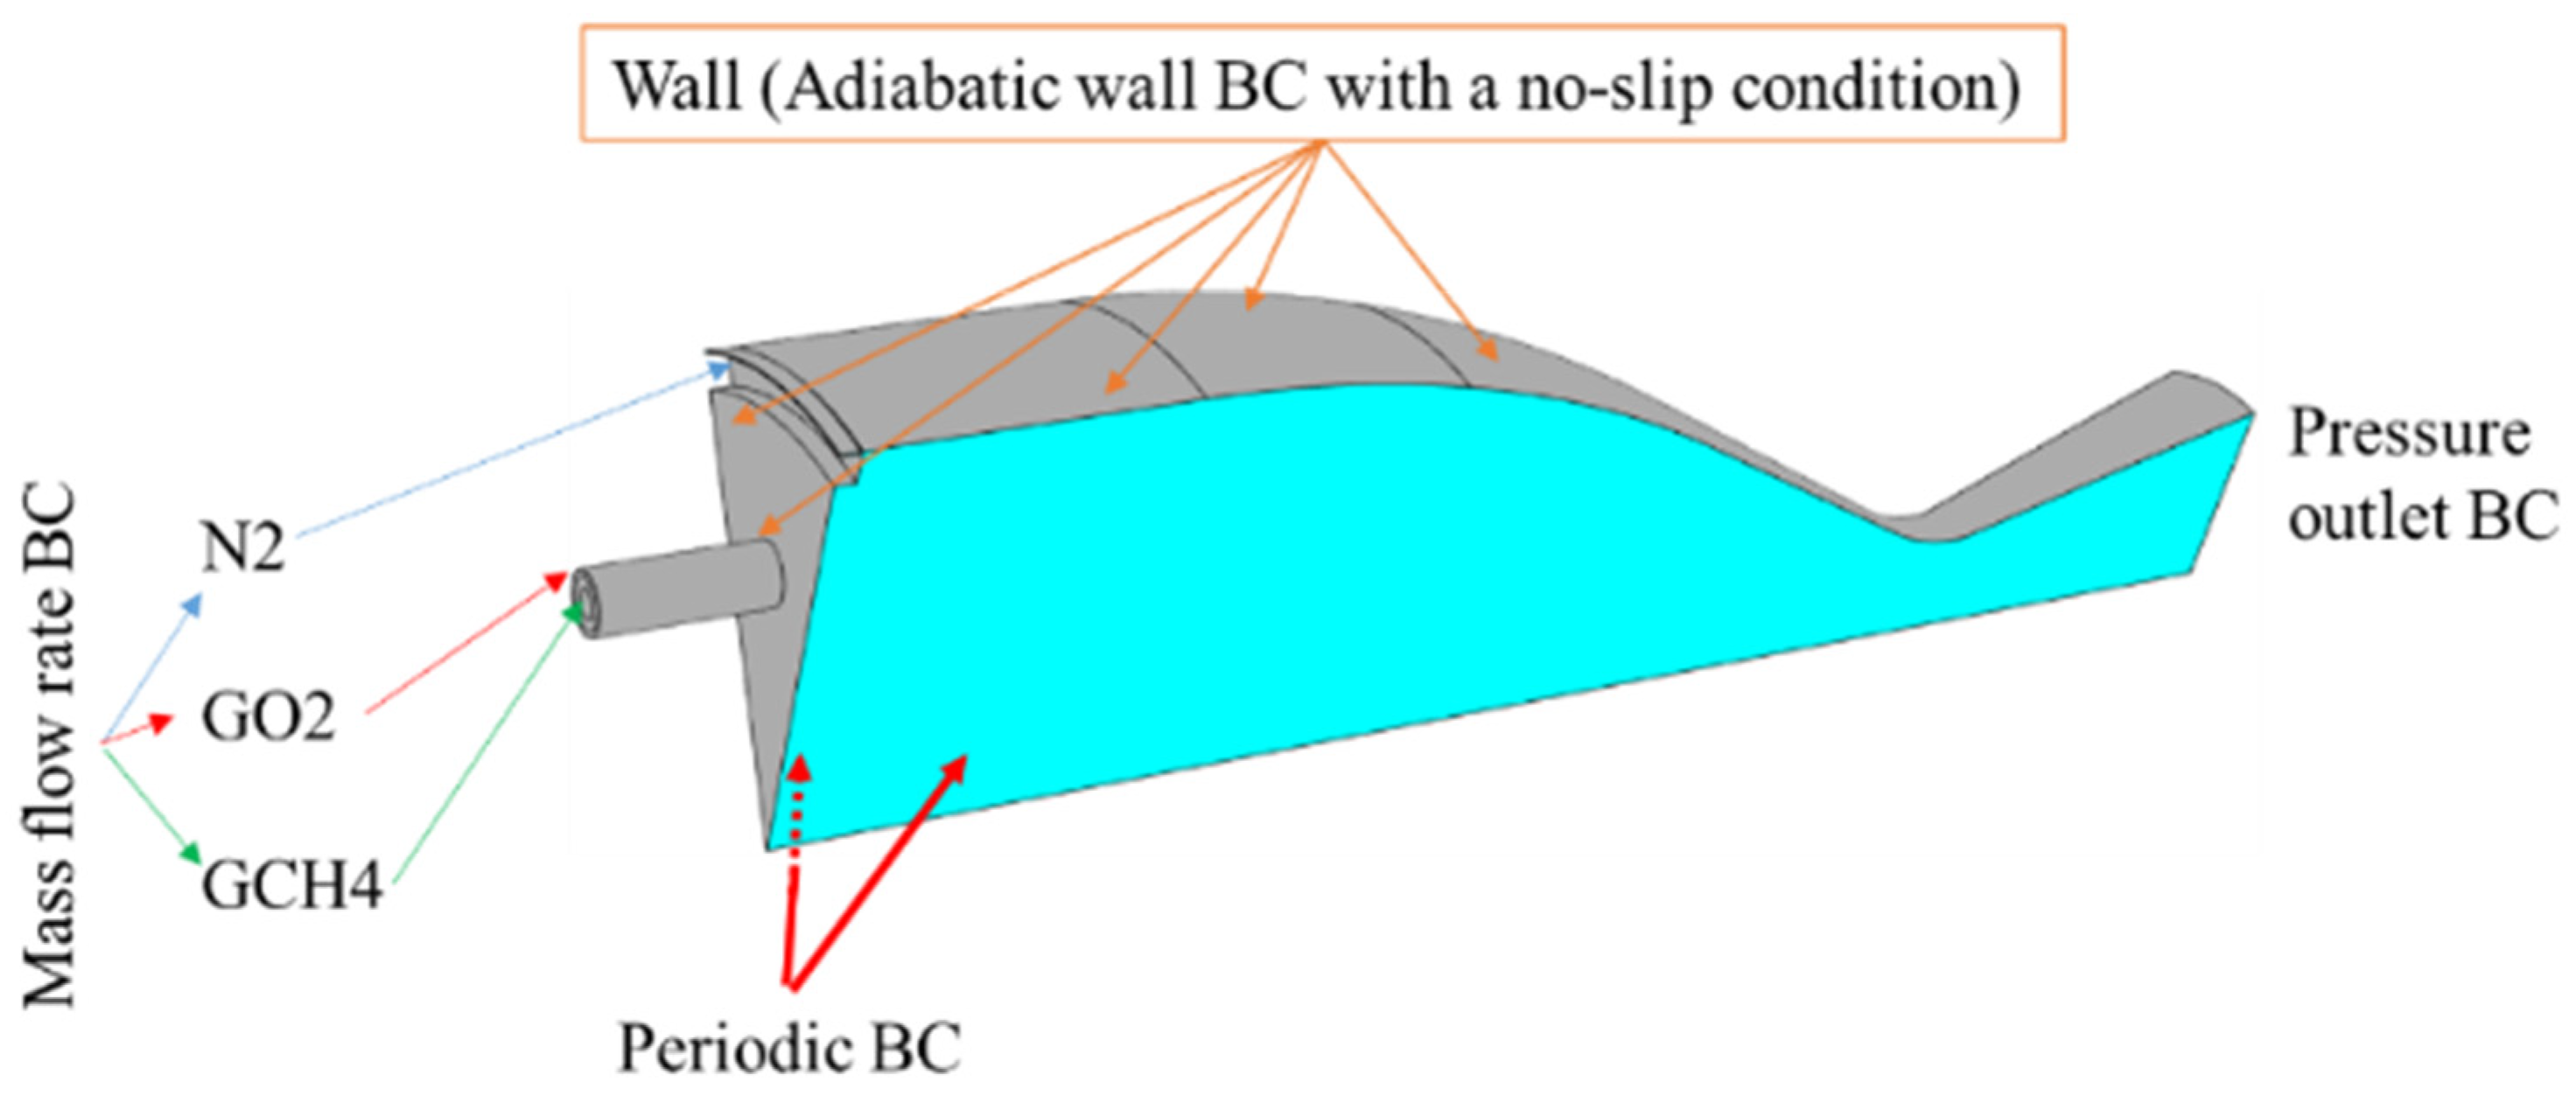
2.3.1. Computational Domain and Setup
2.3.2. Species Transport Model
2.3.3. Numerical Validation
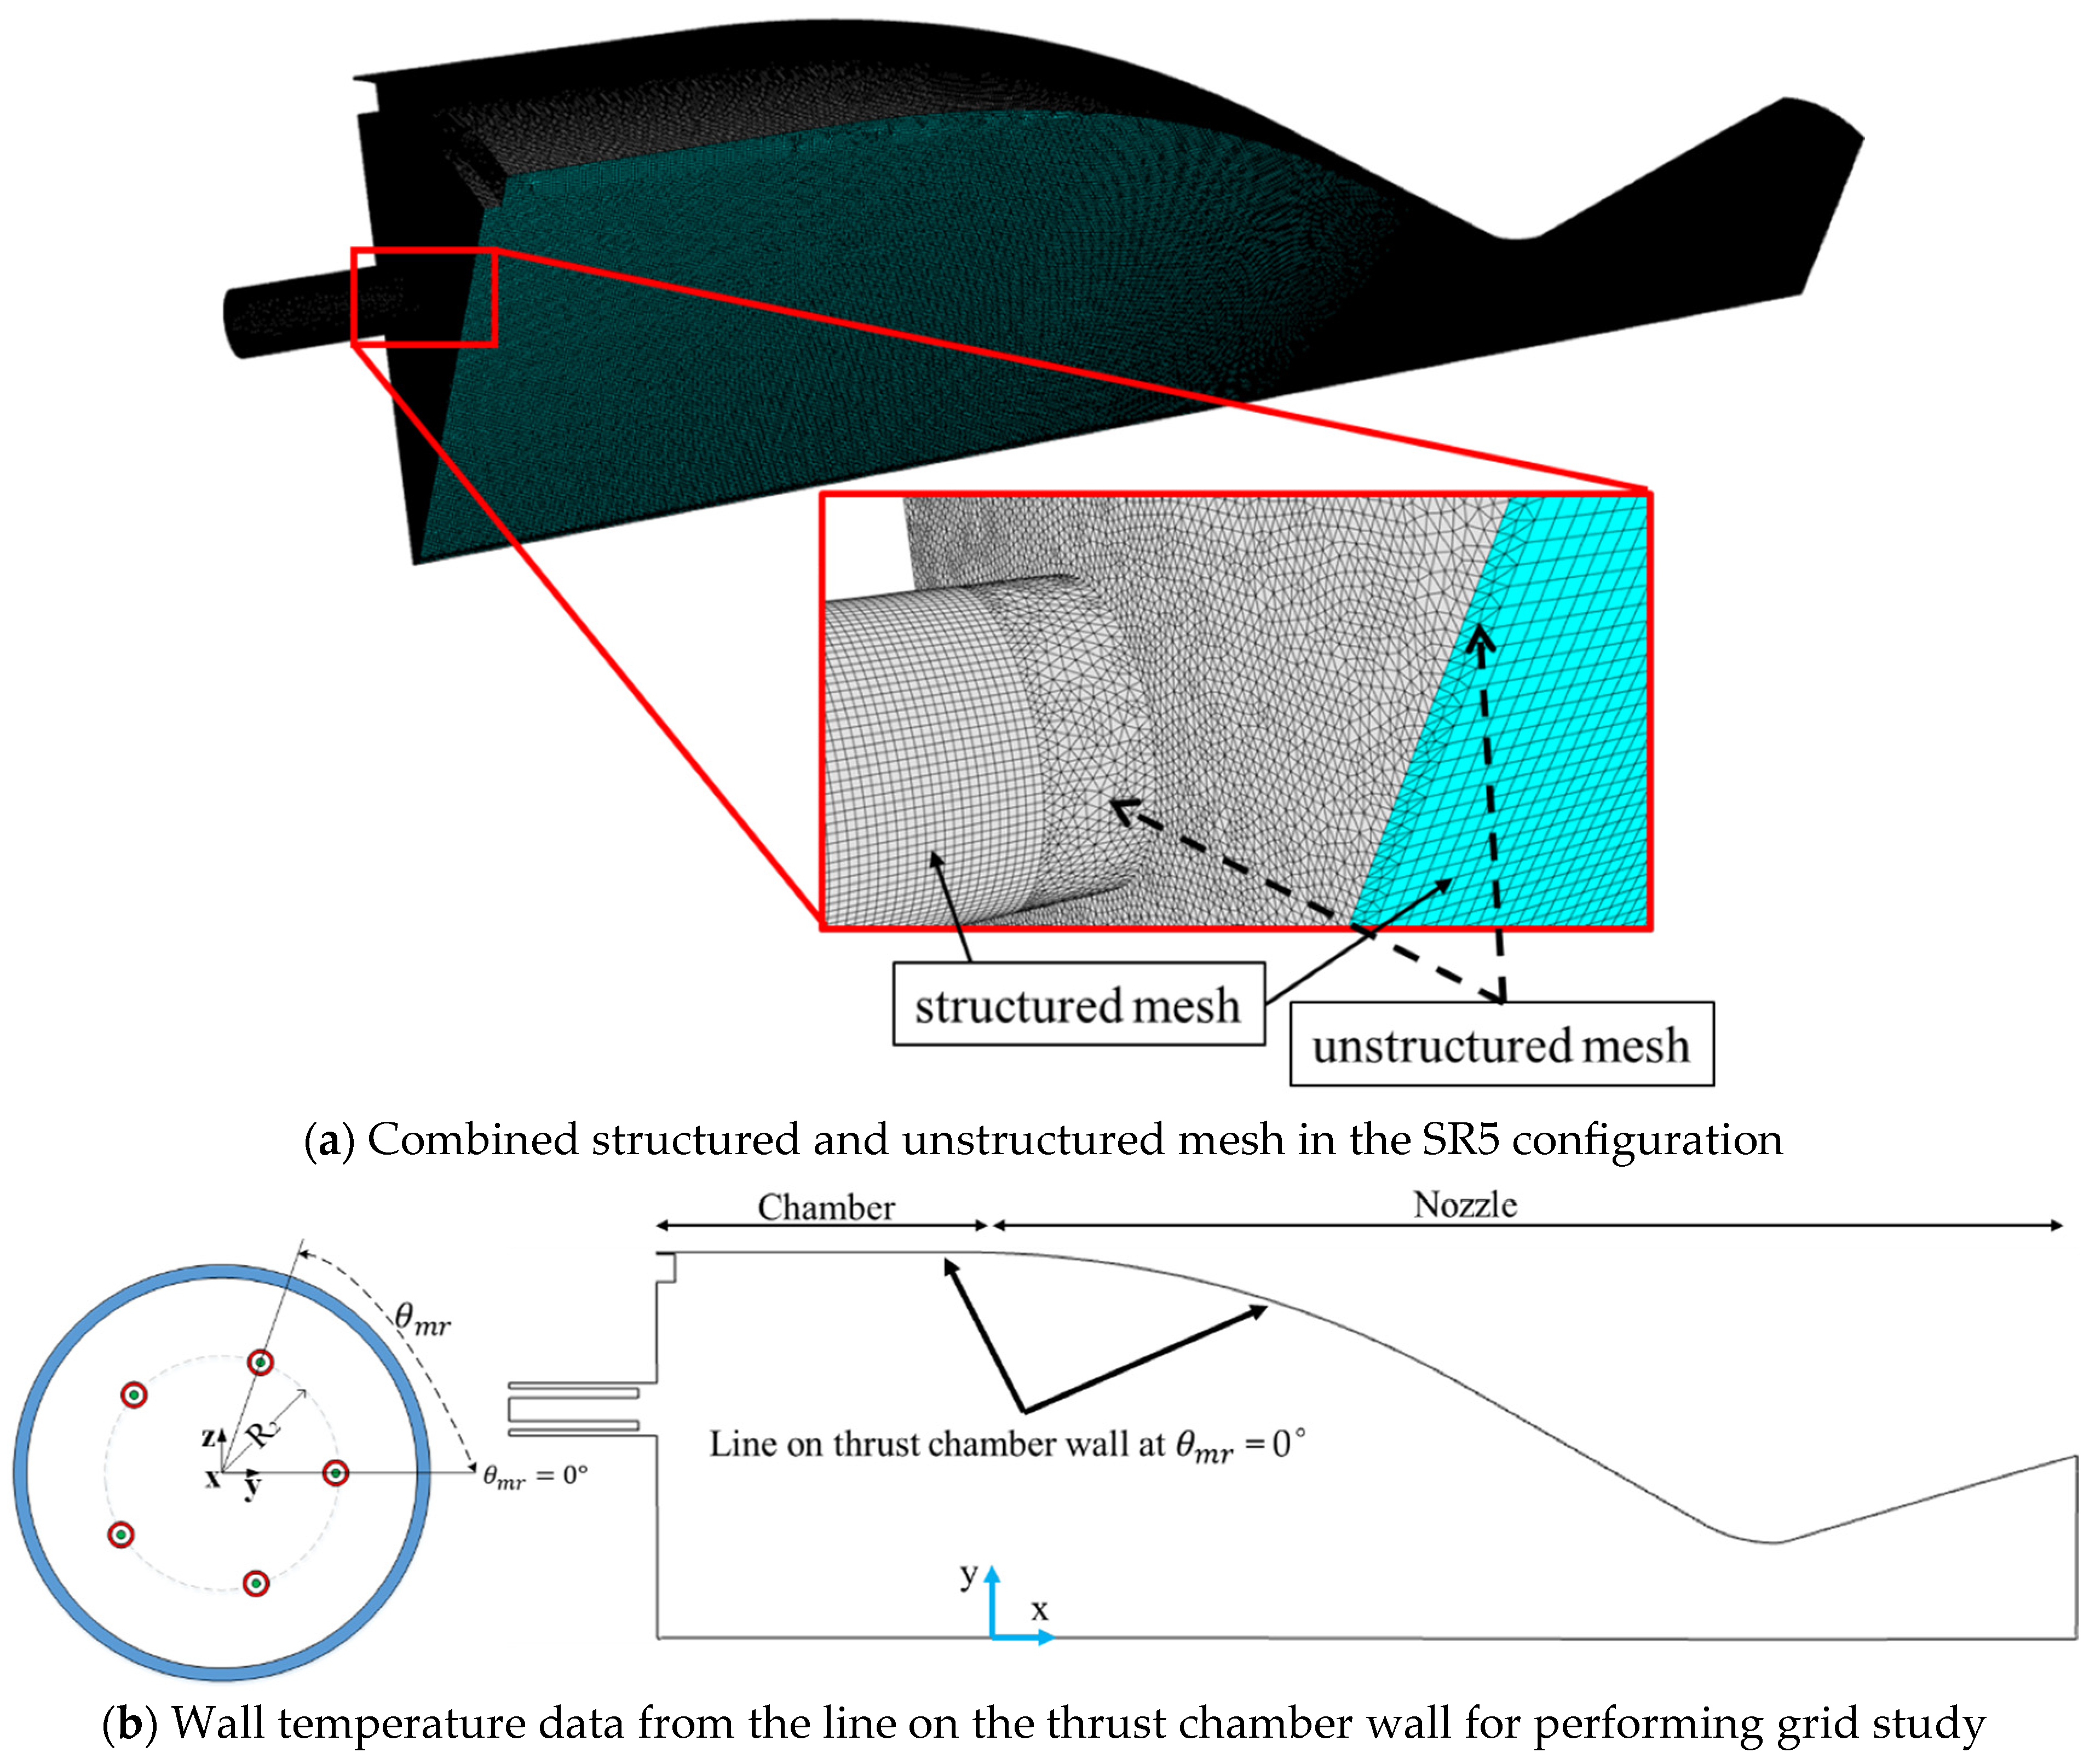
2.3.4. Grid Independent Study
2.3.5. Performance Analysis Method
3. Results and Discussion
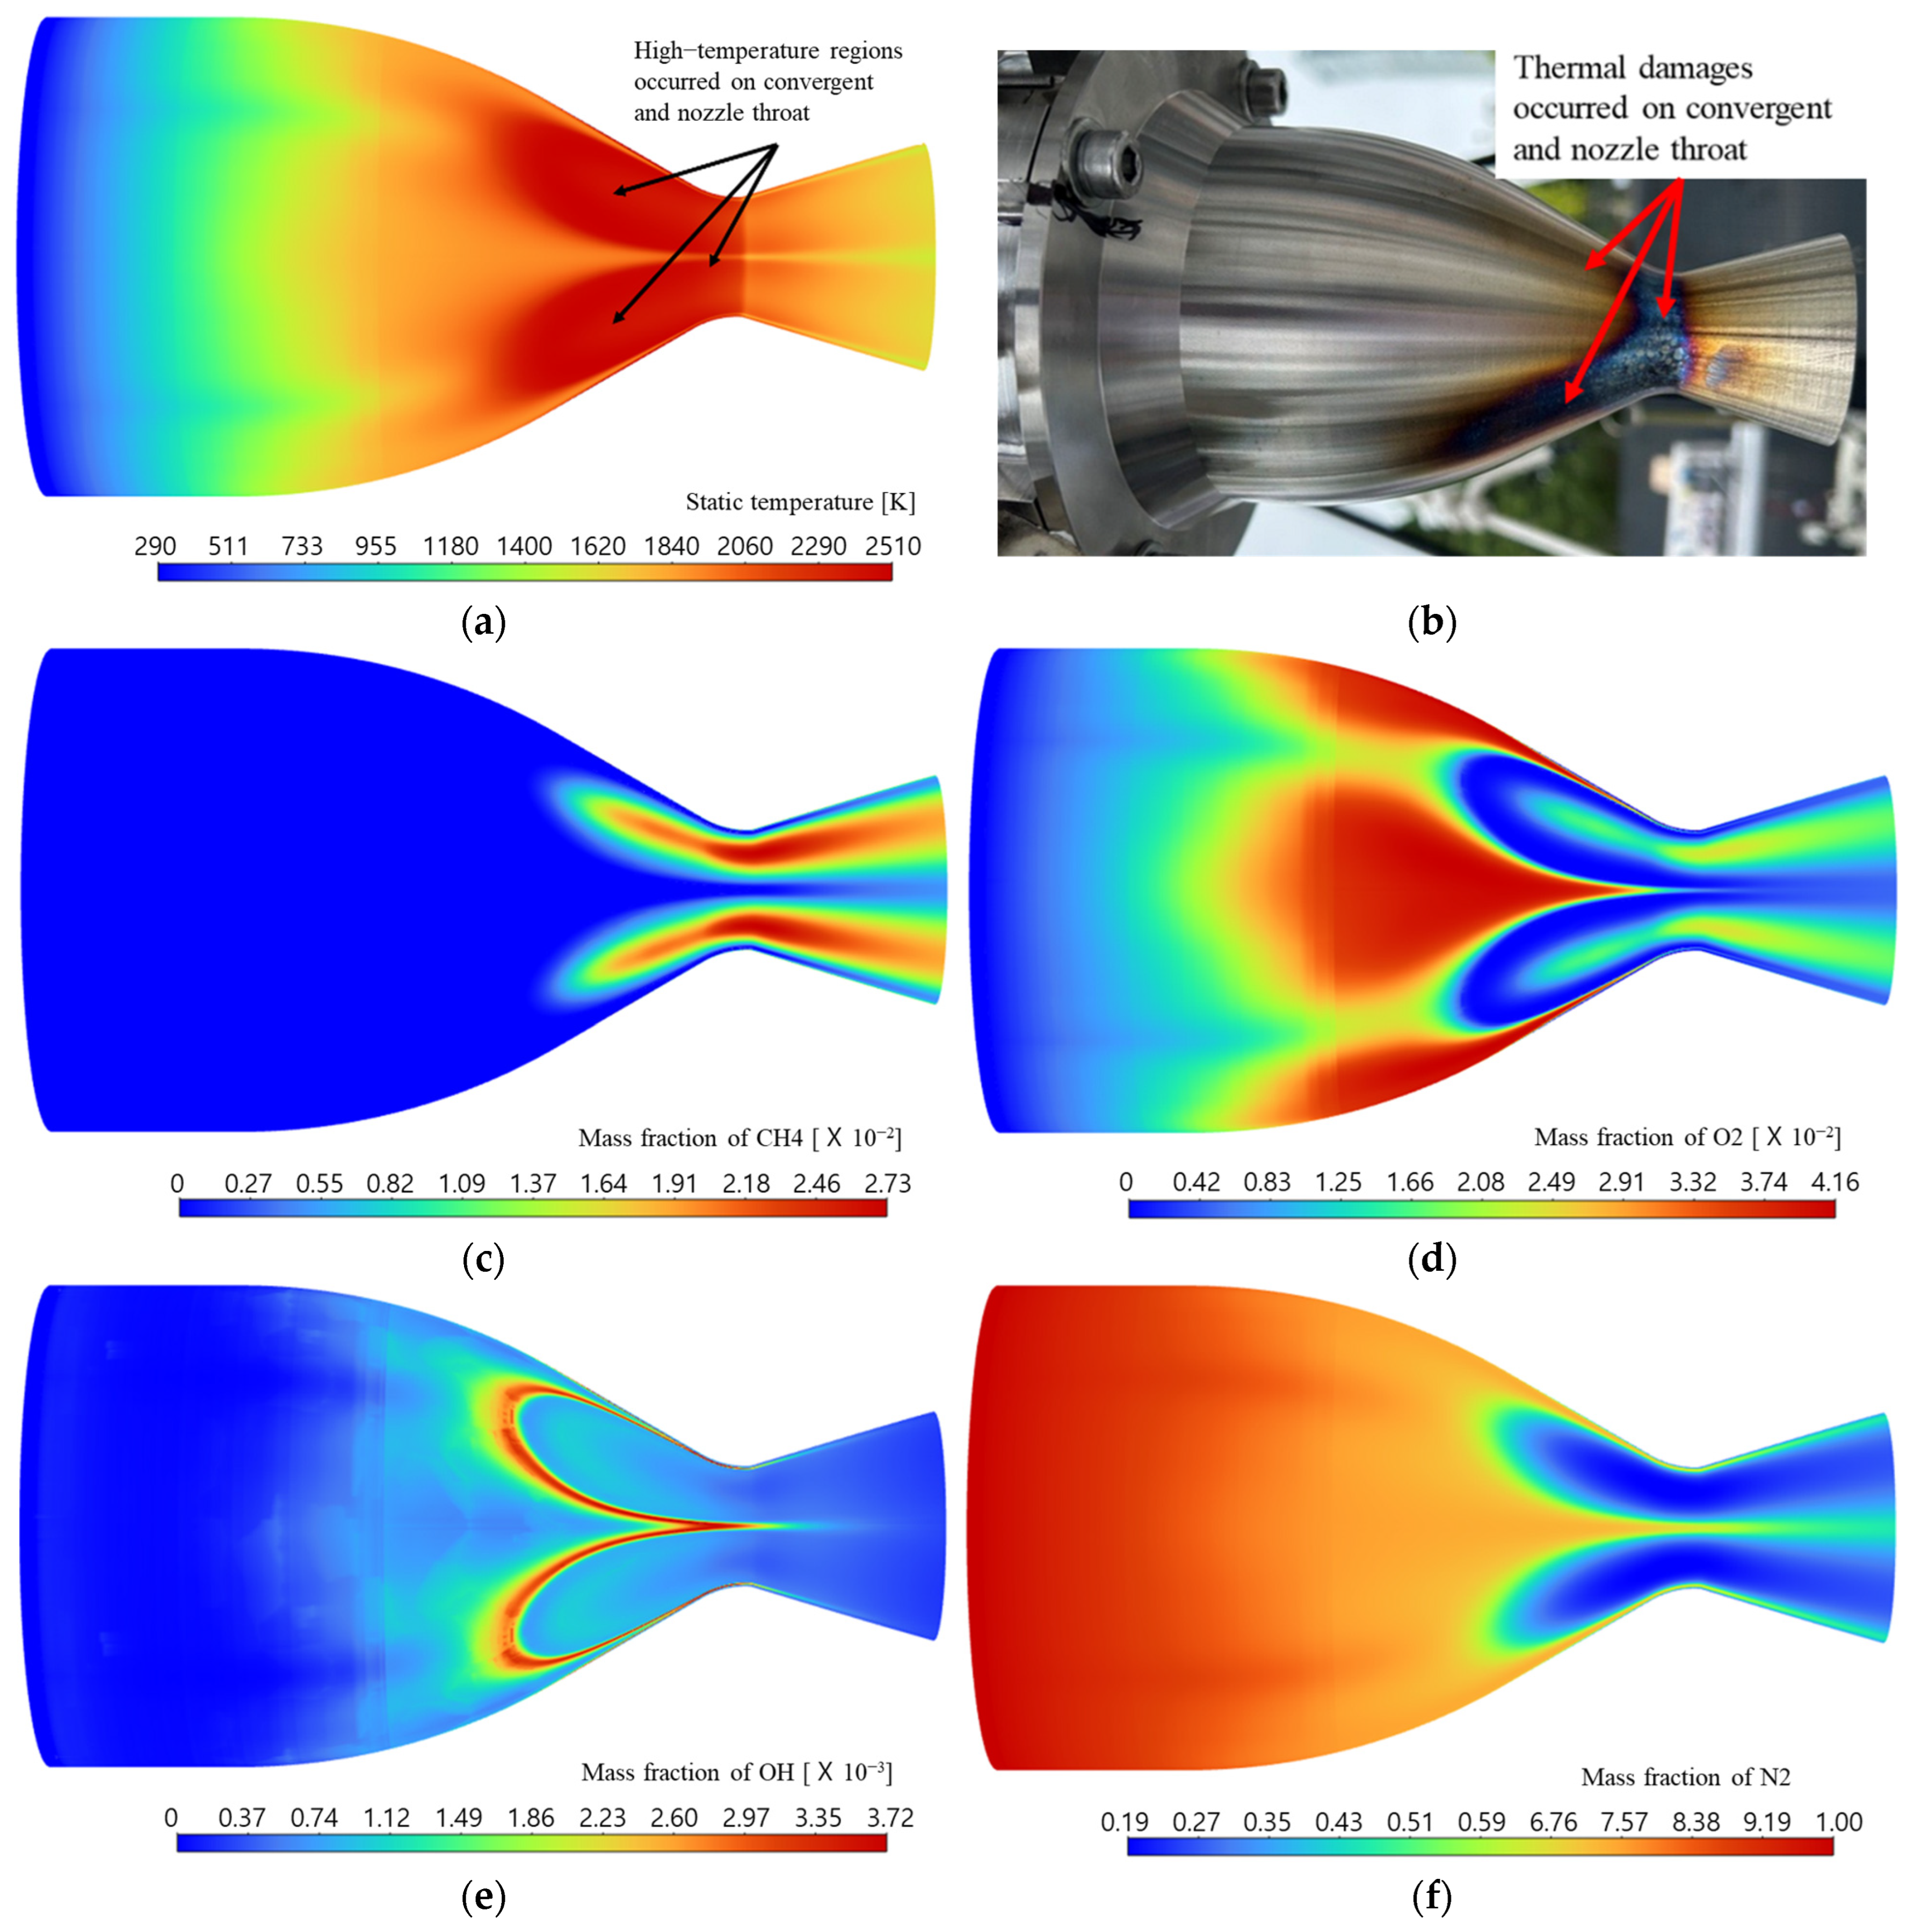
3.1. Investigation into Nitrogen Film Cooling in the SR5 Configuration
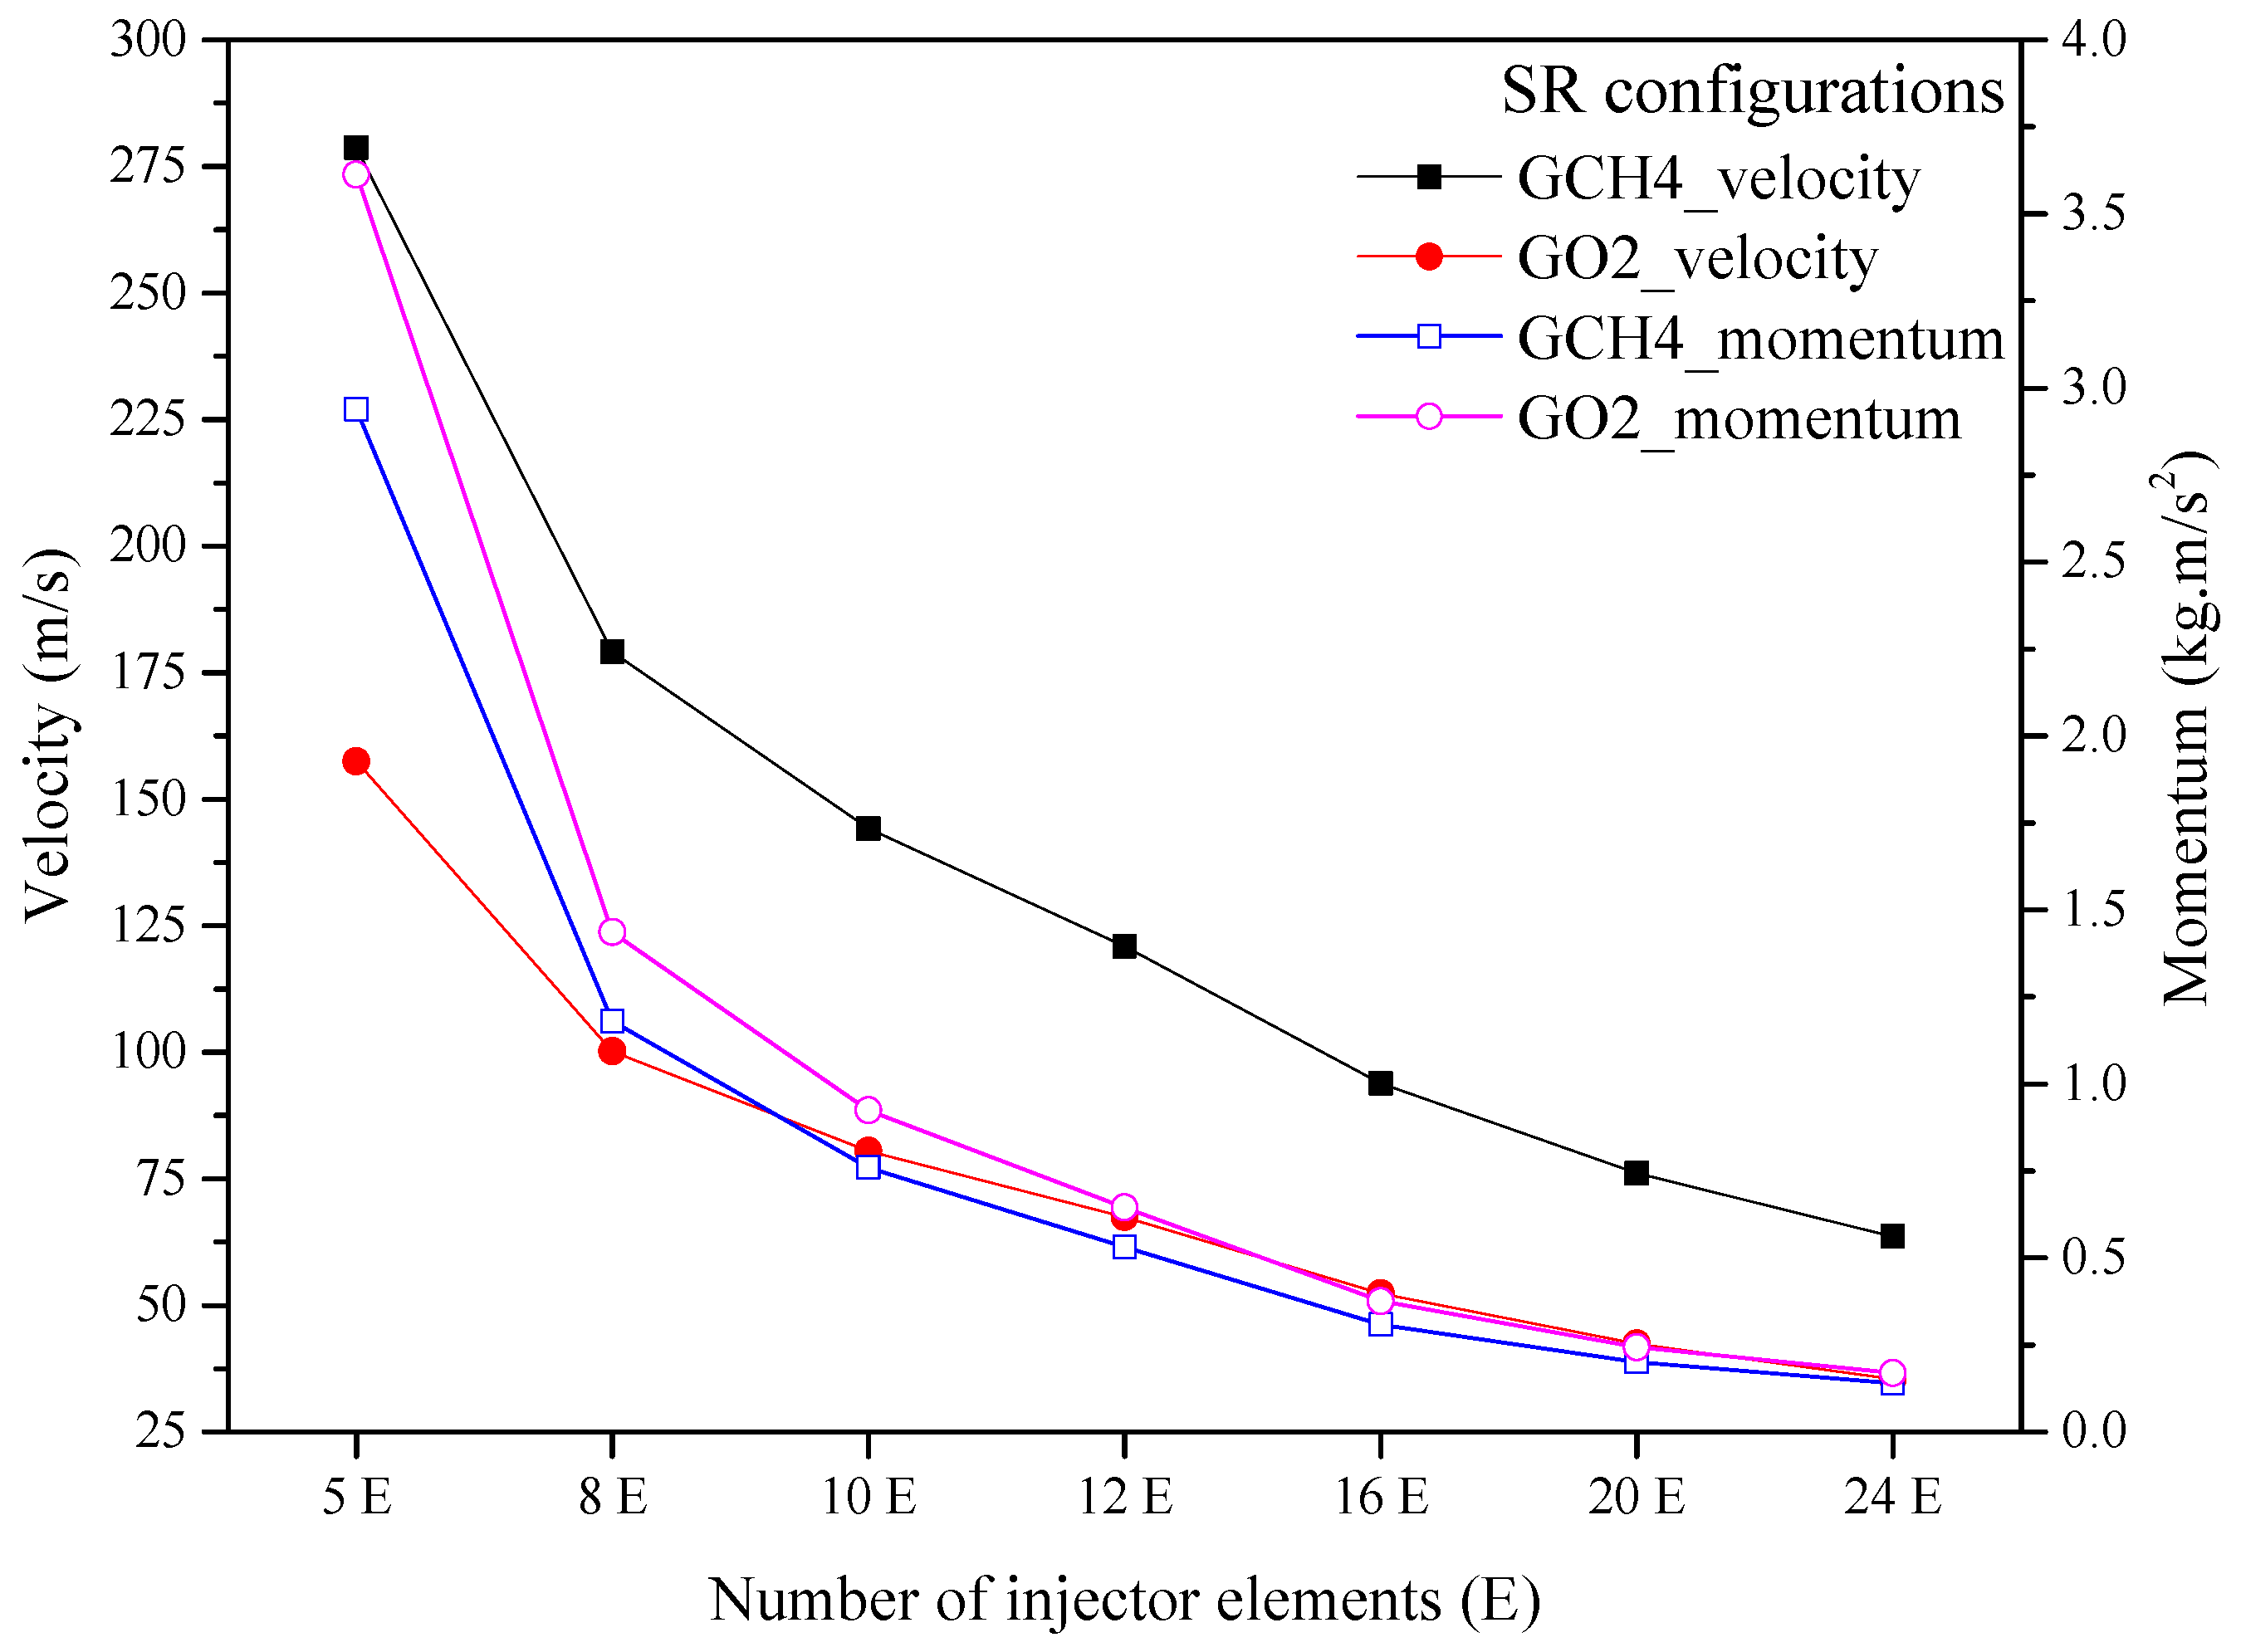
3.2. Effect of Injectors in SR Configurations
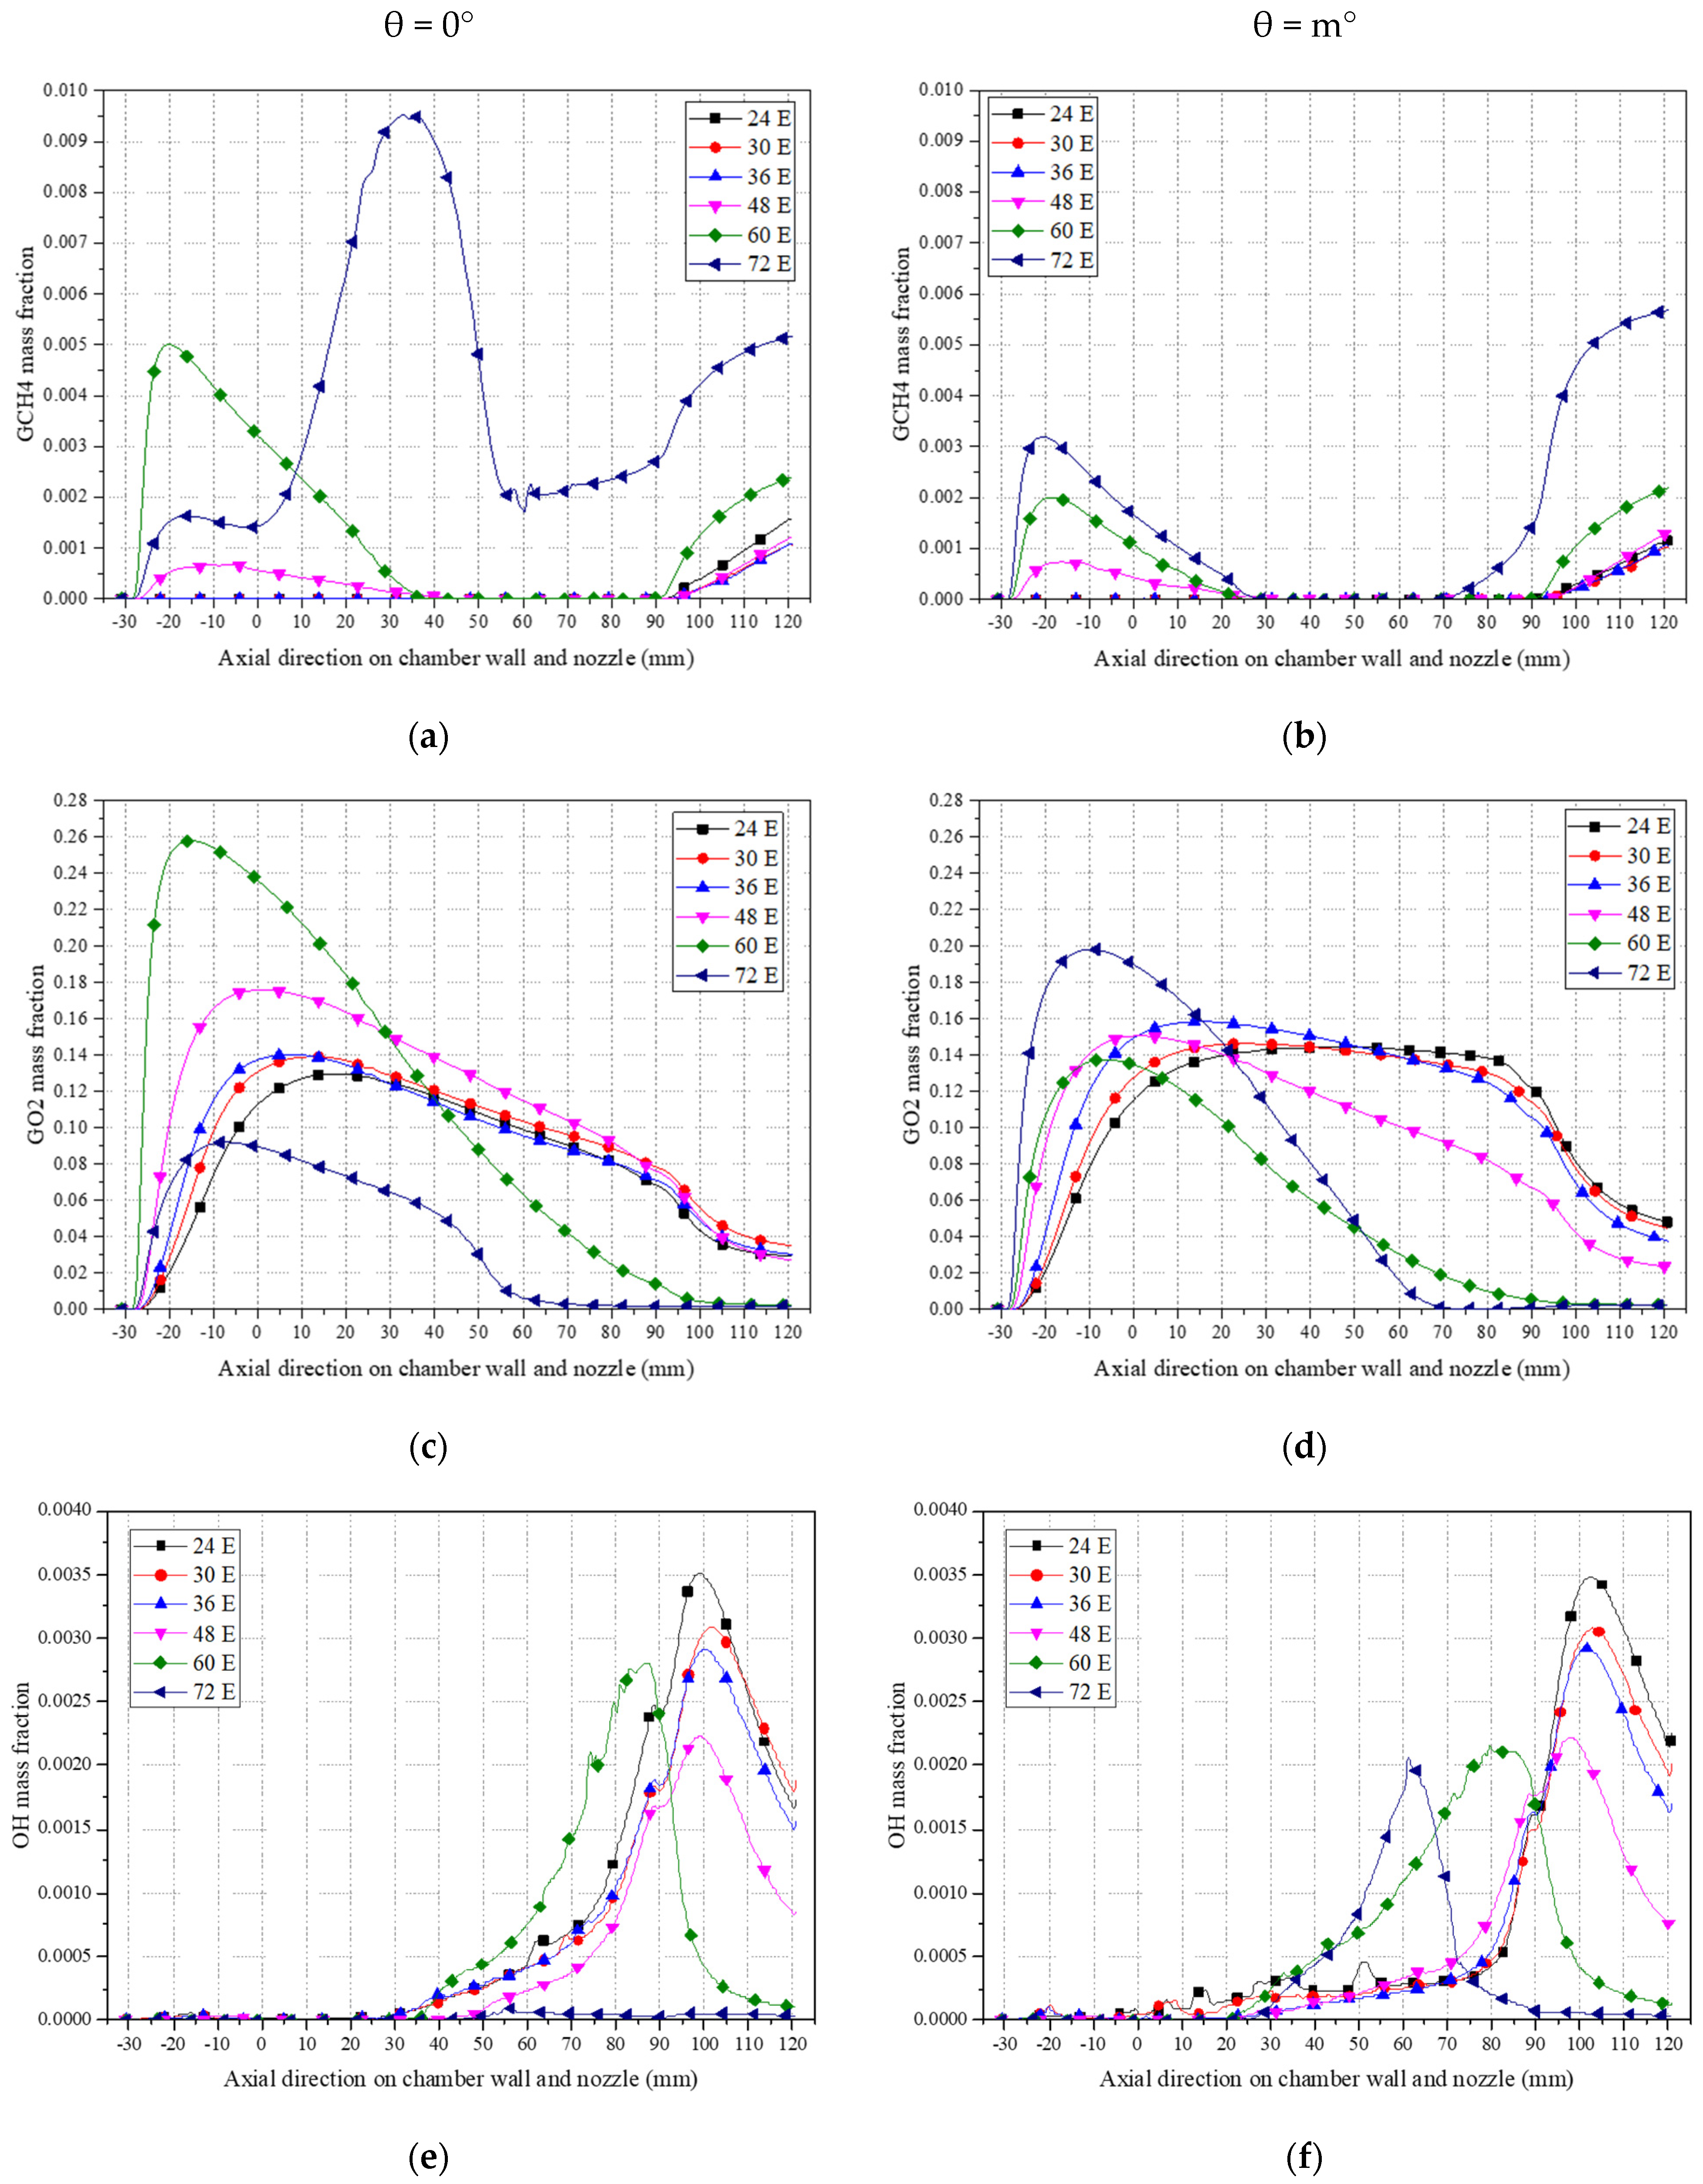
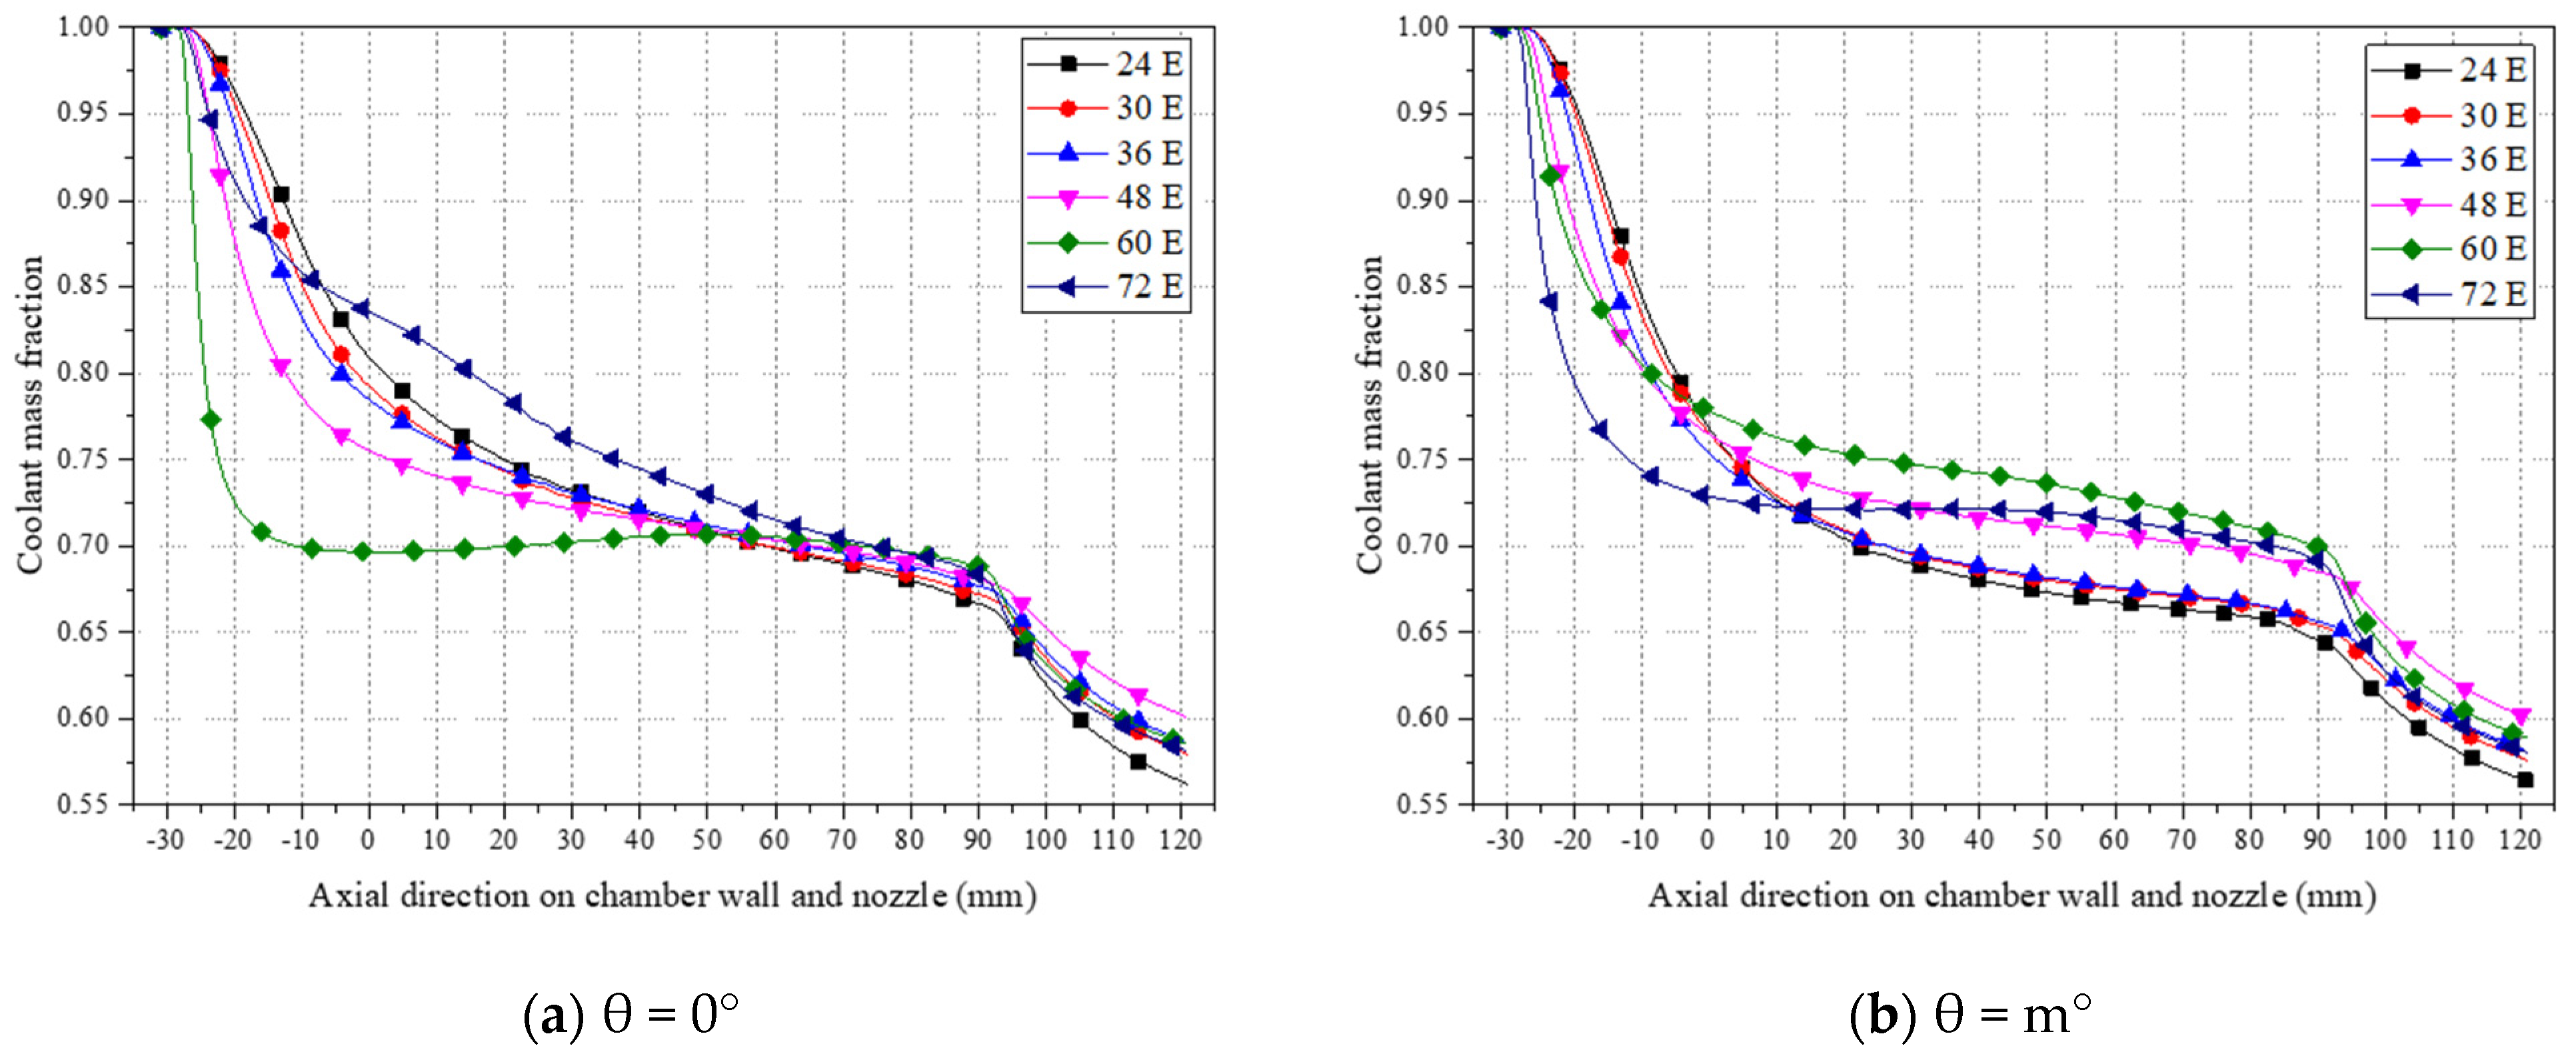
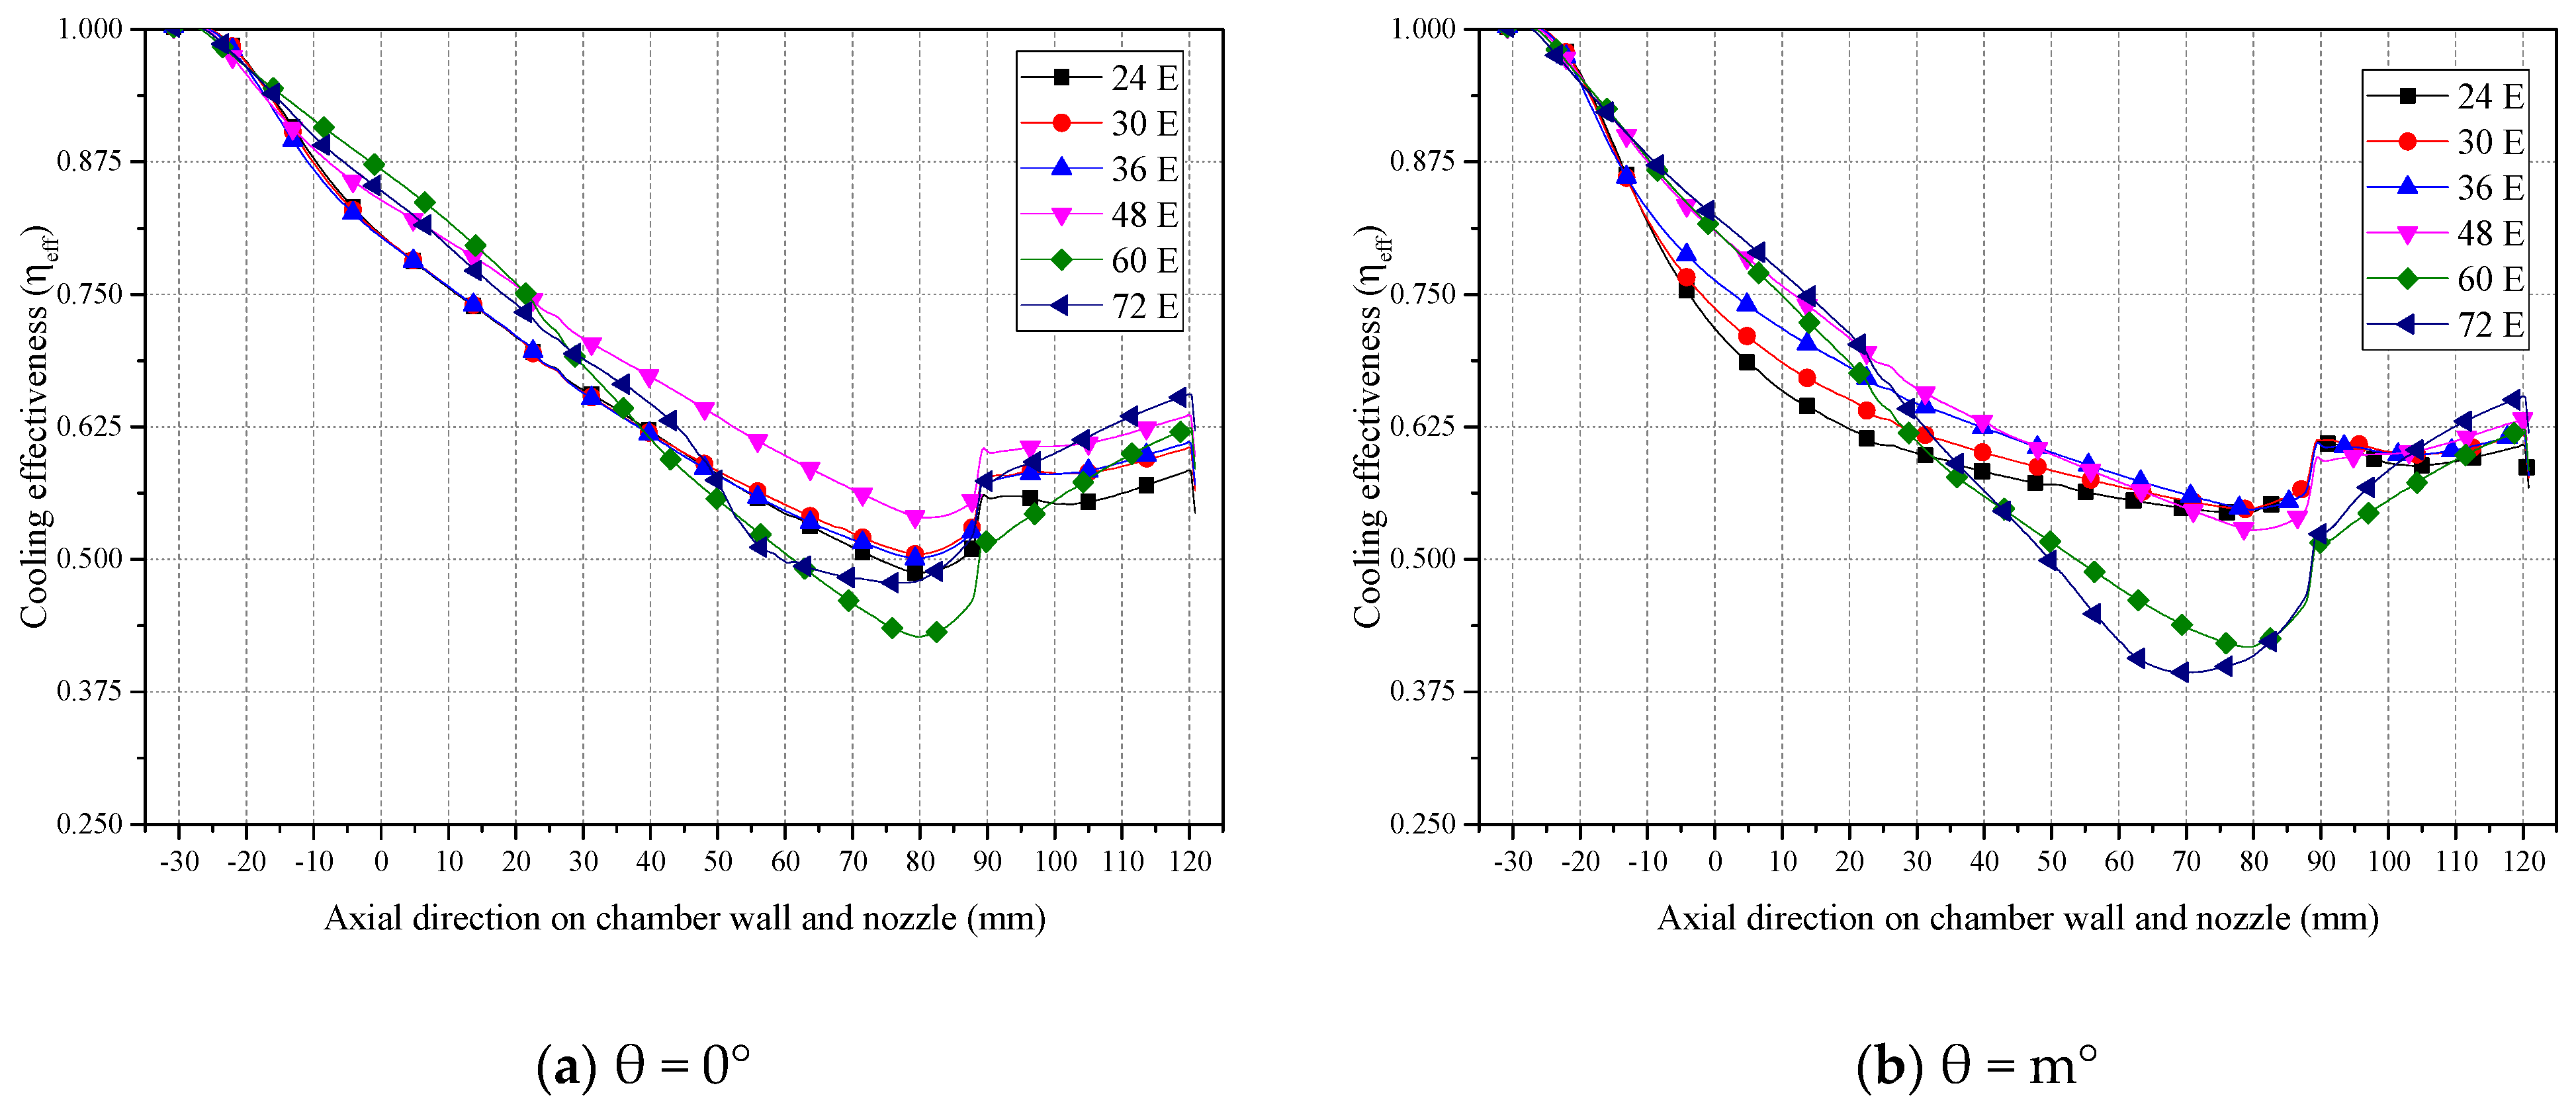
3.3. Effect of Injectors in MR Configurations
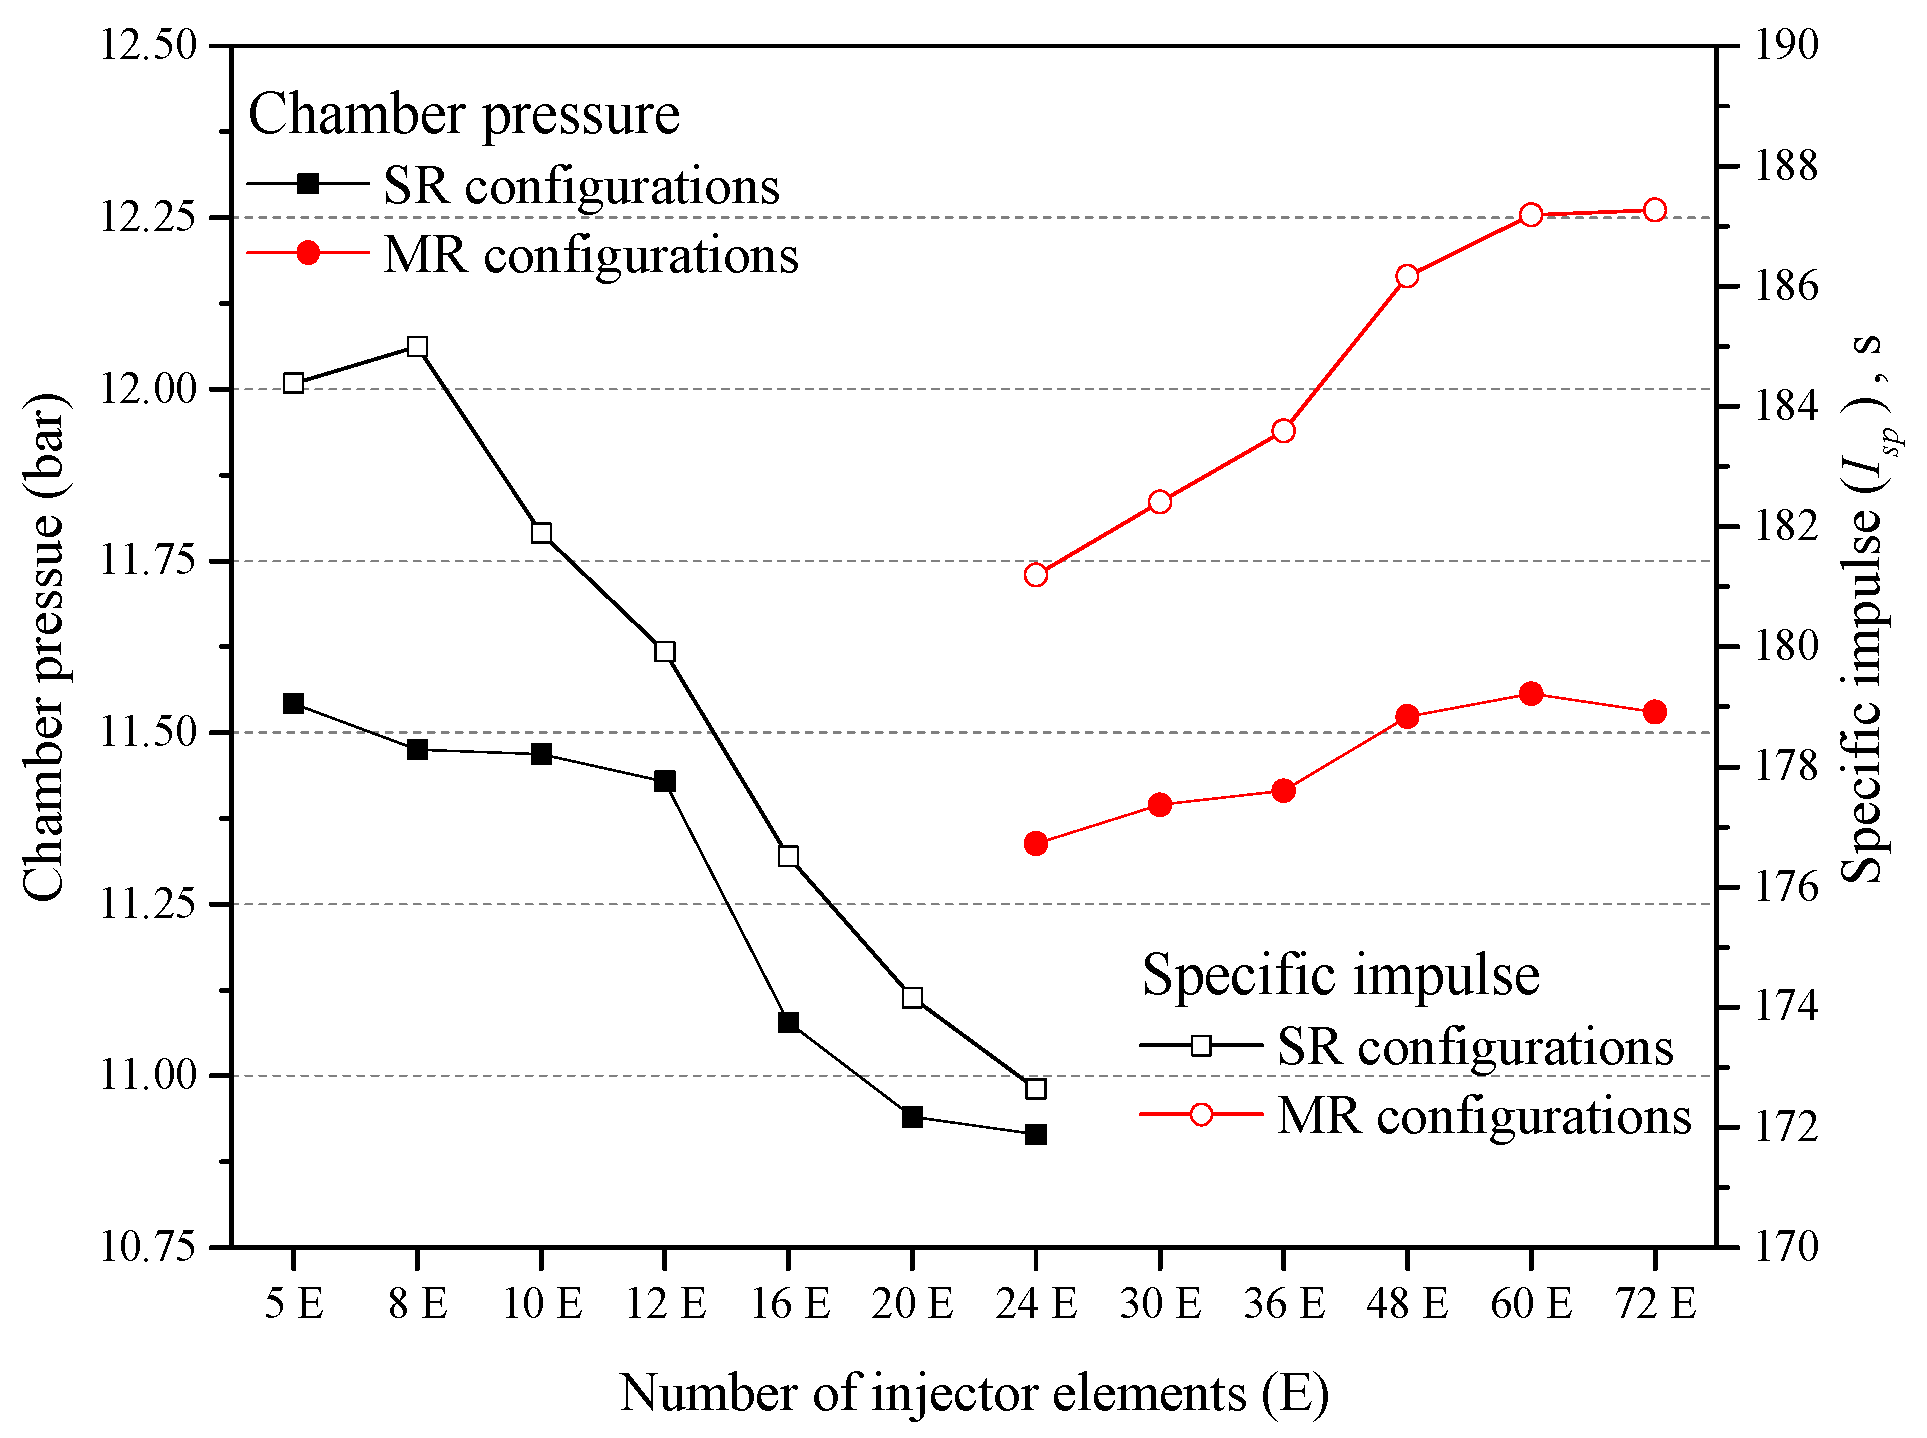
3.4. Performance Analysis
4. Conclusions
- SR configurations (SR5, SR8, SR10, SR12, SR16, SR20, and SR24).
- 2.
- MR configurations (MR24, MR30E, MR36, MR48, MR60, and MR72).
Author Contributions
Funding
Data Availability Statement
Conflicts of Interest
References
- Huzel, D.K.; Huang, D.H. Design of thrust chambers and other combustion devices. In Modern Engineering for Design of Liquid-Propellant Rocket Engine; AIAA: Washington, DC, USA, 1992; Volume 147, pp. 67–133. [Google Scholar]
- Shine, S.R.; Nidhi, S.S. Review on film cooling of liquid rocket engines. Propuls. Power Res. 2018, 7, 1–18. [Google Scholar] [CrossRef]
- Yang, W.; Sun, B. Numerical simulation of liquid film and regenerative cooling in a liquid rocket. Appl. Therm. Eng. 2013, 54, 460–469. [Google Scholar] [CrossRef]
- Zuo, J.; Zhang, S.; Qin, J.; Bao, W.; Cui, N. Performance evaluation of regenerative cooling/film cooling for hydrocarbon fueled scramjet engine. Acta Astronaut. 2019, 148, 57–68. [Google Scholar] [CrossRef]
- Concio, P. Heat Transfer Modelling and Analysis of Oxygen/Methane Uncooled and Film-Cooled Liquid Rocket Engines. Ph.D. Thesis, Sapienza University of Roma, Rome, Italy, 23 January 2023. [Google Scholar]
- Pizzarelli, M.; Battista, F. Oxygen-methane rocket thrust chambers: Review of heat transfer experimental studies. Acta Astronaut. 2023, 209, 48–66. [Google Scholar] [CrossRef]
- Daimon, Y.; Negishi, H.; Koshi, M.; Suslov, D. Numerical and experimental investigation of the methane film cooling in subscale combustion chamber. Prog. Propuls. Phys. 2016, 8, 129–144. [Google Scholar]
- Celano, M.P.; Silvestri, S.; Kirchberger, C.; Schlieben, G.; Suslov, D.I.; Haidn, O.J. Gaseous Film Cooling Investigation in a Model Single Element GCH4-GOX Combustion Chamber. Trans. Jpn. Soc. Aeronaut. Space Sci. 2016, 14, 129–137. [Google Scholar] [CrossRef] [PubMed]
- Daimon, Y.; Negishi, H.; Kawashima, H. Film cooling performance analysis of a full-scale liquid rocket engine combustion chamber based on a coupled combustion and heat transfer simulation. In Proceedings of the 53rd AIAA/SAE/ASEE Joint Propulsion Conference, Atlanta, GA, USA, 10–12 July 2017. AIAA Paper 2017-4919. [Google Scholar]
- Ma, X.; Sun, B.; Liu, D.; Wang, T. Internal Film Cooling with Discrete-Slot Injection Orifices in Hydrogen/Oxygen Engine Thrust Chambers. Energies 2022, 15, 3459. [Google Scholar] [CrossRef]
- Shine, S.R.; Sunil Kumar, S.; Suresh, B.N. Influence of coolant injector configuration on film cooling effectiveness for gaseous and liquid film coolants. Heat Mass Transf. 2012, 48, 849–861. [Google Scholar] [CrossRef]
- Daimon, Y.; Negishi, H.; Silvestri, S.; Haidn, O.J. Conjugated combustion and heat transfer simulation for a 7 element GOx/GCH4 rocket combustor. In Proceedings of the 2018 Joint Propulsion Conference, Cincinnati, OH, USA, 9–11 July 2018. AIAA 2018-4553. [Google Scholar]
- Daimon, Y.; Terashima, H.; Muto, D.; Tani, H.; Negishi, H.; Haidn, O.J. Combustion Modeling Study for GCH4/GO2 Multi-Element Combustion Chamber; Sonderforschungsbereich/Transregio 40—Summer Program Report 2017; Japan Aerospace Exploration Agency: Tsukuba, Japan, 2017. [Google Scholar]
- Xu, B.; Chen, B.; Peng, J.; Zhou, W.; Xu, X. A Coupled Heat Transfer Calculation Strategy for Composite Cooling Liquid Rocket Engine. Aerospace 2023, 10, 473. [Google Scholar] [CrossRef]
- Wei, J.; Ye, M.; Zhang, S.; Qin, J.; Haidn, O.J. Modeling of a 7-elements GOX/GCH4 combustion chamber using RANS with Eddy-Dissipation Concept model. Aerosp. Sci. Technol. 2020, 99, 105762. [Google Scholar] [CrossRef]
- Chen, L.; Shi, Y.; Yang, H.; Shi, Y.; Yang, Q. Detailed investigation of supersonic film cooling performance in convergent divergent nozzle. Int. J. Turbo Jet-Engines 2024, 41, 127–137. [Google Scholar] [CrossRef]
- Xiang, J.; Jia, Y.; Li, Z.; Ren, H. Effects of Different Structural Film Cooling on Cooling Performance in a GO2/GH2 Subscale Thrust Chamber. Aerospace 2024, 11, 433. [Google Scholar] [CrossRef]
- Wei, J.; Zhang, S.; Zhou, X.; Cheng, C.; Qin, J.; Haidn, O.J. Effects of near wall flow and non-equilibrium reaction coupling on heat flux prediction inside a 7-elements GOX/GCH4 combustion chamber. Appl. Therm. Eng. 2022, 204, 118021. [Google Scholar] [CrossRef]
- Liu, C.; Zhang, S.; Yu, D. Effects of injector geometric parameters on the combustion and heat transfer process inside a 7-elements methane combustion chamber. Case Stud. Therm. Eng. 2022, 34, 102019. [Google Scholar] [CrossRef]
- Liu, J.; Zhang, S.; Wei, J.; Haidn, O.J. RANS based numerical simulation of a GCH4/GO2 rocket engine combustion chamber with film cooling and improvement of wall heat flux prediction. Appl. Therm. Eng. 2023, 219, 119544. [Google Scholar] [CrossRef]
- Launder, B.E.; Spalding, D.B. The Numerical Computation of Turbulent Flows. Comput. Methods Appl. Mech. Eng. 1974, 3, 269–289. [Google Scholar] [CrossRef]
- Magnussen, B.F. On the Structure of Turbulence and a Generalized Eddy Dissipation Concept for Chemical Reaction in Turbulent Flow. In Proceedings of the 19th AIAA Aerospace Meeting, St. Louis, MO, USA, 12–15 January 1981; p. 42. [Google Scholar]
- Magnussen, B.F.; Hjertager, B.H. On mathematical modeling of turbulent combustion with special emphasis on soot formation and combustion. Symp. (Int.) Combust. 1977, 16, 719–729. [Google Scholar] [CrossRef]
- Smith, G.P.; Golden, D.M.; Frenklach, M.; Moriarty, N.W.; Eiteneer, B.; Goldenberg, M.; Bowman, C.T.; Hanson, R.K.; Song, S.; Gardiner, W.C., Jr.; et al. GRI-Mech. Available online: http://me.berkeley.edu/gri_mech/ (accessed on 18 August 2024).
- Kazakov, A.; Frenklach, M. Reduced Reaction Sets Based on GRI-Mech 1.2. Available online: http://combustion.berkeley.edu/drm/ (accessed on 18 August 2024).
- Frenklach, M.; Wang, H.; Yu, C.L.; Goldenberg, M.; Bowman, C.T.; Hanson, R.K.; Davidson, D.F.; Chang, E.J.; Smith, G.P.; Golden, D.M.; et al. Available online: http://combustion.berkeley.edu/gri-mech/new21/data/rxns_static.html (accessed on 18 August 2024).
- Lorentzen, S.J.; Ertesvåg, I.S. Entropy generation in an opposed-flow laminar non-premixed flame—Effects of using reduced and global chemical mechanisms for methane–air and syngas–air combustion. Fuel 2023, 345, 128263. [Google Scholar] [CrossRef]
- Roth, C.; Silvestri, S.; Perakis, N.; Haidn, O. Experimental and Numerical Investigation of Flow and Combustion in a Single Element Rocket Combustor using GH2/GOX and GCH4/GOX as Propellants. In Proceedings of the 31st International Symposium on Space Technology and Science, Matsuyama, Japan, 3–9 June 2017. [Google Scholar]
- Negishi, H.; Nakajima, T.; Keller, R.; Gerlinger, P.M. Heat Flux Estimation on a Chamber Wall of GH2/GOx and GCH4/GOx Single Element Rocket Combustors. In Proceedings of the 31st International Symposium on Space Technology and Science, Matsuyama, Japan, 3–9 June 2017. [Google Scholar]
- Zhukov, V.; van Schyndel, J.; Saulo, G. Simulation of Single-Injector Methane Rocket Combustor Using Different Numerical Codes. In Proceedings of the 32nd International Symposium on Space Technology and Science, Fukui, Japan, 15–21 June 2019. [Google Scholar]
- Strokach, E.; Zhukov, V.; Borovik, I.; Sternin, A.; Haidn, O.J. Simulation of a GOx-GCH4 rocket combustor and the effect of the geko turbulence model coefficients. Aerospace 2021, 8, 341. [Google Scholar] [CrossRef]
- Lucas, J.G.; Golladay, R.L. An Experimental Investigation of Gaseous Film Cooling of a Rocket Motor; NASA TN 0-1988; National Aeronautics and Space Administration: Washington, DC, USA, 1963.


| Name | Symbol | Value |
|---|---|---|
| Diameter of GCH4 | d1 | 2.5 |
| Inner diameter of GO2 | d2 | 4.5 |
| Outer diameter of GO2 | d3 | 5.7 |
| Recess length | Lr | 2.0 |
| Radius of injector position | R2 | 15.0 |
| Chamber radius | Rc | 42.0 |
| Chamber length | Lc | 33.0 |
| Slit length for coolant | Lt | 2.0 |
| Radius of slit for coolant | R4 | 38.8 |
| Outer radius of coolant | Rc | 42.0 |
| Inner radius of coolant | Ri | 41.8 |
| Throat radius | Rt | 10.5 |
| Nozzle exit radius | Re | 20.0 |
| Nozzle length | Ln | 120.0 |
| Chamber exit to throat | 86.0 | |
| Throat to nozzle exit | 34.0 | |
| Angle between injectors at R2 | 72° | |
| Number of injectors | 5 |
| Injection Pressure, Bar | Combustion Chamber Pressure, Bar | ||
|---|---|---|---|
| GCH4 | GO2 | N2 | |
| 16.38 | 14.39 | 12.91 | 12.04 |
| Total Mass Flow Rate (g/s) | |||
|---|---|---|---|
| Configuration | GCH4 | GO2 | N2 |
| SR5 | 52.59 | 114.72 | 94.79 |
| Configuration | Total Injectors | Inner Row (R1 = 10 mm) | Middle Row (R2 = 15 mm) | Outer Row (R3 = 25 mm) | |||
|---|---|---|---|---|---|---|---|
| No. of Injectors | , ° | No. of Injectors | , ° | No. of Injectors | , ° | ||
| MR24 | 24 | 4 | 90 | 8 | 45 | 12 | 30 |
| MR30 | 30 | 5 | 72 | 10 | 36 | 15 | 24 |
| MR36 | 36 | 6 | 60 | 12 | 30 | 18 | 20 |
| MR48 | 48 | 8 | 45 | 16 | 22.5 | 24 | 15 |
| MR60 | 60 | 10 | 36 | 20 | 18 | 30 | 12 |
| MR72 | 72 | 12 | 24 | 24 | 15 | 36 | 10 |
| Element Size for Injector, mm | Element Size for Combustor and Nozzle, mm | Total Elements | |
|---|---|---|---|
| Grid-1 | 0.3 | 0.5 | 1,016,743 |
| Grid-2 | 0.2 | 0.4 | 1,862,141 |
| Grid-3 | 0.1 | 0.3 | 4,881,788 |
| Grid-4 | 0.1 | 0.25 | 6,063,663 |
| Configuration | Symmetry Angle for Periodic BC (°) | No. of Elements in Sliced Angle |
|---|---|---|
| SR5 | 72 | 4,881,788 |
| SR8 | 45 | 4,339,767 |
| SR10 | 36 | 3,622,330 |
| SR12 | 30 | 3,050,831 |
| SR16 | 45 | 4,536,740 |
| SR20 | 36 | 3,635,617 |
| SR24 | 30 | 3,185,438 |
| MR24 | 90 | 11,434,370 |
| MR30 | 72 | 9,293,276 |
| MR36 | 60 | 7,975,823 |
| MR48 | 45 | 6,139,528 |
| MR60 | 36 | 5,873,786 |
| MR72 | 30 | 4,926,006 |
Disclaimer/Publisher’s Note: The statements, opinions and data contained in all publications are solely those of the individual author(s) and contributor(s) and not of MDPI and/or the editor(s). MDPI and/or the editor(s) disclaim responsibility for any injury to people or property resulting from any ideas, methods, instructions or products referred to in the content. |
© 2024 by the authors. Licensee MDPI, Basel, Switzerland. This article is an open access article distributed under the terms and conditions of the Creative Commons Attribution (CC BY) license (https://creativecommons.org/licenses/by/4.0/).
Share and Cite
Radhakrishnan, K.; Ha, D.H.; Lee, H.J. Effect of Multicoaxial Injectors on Nitrogen Film Cooling in a GCH4/GO2 Thrust Chamber for Small-Scale Methane Rocket Engines: A CFD Study. Aerospace 2024, 11, 744. https://doi.org/10.3390/aerospace11090744
Radhakrishnan K, Ha DH, Lee HJ. Effect of Multicoaxial Injectors on Nitrogen Film Cooling in a GCH4/GO2 Thrust Chamber for Small-Scale Methane Rocket Engines: A CFD Study. Aerospace. 2024; 11(9):744. https://doi.org/10.3390/aerospace11090744
Chicago/Turabian StyleRadhakrishnan, Kanmaniraja, Dong Hwi Ha, and Hyoung Jin Lee. 2024. "Effect of Multicoaxial Injectors on Nitrogen Film Cooling in a GCH4/GO2 Thrust Chamber for Small-Scale Methane Rocket Engines: A CFD Study" Aerospace 11, no. 9: 744. https://doi.org/10.3390/aerospace11090744
APA StyleRadhakrishnan, K., Ha, D. H., & Lee, H. J. (2024). Effect of Multicoaxial Injectors on Nitrogen Film Cooling in a GCH4/GO2 Thrust Chamber for Small-Scale Methane Rocket Engines: A CFD Study. Aerospace, 11(9), 744. https://doi.org/10.3390/aerospace11090744