Article

A Novel Ultrasonic Sampling Penetrator for Lunar Water Ice in the Lunar Permanent Shadow Exploration Mission

1
College of Mechanical and Electrical Engineering, Shenyang Aerospace University, Shenyang 110136, China
2
Key Laboratory of Rapid Development & Manufacturing Technology for Aircraft, Shenyang Aerospace University, Ministry of Education, Shenyang 110136, China
3
School of Management, Hunan University of Information Technology, Changsha 410151, China
4
State Key Laboratory of Robotics and System, Harbin Institute of Technology, Harbin 150001, China
5
Deep Space Exploration Laboratory, Hefei 230026, China
6
Sinoma-Tangshan Heavy Machinery Co., Ltd., Tangshan 064099, China
*
Authors to whom correspondence should be addressed.
Aerospace 2025, 12(4), 358; https://doi.org/10.3390/aerospace12040358
Submission received: 28 February 2025 / Revised: 13 April 2025 / Accepted: 16 April 2025 / Published: 19 April 2025

Abstract

:
This paper presents an ultrasonic sampling penetrator with a staggered-impact mode, which has been developed for the extraction of lunar water ice. A comparison of this penetrator with existing drilling and sampling equipment reveals its effectiveness in minimizing disturbance to the in situ state of lunar water ice. This is due to the interleaved impact penetration sampling method, which preserves the original stratigraphic information of lunar water ice. The ultrasonic sampling penetrator utilizes a single piezoelectric stack to generate the staggered-impact motion required for the sampler. Finite element simulation methods are employed for the structural design, with modal analysis and modal degeneracy carried out. The combined utilization of harmonic response analysis and transient analysis is instrumental in attaining the staggered-impact motion. The design parameters were then used to fabricate a prototype and construct a test platform, and the design’s correctness was verified by the experimental results. In future sampling of lunar water ice at the International Lunar Research Station, the utilization of the ultrasonic sampling penetrator is recommended.

1. Introduction

In the context of progressive advancements in deep space exploration technology, the precision assessment of water ice reserves within the subsurface of the Moon, in conjunction with the acquisition of water ice specimens, has emerged as a vanguard and compelling subject of inquiry within the domain of extraterrestrial research [1]. The strategic importance of lunar water ice resources is well-documented, and the acquisition of lunar soil water ice resources is a fundamental solution to the problem of life support for future outer space exploration. The hydrogen–oxygen conversion of lunar soil water ice resources has the potential to provide a stable energy supply for the rocket propellant lunar scientific research base.
In 1961, Watson et al. from the United States pioneered the hypothesis that water ice may be present at the lunar poles. This concept has since become a cornerstone in the discourse surrounding extraterrestrial volatiles [2]. Permanently shadowed regions, eternally veiled from solar illumination, are found within the Moon’s polar craters. In 1994, the USS Clementine, equipped with a bistatic radar system, detected indirect indications of water ice presence in these secluded areas, specifically within the south pole’s perpetual darkness [3]. In 2008, India’s Chandrayaan-1 lunar mission employed microwave radar technology to detect and map the spatial distribution of water ice within the Moon’s polar regions [4]. In 2025, scholars such as Chandani Sahu of India conducted an analysis of the Chandrayaan-1 Mini-SAR and Chandrayaan-2 DFSAR Data datasets for the circular polarization ratio (CPR) values greater than 1. This finding is consistent with other studies and suggests that high CPR values indicate ice deposition in the Moon’s polar regions [5]. The findings of the present investigation are predominantly contingent on remote sensing techniques that utilize spectrometers and neutron spectrometers. These instruments facilitate the acquisition of data pertaining to the subsurface and expansive distribution of water ice within the lunar regolith. However, the quantification of water ice content is marred by significant errors. Consequently, there is an urgent need for in-depth sampling studies that explore the vertical and profound profiles of the water ice within the subsurface strata of the lunar soil [6,7].
In the aftermath of the “around-fall-back” lunar exploration program’s substantial success, the People’s Republic of China has initiated a mission that is specifically aimed at the sampling and investigation of water ice within the lunar regolith at the Moon’s south pole. This mission is designed to acquire detailed insights into the accumulation state of water ice and to discern the distribution patterns of water ice with respect to the depth of the lunar surface. Two distinctive aspects merit attention when undertaking deep exploration of water ice in the lunar soil at the south pole:
(1)
In environments exhibiting extremely low temperatures, lunar water ice demonstrates a high degree of susceptibility to disruption during the process of sampling. To maintain the integrity of the physical parameters and stratigraphic information of lunar water ice during sampling, it is essential to adhere to stringent protocols for the preservation of “in-situ quality and in-situ” [8]. The penetration coring method, a primary coring technique, is employed for the purpose of low-disturbance coring of lunar water ice. Concurrent research is underway to develop a coring method that ensures the “in-situ authenticity of lunar water ice samples”.
(2)
The sampling location is situated in a region of the Moon’s south pole that is perpetually shadowed. This geographical location presents challenges, as it is difficult to obtain the necessary electrical power to replenish the equipment required for the mission. This necessity for a low-power, high-efficiency penetration drive is further exacerbated by the rover’s limited energy supply. The ultrasonic sampling penetrator has the following characteristics: a compact structure, low power consumption, low drilling pressure, the absence of lubrication, and a wide range of temperature resistance (−200 °C~500 °C) [9,10], making it well suited for the penetration sampling of water ice samples from the lunar loam.
The recent advancements in piezoelectric ceramic smart materials and power ultrasound technology have paved the way for the proliferation of piezoelectric ultrasound devices across a broad range of applications in the domains of aerospace and deep space exploration [11,12,13,14,15,16,17,18,19,20]. The acquisition of geological layering data is contingent upon the implementation of penetrative and drilling methodologies [21]. The process of penetrative sampling involves the controlled insertion of a tube into the lunar soil, with impacts applied at a predefined frequency to preserve the integrity of the sample’s original layering. This method, although efficient, exhibits modest productivity. Conventional penetration sampling entails the implementation of an external agent to systematically generate a penetration shock, thereby enabling continuous penetration into the core tube. However, this process consumes spatial resources and exerts a load on the rover. In the Moon’s microgravity environment, excessive penetration impacts can also lead to the rover capsizing. Conversely, ultrasonic drilling techniques offer distinct advantages, including reduced drilling pressure and compact size, rendering them highly suitable for the extraterrestrial acquisition of specimens. However, a solitary impact penetrator is encumbered by disadvantages such as the challenge of debris removal and its constrained functionality. The use of ultrasonic drill technology has been demonstrated in extraterrestrial settings, particularly on the Moon, where its employment in drilling has been observed to generate significant perturbations within the lunar soil. This, in turn, has the potential to result in the loss of water ice that may be present within the soil due to these perturbations. Conventional drilling samples are obtained by penetrating the lunar soil layer with a rotary and percussive action exerted by an electric motor. This method is highly efficient, but it is more destructive to the stratigraphic information of the lunar soil. In light of these considerations, the utilization of piezoelectric-driven impact penetration coring technology holds considerable promise in the development of sampling equipment that is capable of enhancing coring efficiency while ensuring the preservation of the stratigraphic integrity of water ice samples within the lunar soil.
Piezoelectric actuators typically leverage the inverse piezoelectric effect to transform electrical energy into vibrational mechanical energy. These actuators are classified based on their vibrational characteristics, distinguishing between resonant and non-resonant types [22,23]. Non-resonant piezoelectric actuators have been shown to achieve nanometer-level precision control, making them well suited for positioning control applications. However, these actuators exhibit a limited range of motion and operate at relatively low speeds [24,25]. Conversely, resonant piezoelectric actuators leverage the inverse piezoelectric effect present in piezoelectric elements. This enables them to induce longitudinal motion that propels the penetration tip [26,27].
Piezoelectric actuators can be classified based on the integration method between piezoelectric elements and amplitude transformers (metal) as bonded and bolt-clamped types. In the case of bonded-type actuators, piezoelectric elements are affixed to the metal amplitude transformers using conductive adhesives. These actuators are designed to resonate through electromechanical coupling in the lower coefficient d31 mode. Nevertheless, the fragility of piezoelectric materials under substantial tensile stress, in conjunction with the variability of adhesive properties at low temperatures, imposes constraints on their utilization for the harvesting of water ice from lunar soil in extreme cryogenic conditions. In bolt-clamped type actuators, bolts are utilized to secure the piezoelectric elements between metal components, thereby exerting significant pre-stress on the piezoelectric elements. This configuration allows for higher excitation voltages, thus enhancing power output without inducing piezoelectric material fracture or adhesive layer fatigue. It is noteworthy that the piezoelectric elements within bolt-clamped actuators operate in the d33 mode, which has been demonstrated to exhibit a substantially enhanced energy transfer efficiency in comparison with the d31 mode. Consequently, this configuration renders the bolt-clamped actuators more advantageous for applications requiring robust power delivery in harsh environmental conditions [28,29,30,31].
This article presents a novel apparatus for staggered penetration coring that is powered by the bilateral longitudinal actuation of piezoelectric elements. The drive mechanism devised in this study is capable of generating out-of-phase, staggered longitudinal vibrations to ensure continuous penetration. The remainder of the paper is structured as follows: The Section 2 details the structural composition and operational principles of the driver proposed. In Section 3, the structural design employing the response surface methodology will be presented, and the modal analysis and harmonic response analysis of the staggered penetration impact ultrasonic transducer will be carried out by means of the finite element method. The Section 4 presents a thorough design of the staggered-impact ultrasonic coring device, along with an experimental scheme developed using the Response Surface Methodology to assess the vibratory characteristics and output capabilities of the device. Finally, conclusions drawn from the experimental results are provided in Section 5.

2. System Composition and Working Principle

The staggered penetration ultrasonic penetrator is composed of a piezoelectric stack, an impact unit, a reverse impact unit, and a fastening screw (Figure 1). The piezoelectric stack consists of multiple copper electrodes and four piezoelectric ceramic rings (PZT-8), which are sandwiched between the impact unit and the reverse impact unit, as illustrated in Figure 1. The poling direction of the piezoelectric ceramic sheets is parallel to the thickness direction, and they function in the d33 mode. The upper side of the piezoelectric stack houses the impact unit, which incorporates a reverse shock amplifier, coring tube, and fastening screw. Conversely, the impact unit, positioned on the bottom of the piezoelectric stack, serves as a shock amplifier. Both of these units are interconnected and secured to the piezoelectric ceramic stack via internal threads. Additionally, they are connected to the frame [32,33].
Within the paradigm of piezoelectric stack technology, an alternating voltage is applied, thereby generating high-frequency AC signals. These signals are then converted into longitudinal vibrations at the stack’s resonant frequency. These vibrations are then transmitted to the opposing sides of the stack. The impact unit is composed of two distinct components: the amplitude amplification section and the uniform penetration teeth section. The former component is responsible for the amplification and transmission of longitudinal vibrations, thereby driving the latter to generate an impact penetration effect.
It is important to note that the reverse impact unit comprises two components: a reverse impact amplifier and a coring tube. The reverse impact amplifier employs an inverted “mountain” structure, which has been demonstrated to transmit vibrations from the upper side of the piezoelectric stack toward the coring tube, thereby effectively outputting vibrations. The longitudinal impact penetration is generated by the uniformly distributed penetration teeth located on the outer side of the coring tube.
The impact and reverse impact units both yield an output of penetration teeth. The teeth in question possess a cross-section measurement of 4 × 1/8 inches and are composed of circular rings. A trapezoidal breaking tip with a width of 0.5 mm and an angle of 30° is featured at the front of each penetration tooth. A uniform distribution characterizes the arrangement of the four penetration teeth of the impact unit across the output surface of the amplitude amplification section, while the reverse impact unit features a uniform distribution of its four penetration teeth on the outer side of the coring tube. As illustrated in Figure 2, the penetrating teeth of these two units are arranged in a staggered configuration, with the arrows denoting the direction of component movement. When subjected to sinusoidal voltage excitation, the forward amplitude amplifier and the reverse amplitude amplifier generate longitudinal vibrations that drive their respective penetration teeth to produce vibrations with phases that are in opposition. This results in interleaved impacts from the transducer, which can be sampled. The working principle of the proposed penetrator is demonstrated in Figure 2, showing that under sinusoidal voltage excitation, the vibration mode of the piezoelectric actuator undergoes periodic changes, as depicted in the sequence “(a)-(b)-(a)” in Figure 2.

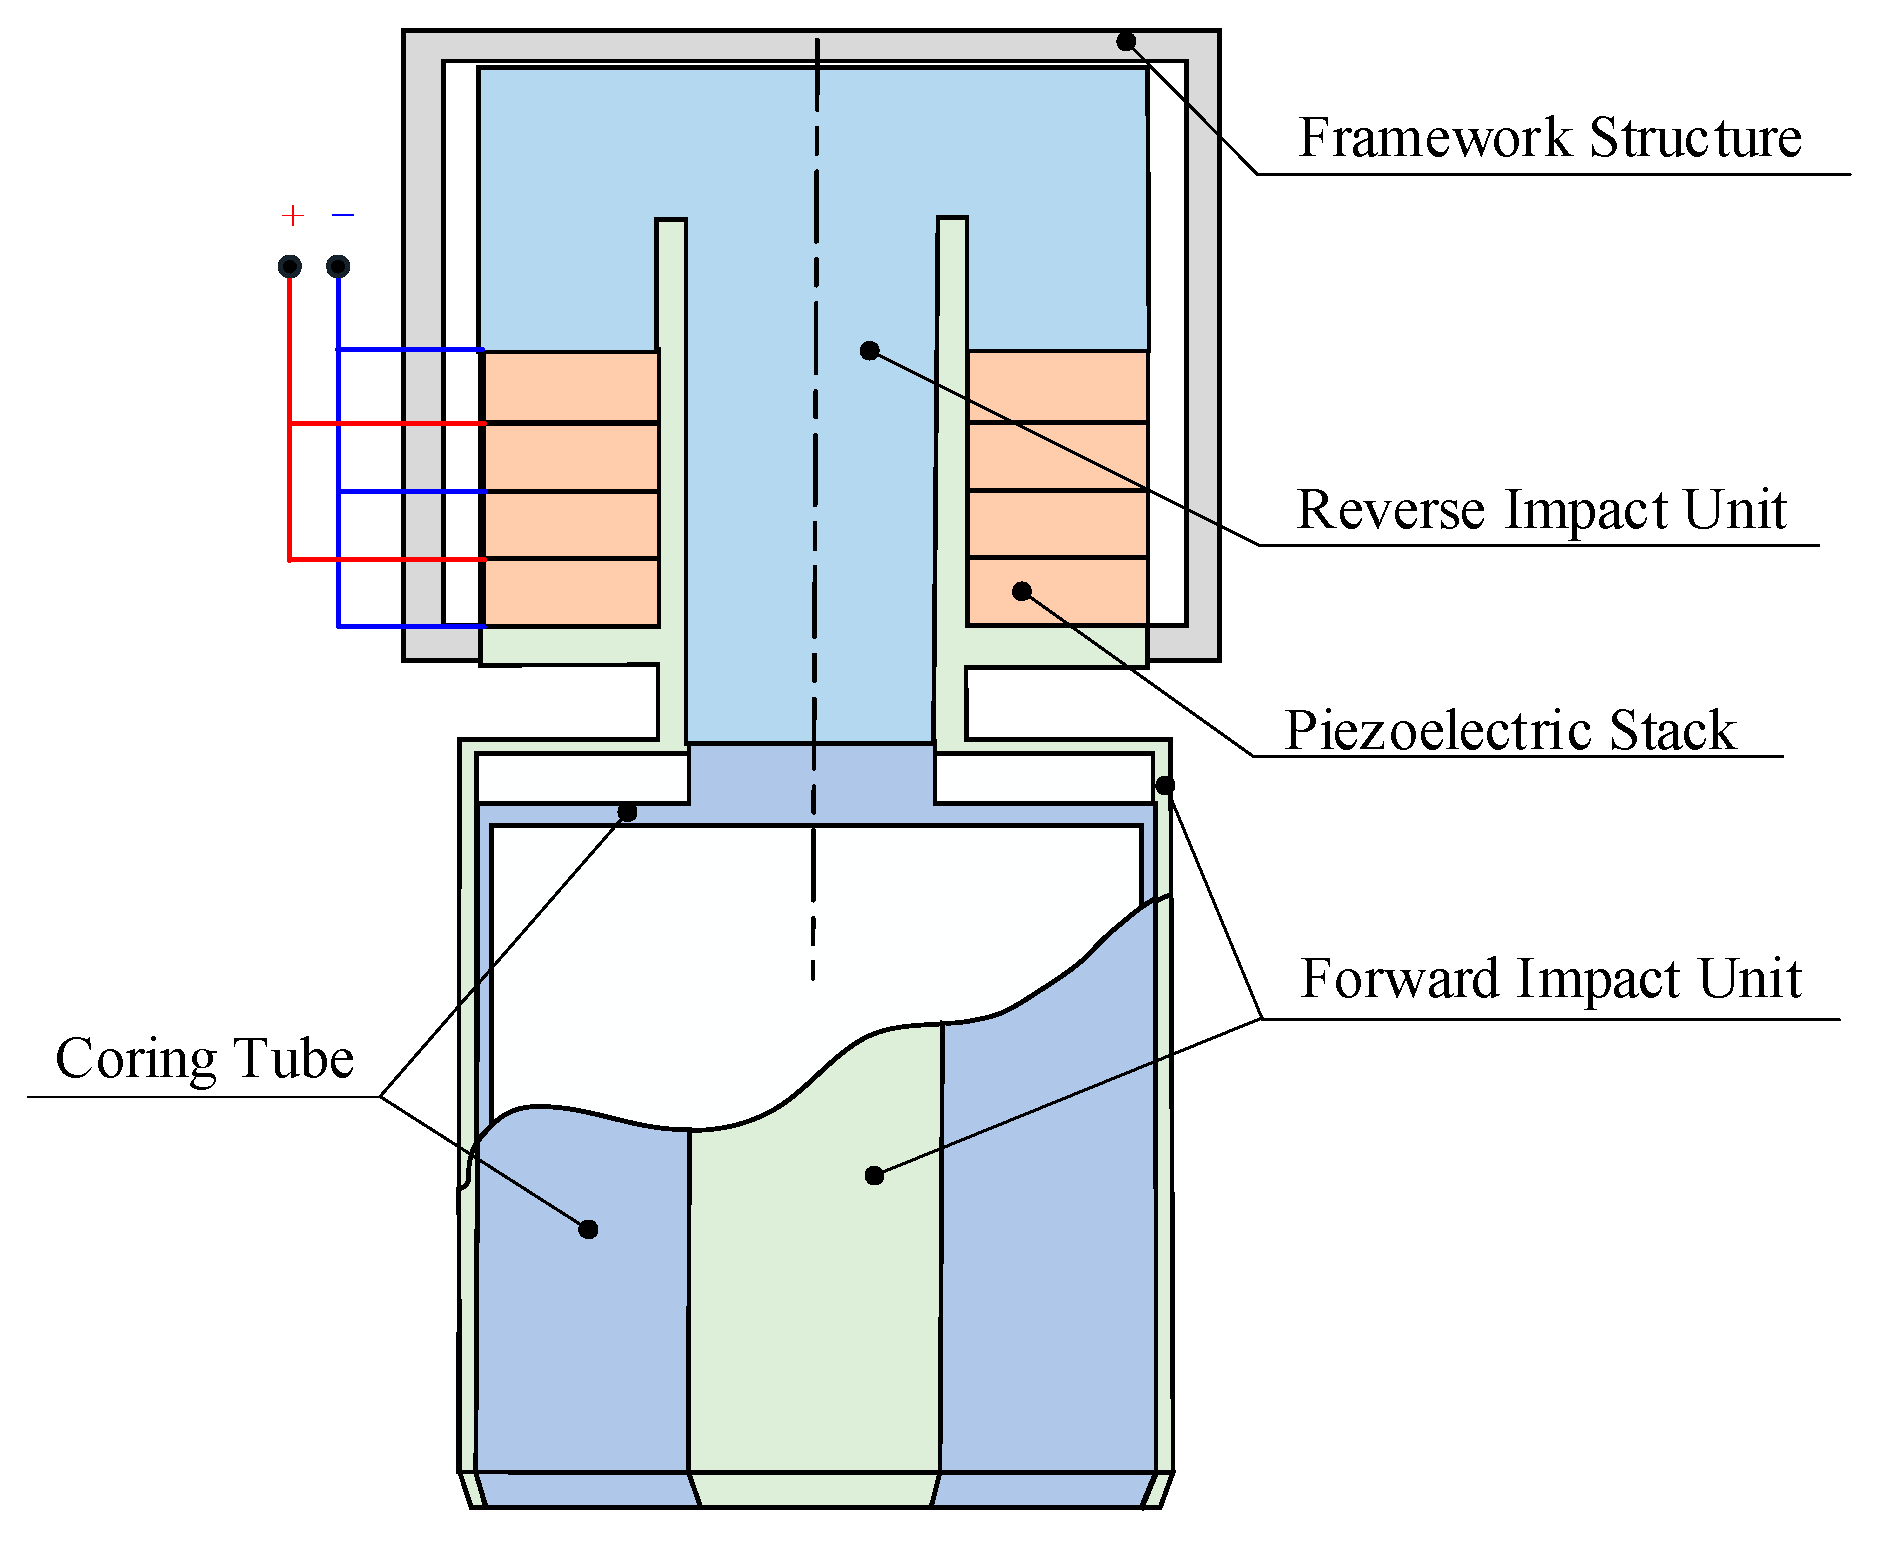
3. Structural Design of Staggered Impact Piezoelectric Transducer

3.1. Design of Piezoelectric Transducer

The interleaved penetration ultrasonic penetrator is operated in such a manner that it utilizes a piezoelectric stack as the power source, while the actuating units are the impact amplitude amplifier and the reverse impact amplifier. In this paper, the term “driving transducer” is used for the collective designation of the piezoelectric stack, the impact amplitude amplifier, and the reverse impact amplitude amplifier.
The operational frequency that enables the piezoelectric actuator to generate intermitted longitudinal vibrations, as well as the longitudinal vibration output produced at the tips of the penetration teeth, is influenced by the structural dimensions of the actuator. A finite element analysis method is utilized to conduct a sensitivity analysis of the dimensional parameters on the vibrational characteristics of the piezoelectric actuator. The driving transducer contains two amplifiers: the impact amplifier and the reverse impact amplifier. Both are constructed from stainless steel SUS304, and their element type is defined as 8-node three-dimensional solid element SOLID45. Within the piezoelectric stack lies the piezoelectric ceramic material, designated as PZT-8. Its element type is classified as coupled-field hexahedral element SOLID5. The relative permittivity matrix ε, piezoelectric constant matrix e, and elastic constant matrix C for the PZT-8 piezoelectric ceramic material, polarized along the thickness direction, are as follows [34,35]:
ε = 919 0 0 0 919 0 0 0 826 × 10 11 F / M
e = 0 0 4.1 0 0 4.1 0 0 14.0 0 0 0 0 10.3 0 10.3 0 0 C / m 2
C = 14.9 8.1 8.1 0 0 0 8.1 14.9 8.1 0 0 0 8.1 8.1 13.2 0 0 0 0 0 0 3.4 0 0 0 0 0 0 3.13 0 0 0 0 0 0 3.13 × 10 10 N / m 2

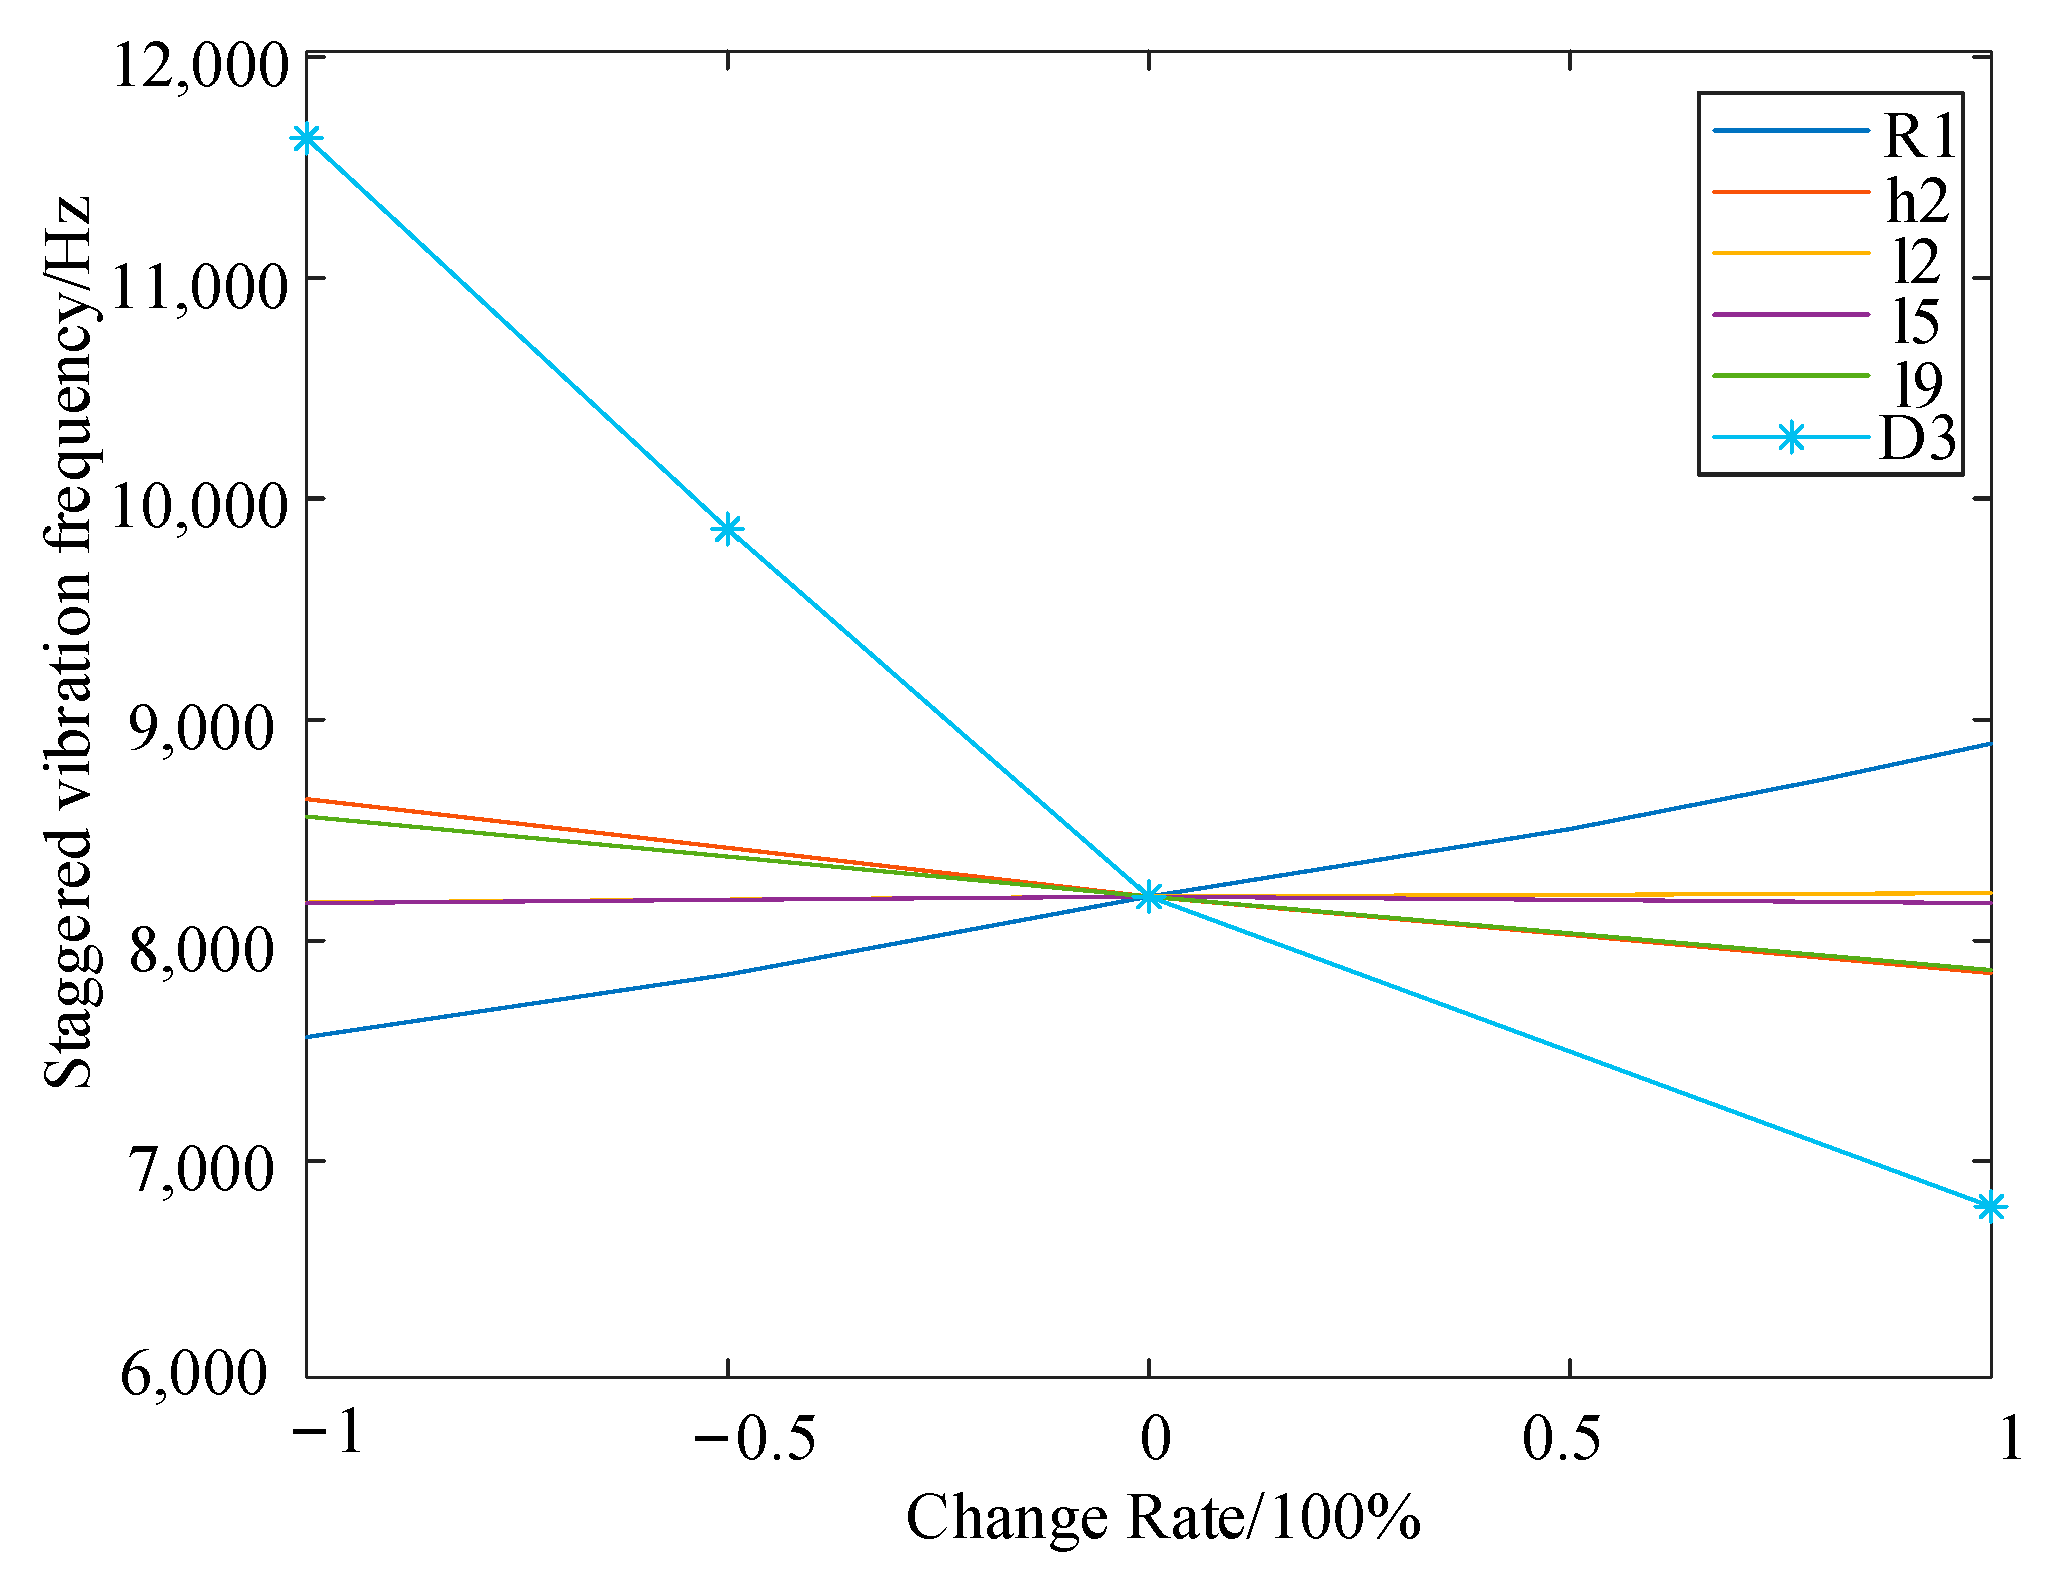
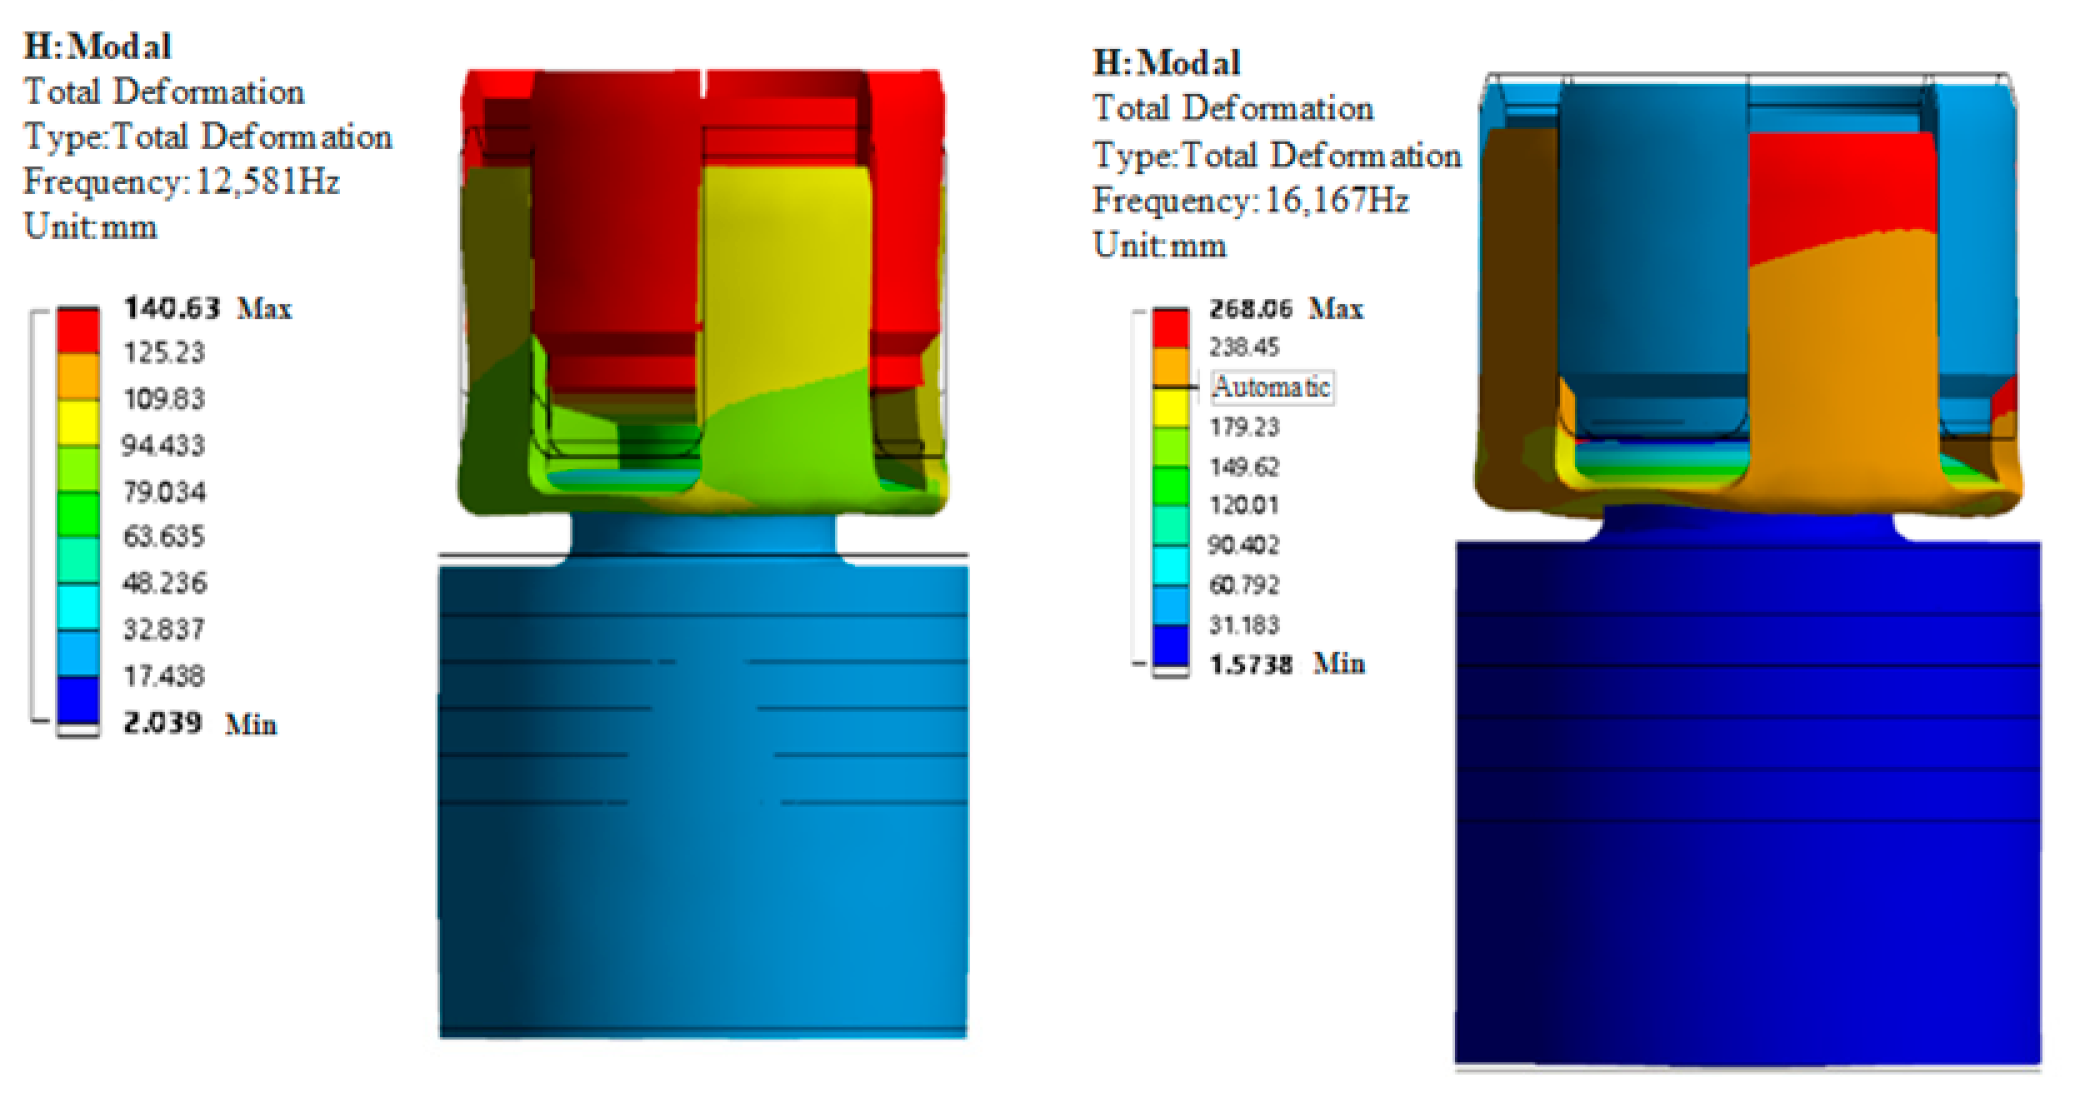
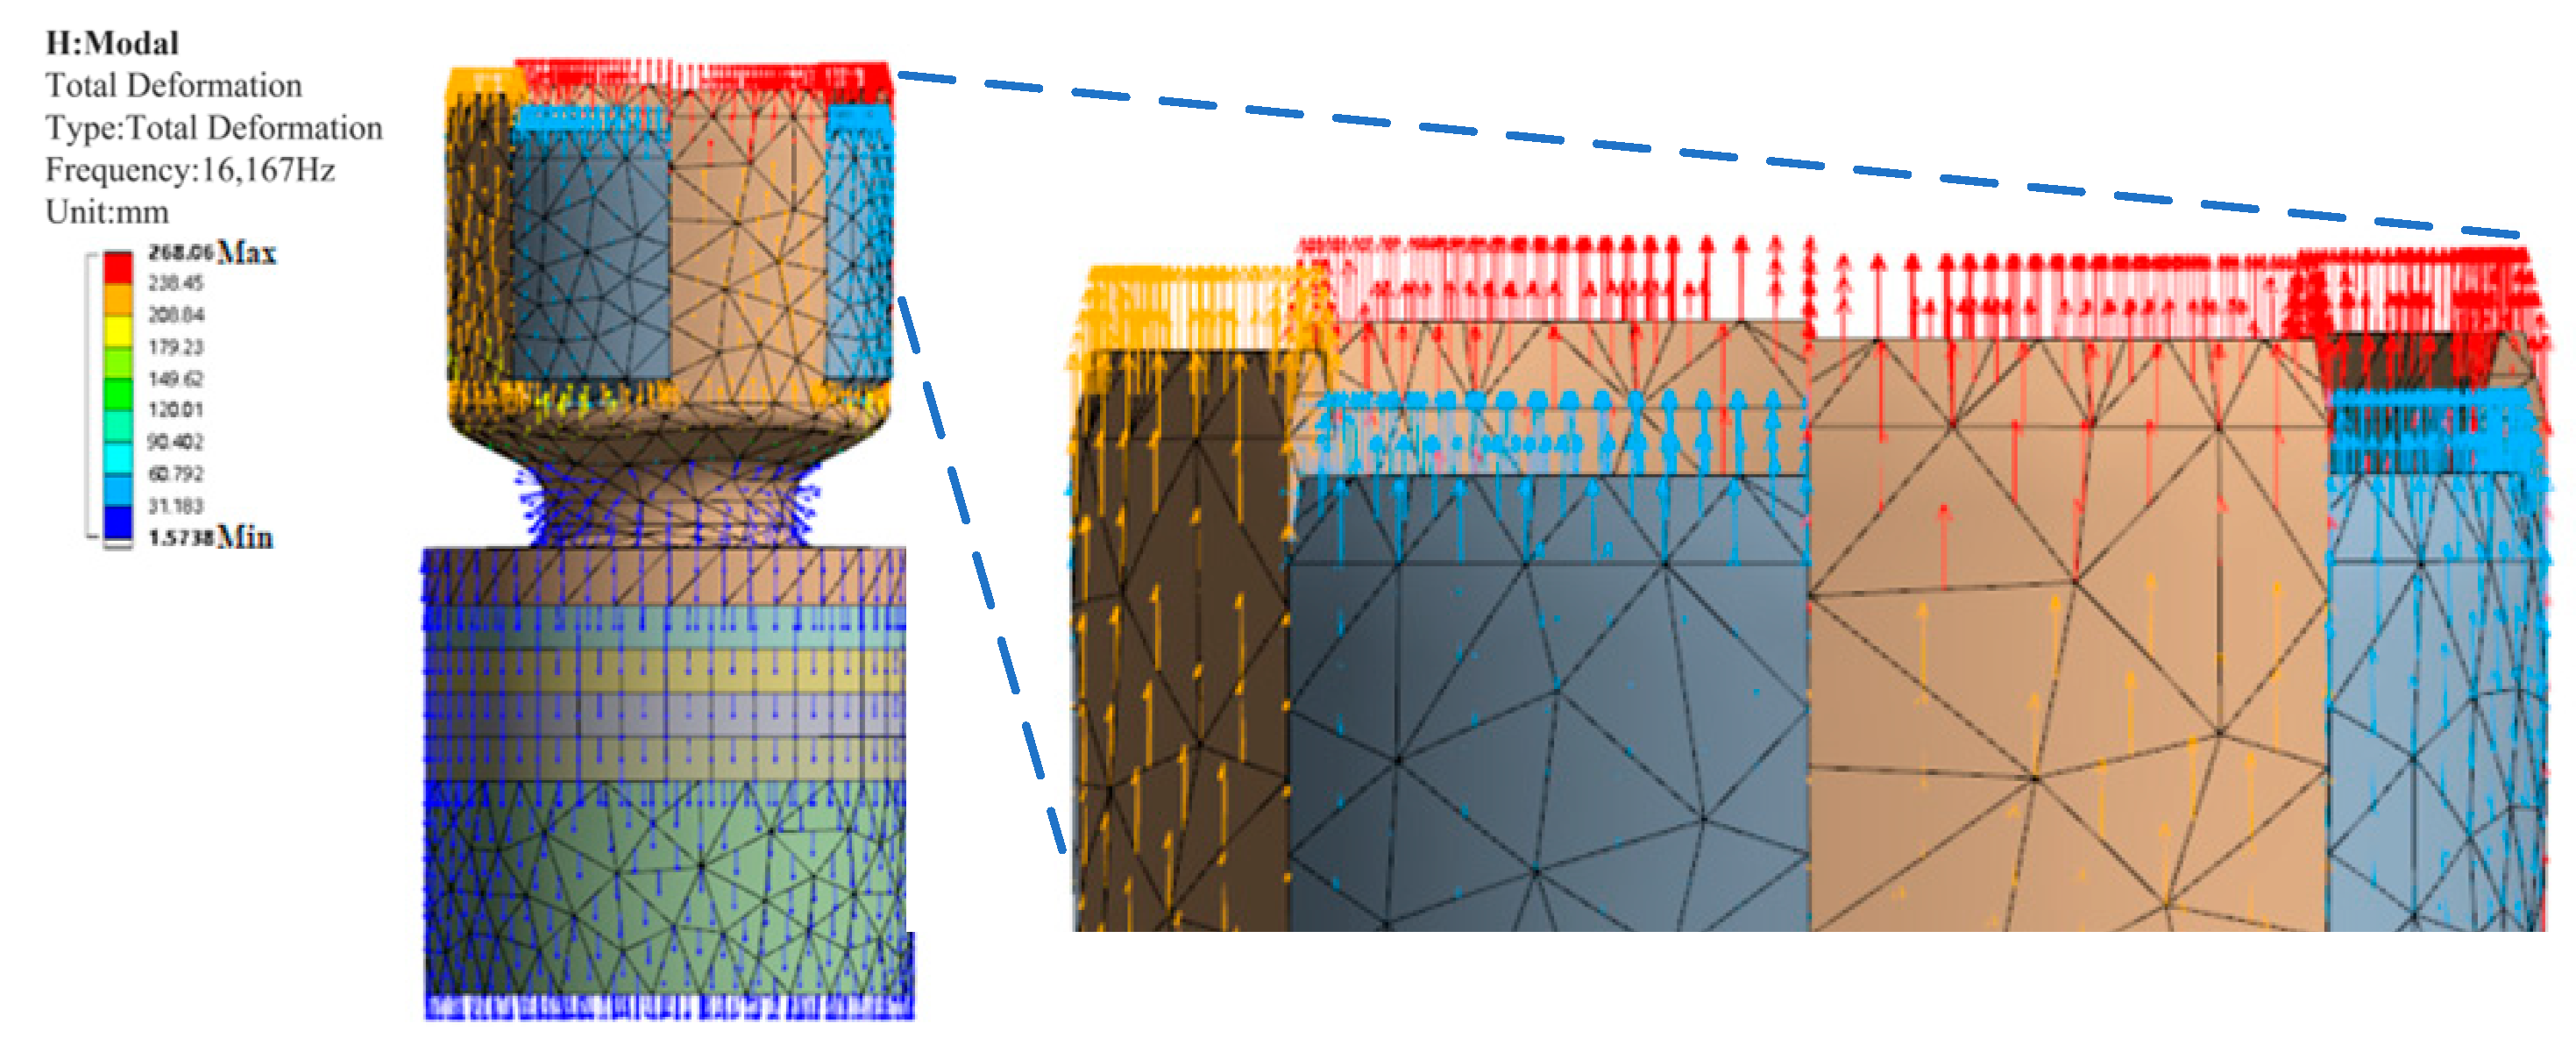
3.2. Structural Dimension Analysis of Piezoelectric Transducer

Two critical performance metrics can be used to evaluate the output characteristics of the device under study. These metrics are the resonant operating frequency of the piezoelectric transducer and the output amplitude at the distal tips of the teeth. Within the configuration of the driving transducer, the forward impact unit is designated as surface A at the tip of the penetration teeth, while the reverse impact unit is designated as surface B, as illustrated in Figure 3. In order to facilitate processing, the reverse impact ultrasonic horn is divided into the reverse cover and reverse post. The direction of the arrow in Figure 3g indicates the positive and negative directions of the piezoelectric ceramics. The interleaved longitudinal vibration frequencies are investigated under various structural dimensions using modal analysis, as shown in Figure 3. Consequently, harmonic response analysis was employed to ascertain the vibration amplitudes at surfaces A and B for the aforementioned structural dimensions. Figure 3a–g and Table 1 collectively present the initial structural dimensions of the actuator. A total of six parameters—D3, R1, l2, (l3 & l5), l9, and h2—were selected for adjustment. During the simulation, a voltage amplitude of 300 volts is set, and the damping ratio is set to 0.0014.
A comprehensive review of the interleaved vibration frequency and its variation with dimensions is illustrated in Figure 4. A significance analysis of the parameters’ results reveals that two parameters significantly affect the longitudinal vibration frequency: D3 and r1, the first parameter is the longitudinal vibration frequency. Additional factors contributing to the variation in the longitudinal vibration frequency include parameters l1, h2, l5, and l9.
A Response Surface Methodology was devised with six dimensional parameters in consideration: A-R1, B-h2, C-l2, D-l5, E-l9, and F-D3. The longitudinal amplitude values at the impact surfaces designated A and B were selected as the two response variables to investigate the significant influence relationship between the specified dimensions and amplitude. The results are presented in Figure 5 and Figure 6. The amplitude at impact surface A was found to be influenced by parameters A, B, and F, corresponding to dimensions R1, h2, and D3, respectively. The relationship between R1 and amplitude exhibited a monotonic decrease, while the relationship between D3 and amplitude demonstrated an initial increase followed by a decrease. The observed variation trends of the other dimensional parameters with respect to amplitude were found to be analogous to those of D3.
For the surface B impact, parameters C and D, corresponding to l2 and l5, were identified as key influencing factors. The correlation between l2 and amplitude manifested as a unidirectional decrease, while l5 and amplitude exhibited a unidirectional increase. The influence of parameter h2 on amplitude was found to be relatively negligible. The remaining dimensional parameters demonstrated a monotonic decrease in relation to amplitude. The results of the modal analysis suggest that the dimensional parameters R1, D3, and l9 have a significant impact on the resonant frequency of the actuator, while the remaining parameters have a minimal effect on the interleaved vibration frequency. Furthermore, harmonic response analysis revealed that R1, h2, and D3 significantly affect the amplitudes at surfaces A and B.

3.3. Structural Dimension Optimization of Piezoelectric Transducer

In light of the findings from the response surface analysis, which revealed the influence relationships of dimensional factors on longitudinal vibration frequency and output amplitude, structural parameters were adjusted with the objective of ensuring that the amplitude difference between surfaces A and B falls within the range of 1 micron. Subsequent to the initial structural dimensions and analysis results, the final structural dimensions were established as follows: D3 = 29 mm, R1 = 10.6 mm, l1 = 4 mm, l2 = 11 mm, l3 = 26.4 mm, l7 = 7.5 mm, l9 = 20 mm, and h2 = 1.5 mm. The results of the modal analysis of the adjusted model are presented in Figure 7.
The examination of the co-directional longitudinal vibration vector diagrams at the frequencies of 12.58 kHz and 16.167 kHz reveals the occurrence of both interleaved and simultaneous vibrations. The corresponding deformations of these vibrations are illustrated in Figure 7. The displacement vector diagrams are presented in Figure 8 and Figure 9.
Observations of phenomena such as longitudinal vibration within the combined model have been recorded at two distinct frequency points, identified at 12,581 kHz and 16,167 kHz, respectively. These frequency values correspond to the phenomenon of interleaved vibration as well as synchronized vibration, as indicated by the findings of the study. The frequency value associated with the interleaved vibration aligns with established expectations.
In the harmonic response analysis, the longitudinal deformation and frequency distribution of the longitudinal vibrations at the A and B impact surfaces of the structure are examined under an excitation voltage of 300 volts. As demonstrated in Figure 10 and Figure 11, the impact surfaces A and B of the forward and reverse impact units, respectively, manifest the most pronounced longitudinal vibration peaks at two discrete frequencies: 12.381 kHz and 14.777 kHz. The frequency of 12.381 kHz corresponds to a configuration where the forward impact surface A and the reverse impact surface B engage in staggered impacts with opposite phases. On the other hand, at 14.777 kHz, the vibration manifests as a prevalent phenomenon, with both the forward impact surface A and the reverse impact surface B undergoing synchronized vibration in the same direction and phase.
In order to provide a clear representation of the driver’s modal vibration patterns, Figure 10 and Figure 11 have been prepared. The simulation calculations reveal that the operating frequency for staggered vibration is 12.458 kHz, with an amplitude of 16.572 μm at the forward impact surface A and an amplitude of 15.271 μm at the reverse impact surface B.

4. Piezoelectric Transducer Performance Testing

4.1. Interleaved Impact Ultrasonic Penetration Experimental Platform Prototype Development

The structural design of the staggered impact ultrasonic penetrator is developed in accordance with its assembly requirements. The ultrasonic sampling device under consideration consists of several components, including a piezoelectric stack, a forward impact unit, and a reverse impact unit. The development of a vertical testing platform was undertaken to address the practical demands of the clamping and penetration sampling experiments.
The piezoelectric stack utilizes PZT-8 ceramic discs, with an outer diameter of 35 mm and an inner diameter of 16 mm, along with a thickness of 3 mm. Copper electrode plates with a thickness of 0.1 mm are interposed between these ceramic discs and at the contact surfaces between the ceramic discs and the stainless steel sonotrode. The forward impact sonotrode exerts preload on the reverse impact unit through a hollow cylindrical component integrated on the forward impact sonotrode. To facilitate the processes of processing and assembly, the reverse impact unit is divided into three components: the reverse impact end cap, the reverse impact rod, and the core extraction tube. A threaded connection is utilized to affix the reverse impact end cap to the reverse impact rod; the reverse impact rod is then secured to the core extraction tube through the use of screws. The forward impact unit, which includes the forward impact sonotrode, features a flange at the designated section. The principal prototype of the designed staggering ultrasonic penetrator is illustrated in Figure 12.

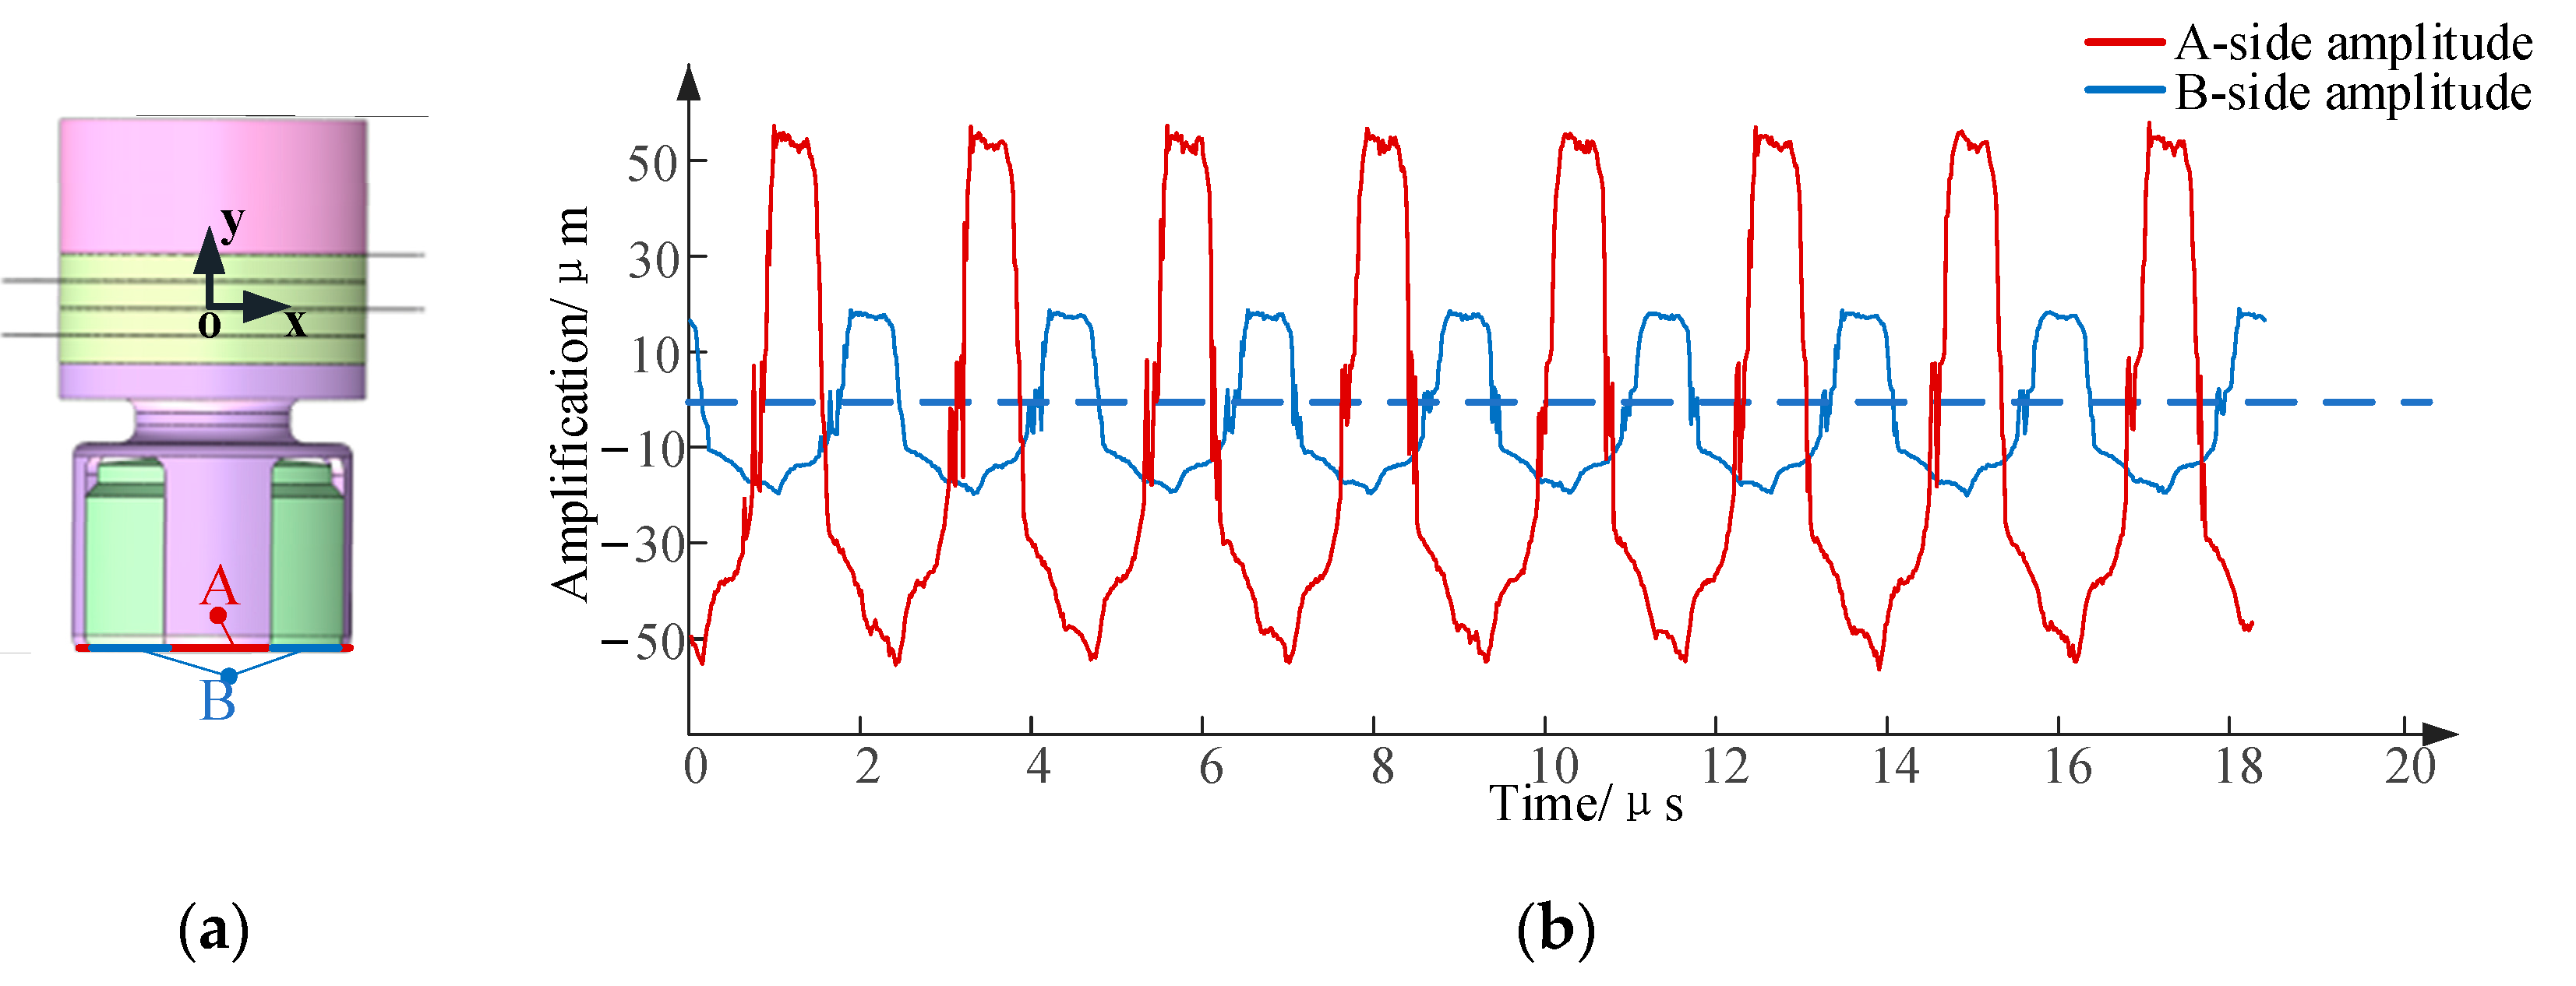
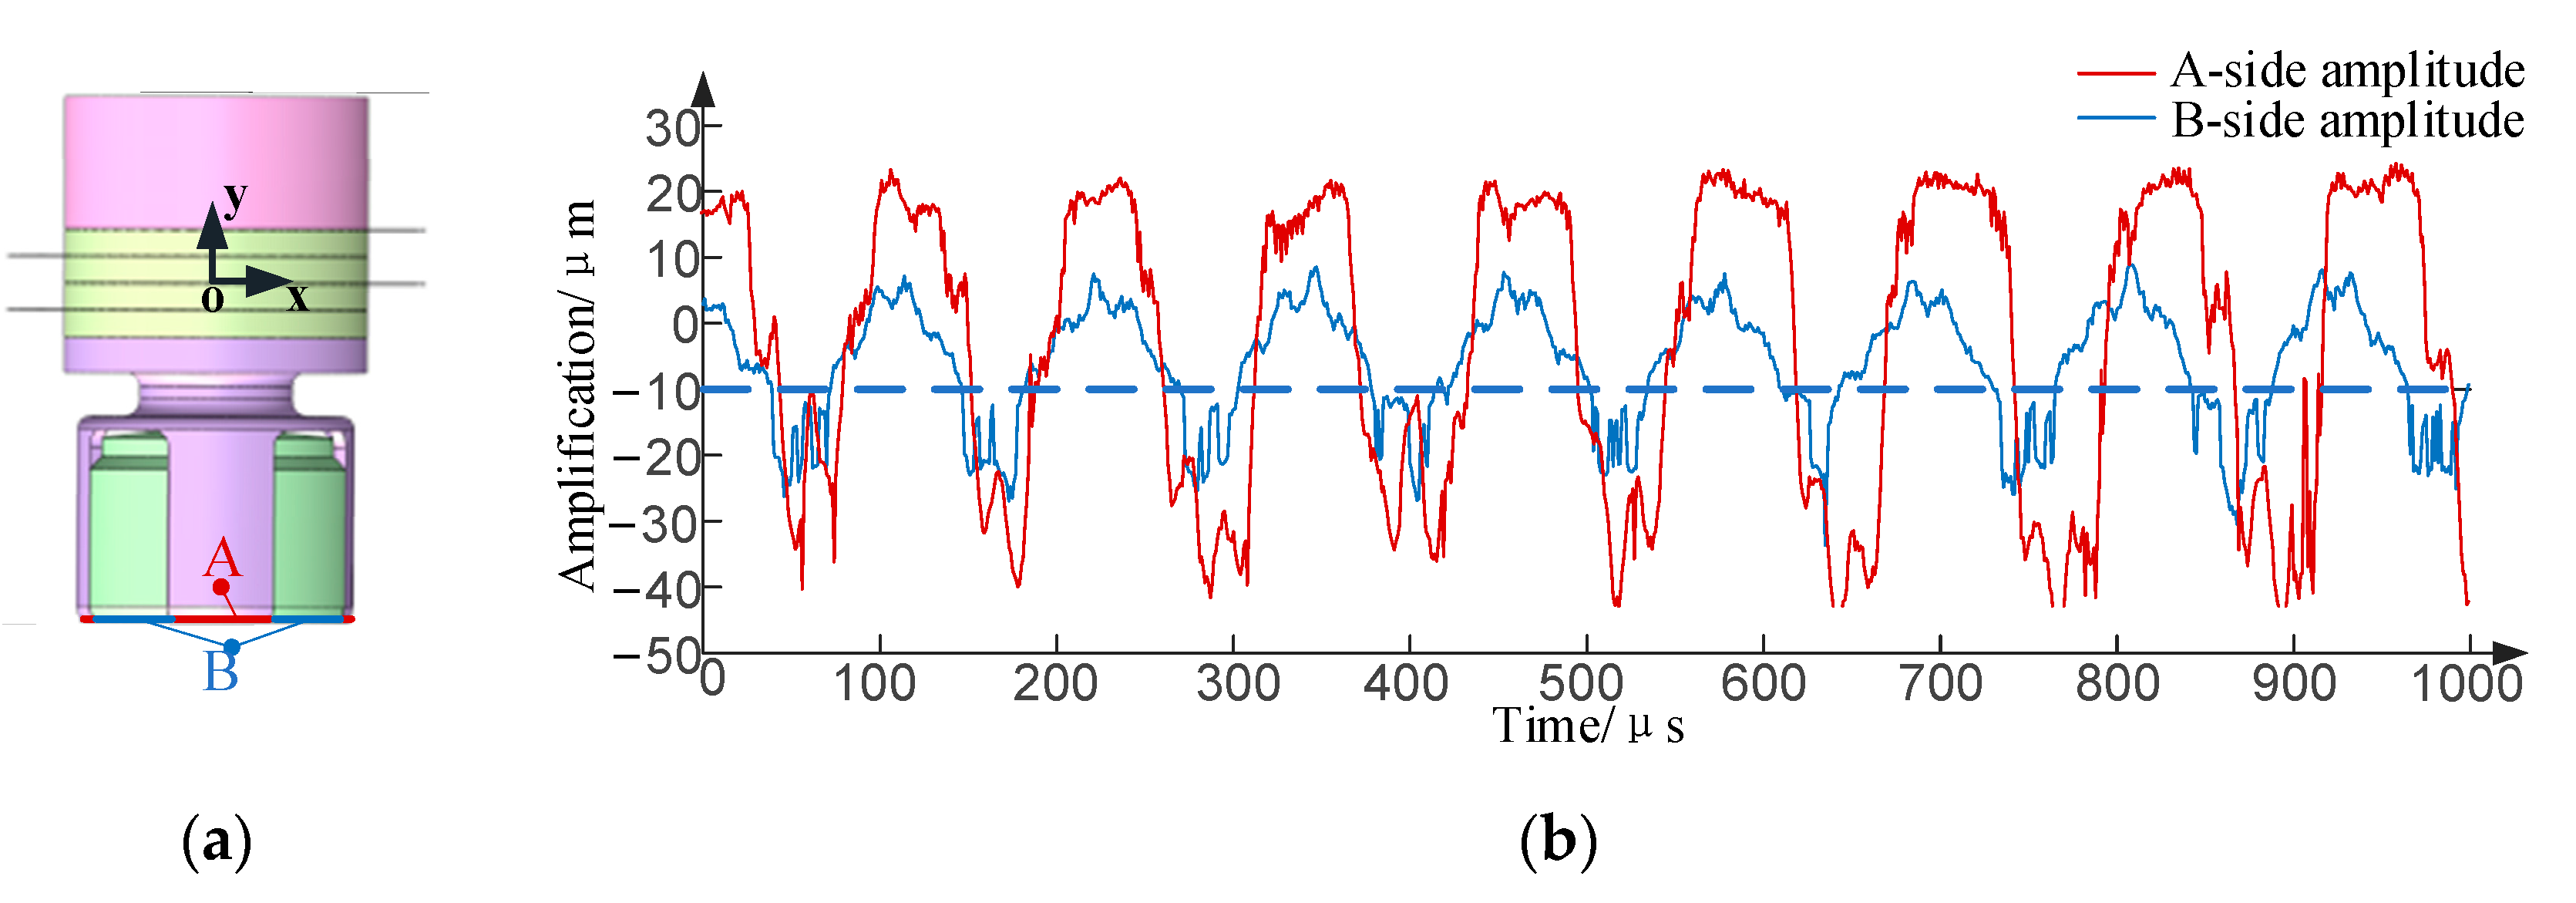
4.2. Analysis of Output Characteristics of Staggered Impact Penetrator

The present study aims to assess the output performance of the staggered impact ultrasonic sampling device. To this end, the laser displacement sensor is employed to measure the output motion amplitude of the transducer. Laser displacement sensor (LK-H020 KEYENCE,) with a measuring accuracy of 0.02 μm.
The signal generator is employed to generate a sine waveform, characterized by an amplitude of 5 V AC voltage. Subsequently, this signal is channeled towards a power amplifier. The power amplifier’s function is to amplify the output voltage to the operational voltage of 300 V required for the experimental prototype. To verify the resonant frequency of the penetrator prototype, the output frequency of the signal generator can be experimentally adjusted. The measurement of amplitude data under resonant conditions is facilitated by the laser displacement sensor depicted in Figure 13c. This configuration enables the acquisition of resonant amplitudes at the impact surfaces A and B for various excitation frequencies. The longitudinal displacements of surfaces A and B can be observed in Figure 14.
In order to eliminate the effects of environmental noise vibrations during the experimental process (1–2 micrometers), an analysis of the longitudinal vibrations at impact surfaces A and B at different frequencies was conducted. The results of this analysis are illustrated in Figure 14. Within the excitation frequency range of 17 kHz to 20 kHz, two frequency points, 17.52 kHz and 18.71 kHz, exhibited extreme values of longitudinal amplitude variation. These frequency points correspond to the resonant frequency points of the transducer’s output longitudinal vibrations. A strong correlation was observed between the distribution of amplitude variation as a function of frequency and the resonant sweep diagram derived from harmonic response analysis. Nevertheless, the resonant frequencies of staggered vibrations deviate substantially from those of common vibrations, a discrepancy hypothesized to result from the impact of connection gaps during the assembly process as well as the frication between the staggered components. The longitudinal mode shape distribution, derived from the harmonic response analysis, provides further insights. Specifically, the analysis reveals that when the staggered vibration frequency is less than the common vibration frequency, the excitation frequency of 17.52 kHz is identified as the operational frequency for generating staggered vibrations.
In the context of an applied driving voltage of 300 volts and an excitation frequency of 17.52 kHz, the ultrasonic penetrator, arranged in a staggered configuration, demonstrated longitudinal vibration outputs of 64.535 micrometers and 16.735 micrometers at the two output surfaces, designated as A and B, respectively. The harmonic vibrations exhibited a phase difference of 180° at surfaces A and B, as illustrated in Figure 15, resulting in staggered impacts. Nevertheless, the observed vibration amplitudes exhibited substantial discrepancies from the simulation outcomes. These discrepancies are hypothesized to be attributable to assembly inaccuracies and the effects of clamping.
In the context of an applied driving voltage of 300 volts and an excitation frequency of 18.71 kHz, the staggered ultrasonic penetrator generated longitudinal vibration outputs of 28.64 micrometers and 13.536 micrometers at output surfaces A and B, respectively, as depicted in Figure 16. It was observed that, at the aforementioned excitation frequency, surfaces A and B did not generate staggered impacts. Instead, these surfaces produced impacts in the same direction and phase.

4.3. Experimental Study on Staggered Impact Ultrasonic Penetrator Sampler

The objective of this study was to assess the penetration performance of the staggered impact ultrasonic drill. To that end, a testing platform for the ultrasonic penetrator was established. The penetration objects are simulated moon soil with varying water content at low temperatures, and the relevant parameters are shown in Table 2.
The ultrasonic penetrator, with its staggered impact design, was utilized in the simulation of lunar soil. During this process, the ultrasonic penetrator was driven at a frequency of 17.52 kHz, with a peak driving voltage of 300 V, a peak driving current of 0.5 A, and an energy consumption of approximately 100 W. The ultrasonic penetrator was utilized to penetrate the simulated lunar soil with a staggered impact ultrasonic penetrator. During the penetration process, the penetrator employed the staggered action of two core extraction tubes to expel rock debris.

4.3.1. Penetration Experiment with Different Moisture Contents

Penetration sampling experiments were conducted on simulated lunar regolith samples with varying moisture content. Following the preparation stage, the moisture-simulated lunar regolith was stored at a low temperature of −16 °C for a period of 6 h. The experiments were conducted under conditions of a driving voltage of 300 V and a drilling pressure of 5 N. The mean penetration depth as a function of time was obtained from multiple trials, as illustrated in Figure 17.
At the initial state, indicated by the time t = 0, the prototype was found to be in a fixed position that was in contact with the surface of the simulated lunar regolith. This resulted in a penetration depth of 0. As the experiment was initiated at time t = 1 s, the apparatus penetrated to a corresponding depth under the applied drilling pressure. Thereafter, the staggered impact sampler continued to penetrate with its output of staggered vibrations.
The hardness of simulated lunar regolith is known to increase with elevated moisture content at low temperatures. At the inception of the experiment, at t = 1 s, it was observed that greater moisture content resulted in shallower penetration depths. Specifically, the dry regolith demonstrated an initial penetration depth of 3 mm, while the regolith with 5% moisture content only penetrated to a depth of 1 mm. As time progressed, the penetration depth of regolith with varying moisture contents exhibited an increase; however, concomitantly, the resistance encountered during penetration also increased. As a consequence, the penetration rate decreased over time, defined as the displacement per unit time (see Figure 1). After 900 s, the change in depth became less pronounced for the regolith sample with 5% moisture content.

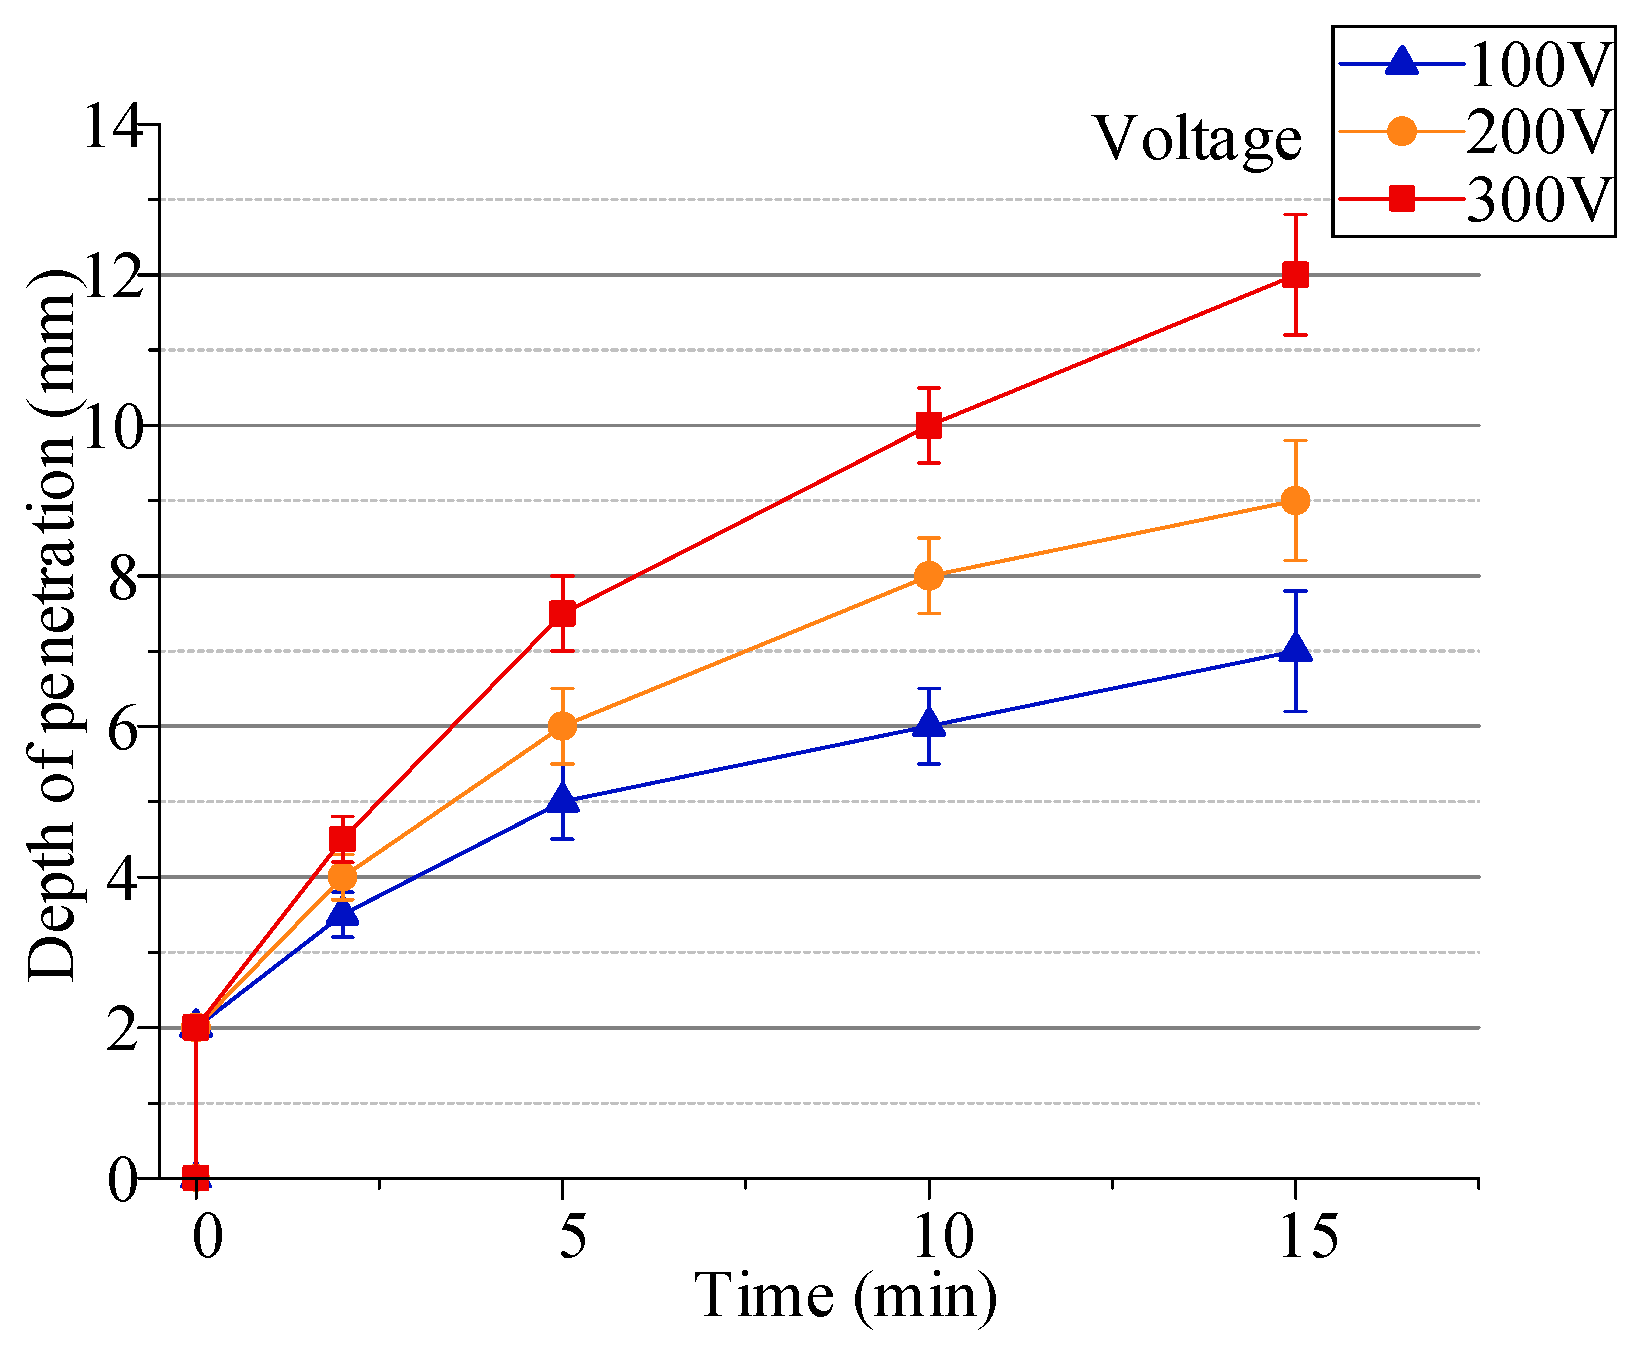
4.3.2. Penetration Experiment with Different Driving Voltages

As the penetrator is subjected to varying input voltages, its penetration depth increases over time, as illustrated in Figure 18. The penetration rate undergoes a gradual decrease with increasing depth. It is evident that higher input voltages result in both greater initial penetration depths and faster penetration rates, ultimately leading to deeper overall penetration.

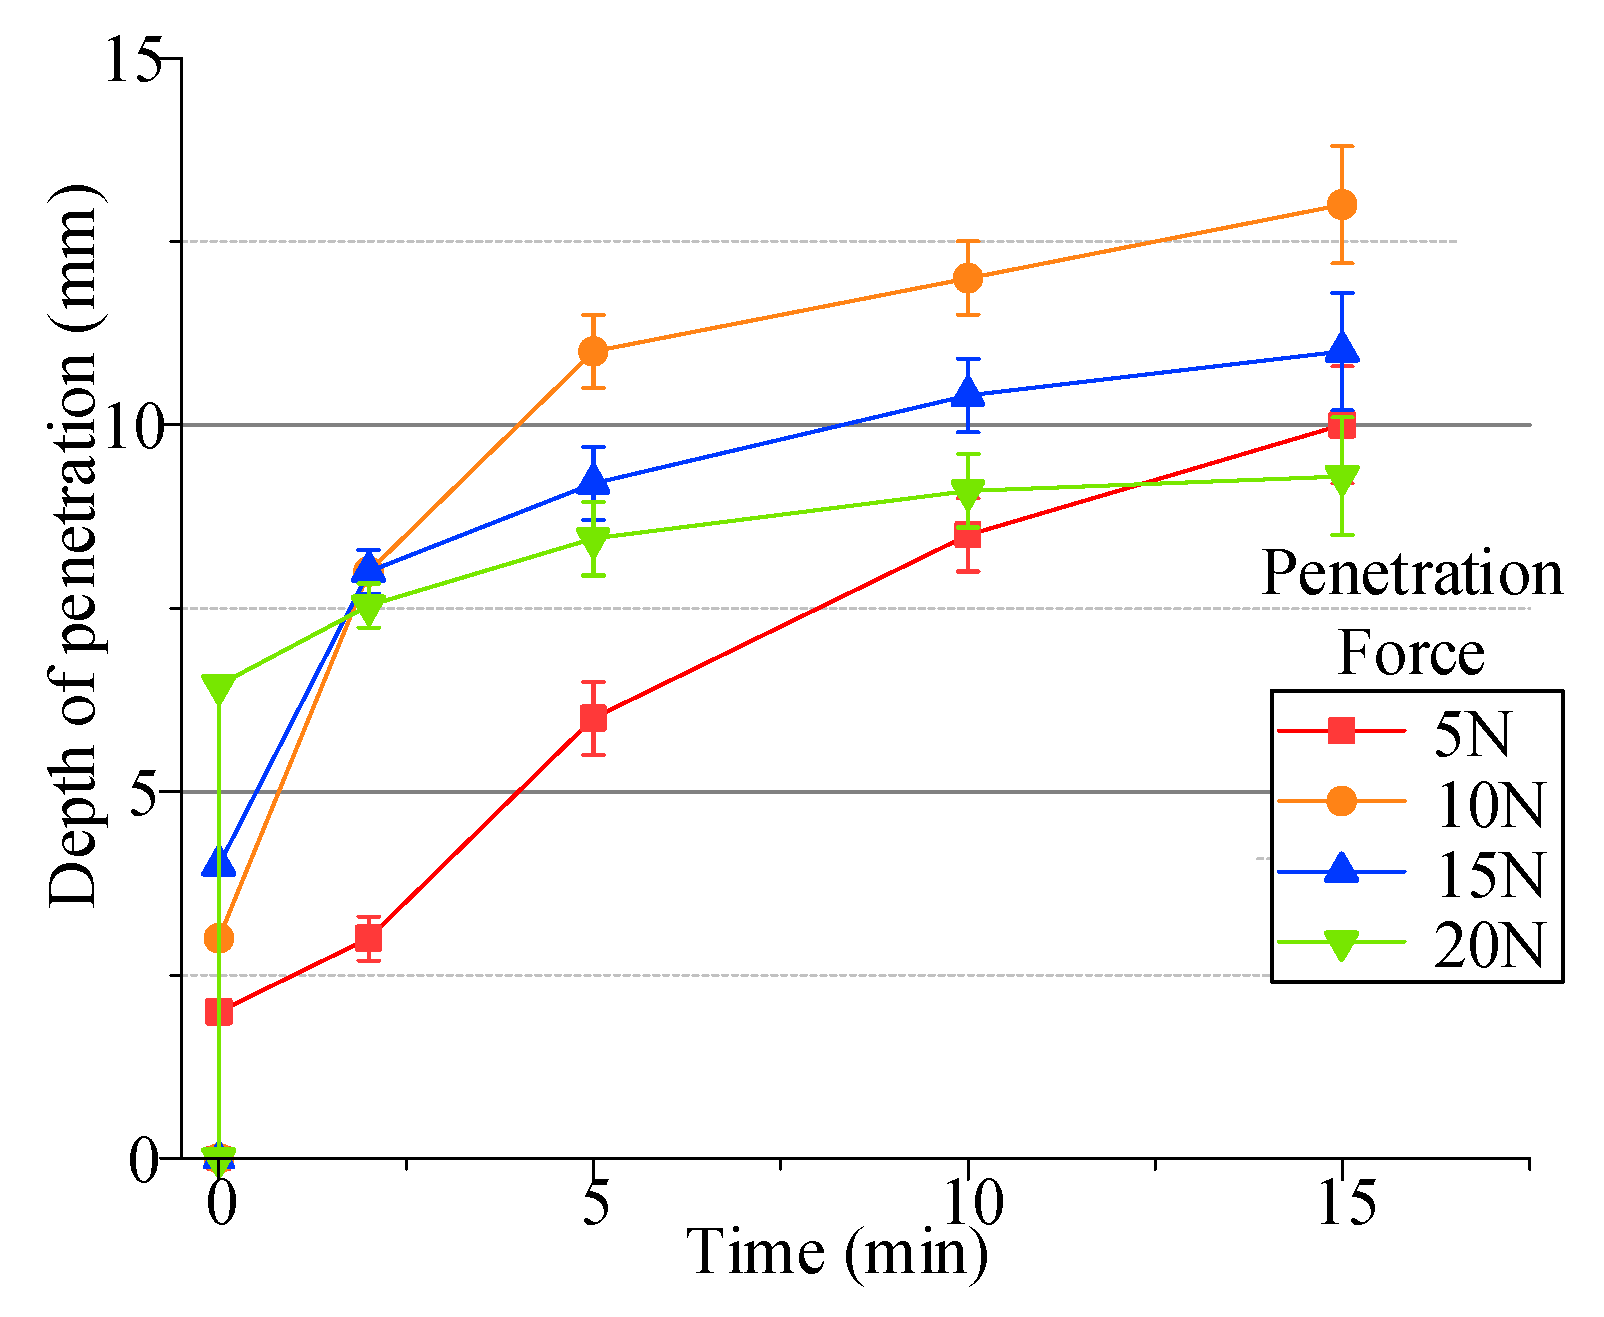
4.3.3. Penetration Experiment with Different Penetration Pressures

In the simulation of lunar regolith with a moisture content of 2.5%, a vertical testing platform was utilized to adjust the load and apply different penetration pressures to the upper surface of the penetrator, with an input voltage of 300 V. The impact of drilling pressure on penetration performance was then subjected to thorough analysis, with the results presented in Figure 19. During the preliminary phase of the experiment (specifically at t = 1 s), the penetrator exhibited a certain degree of displacement under various penetration pressures. It was observed that the initial penetration depth exhibited a direct proportionality to the applied pressure. Specifically, at a drilling pressure of 20 Newtons (N), the initial penetration reached 6.3 millimeters (mm), whereas at a pressure of 5 N, the initial penetration was only 2 mm. However, it was observed that excessively high pressures were detrimental to penetration. Such pressures inhibited the vibrations of the ultrasonic transducer, resulting in reduced output amplitude from the penetrator. Consequently, the penetration depth after three minutes of sampling was lower than that achieved at pressures of 10 N and 15 N, with the penetration rate being the lowest among the various pressures tested (see Figure 19). The optimal penetration performance was observed at a pressure of 10 N, achieving a depth of 13 mm after 15 min and reaching a stable depth of 15 mm after 30 min. The penetration rate at 15 N demonstrated the second highest level of performance, reaching a depth of 11.5 mm after 15 min and exhibiting only a marginal increase to 13.5 mm after 25 min. The penetration rate at a pressure of 5 N exhibited the greatest stability, demonstrating no substantial decline in penetration speed within the depth range of 0–10 mm.
In the course of the testing process, a scenario may emerge in which moon soil particles penetrate the gap of the penetrator, thereby significantly impacting the operational integrity of the equipment. To address this concern, the penetrator’s gap is coated with a lubricant, thereby impeding the intrusion of the moon soil particles. As demonstrated in Figure 20, the penetration sampling effect of a specific quantity of lunar soil samples was obtained after 20 min with a 12 N drilling pressure and 300 V input when the test object was a simulated lunar soil sample with 2.5% water content.

5. Conclusions

In this study, the authors propose and assess the performance of a novel sandwich-type interleaved impact piezoelectric actuator. This actuator utilizes the dual-sided vibration of a piezoelectric stack to output interleaved motion at differing phases. The rotary piezoelectric actuator under consideration functions by amplifying a portion of the longitudinal vibrations generated by the piezoelectric stack through two amplitude transformation rods and outputting them to the same plane. This process drives the tip of the penetrator to produce longitudinal impacts at varying phases. To identify the structural dimensions of the transducer that significantly affect the modal transformation effect, modal analysis and harmonic response analysis were conducted. Multiple experiments were conducted to validate the vibration and output characteristics of the prototype. The results of these experiments demonstrated that the actuator can achieve interleaved vibrations at an optimal excitation frequency of 17.52 kHz. The prototype demonstrated longitudinal vibration outputs of 64.535 micrometers and 16.735 micrometers, respectively, under a preload of 55 Nm. These findings suggest that the novel ultrasonic interleaved impact transducer could have potential applications in the sampling of moisture-containing lunar regolith. Subsequent research endeavors will prioritize the enhancement of the efficiency, improvement, and application of this piezoelectric transducer.

Author Contributions

Conceptualization, Y.W.; methodology, Y.W.; data curation, Z.Y.; writing —original draft preparation, Z.Y.; visualization, C.D. and S.Y.; software, C.D. and G.T.; supervision, F.L. and W.Z.; investigation, F.L. and Z.G.; resources, W.Z. and S.Y.; writing—review and editing, L.Z.; validation, G.T. All authors have read and agreed to the published version of the manuscript.

Funding

The author thanks the anonymous reviewers for their critical and constructive review of the manuscript. This study was supported by the National Major Engineering Key Technology R&D Program.

Data Availability Statement

The data that support the findings of this study are available from the corresponding authors upon reasonable request.

Conflicts of Interest

The authors declare no conflicts of interest. The funders had no role in the design of the study; in the collection, analyses, or interpretation of data; in the writing of the manuscript; or in the decision to publish the results.

References

  1. Zou, Y.T.; Ouyang, Z.Y.; Xu, L.; Liu, J.J.; Xu, T. Lunar surface environmental characteristic. Quat. Sci. 2002, 06, 533–539. [Google Scholar]
  2. Watson, K.; Murray, B.C.; Brown, H. The behavior of volatiles on the lunar surface. J. Geophys. Res. 1961, 66, 3033–3045. [Google Scholar] [CrossRef]
  3. Xu, L.; Liu, J.Z.; Zou, Y.L.; Li, C.L. Detection and significance of water ice on the lunar surface. J. Space Sci. 2003, 23, 42–49. [Google Scholar]
  4. Li, S.; Lucey, P.G.; Milliken, R.E.; Hayne, P.O.; Fisher, E.; Williams, J.P.; Hurley, D.M.; Elphic, R.C. Direct evidence of surface exposed water ice in the lunar polar regions. Proc. Natl. Acad. Sci. USA 2018, 115, 8907. [Google Scholar] [CrossRef] [PubMed]
  5. Chandani, S.; Shashi, K.; Himanshu, G.; Shovan, L. Integrated Analysis of Water Ice Detection in Erlanger Crater, Lunar North Pole: Insights from Chandrayaan-1 Mini-SAR and Chandrayaan-2 DFSAR Data. Remote Sens. 2025, 17, 31. [Google Scholar]
  6. Wang, Y.L.; Liu, G.F.; Yang, J. Progress in lunar and deep air quantum (water ice) exploration. Nucl. Electron. Detect. Technol. 2011, 31, 614–618. [Google Scholar]
  7. Meng, Z.G.; Chen, S.B.; Wang, Z.J.; Cui, T.F. Study on water ice content of lunar Cabeus impact crater based on microwave radiometer data of Chang’e-1 satellite. Sci. China Phys. Mech. Astron. 2010, 40, 1363–1369. [Google Scholar]
  8. Xie, H.P.; Zhang, G.Q.; Luo, T.; Gao, M.Z.; Li, C.B.; Liu, T. Concept and design of lunar large-depth fidelity coring robot system. Adv. Eng. Sci. Gongcheng Kexue Yu Jishu 2020, 52, 1–9. [Google Scholar]
  9. Sherrit, S.; Dolgin, B.P.; Bar-Cohen, Y. Modeling of horns for sonic/ultrasonic applications. In Proceedings of the IEEE International Ultrasonics Symposium, Tahoe, NV, USA, 17–20 October 1999; Volume 1, pp. 647–651. [Google Scholar]
  10. Bar-Cohen, Y.; Sherrit, S.; Bao, X.Q.; Badescu, M.; Aldrich, J.; Chang, Z. Subsurface sampler and sensors platform using the ultrasonic/sonic driller/corer (USDC). Sens. Smart Struct. Technol. Civ. Mech. Aerosp. Syst. 2007, 6529, 173–180. [Google Scholar]
  11. Bai, D.; Deng, S.; Li, Y.; Li, H. A Novel Inchworm Piezoelectric Actuator with Rhombic Amplification Mechanism. Sens. Actuators A Phys. 2023, 360, 114515. [Google Scholar] [CrossRef]
  12. Bai, D.; Li, Y.; Quan, Q.; Tang, D.; Deng, Z. Development of a Rotary-Percussive Ultrasonic Drill Using a Bolt-Clamped Type Piezoelectric Actuator. Adv. Space Res. 2023, 71, 5360–5368. [Google Scholar] [CrossRef]
  13. Wang, Y.C.; Quan, Q.Q.; Yu, H.Y.; Li, H.; Bai, D.E.; Deng, Z.Q. Impact Dynamics of a Percussive System Based on Rotary-Percussive Ultrasonic Drill. Shock Vib. 2017, 2017, 5161870. [Google Scholar] [CrossRef]
  14. Li, X.; Harkness, P.; Worrall, K.; Timoney, R.; Lucas, M. A parametric study for the design of an optimized ultrasonic percussive planetary drill tool. IEEE Trans. Ultrason. Ferroelectr. Freq. Control 2016, 64, 577–589. [Google Scholar] [CrossRef]
  15. Wang, Y.C.; Quan, Q.Q.; Yu, H.Y.; Li, H.; Bai, D.E.; Deng, Z.Q. A kind of rotary percussion ultrasonic drill driven by a single piezoelectric stack. J. Beijing Univ. Aeronaut. Astronaut. 2018, 44, 1850–1859. [Google Scholar]
  16. Li, H.; Quan, Q.Q.; Wang, X.J.; Jiang, S.Y.; Deng, Z.Q. Development of a Martian rock driller based on piezoelectric drive. J. Deep Space Explor. 2016, 3, 156–161. [Google Scholar]
  17. Barcohen, Y.; Chang, Z.; Sherrit, S.; Badescu, M.; Bao, X. The ultrasonic/sonic driller/corer (USDC) as a subsurface drill, sampler, and lab-on-a-drill for planetary exploration applications. In Proceedings of the Smart Structures and Materials 2005: Industrial and Commercial Applications of Smart Structures Technologies, San Diego, CA, USA, 7–10 March 2005; SPIE: Bellingham, WA, USA; Volume 5762, pp. 152–159. [Google Scholar]
  18. Bar-Cohen, Y.; Sherrit, S.; Bao, X.; Chang, Z. Ultrasonic/sonic sampler and sensor platform for in-situ planetary exploration. In Proceedings of the International Conference on MEMS, NANO and Smart Systems, Banff, AB, Canada, 20–23 July 2003; pp. 22–31. [Google Scholar]
  19. Thomas, P.N.H. Magna Parva and ESA’s ultrasonic drill tool for planetary surface exploration. In Proceedings of the Earth and Space 2010: Engineering, Science, Construction, and Operations in Challenging Environments, Honolulu, HI, USA, 14–17 March 2010; pp. 1235–1245. [Google Scholar]
  20. Khmelev, V.N.; Khmelev, S.S.; Khmelev, M.V.; Levin, S.V.; Kuzovnikov, Y.M. Development of ultrasonic specifically drilling technology and improvement of construction of ultrasonic machine tools. In Proceedings of the IEEE International Conference & Seminar of Young Specialists on Micro/Nanotechnologies & Electron Devices, Altai, Russia, 2–6 July 2012; pp. 2–6. [Google Scholar]
  21. Li, H.; Wei, M.; Zhang, Z.; Shen, Y.; Aimaiti, B.; Wang, G.; Li, L.; Gao, K.; Zeng, Q. Design and Experimental Verification of an Underwater Ultrasonic Drill for Rock Exploration. Ocean Eng. 2024, 294, 116824. [Google Scholar] [CrossRef]
  22. Li, J.; Deng, J.; Liu, Y.X.; Yu, H.; Tian, X.; Li, K. A linear piezoelectric actuator based on working principle of three-petal mouth of a rabbit. IEEE Trans. Ind. Electron. 2022, 69, 5091–5099. [Google Scholar] [CrossRef]
  23. Liu, Y.; Shi, S.; Li, C.; Chen, W.; Liu, J. A novel standing wave linear piezoelectric actuator using the longitudinal-bending coupling mode. Sens. Actuators A Phys. 2016, 251, 119–125. [Google Scholar] [CrossRef]
  24. Mashimo, T. Scaling of piezoelectric ultrasonic motors at submillimeter range. IEEE/ASME Trans. Mechatron. 2017, 22, 1238–1246. [Google Scholar] [CrossRef]
  25. Kanada, A.; Mashimo, T. Design and experiments of flexible ultrasonic motor using a coil spring slider. IEEE/ASME Trans. Mechatron. 2019, 25, 468–476. [Google Scholar] [CrossRef]
  26. Yu, H.P.; Quan, Q.Q.; Tian, X.Q.; Li, H. Optimization and analysis of a u-shaped linear piezoelectric ultrasonic motor using longitudinal transducers. Sensors 2018, 18, 809. [Google Scholar] [CrossRef]
  27. Zhang, J.T.; Zhu, H.; Zhou, S.Q.; Zhao, C.S. Optimal design of a rod shape ultrasonic motor using sequential quadratic programming and finite element method. Finite Elem. Anal. Des. 2012, 59, 11–17. [Google Scholar] [CrossRef]
  28. Badescu, M.; Kassab, S.; Sherrit, S.; Aldrich, J.; Bao, X.; Bar-Cohen, Y.; Chang, Z. Ultrasonic/sonic driller/corer as a hammer-rotary drill. Sens. Smart Struct. Technol. Civ. Mech. Aerosp. Syst. 2007, 6529, 289–295. [Google Scholar]
  29. Badescu, M.; Sherrit, S.; Bao, X.; Bar-Cohen, Y.; Chen, B. Auto-Gopher a wire-line rotary-hammer ultrasonic drill. Sens. Smart Struct. Technol. Civ. Mech. Aerosp. Syst. 2011, 7981, 1098–1105. [Google Scholar]
  30. Badescu, M.; Bar-Cohen, Y.; Sherrit, S.; Bao, X.; Chang, Z.; Donnelly, C.; Aldrich, J. Percussive augmenter of rotary drills (PARoD). Sens. Smart Struct. Technol. Civ. Mech. Aerosp. Syst. 2012, 8345, 167–174. [Google Scholar]
  31. Domm, L.N. Development of a Piezoelectric Rotary Hammer Drill. In NASA USRP-Internship Final Report; 2011. Available online: https://ntrs.nasa.gov/citations/20150005822 (accessed on 13 April 2025).
  32. Potthast, C.; Twiefel, J.; Wallaschek, J. Modelling approaches for an ultrasonic percussion drill. J. Sound Vib. 2007, 308, 405–417. [Google Scholar] [CrossRef]
  33. Bai, D.; Quan, Q.; Tang, D.; Deng, Z. Design and experiments of a novel rotary piezoelectric actuator using longitudinal-torsional convertors. IEEE Access 2019, 7, 22186–22195. [Google Scholar] [CrossRef]
  34. Neumann, N.; Sattel, T.; Wallaschek, J. On set-oriented numerical methods for global analysis of non-smooth mechanical systems. J. Vib. Control 2007, 13, 1393–1405. [Google Scholar] [CrossRef]
  35. Neumann, N.; Sattel, T. Set-oriented numerical analysis of a vibro-impact drilling system with several contact interfaces. J. Sound Vib. 2007, 308, 831–844. [Google Scholar] [CrossRef]
Figure 1. Schematic diagram.
Aerospace 12 00358 g001
Figure 2. Staggered ultrasonic penetrating coring working schematic. (a) Positive Voltage Operating Mode. (b) Negative voltage operating mode.
Aerospace 12 00358 g002
Figure 3. Structural composition and size parameters of staggered piezoelectric transducer. (a) Device structure diagram. (b) Device sectional view. (c) Variable amplitude rod schematic diagram. (d) Core tube schematic diagram. (e) Reversing cover schematic diagram. (f) Reversing column schematic diagram. (g) Piezoelectric stack structure diagram.
Aerospace 12 00358 g003
Figure 4. Staggered vibration frequency–size variation relationship.
Aerospace 12 00358 g004
Figure 5. The amplitude–size variation relationship of the A-plane of staggered vibration.
Aerospace 12 00358 g005
Figure 6. Staggered vibration B-plane amplitude–size variation relationship.
Aerospace 12 00358 g006
Figure 7. Longitudinal mode diagram after structural adjustment.
Aerospace 12 00358 g007
Figure 8. Staggered vibration vector diagram at 12,581 Hz.
Aerospace 12 00358 g008
Figure 9. Co-directional longitudinal vector diagram at 16,167 Hz.
Aerospace 12 00358 g009
Figure 10. Longitudinal sweep pattern of forward impact A.
Aerospace 12 00358 g010
Figure 11. Longitudinal sweep pattern of reverse impact B-plane.
Aerospace 12 00358 g011
Figure 12. Ultrasonic sampler prototype.
Aerospace 12 00358 g012
Figure 13. Experimental equipment and measuring devices. (a) Signal generator and power amplifier. (b) Ultrasonic sample. (c) Laser displacement sensors.
Aerospace 12 00358 g013
Figure 14. Amplitude variation plots of surfaces A and B under different frequency excitation. (a) A-side amplitude–excitation frequency. (b) B-side amplitude–excitation frequency.
Aerospace 12 00358 g014
Figure 15. Vibration of the A and B planes at a frequency of 17.52 kHz. (a) A-side and B-side location description. (b) Amplitude diagram.
Aerospace 12 00358 g015
Figure 16. Vibration characteristics of surfaces A and B at a frequency of 18.71 kHz. (a) A-side and B-side location description. (b) Amplitude diagram.
Aerospace 12 00358 g016
Figure 17. Penetration effect with different moisture content.
Aerospace 12 00358 g017
Figure 18. Penetration depth with different input voltages as a function of time.
Aerospace 12 00358 g018
Figure 19. Relationship between penetration depth and time under different drilling pressures.
Aerospace 12 00358 g019
Figure 20. Sampling results.
Aerospace 12 00358 g020
Table 1. Structural parameter dimensions.
Simulation ParametersValue/mmSimulation ParametersValue/mm
D135l326.4
D216l44
D329l55
D45.6l61.5
r110.6l77.5
r26l83
r317.5l920
l14h21.5
l211t3
Table 2. Simulated lunar soil parameters.
DensitiesElastic ModulusParticle Size DistributionCohesionIce-Cementation Strength
2630 kg/m310 GPaBasalt simulating lunar soil: 1~300 μm;
Slanty plagioclase simulating lunar soil: 5~500 μm
12.3 kPa8.5 MPa
Disclaimer/Publisher’s Note: The statements, opinions and data contained in all publications are solely those of the individual author(s) and contributor(s) and not of MDPI and/or the editor(s). MDPI and/or the editor(s) disclaim responsibility for any injury to people or property resulting from any ideas, methods, instructions or products referred to in the content.

