Article

Characterization of 3D Displacement and Stress Fields in Coal Based on CT Scans

1
Department of Mining Engineering, Shanxi Institute of Energy, Jinzhong 030600, China
2
College of Safety and Emergency Management Engineering, Taiyuan University of Technology, Taiyuan 030024, China
3
State Key Laboratory of Coal Mine Safety Technology, CCTEG Shenyang Research Institute, Fushun 113000, China
*
Author to whom correspondence should be addressed.
Mathematics 2022, 10(14), 2512; https://doi.org/10.3390/math10142512
Submission received: 1 June 2022 / Revised: 16 July 2022 / Accepted: 18 July 2022 / Published: 19 July 2022
(This article belongs to the Special Issue Mathematical Problems in Rock Mechanics and Rock Engineering)

Abstract

:
Computed tomography (CT) scans were performed on samples of an outburst-prone coal seam at different loading stages. The area and roundness of the CT images were used to quantify the degree of the coal macroscopic deformation under different loads. A spatial matching algorithm was used to calculate the three-dimensional (3D) displacement fields of different regions of interest (ROIs, containing primary fractures, minerals, and only coal) under different loads. The presence of fractures and minerals were found to promote and inhibit displacement, respectively, and the 3D displacement field data followed a normal distribution. A meshfree numerical simulation was used to determine the 3D maximum principal stress, shear stress and displacement fields under different loads. The following results were obtained: fractures and minerals significantly affect the stress state and displacement field distribution features, the maximum principal stresses and shear stresses in different matrices differ significantly, and the presence of minerals and fractures induce a prevalent shear stress in coal and make coal prone to stress concentration.

1. Introduction

Coal is typically anisotropic, and high sample dispersion makes it challenging to determine the deformation features and stress field patterns of raw coal samples. Considering the importance of the stress and deformation fields in analysing coal stability, a computed tomography (CT) scan with a loading function was used to determine the deformation features of coal under different loads in this study. A novel numerical simulation method was applied to a three-dimensional (3D) CT model to analyse the coal stress state.
A variety of experimental and theoretical methods have been used to investigate the internal structure and deformation features of coal over the past few years [1,2,3,4,5,6,7], which has advanced the prevention and control of related hazards. CT scans enable the noncontact nondestructive testing of samples and can be combined with 3D reconstruction techniques to quantitatively analyse the coal mesostructure. Kawakata et al. [8] first used CT to scan the damage state of rock after triaxial loading but the samples were not loaded during the scanning process. Cao et al. [9] analysed the fracture evolution and seismic response features of hydraulic fracturing under triaxial loading conditions and performed CT scans to quantitatively characterise pre-existing and hydraulic fractures. Fan et al. [10] performed threshold segmentation on CT scan data and statistically analysed the pore size distribution, throat radius, throat length, and coordination number of the pore network model. Li et al. [11] experimentally analysed the pore features of coal samples with different bursting proneness by low-temperature nitrogen adsorption and desorption, scanning electron microscopy (SEM) and CT. The results showed that stress exacerbates the complexity of the pore structure. Li et al. [12] used CT to visualize the evolution of the fracture features of coal samples under uniaxial and triaxial loading conditions. Quantitative characterisation of the fractures demonstrated that the grey value, fracture volume and CT porosity can be used to quantitatively evaluate the degree of damage to coal. Lu et al. [13] found using CT scans on coal samples under different load conditions that the expansion of primary fractures and the development of new fractures increase the coal connectivity. Liu et al. [14] analysed the porosity of coal through CT scans and NMR experiments and quantitatively characterised the fractal dimension. Tao et al. [15] analysed the porosity and fracture heterogeneity of coal using a variety of experimental methods (SEM, carbon dioxide and nitrogen adsorption, and CT scans) and proposed an index to quantitatively predict coal macrolithotypes. Wang et al. [16,17,18] used CT scans to analyse the pore structure and seepage features of coal, which were then used to conduct a dynamic water injection simulation analysis. Wu et al. analysed the fractal features of a coal fracture network to find that the porosity is exponentially related to fractal dimension. Zhang et al. [19] used various experimental methods to perform a multiscale characterisation of coal samples of different ranks. The results of the aforementioned studies have revealed the variation features of fractures under stress and the corresponding influence on gas migration.
Wang et al. [20] analysed two-dimensional (2D) CT scan images of coal samples as well as 3D reconstruction models to find that the confining pressure and presence of minerals have significant effects on the features of fracture propagation. Mao et al. [21] compared digital volumetric speckle photographs with the deformation results obtained from CT images to determine the deformation features of coal at different loading stages. Sampath et al. [22] generated a 2D fracture network from CT imaging to study the gas flow and coal deformation process. Roslin et al. [23] used SEM and CT to analyse pore structure and carried out numerical simulation based on the reconstruction model.
The 3D deformation features of coal during different loading processes are investigated in this study. A feature point spatial matching algorithm is used to calculate and analyse the displacement field. A meshfree numerical simulation of the 3D reconstruction model is performed to analyse the 3D stress field and the stress states of different matrices (coal, minerals, and regions near fractures).

2. Materials and Methods

2.1. Sample Preparation

The studied coal samples were taken from the no. 3 coal seam of the Sihe coal mine in Shanxi Province, China. The coal seam is located at the southern end of the Qinshui coalfield and presents an outburst risk. The coal samples were cut into φ25 mm × h50 mm cylinders, of which the end faces were polished to ensure parallelism.

2.2. Experimental Device and Methods

The experimental device consists of a microfocus CT scan system and a triaxial stress-displacement test system. A Vtomex L300 CT scan system with an observation resolution of up to 500 nm was used. The triaxial stress-displacement test system can perform uniaxial and triaxial loading tests on φ25 mm × h50 mm samples, with a maximum axial compression of 100 kN, a maximum confining pressure of 30 MPa, and a loading rate range of 0.1–3 mm/min. The attenuation coefficient of the X-ray intensity and the density of the material satisfy the following equation [24]:
I = I o exp ( μ x )
μ x = ln ( I o / I )
μ dl = ln ( I o / I )
where Io is the initial intensity of the X-ray; I′ is the intensity of the X-ray after passing through the material; μ is the attenuation coefficient of the material; and x is the penetration distance of the ray.
Three sets of phased CT scan tests were performed on the Sihe coal samples under the loading process, with an axial loading rate of 0.2 mm/min and a CT scan resolution of 30 μm. The axial stress–strain data were recorded, and the axial compression was maintained constant during the CT scan.

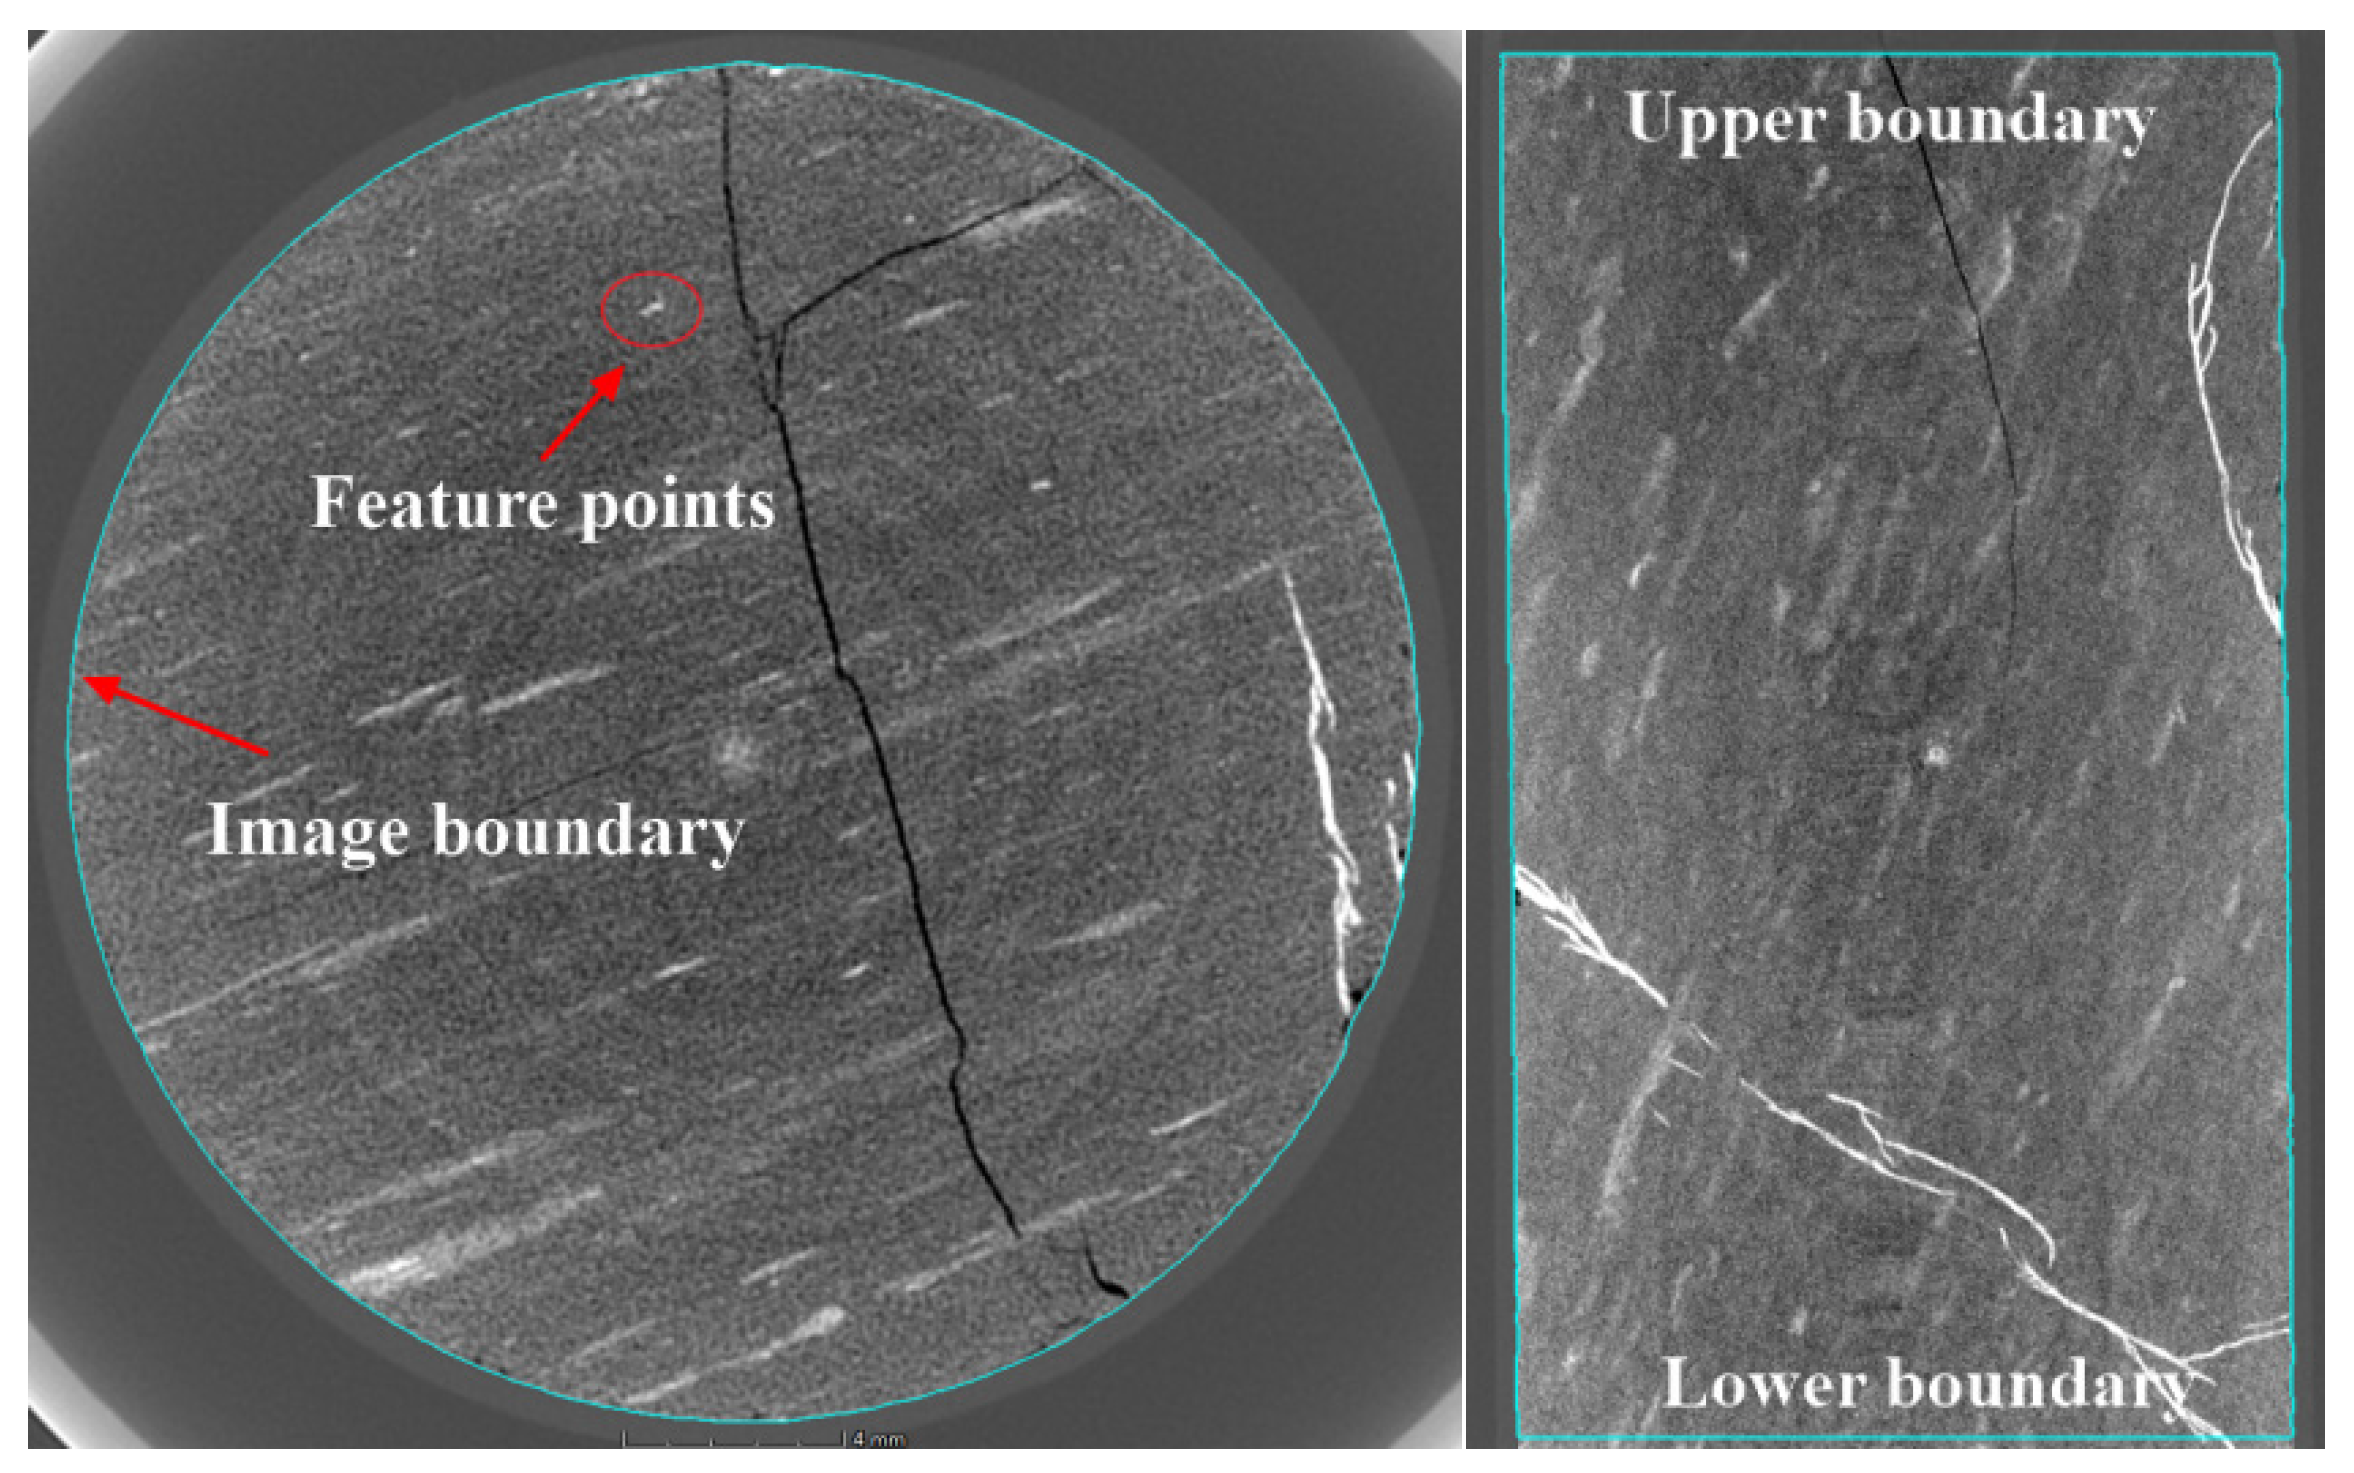
2.3. Boundary Delineation of 3D CT Model

Figure 1 presents CT images showing highly discernible minerals inside the coal. Using the minerals as feature points, the Z-axis position in the CT images was recorded to delineate the upper and lower boundaries of the 3D model. Threshold segmentation was performed on the CT data to determine the boundaries of the 3D model, thus accurately delineating the range of the 3D CT model at each stage.

2.4. Displacement Field Algorithm and ROI Delineation

The feature points were used to select a region of interest (ROI) for the 3D model at each stage, and the 3D displacement field was calculated. A spatial image matching algorithm was used to measure the displacement field of the 3D ROI under different loading conditions with high precision. The ROI was determined to be a cuboid of size 4 mm × 4 mm × 2 mm, considering the computational burden, the size of the fractures and minerals and the excessive number of voxels (more than 1 billion) in the 3D model. Figure 2 shows the selected ROIs, where ROI1, ROI2, and ROI3 correspond to regions containing primary fractures, coal only, and minerals, respectively.

3. Results

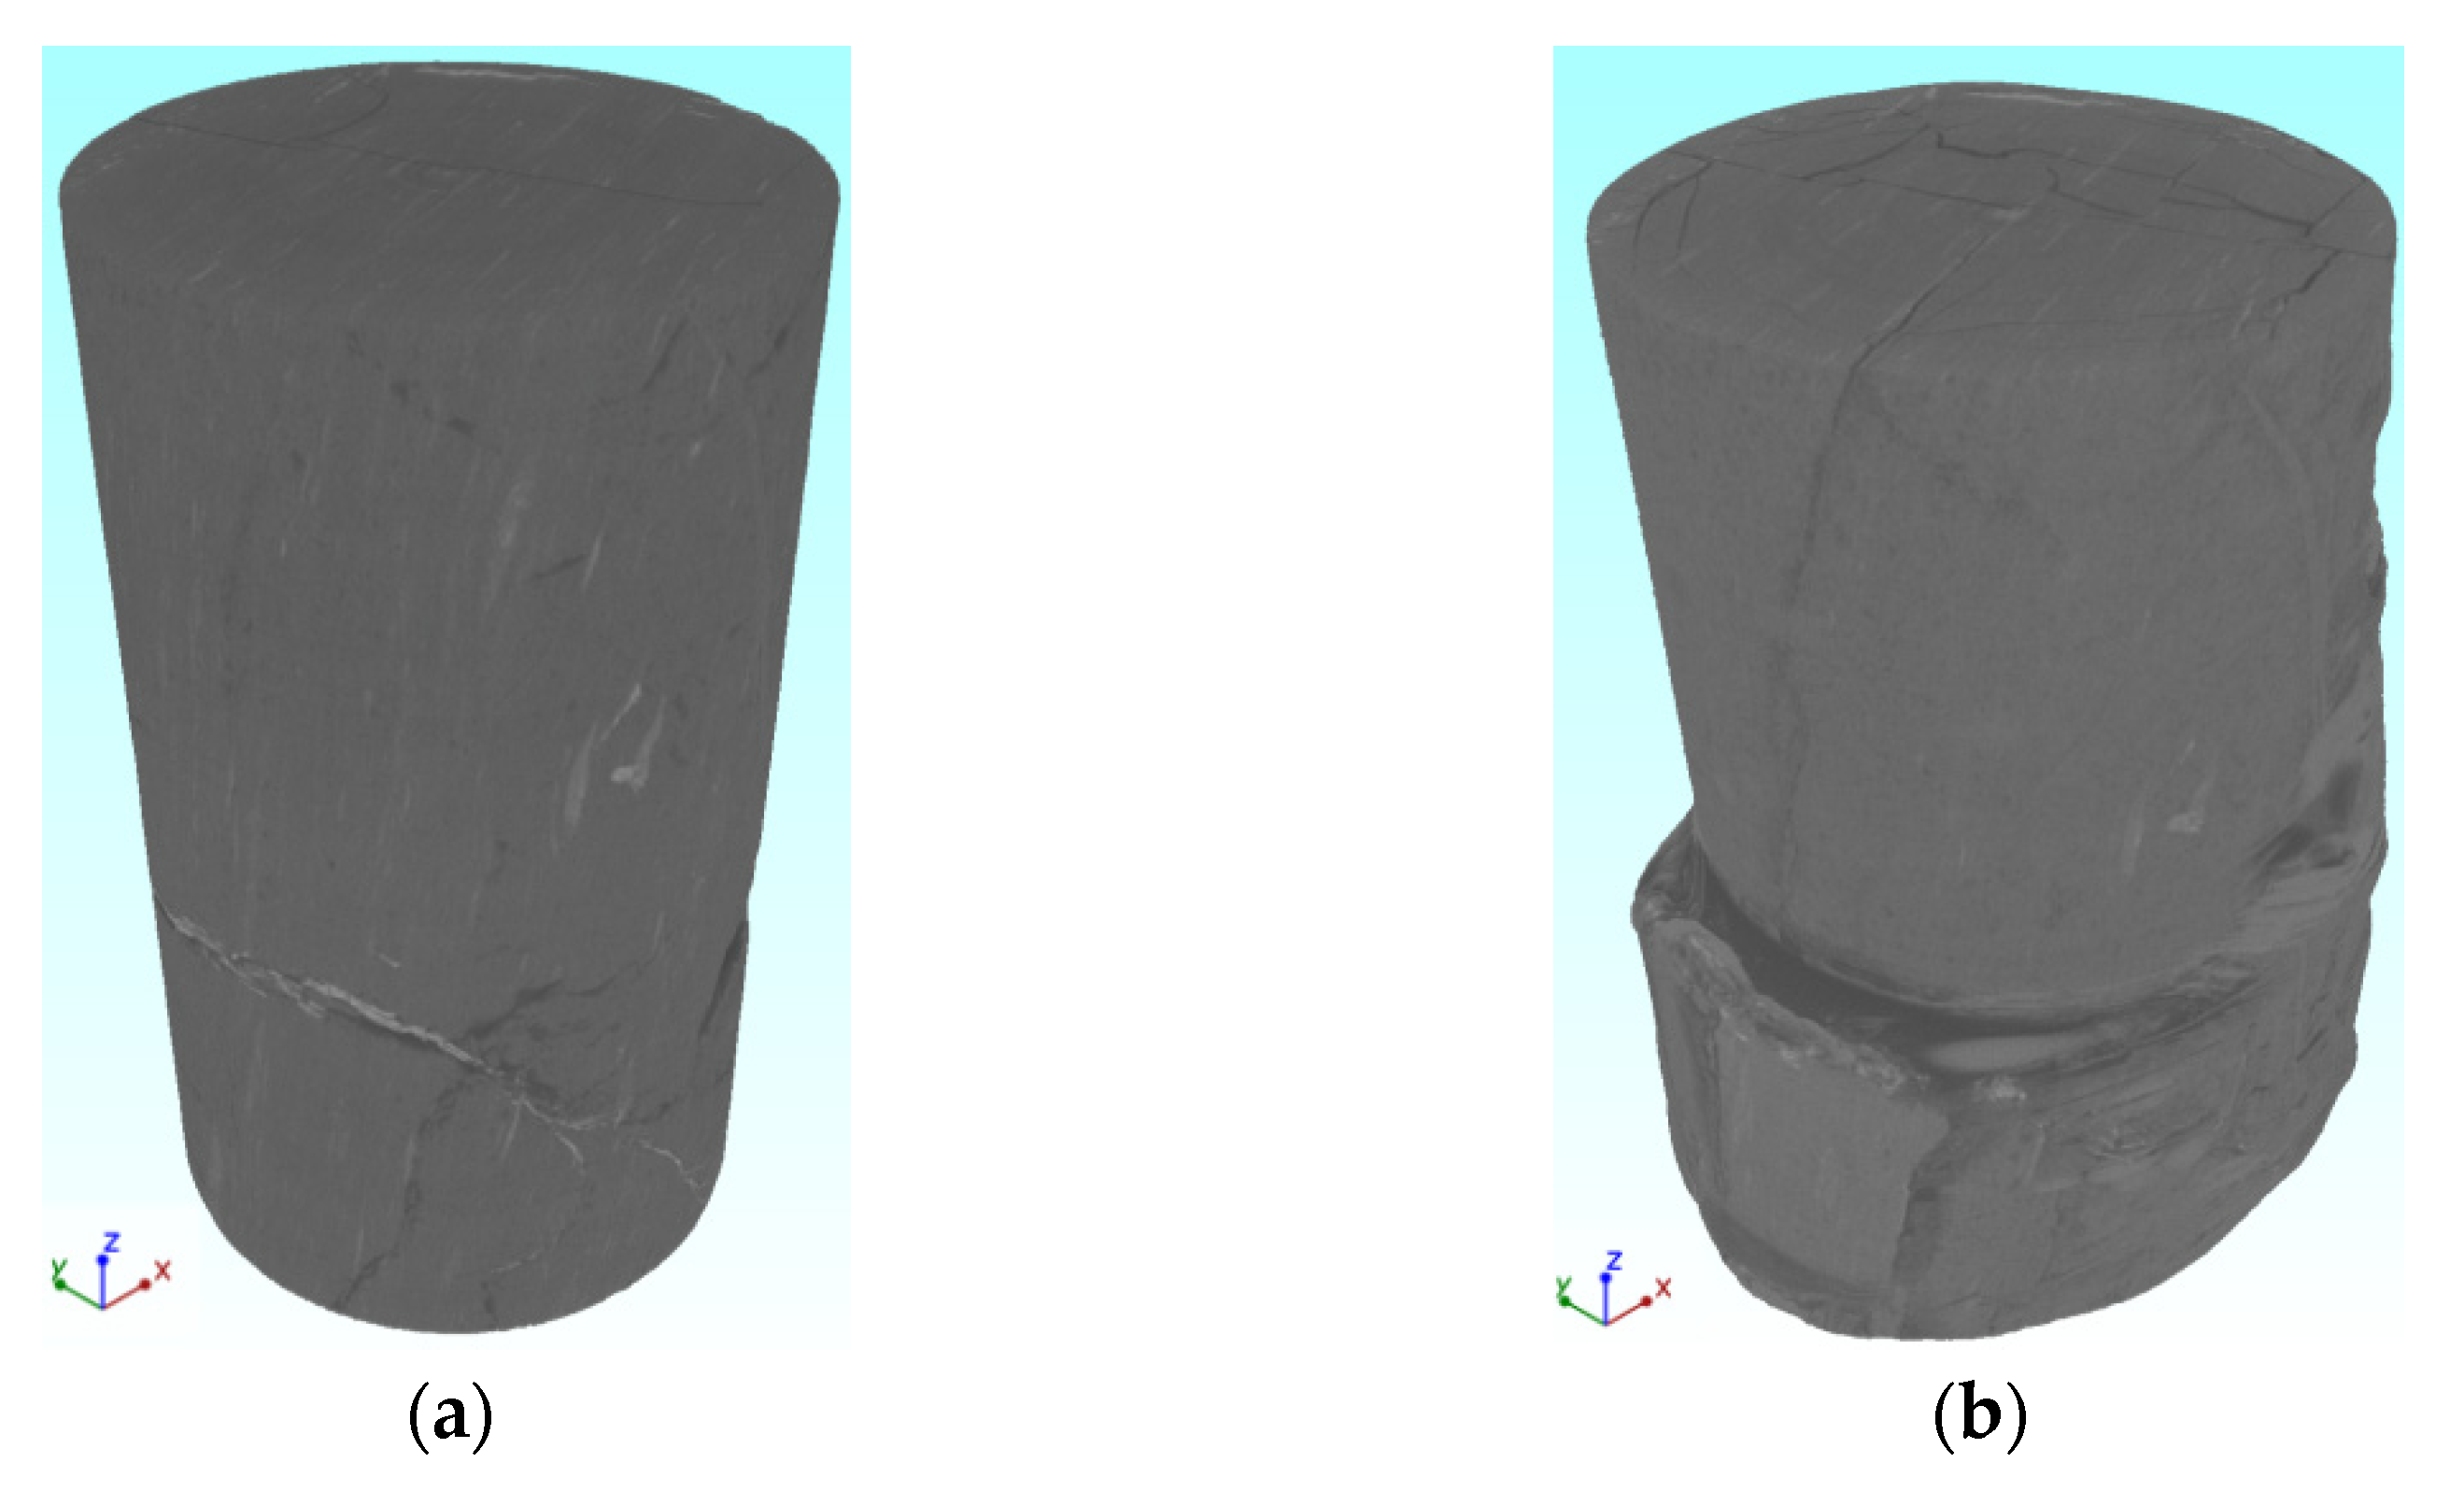
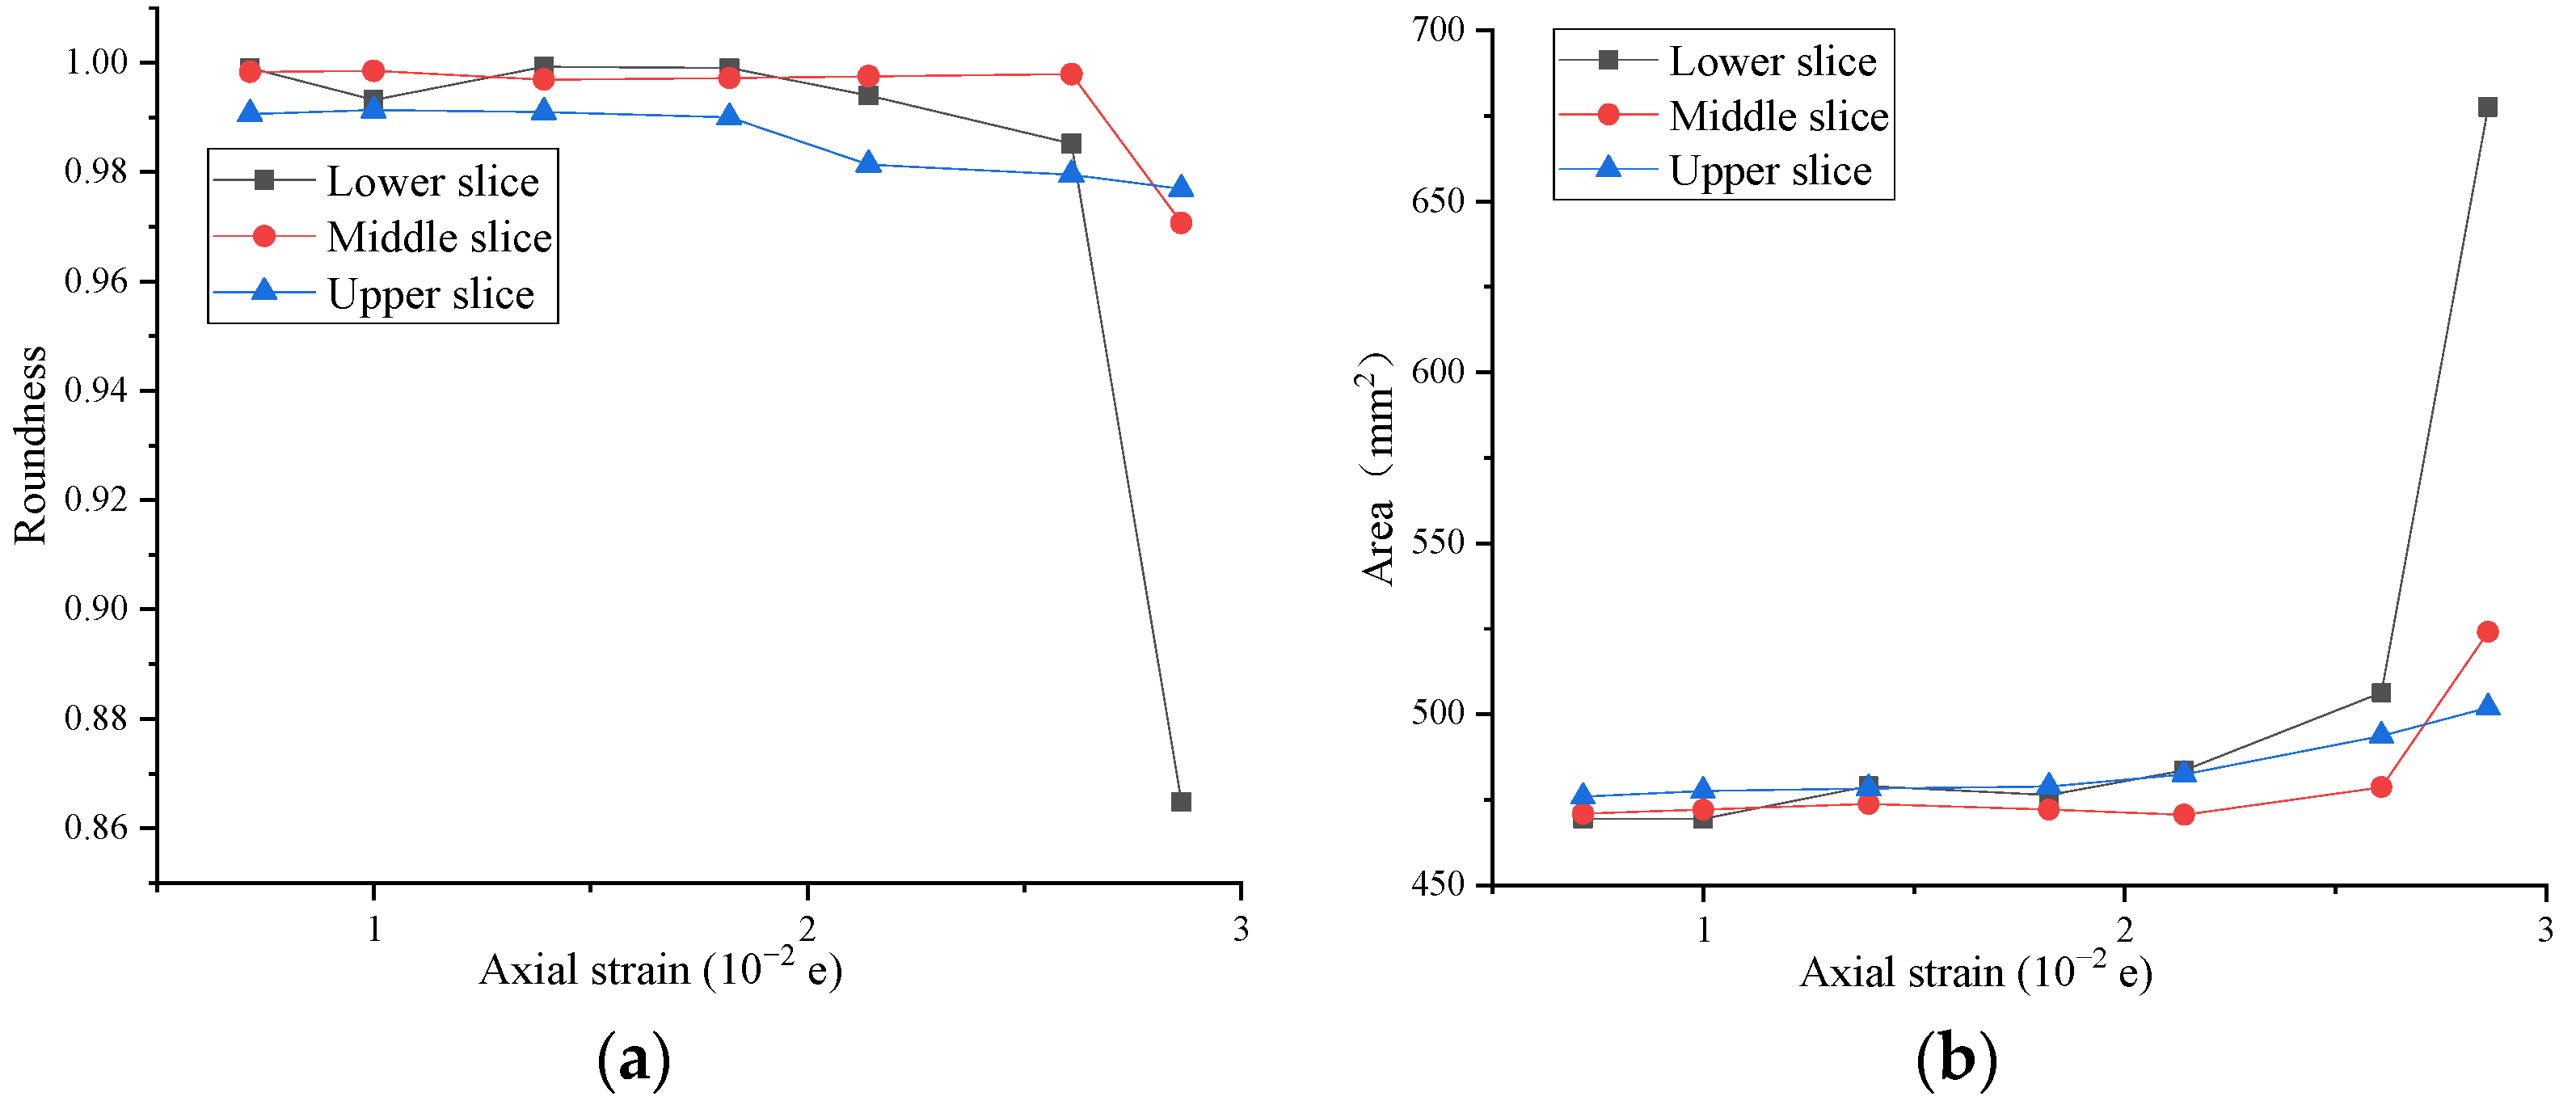
3.1. Deformation and Failure Features

Considering the large volume of data, Sihe sample 1 was analysed in this study.
Figure 3 shows clear anisotropic features for the failure of the sample along the Z-axis at the post-peak stage. Figure 4 shows that the distribution of primary fractures and minerals in the sample had a determining effect on the failure features. Considering the post-peak 3D model in conjunction with the CT images in Figure 3 and Figure 4 shows that a slip instability occurred in the sample along the mineral region. The yellow circles in Figure 4 show the damage in the range containing minerals.
Figure 5 shows the stress–strain curve of Sihe sample 1 at the loading stages corresponding to CT scans and the red numbers correspond to the stages of CT scans.
The CT images of the upper and lower end faces and the middle position at each stage were analysed to determine the changes in area and roundness.
The roundness is calculated as follows:
R = 4 S π × L m a j o r 2
where S is the image area and Lmajor is the length of the major axis of the smallest circumscribed ellipse fitted to the image.
The roundness quantifies the change in the shape of a CT image, indicating the degree of closeness to a perfect circle. A roundness of unity indicates that the image is a perfect circle. In Figure 6, the points of each curve correspond to the loading stage (red dots) in Figure 5.
The calculated roundness was a monotonically decreasing function, and the change in the roundness was generally consistent with the change in the area. The shape and area of each part exhibited a large degree of variation during the instability. The coefficient of variation of the image roundness was calculated to be 0.0473, 0.0097, and 0.0061 for the three slices, that is, the roundness of the lower slice was significantly larger than those of the middle and upper slices. The anisotropy of the deformation and failure features of the sample were very pronounced at the macroscopic scale.

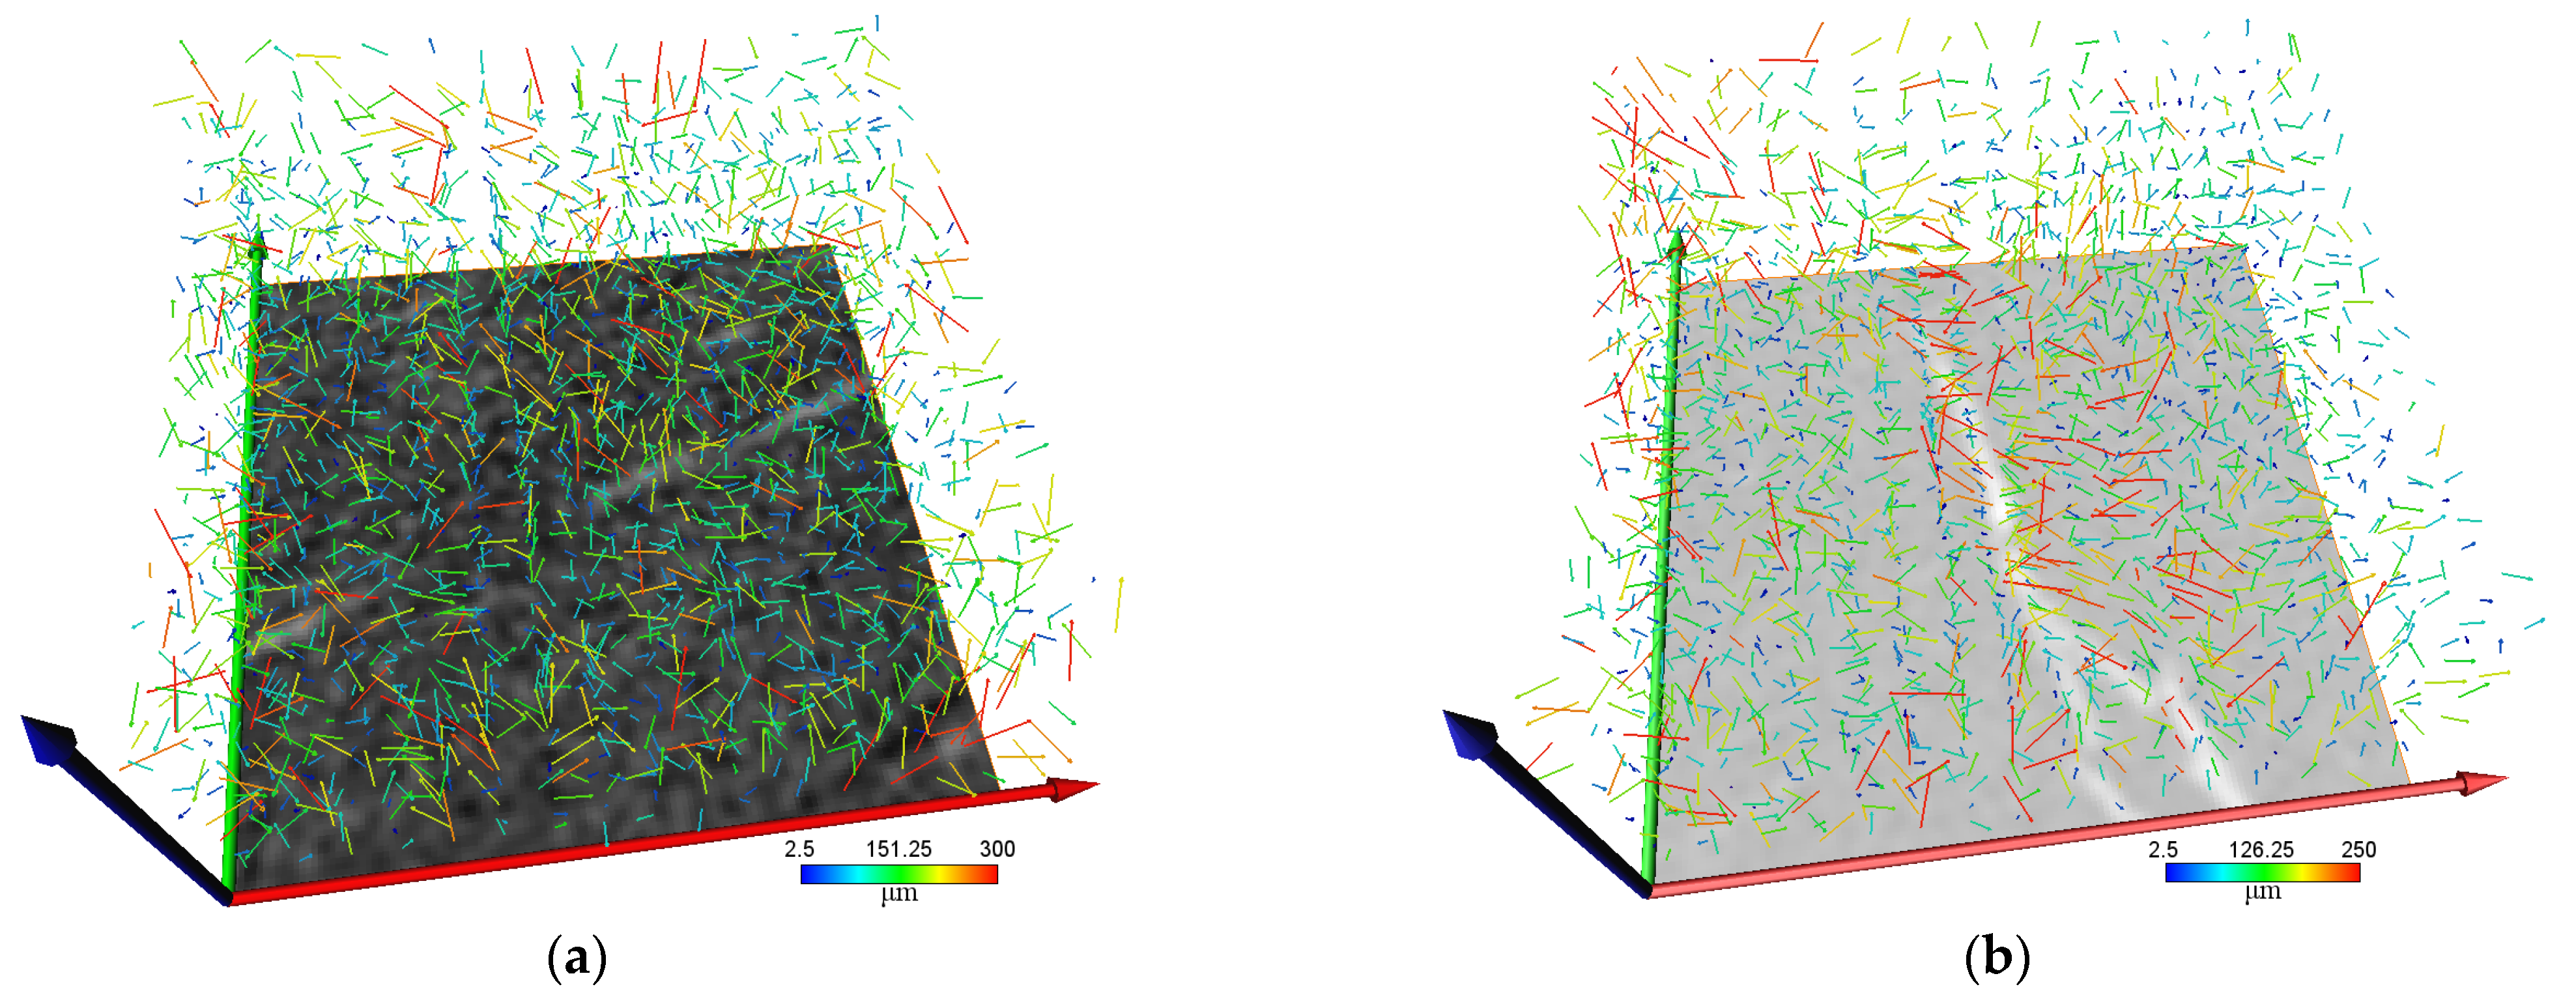
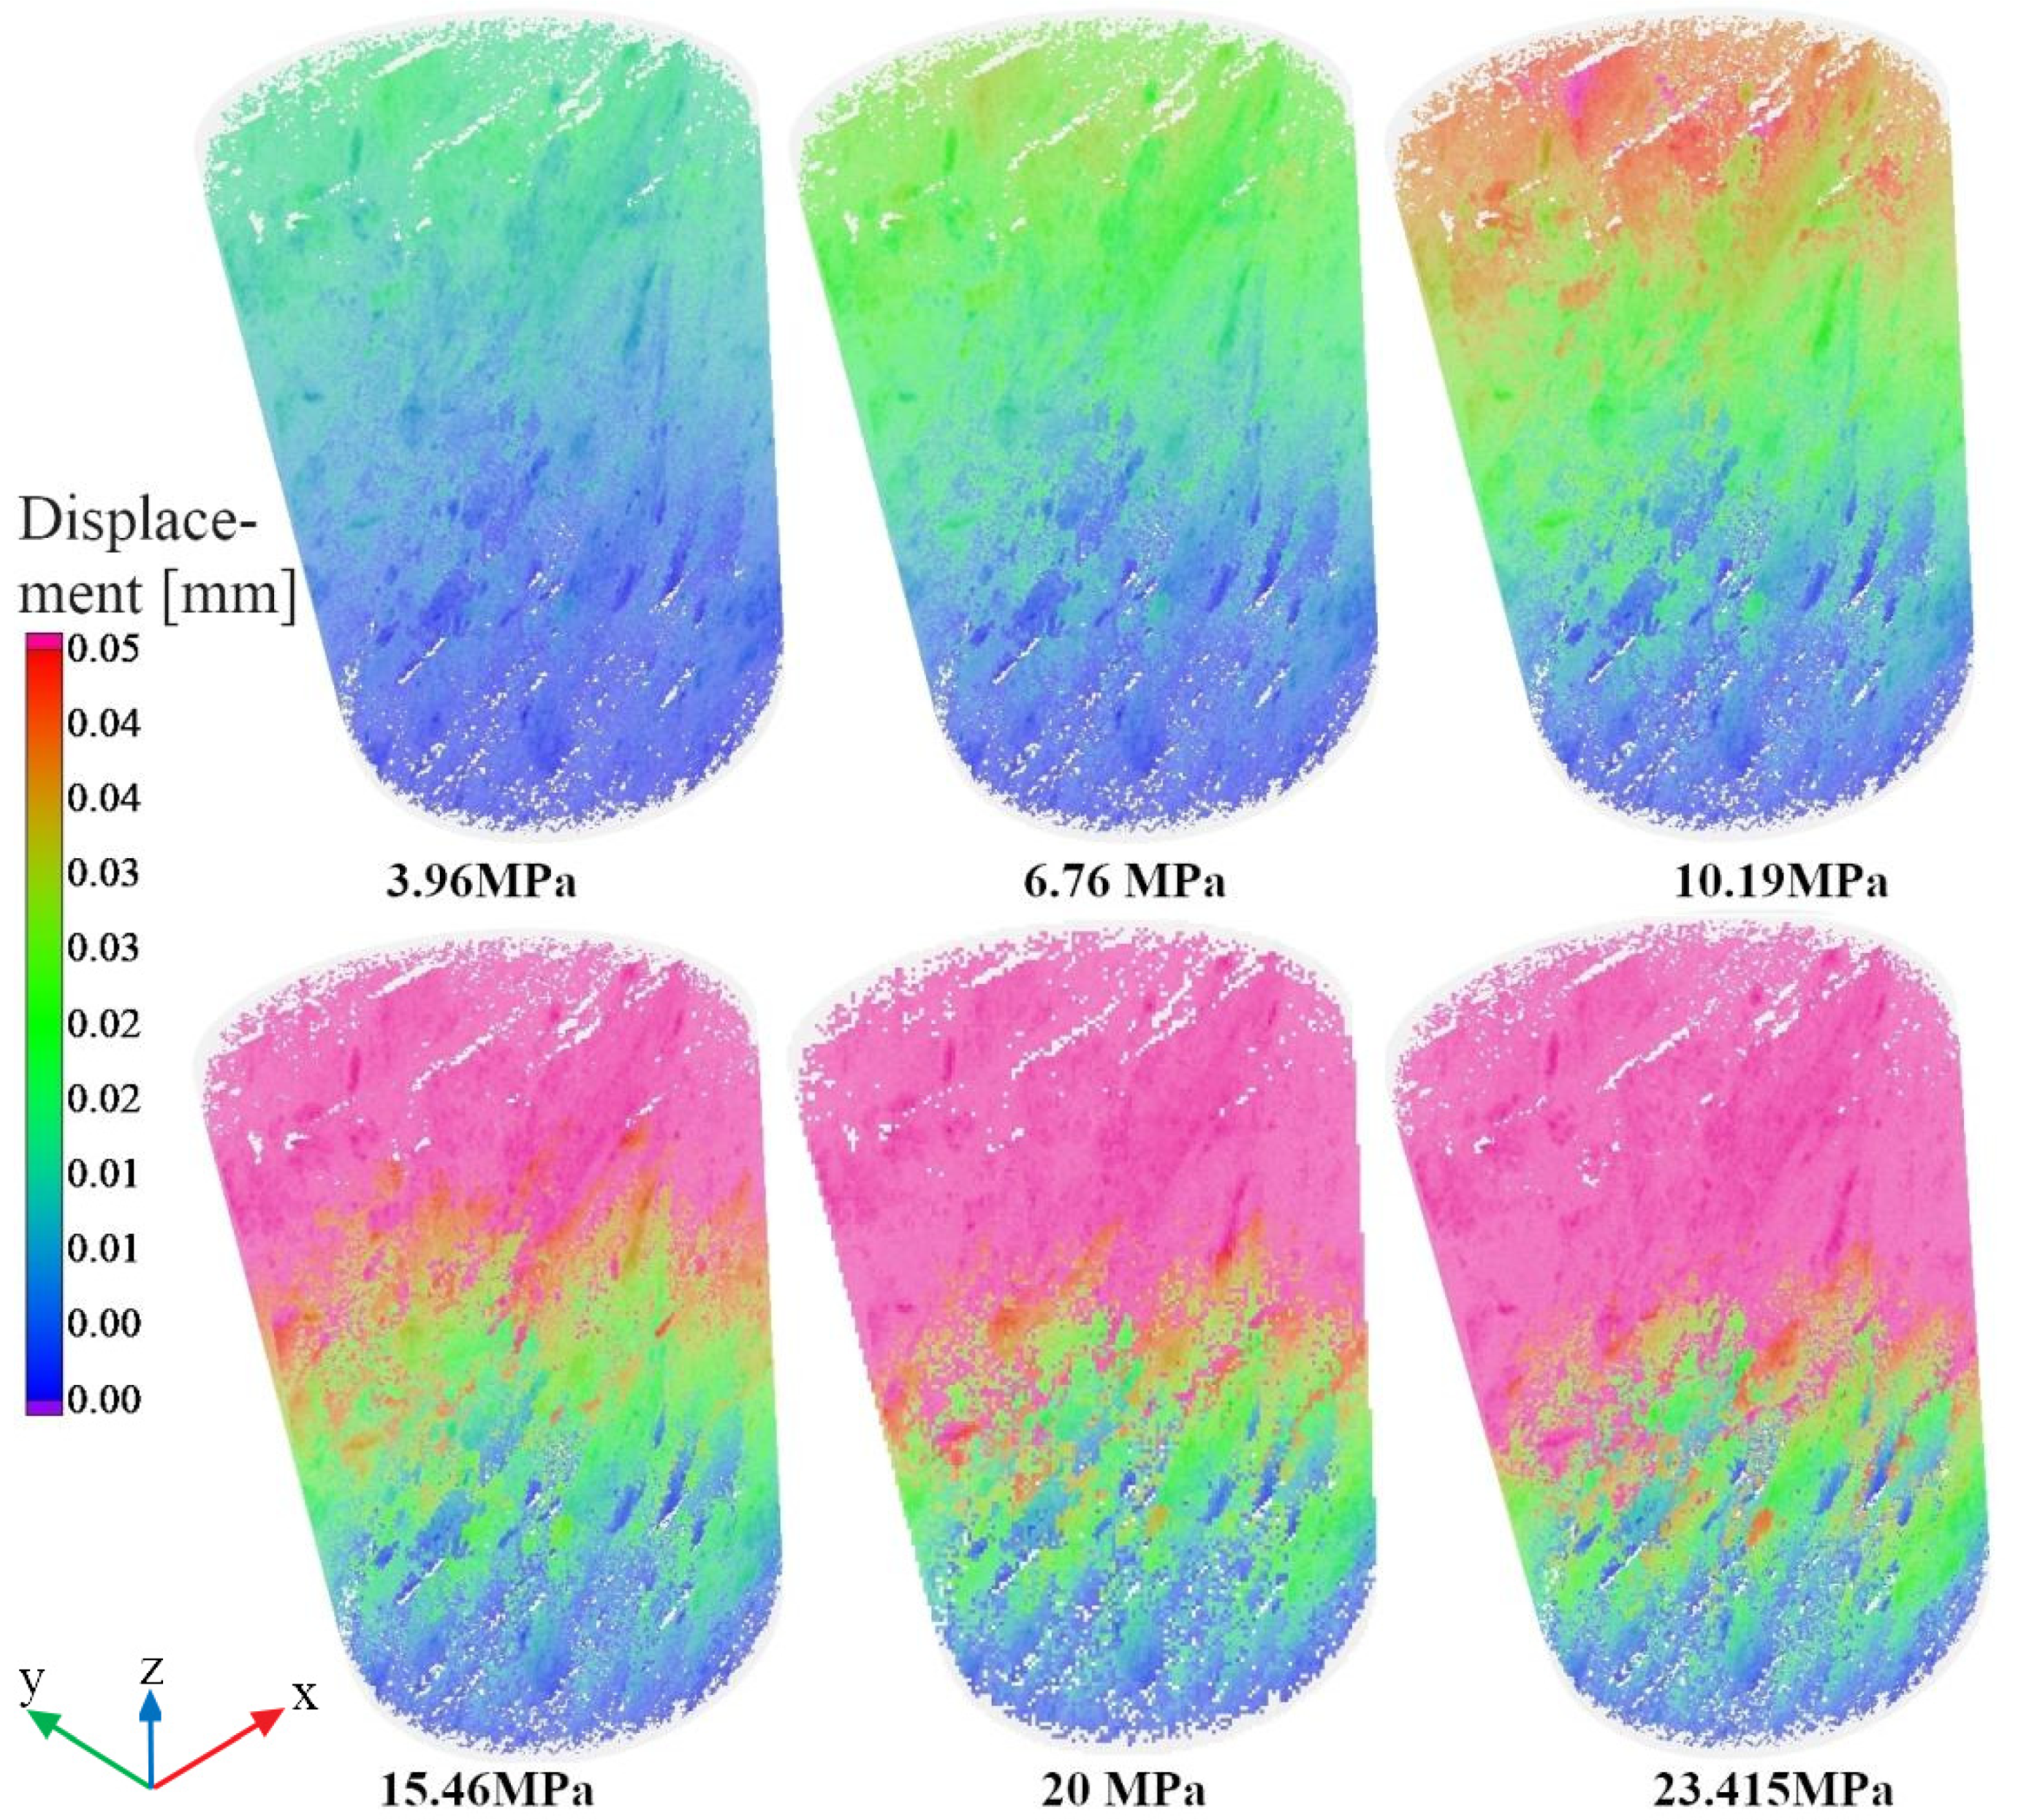
3.2. Results for 3D Displacement Field

The ROIs for each scanning stage were compared with that of the initial state by using the digital volume correlation module of the Avizo software (i.e., scanning stage 1). Seven sets of calculation results were obtained for each ROI, as shown in Figure 7. Figure 7a corresponds to the displacement field of the second loading stage, and so on.
Figure 7a shows the displacement field at the compaction stage: the overall displacement was low, and an analysis of the vector direction shows that the transverse displacement was larger than the longitudinal displacement. Comparing Figure 7b with Figure 7a show that the vector angle was closer to the longitudinal direction than the transverse direction, indicating a significant compression effect of the load. Compared to the displacement field in Figure 7a,b, the results in Figure 7c,d show little change, whereas those in Figure 7e show a pronounced change. The norm of the vector in and near the fracture region is significantly larger than that in fracture-free regions, indicating a significant increase in the displacement in the fracture region. Figure 7f corresponds to the peak stress state: a large displacement was distributed over a significantly wide range, including regions near the fractures and at the boundary. This result shows that under the peak strength loading, the internal displacement of the coal sample increased and was distributed over a wide range. The most significant change in the vector field is shown in Figure 7g: the norm of the vector field increases dramatically, especially over the fracture region and the nearby area, where the displacement generally exceeds 300 μm. The displacement in fracture-free regions generally remains larger than 150 μm.
The displacement fields of ROI2 and ROI3 were calculated, and the post-peak displacement fields were comparatively analysed. Figure 8 shows significant differences among the post-peak displacement field features of the different ROIs. The displacement field of ROI2 (basically coal) was most uniform, with a displacement of approximately 150 μm and large displacements in only small well-defined regions. The distribution features of the displacement field of ROI3 (containing minerals) were similar to those of ROI1 at the corresponding stages: the displacement was large over the region near the minerals, and smaller in the nearby coal region.
Figure 9, Figure 10 and Figure 11 are the statistical results of the displacement at each stage of ROI1, ROI2, and ROI3.
A statistical analysis showed that the displacement field of each ROI follows a normal distribution. The displacement fields for ROI1-3 were fitted to obtain the following equation:
y = y 0 + Ae 4 ln ( 2 ) ( x x c ) 2 w 2 w π 4 ln ( 2 )
where x is the position parameter for the normal distribution and corresponds to the mean displacement, and w describes the dispersion of the data. The fitting parameters x and w of the displacement field of ROI1-3 were statistically calculated at each stage (stage 2 to 8), and the results are presented in Figure 12.
Table 1 lists the mean displacements for the post-peak stage and the full stress–strain process of ROI1-3.
Figure 12 shows the mean and dispersion of the displacement field versus the axial strain for ROI1-3. Considering these results in conjunction with those presented in Table 1 shows that (1) there is a turning point in the statistics (i.e., the mean and dispersion) of the displacement field at the compaction stage; (2) the displacement increases monotonically with the load after the compaction stage; (3) the dispersion in the statistical results of the displacement field increases steadily with the loading, reflecting an increase in the number of extreme displacements in the sample; and (4) the displacement fields of different ROIs at the same stage differ significantly.

3.3. Analysis of Simulation Results

Mechanical tests using the MTS816 rock test system were used to measure the Young’s modulus and Poisson’s ratio of each sample. The grey value ranges for different matrices (coal, minerals, and fractures) were determined, and the mechanical test results were used to set the variable physical parameters (Young’s modulus and Poisson’s ratio) for different matrices, as shown in Figure 13. A meshfree numerical simulation of the 3D CT model under mechanical loading (with stress values corresponding to stages 2–7 in Figure 5) was carried out by using VG software.
The 3D CT model was directly simulated to obtain the 3D shear stress, principal stress, and displacement fields under different loads, as shown in Figure 14, Figure 15 and Figure 16. Combining these results with those presented in Figure 17 clearly shows that the mineral distribution had a significant effect on the stress field.
The simulated principal stress and shear stress of the sample under a stress of 10.19 MPa are shown in Figure 18.
Figure 18 shows a very complex coal stress state in the presence of minerals and fractures. The presence of fractures resulted in both the maximum principal stress and shear stress being 0 MPa in 0.6984% of the regions in the sample. The influence of the mineral distribution features resulted in a prevalent shear stress state, where most of the shear stresses were in the 5-MPa range.
The shear stress distribution was bimodal (except in the fracture region): the minimum shear stress was 2.517 MPa, and 2.3% of the shear stress ranged between 2.517 and 3 MPa. More than 95% of the shear stresses were between 3 and 6.4 MPa, and only 1.6% of the shear stresses were greater than 6.4 MPa, with the maximum shear stress being 11.6 MPa.
The maximum principal stress followed a trimodal distribution. Only 0.89% of the maximum principal stresses were below 6 MPa, and 3.57% of the principal stresses were between 6 and 8.57 MPa. The percentage of maximum principal stresses between 8.5 and 8.9 MPa increased rapidly, and 79.5% of the maximum principal stresses were between 8.9 and 10.7 MPa. The maximum principal stresses in 14.34% of the regions were between 10.7 and 12.87 MPa, whereas the maximum principal stresses were higher than 12.87 MPa in only 1.67% of the regions.
The changes in the proportions of the maximum principal stress and shear stress between 10 and 20 MPa and above 20 MPa for each stress state were statistically analysed. Figure 19 shows that the proportions of the maximum principal stress and the shear stress above 20 MPa in the sample increased monotonically with the load. For loads above 15.46 MPa, the proportion of the maximum principal stresses higher than 20 MPa increased rapidly from 1.628% to 51.683%. At the peak stress, the maximum principal stress exceeded 20 MPa in 96.35% of the regions. The proportion of regions with shear stresses above 20 MPa increased rapidly for loads above 15.46 MPa, but the proportion itself remained very low. The proportion of the shear stresses between 10 and 20 MPa increased significantly with the load from 1.5% to 43.457% to 82.739%.
Two points in the 3D model were selected for each matrix (coal, minerals, and near fractures), and Figure 20 shows the corresponding maximum principal stress and shear stress. The different matrices within the sample exhibited significantly different stress states. The maximum principal stresses in the mineral matrix were higher than those in the coal matrix, indicating stress concentration in the mineral regions. By comparison, the stresses in the regions near the fractures were all low.

4. Conclusions

The deformation features of coal under stress at macro- and mesoscales was investigated, and a meshless simulation was performed using a 3D CT model to obtain the 3D principal stress, shear stress, and displacement fields. The main conclusions are given below.
  • Primary fractures and minerals have a determining influence on the deformation and failure features of coal and are the key factors producing anisotropic coal deformation. The primary fractures propagate as compression increases and crisscross new fractures.
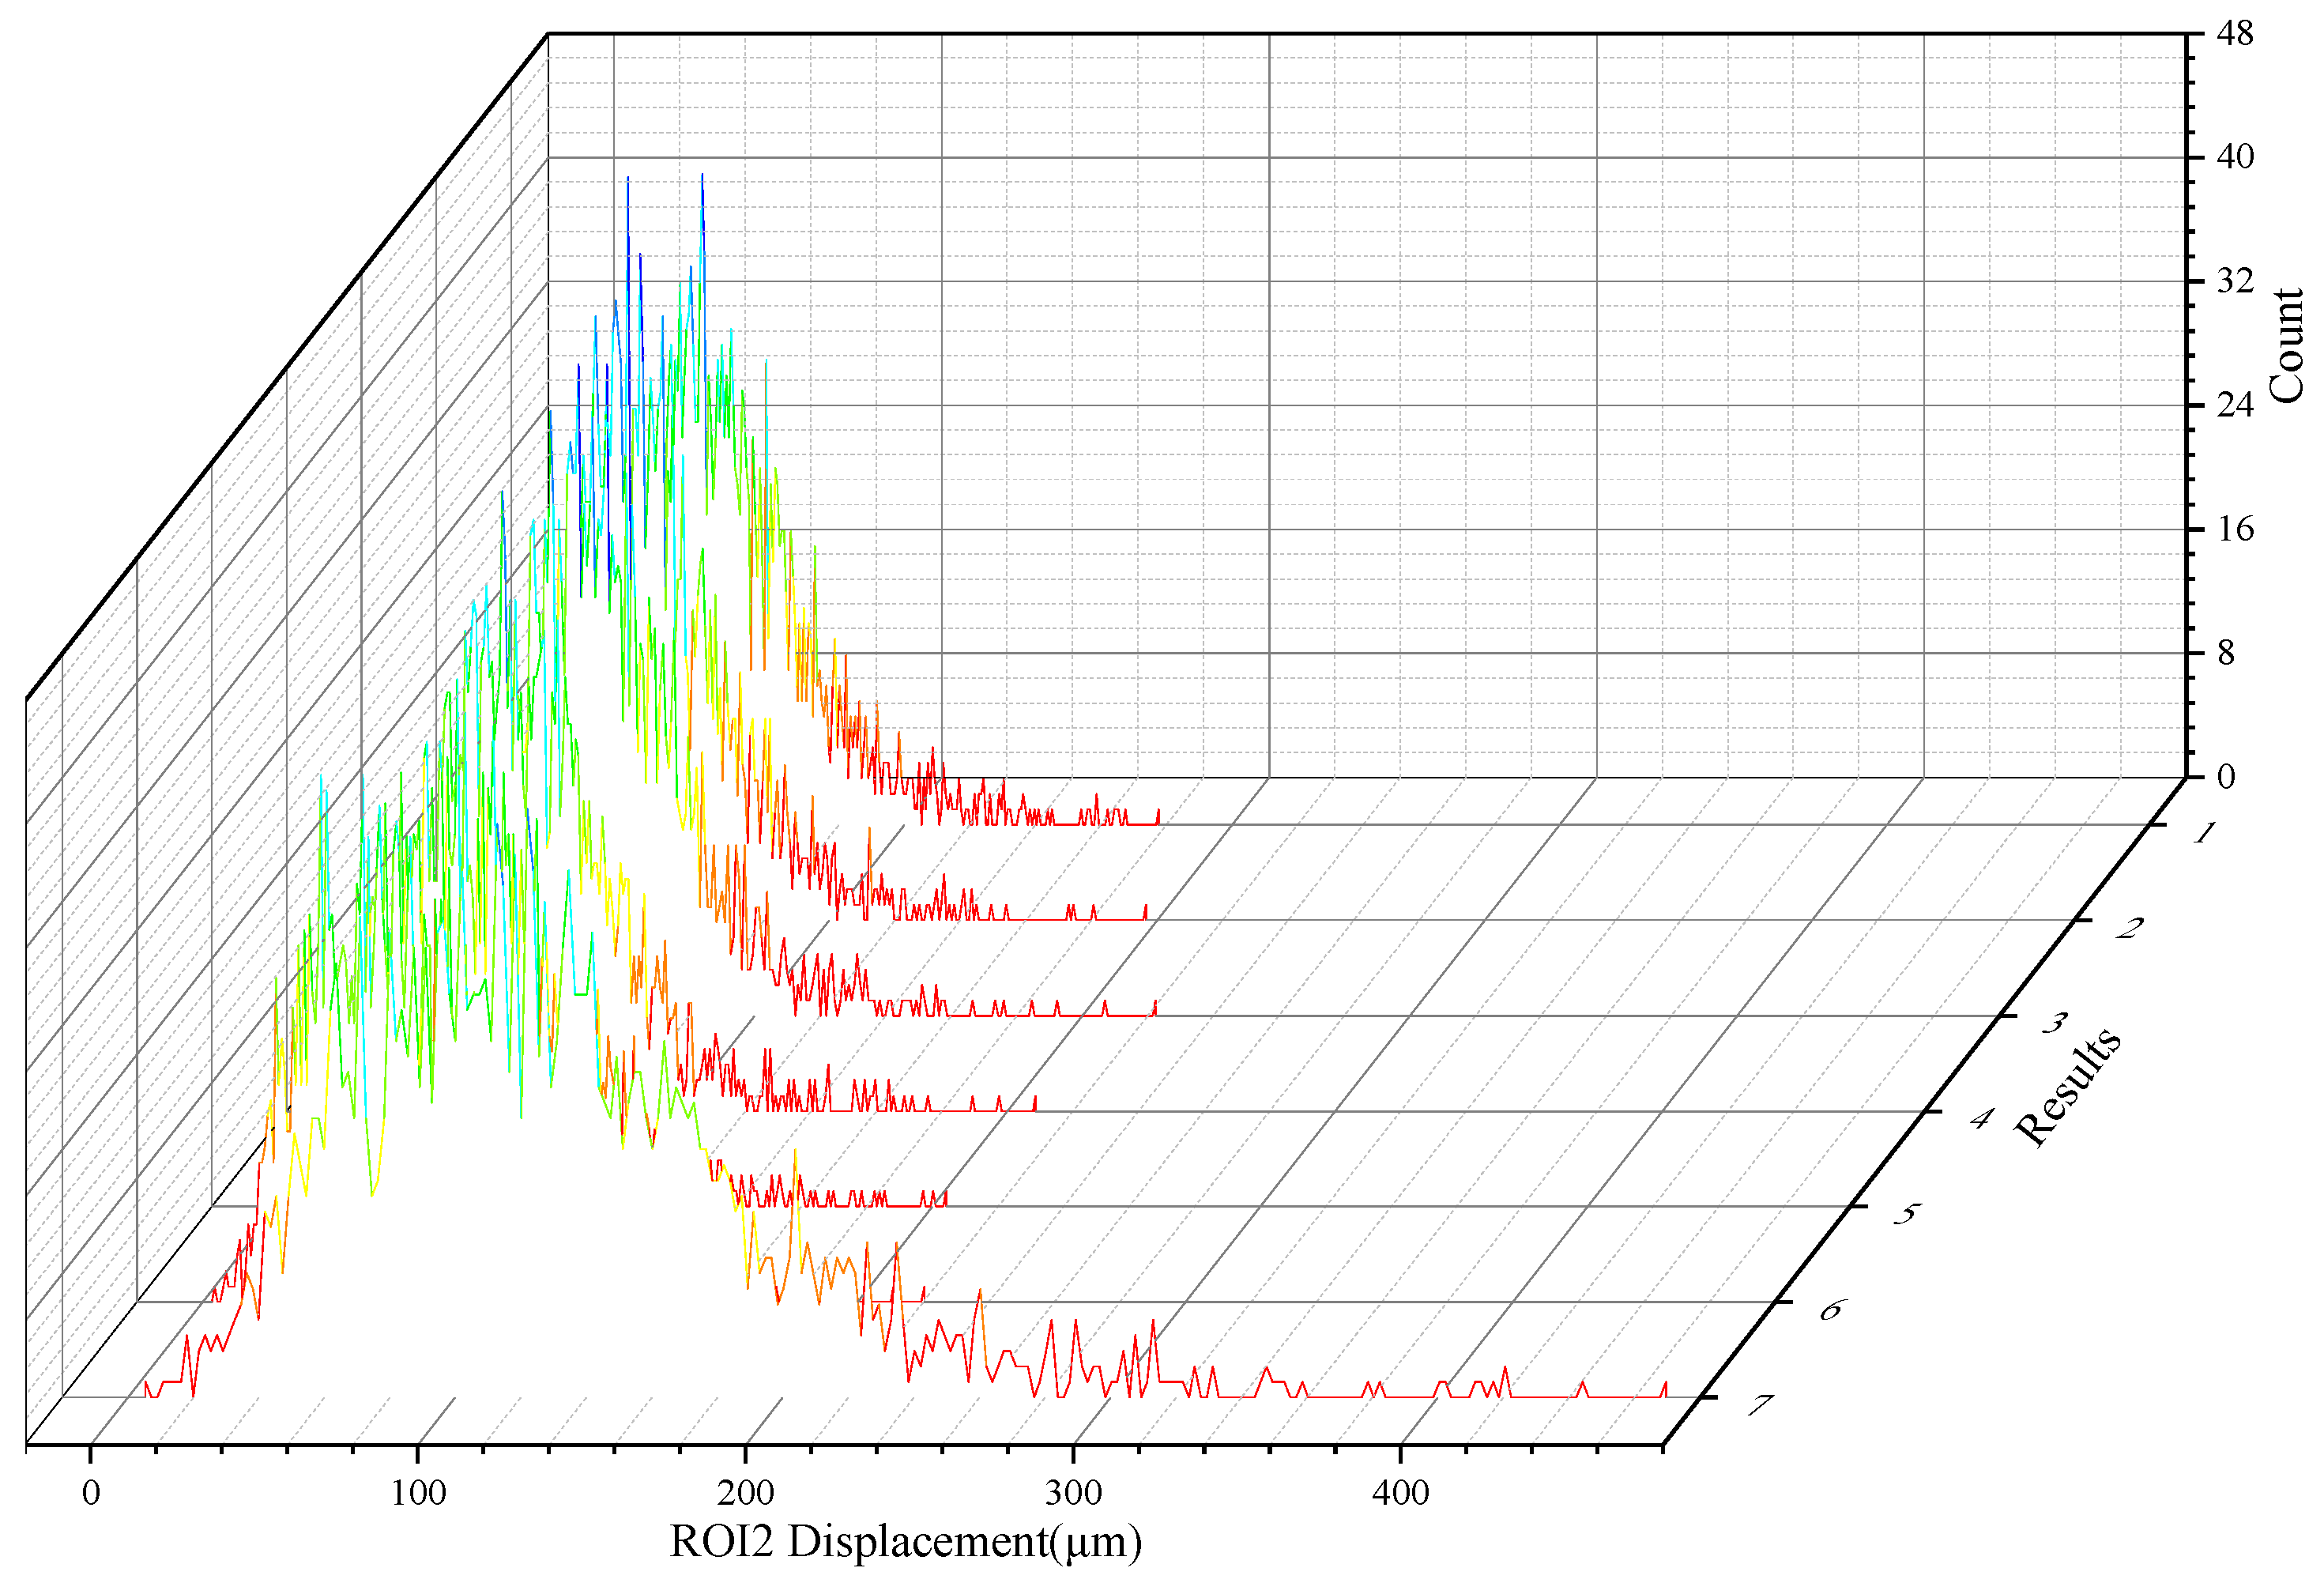
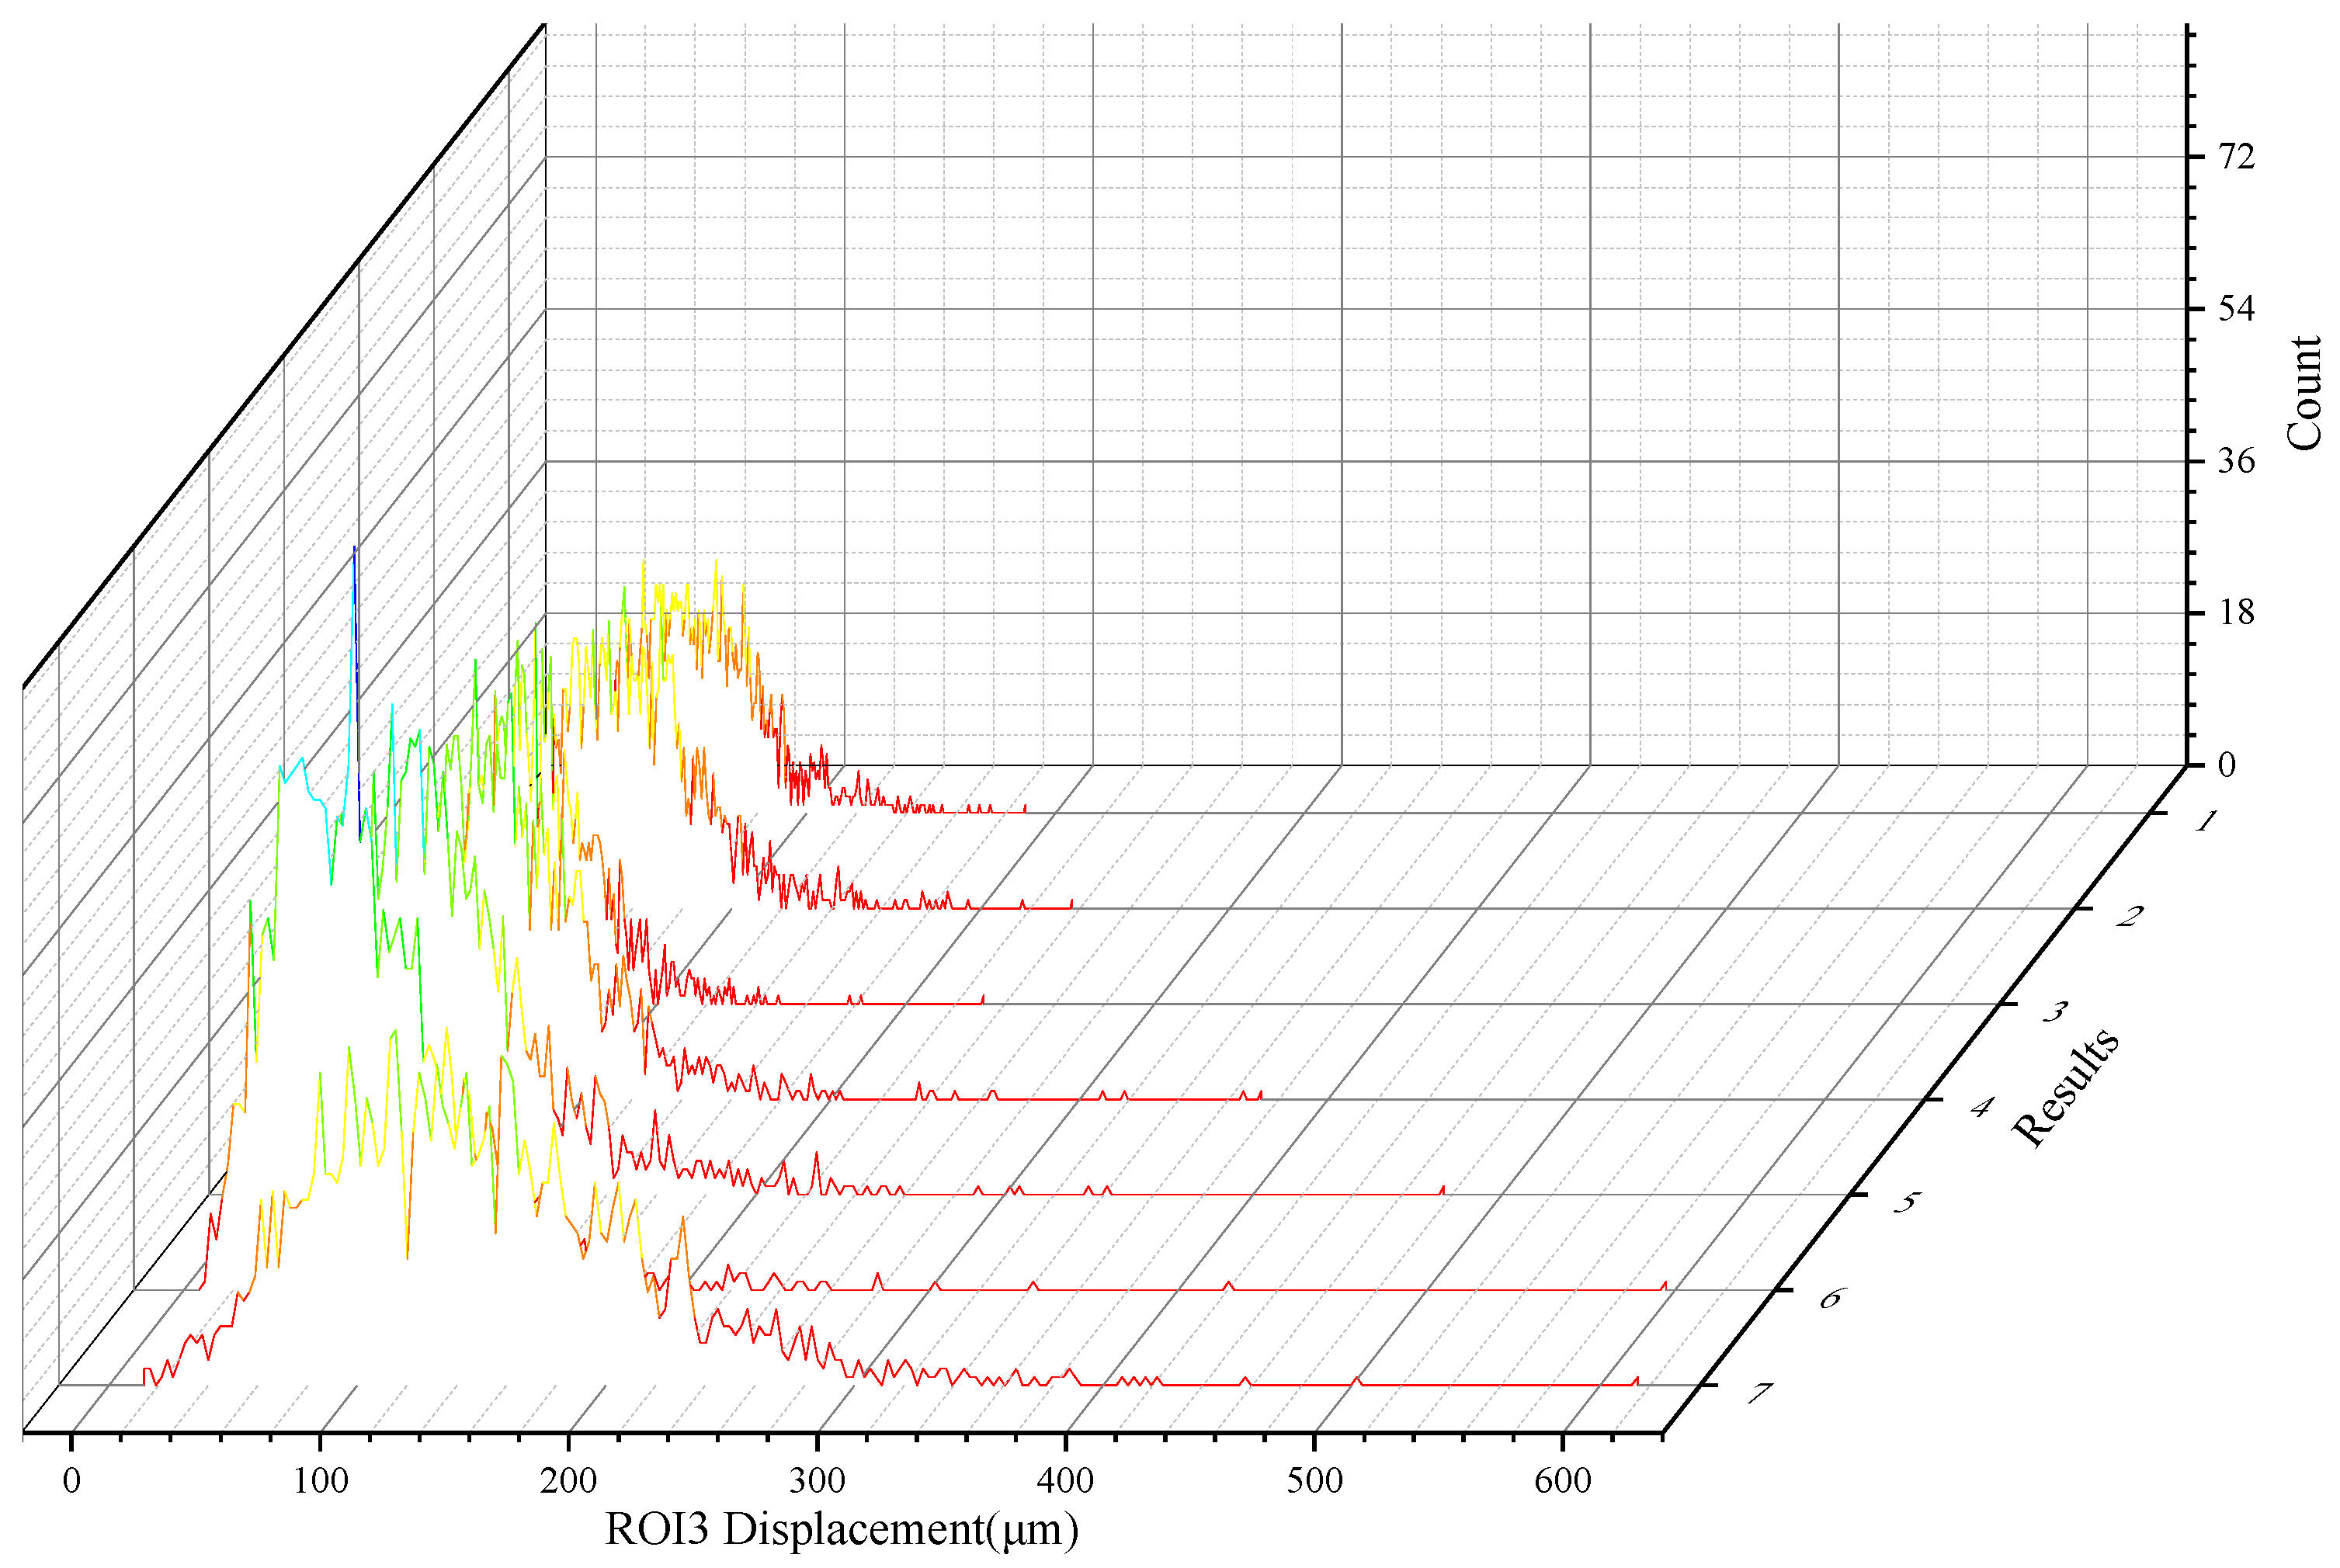
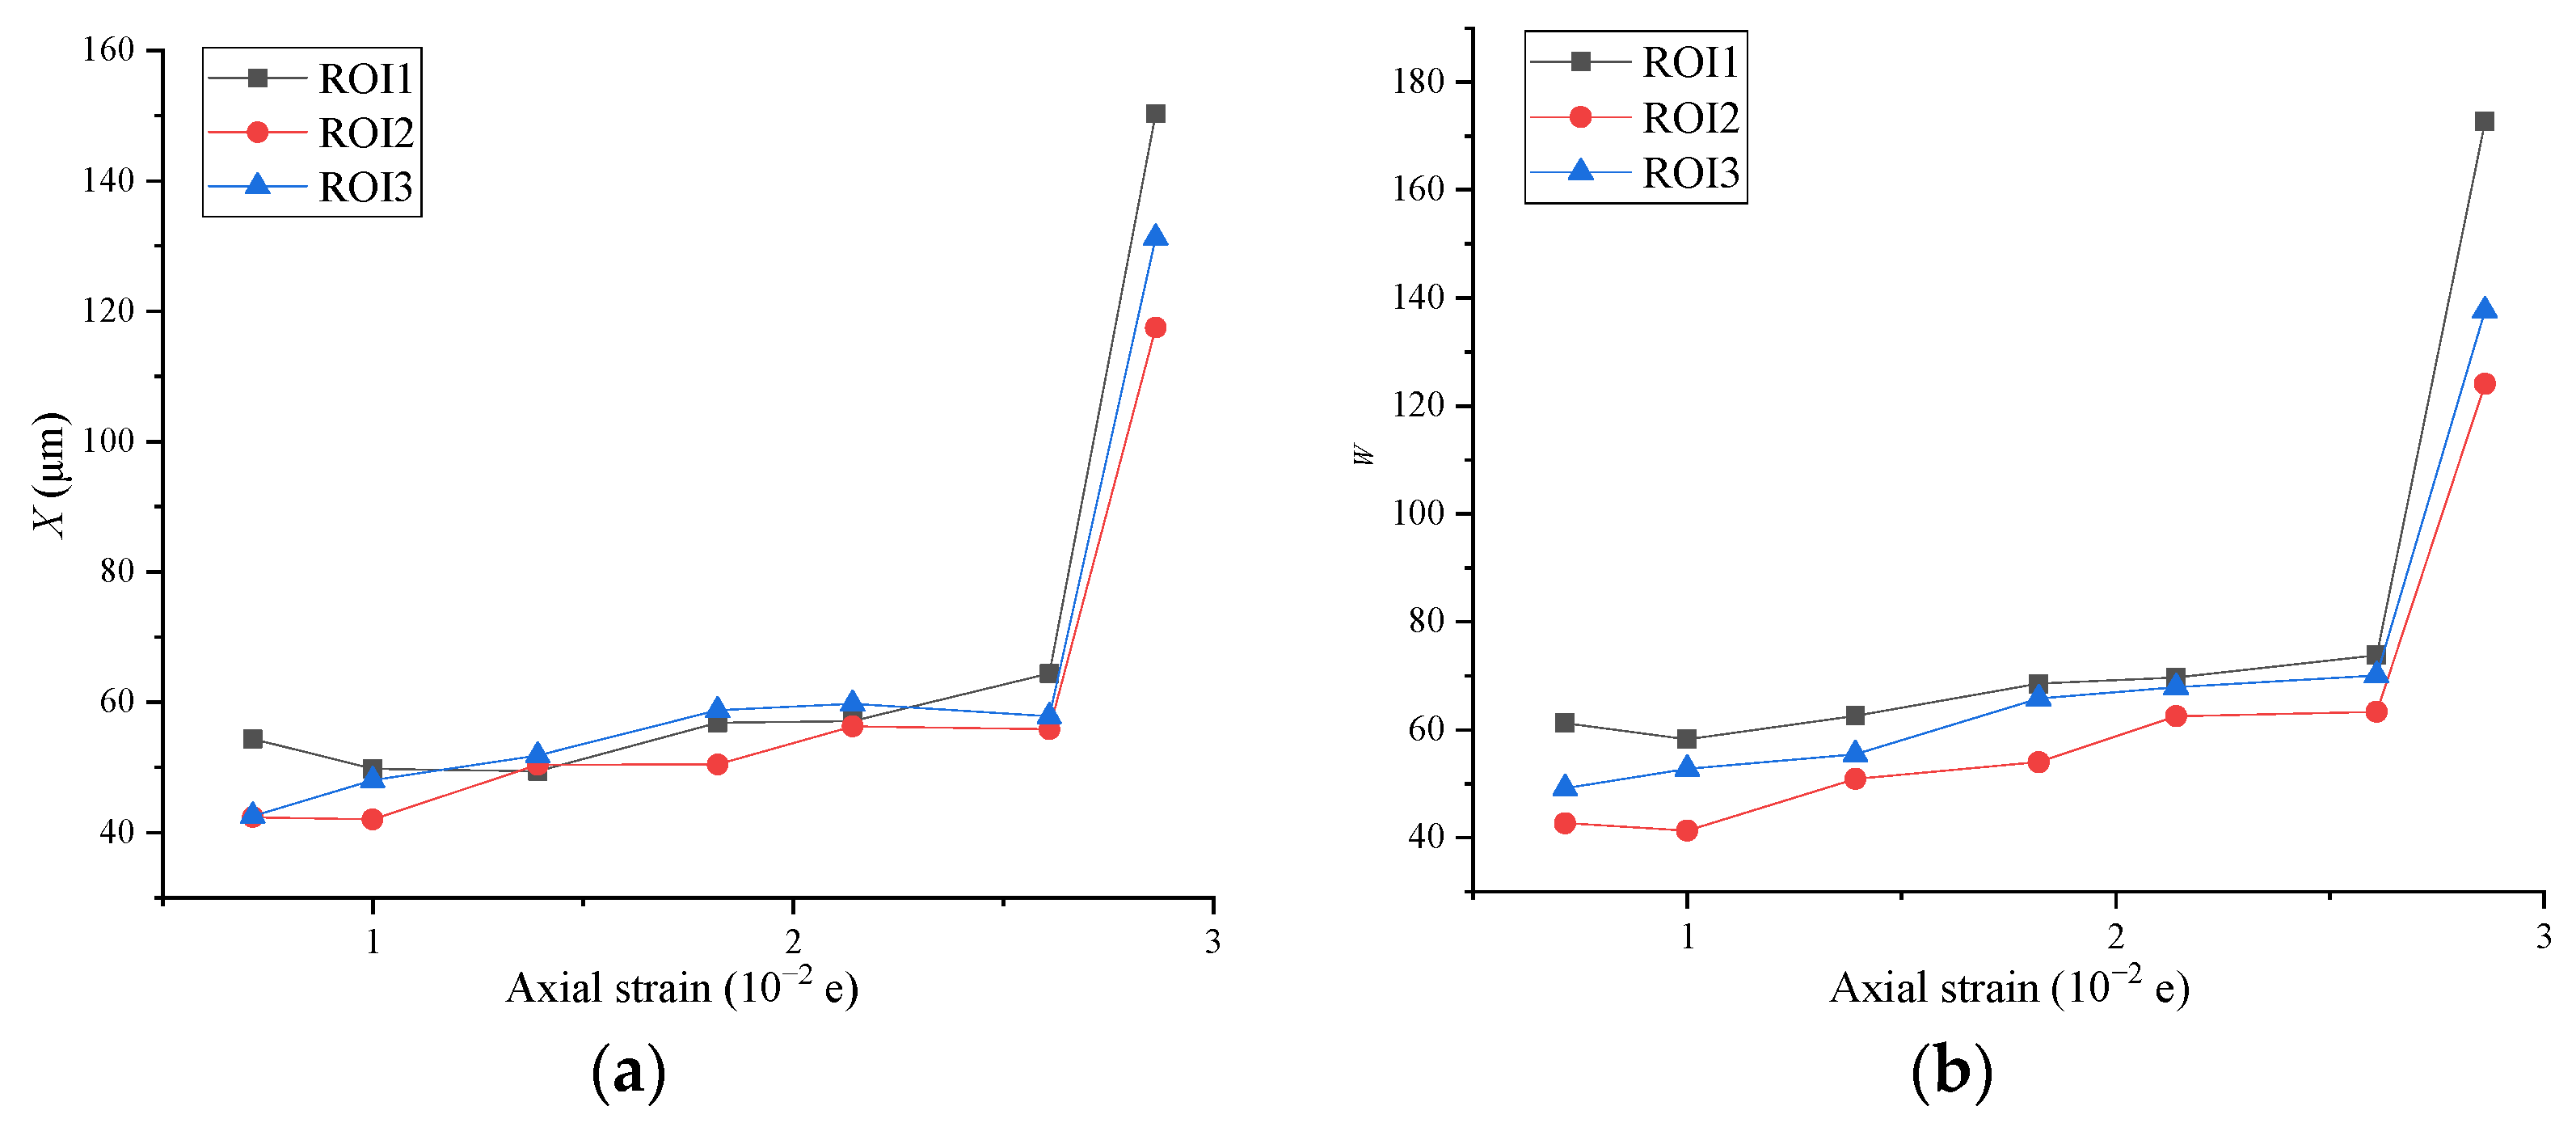
  • The ROI displacement field data of different matrices in the coal sample follow a normal distribution, and the differences in the corresponding deformations under load are statistically significant. The deformation at the primary fractures increases substantially with stress, and the mineral region is also prone to large deformation from stress concentration. The increase in the displacement is promoted by the presence of fractures and inhibited in the presence of minerals.
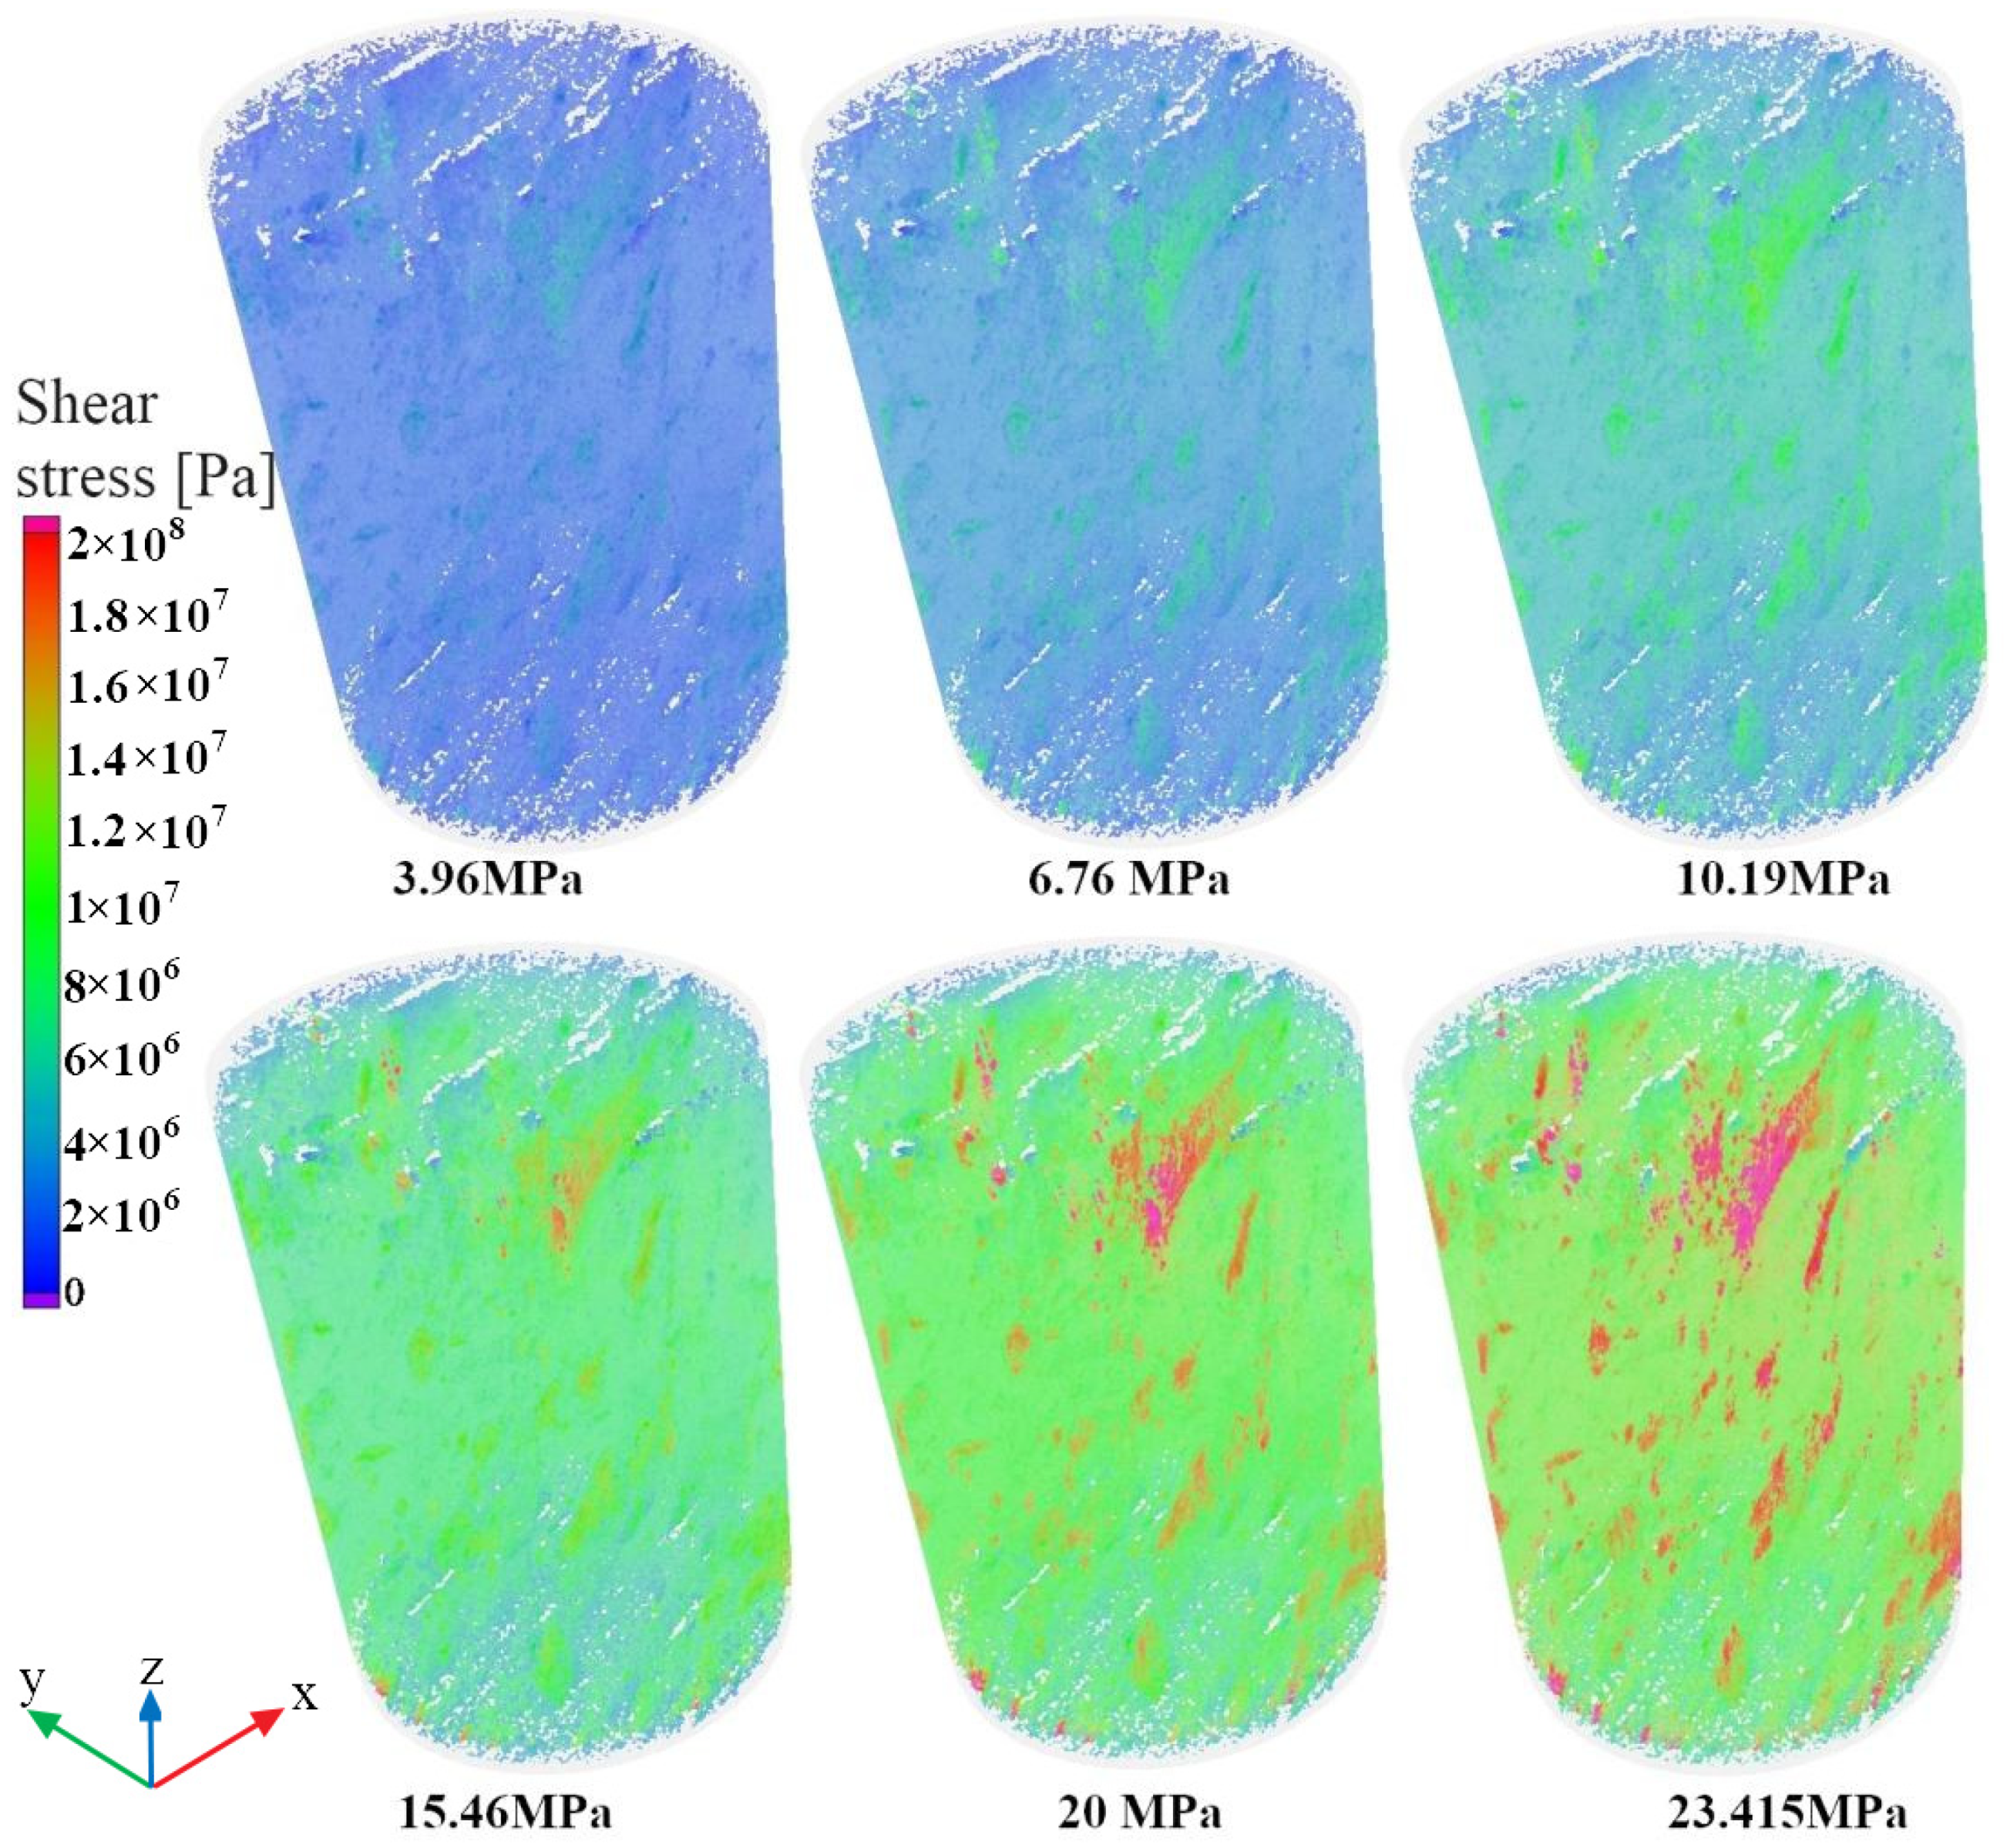
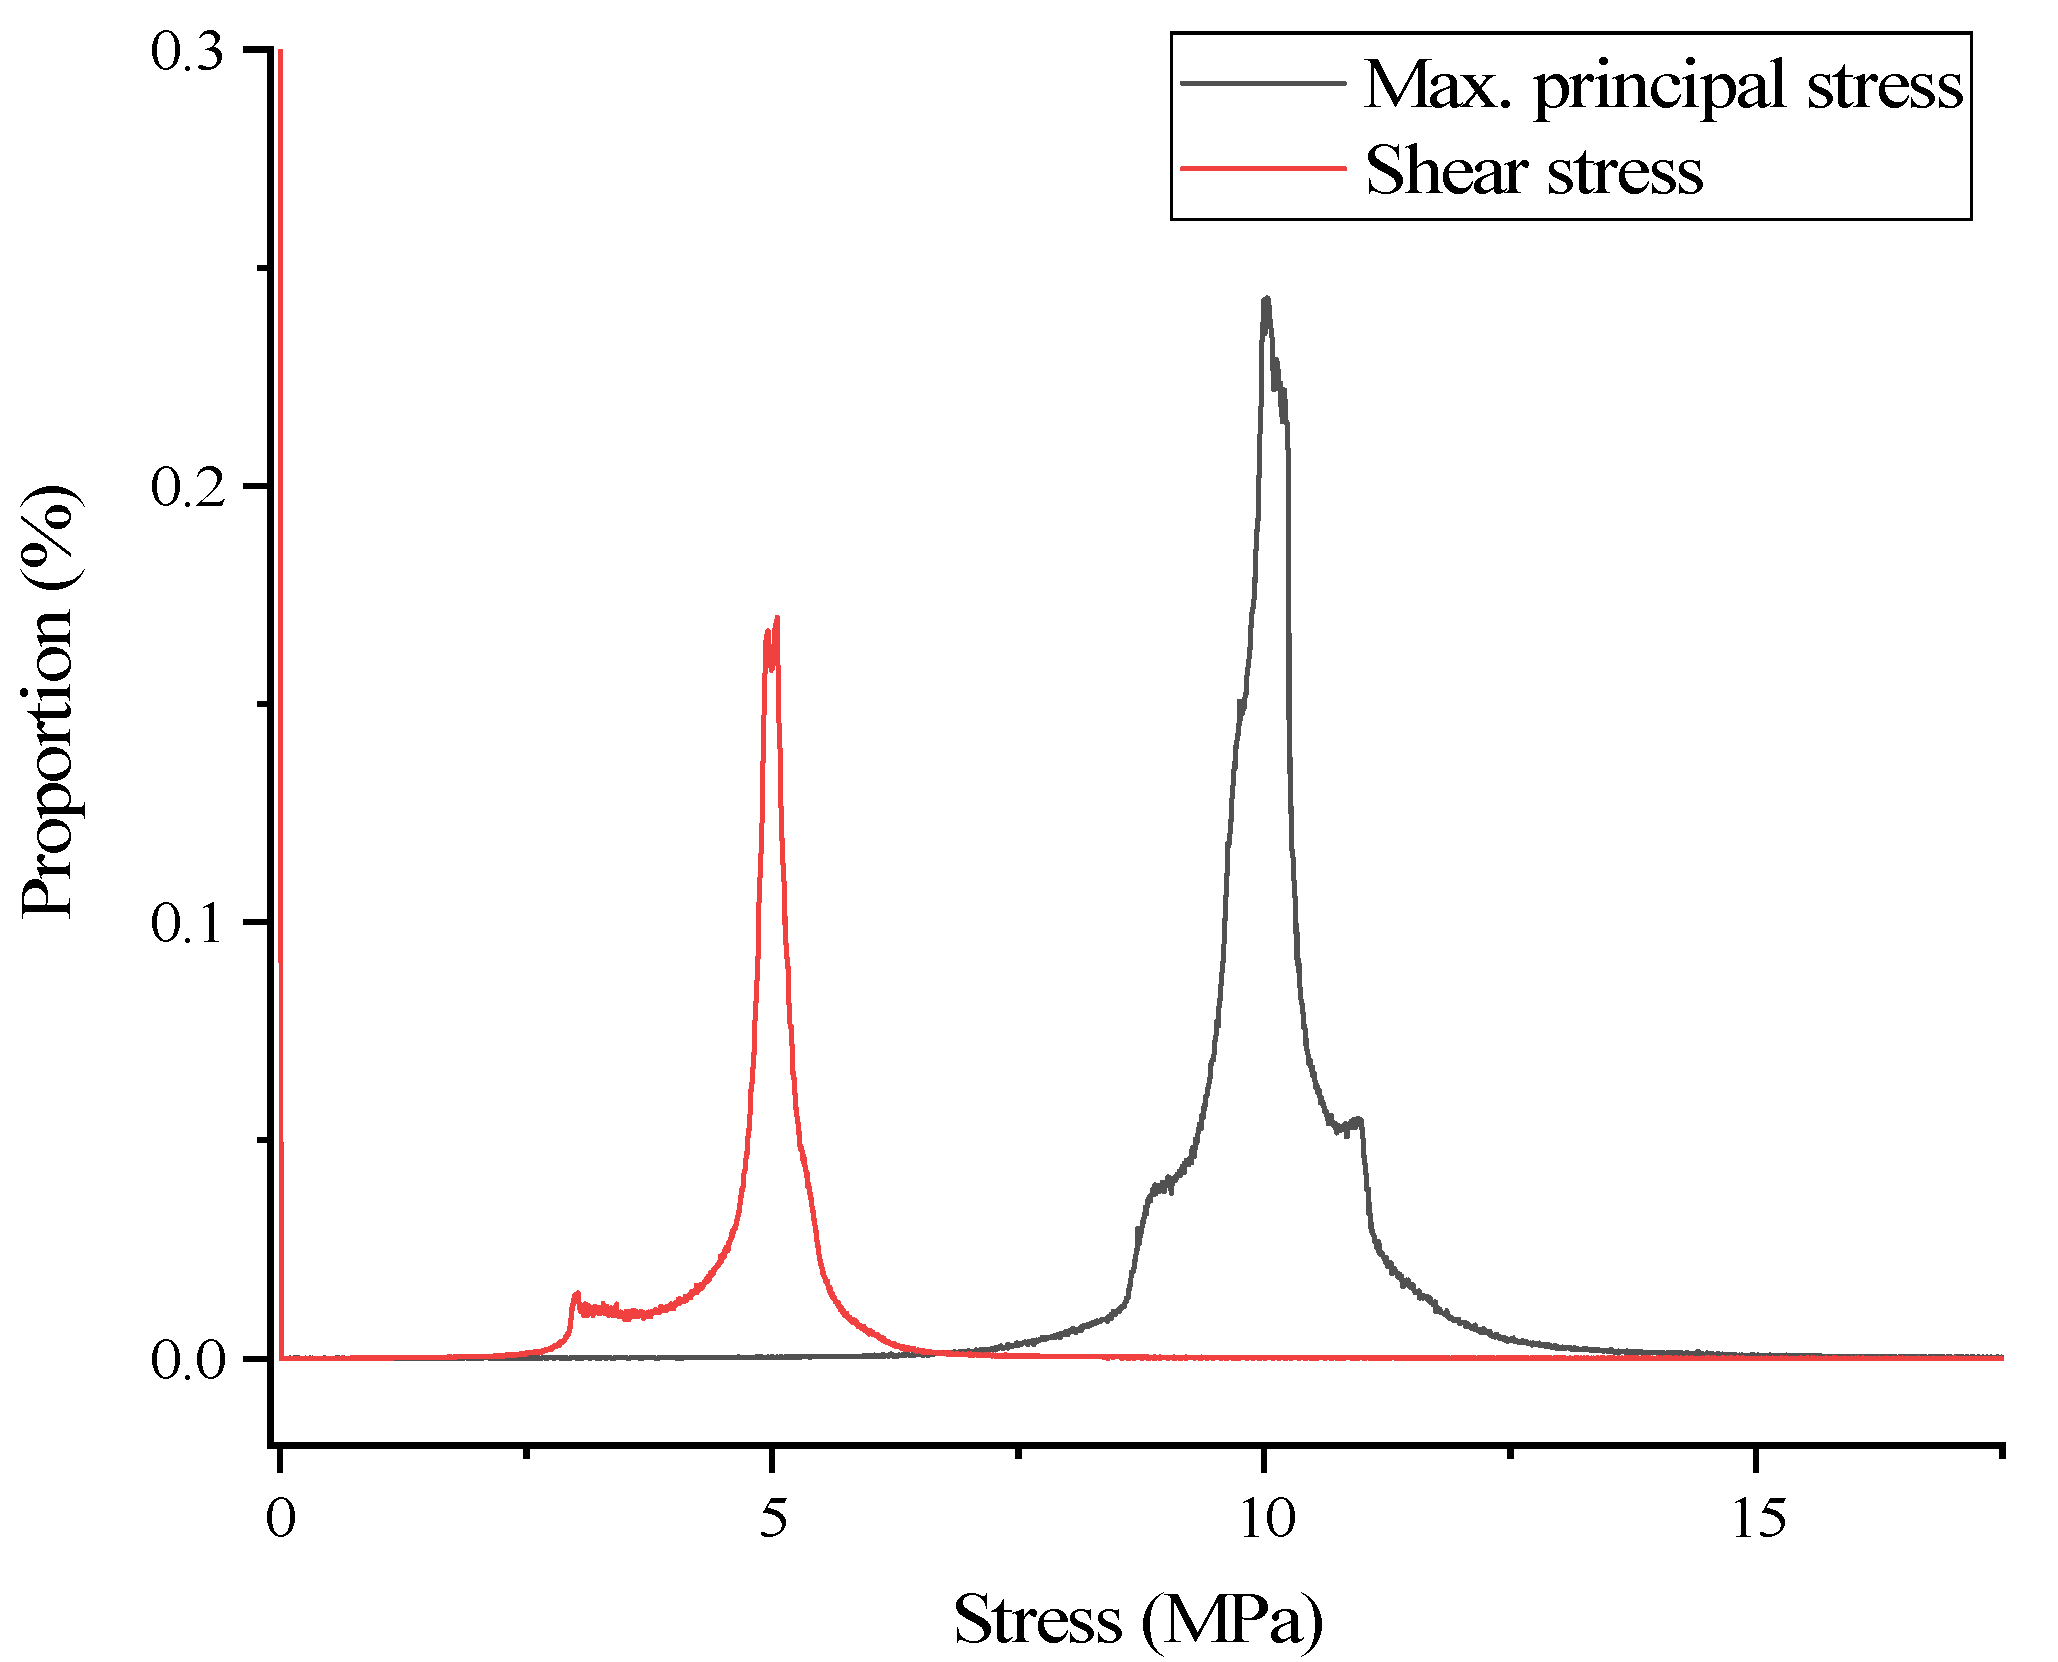
  • A highly complex coal stress state forms under an applied stress, and the distribution of minerals and fractures significantly affects the stress field distribution. The presence of minerals and fractures produces a prevalent shear stress in the coal that is mainly concentrated in the vicinity of where these entities are located and is highly unfavourable for sample stability.
  • To ensure safe field operation, the mineral distribution features in coal seams and the development level and distribution features of primary fractures should be determined. Targeted measures can then be taken to improve the stress state and enhance the safety level.

Author Contributions

Conceptualization, Q.L. and Z.L.; methodology, Z.L.; software, Q.L.; validation, Z.L., P.L. and R.P.; formal analysis, Q.L.; investigation, Z.L.; resources, Q.L.; data curation, P.L. and Q.Z.; writing—original draft preparation, Q.L.; writing—review and editing, Z.L.; visualization, Z.L.; supervision, Q.L.; project administration, Z.L.; funding acquisition, Z.L. All authors have read and agreed to the published version of the manuscript.

Funding

This research was funded by the National Natural Science Foundation of China, grant number 51904198, the Science Foundation for Youths of Shanxi Province, grant number 201901D211036 and grant number 202103021223392, and Natural Science Research of Shanxi Province (202103021224334) and the APC was funded by the National Natural Science Foundation of China, grant number 51904198.

Institutional Review Board Statement

Not applicable.

Informed Consent Statement

Not applicable.

Data Availability Statement

Not applicable.

Conflicts of Interest

The authors declare no conflict of interest.

References

  1. Sobczyk, J. A comparison of the influence of adsorbed gases on gas stresses leading to coal and gas outburst. Fuel 2014, 115, 288–294. [Google Scholar] [CrossRef]
  2. Sobczyk, J. The influence of sorption processes on gas stresses leading to the coal and gas outburst in the laboratory conditions. Fuel 2011, 90, 1018–1023. [Google Scholar] [CrossRef]
  3. Lu, X.; Armstrong, R.T.; Mostaghimi, P. High-pressure X-ray imaging to interpret coal permeability. Fuel 2018, 226, 573–582. [Google Scholar] [CrossRef]
  4. Tan, J.; Xie, J.; Li, L.; Lyu, Q.; Han, J.; Zhao, Z. Multifractal analysis of acoustic emissions during hydraulic fracturing experiments under uniaxial loading conditions: A Niutitang shale example. Geofluids 2020, 2020, 8845292. [Google Scholar] [CrossRef]
  5. Nie, B.; Fan, P.; Li, X. Quantitative investigation of anisotropic characteristics of methane-induced strain in coal based on coal particle tracking method with X-ray computer tomography. Fuel 2018, 214, 272–284. [Google Scholar] [CrossRef]
  6. Zhang, Z.; Xie, H.; Zhang, R.; Gao, M.; Ai, T.; Zha, E. Size and spatial fractal distributions of coal fracture networks under different mining-induced stress conditions. Int. J. Rock Mech. Min. 2020, 132, 104364. [Google Scholar] [CrossRef]
  7. Feng, Z.; Cai, T.; Zhou, D.; Zhao, D.; Zhao, Y.; Wang, C. Temperature and deformation changes in anthracite coal after methane adsorption. Fuel 2017, 192, 27–34. [Google Scholar] [CrossRef] [Green Version]
  8. Kawakata, H.; Cho, A.; Yanagidani, T.; Shimada, M. The observations of faulting in westerly granite under triaxial compression by X-ray CT scan. Int. J. Rock Mech. Min. Sci. Geomech. 1997, 34, 375. [Google Scholar] [CrossRef]
  9. Cao, W.; Yildirim, B.; Durucan, S.; Wolf, K.; Cai, W.; Agrawal, H.; Korre, A. Fracture behaviour and seismic response of naturally fractured coal subjected to true triaxial stresses and hydraulic fracturing. Fuel 2021, 288, 119618. [Google Scholar] [CrossRef]
  10. Fan, N.; Wang, J.; Deng, C.; Fan, Y.; Wang, T.; Guo, X. Quantitative characterization of coal microstructure and visualization seepage of macropores using CT-based 3D reconstruction. J. Nat. Gas Sci. Eng. 2020, 81, 103384. [Google Scholar] [CrossRef]
  11. Li, Y.T.; Jiang, Y.D.; Zhang, B.; Song, H.H.; Dong, W.B.; Wang, P.P. Investigation on the pore characteristics of coal specimens with bursting proneness. Fuel 2019, 9, 16518. [Google Scholar] [CrossRef] [PubMed]
  12. Li, Y.Y.; Cui, H.Q.; Zhang, P.; Wang, D.K.; Wei, J.P. Three-dimensional visualization and quantitative characterization of coal fracture dynamic evolution under uniaxial and triaxial compression based on CT scanning. Fuel 2020, 262, 116568. [Google Scholar] [CrossRef]
  13. Lu, W.; Wei, G.; Wang, Z.; Jia, T.; Sun, S.; Ju, Y. Micro-nano fine characterization of coal fracture evolution during the triaxial compression creep. Fuel 2021, 21, 495–504. [Google Scholar] [CrossRef] [PubMed]
  14. Liu, W.; Wang, G.; Han, D.; Xu, H.; Chu, X. Accurate characterization of coal pore and fissure structure based on CT 3D reconstruction and NMR. J. Nat. Gas Sci. Eng. 2021, 96, 104242. [Google Scholar] [CrossRef]
  15. Tao, S.; Pan, Z.J.; Chen, S.D.; Tang, S.L. Coal seam porosity and fracture heterogeneity of marcolithotypes in the Fanzhuang Block, southern Qinshui Basin, China. J. Nat. Gas Sci. Eng. 2019, 66, 148–158. [Google Scholar] [CrossRef]
  16. Wang, G.; Han, D.; Qin, X.; Liu, Z.; Liu, J. A comprehensive method for studying pore structure and seepage characteristics of coal mass based on 3D CT reconstruction and NMR. Fuel 2020, 281, 118735. [Google Scholar] [CrossRef]
  17. Wang, G.; Qin, X.; Han, D.; Liu, Z. Study on seepage and deformation characteristics of coal microstructure by 3D reconstruction of CT images at high temperatures. Fuel 2021, 31, 175–185. [Google Scholar] [CrossRef]
  18. Wang, G.; Han, D.Y.; Jiang, C.H.; Zhang, Z.Y. Seepage characteristics of fracture and dead-end pore structure in coal at micro- and meso-scales. Fuel 2020, 266, 117058. [Google Scholar] [CrossRef]
  19. Zhang, G.; Ranjith, P.G.; Fu, X.; Li, X. Pore-fracture alteration of different rank coals: Implications for CO2 sequestration in coal. Fuel 2021, 289, 119081. [Google Scholar] [CrossRef]
  20. Wang, D.; Zeng, F.; Wei, J.; Zhang, H.; Wu, Y.; Wei, Q. Quantitative analysis of fracture dynamic evolution in coal subjected to uniaxial and triaxial compression loads based on industrial CT and fractal theory. J. Pet. Sci. Eng. 2021, 196, 108051. [Google Scholar] [CrossRef]
  21. Mao, L.; Lian, X.; Hao, N.; Wei, F.; An, L. 3D strain measurement in coal using digital volumetric speckle photography. J. China Coal Soc. 2015, 40, 65–72. [Google Scholar]
  22. Sampath, K.H.S.M.; Perera, M.S.A.; Elsworth, D.; Matthai, S.K.; Ranjith, P.G.; Li, D. Discrete fracture matrix modelling of fully-coupled CO2 flow-Deformation processes in fractured coal. Int. J. Rock Mech. Min. 2021, 138, 104644. [Google Scholar] [CrossRef]
  23. Roslin, A.; Pokrajac, D.; Zhou, Y. Cleat structure analysis and permeability simulation of coal samples based on micro-computed tomography (micro-CT) and scan electron microscopy (SEM) technology. Fuel 2019, 254, 115579. [Google Scholar] [CrossRef]
  24. Wu, Y.; Yang, D.; Wei, J.; Yao, B.; Zhang, H.; Fu, J.; Zeng, F. Damage constitutive model of gas-bearing coal using industrial CT scanning technology. J. Nat. Gas Sci. Eng. 2022, 101, 104543. [Google Scholar] [CrossRef]
Figure 1. Boundary determination of 3D model.
Mathematics 10 02512 g001
Figure 2. Positions of ROI1, ROI2, and ROI3 (top left: top view of CT image; top right: side view of CT image) and slices in 3 dimensions of ROI1 (bottom).
Mathematics 10 02512 g002
Figure 3. 3D reconstruction model at the initial (a) and post-peak stages (b).
Mathematics 10 02512 g003
Figure 4. Vertical CT slice at the initial (a) and post-peak (stage 8) stages (b).
Mathematics 10 02512 g004
Figure 5. Stress–strain curve and corresponding stage of CT scan.
Mathematics 10 02512 g005
Figure 6. Relationship between axial strain and roundness (a) and area (b) of CT slice.
Mathematics 10 02512 g006
Figure 7. Calculated 3D displacement field at different stages of ROI1.
Mathematics 10 02512 g007aMathematics 10 02512 g007b
Figure 8. Calculated 3D displacement field at the post-peak stage (stage 8 in Figure 5) for ROI2 (a) and ROI3 (b).
Mathematics 10 02512 g008
Figure 9. Statistical results for the ROI1 displacement field at different stages (stage 2 to 8).
Mathematics 10 02512 g009
Figure 10. Statistical results for the ROI2 displacement field at different stages (stage 2 to 8).
Mathematics 10 02512 g010
Figure 11. Statistical results for the ROI3 displacement field at different stages (stage 2 to 8).
Mathematics 10 02512 g011
Figure 12. Variation curves of characteristic parameters x (a) and w (b) of the fitted normal distributions for ROI1-3.
Mathematics 10 02512 g012
Figure 13. Setting the simulation parameters for different matrices.
Mathematics 10 02512 g013
Figure 14. Simulated 3D shear stress field under different loads.
Mathematics 10 02512 g014
Figure 15. Simulated 3D maximum principal stress field under different loads.
Mathematics 10 02512 g015
Figure 16. Simulated 3D displacement field under different loads.
Mathematics 10 02512 g016
Figure 17. Stress state in mineral regions under a load of 10.19 MPa: (a) shear stress (b) maximum principal stress.
Mathematics 10 02512 g017
Figure 18. Distribution of maximum principal stress and shear stress under a 10.19-MPa load.
Mathematics 10 02512 g018
Figure 19. Proportion of maximum principal stress (a) and shear stress (b) at different pressures.
Mathematics 10 02512 g019
Figure 20. Shear stresses and principal stresses in different matrices (C—coal, M—mineral, and F—fracture).
Mathematics 10 02512 g020
Table 1. Mean displacements of different ROIs.
ItemStageROI1ROI2ROI3
Mean displacementAll stages (μm)76.88773.61366.089
Post-peak stage (μm)148.336136.263117.470
Publisher’s Note: MDPI stays neutral with regard to jurisdictional claims in published maps and institutional affiliations.

