Abstract
Vaccination strategies remain one of the most effective and feasible preventive measures in combating infectious diseases, particularly during the COVID-19 pandemic. With the passage of time, continuous long-term lockdowns became impractical, and the effectiveness of contact-tracing procedures significantly declined as the number of cases increased. This paper presents a mathematical assessment of the dynamics and prevention of COVID-19, taking into account the constant and time-varying optimal COVID-19 vaccine with multiple doses. We attempt to develop a mathematical model by incorporating compartments with individuals receiving primary, secondary, and booster shots of the COVID-19 vaccine in a basic epidemic model. Initially, the model is rigorously studied in terms of qualitative analysis. The stability analysis and mathematical results are presented to demonstrate that the model is asymptotically stable both locally and globally at the COVID-19-free equilibrium state. We also investigate the impact of multiple vaccinations on the COVID-19 model’s results, revealing that the infection risk can be reduced by administrating the booster vaccine dose to those individuals who already received their first vaccine doses. The existence of backward bifurcation phenomena is studied. A sensitivity analysis is carried out to determine the most sensitive parameter on the disease incidence. Furthermore, we developed a control model by introducing time-varying controls to suggest the optimal strategy for disease minimization. These controls are isolation, multiple vaccine efficacy, and reduction in the probability that different vaccine doses do not develop antibodies against the original virus. The existence and numerical solution to the COVID-19 control problem are presented. A detailed simulation is illustrated demonstrating the population-level impact of the constant and time-varying optimal controls on disease eradication. Using the novel concept of human awareness and several vaccination doses, the elimination of COVID-19 infections could be significantly enhanced.
Keywords:
COVID-19 pandemic; multiple vaccine doses; sensitivity analysis; time-varying optimal controls; Pontryagin maximum principle MSC:
93D05; 34A34; 49J15; 92B10
1. Introduction
The world’s economy, communities, and public health have been profoundly impacted by the emergence of the novel coronavirus, SARS-CoV-2, which led to the COVID-19 pandemic. The first case of infection with this virus appeared in December 2019 in Wuhan, Hubei province of China [1]. This disease quickly spread outside of China only a few weeks after it first appeared. Initial reports of the disease outside China came from Japan and Thailand [2]. The COVID-19 pandemic has had a significant impact on society in different aspects. From a global health perspective, the virus has led to millions of worldwide cases of infection and loss of life. It has strained healthcare systems, particularly in regions with limited resources and capacity. This global disease also has far-reaching impacts on the economy, with disruptions in worldwide supply chains, business closures, and job losses. Socially, COVID-19 has led to school closures, travel restrictions, and changes in social behaviors, affecting individuals’ mental health and well-being [3]. Extensive scientific investigation has been carried out to comprehend the dynamics and transmission of the SARS-CoV-2 virus [4]. There are many different indications and symptoms that COVID-19 might exhibit. On the other hand, some patients may remain symptom-free, and some may experience mild and then severe disease symptoms. Fever, coughing, sore throat, shortness of breath, feelings of exhaustion or low energy, muscle discomfort, and body pains are among the main signs and symptoms of COVID-19 [5,6]. The presence and intensity of symptoms can differ from person to person, and some people may not experience any symptoms at all or only experience minor ones. Different countries employ various techniques to stop the spread of infections, and the majority of countries adhere to similar rules such as social distancing, isolation, and self-quarantine [7].
Vaccination remains one of the effective interventions against severe infectious diseases [8,9,10]. The careful application of non-pharmaceutical therapies and vaccination programs work together to reduce the spread of COVID-19 globally. To prevent the disease, multiple dosages of vaccines are given. The majority of vaccinations are given to a person as primary (first time), secondary (second time), and booster shots (third time). The first course of vaccination doses administered to people who have never had any vaccination doses before is referred to as primary vaccination. The subsequent dosage given after the original immunization is referred to second-time vaccine and is also referred to as a second dose. The third-time vaccine is an additional dosage administered to people who have finished their first vaccine course to strengthen and prolong their immunological response [7].
In order to investigate the complex dynamics of infectious disease, different methodologies have been developed. The implementation of mathematical models is a valuable tool that has been utilized successfully to present different aspects of infectious diseases. Usually, these models include classical (ordinary and partial) derivatives [11,12,13], stochastic derivatives [14,15] and fractional derivatives [16,17]. In particular, to better explore the dynamic aspects of COVID-19, several epidemic models have been developed [18,19,20]. The impact of face mask use by the general public to curtail the COVID-19 pandemic was studied in [21]. Augusto et al. studied the changing behavior of the COVID-19 model [22]. The global impact of the first year of COVID-19 vaccination programs was studied in [23]. The impact of vaccination on two variants of COVID-19, alpha and delta, was studied in [24]. Ngonghala et al. [25] considered the omicron and delta variants of COVID-19 in the presence of multiple vaccinations. Their study revealed that treatment leads to a reduction in hospitalization rates, and the potential for COVID-19 elimination is increased when investments in control resources are directed toward promoting mask usage and vaccine intervention. In [26], the authors analyzed the mitigation of the pandemic via double-dose vaccination using an epidemic modeling approach. The outcomes of their study indicated that primary and secondary vaccination alone is not adequate for infection reduction, and thus it is essential to provide the booster shot (third time) of the vaccine for a better eradication of the infection. Recently, a similar fractional and fractal-fractional study with an exponential-type kernel analyzing the dynamics of COVID-19 under vaccination was presented in [27].
In this paper, we develop a mathematical model based on the SEVIHR type of compartmental model and incorporate three vaccine compartments for the first, second, and booster shots of COVID-19 vaccines. This study stands out from previous literature by considering multiple vaccination compartments in relation to the rates of antibody production against the original virus. We also used the assumption that vaccinated individuals might become infected with the virus if the antibodies have not been developed even after vaccinating to account for breakthrough infections. This enabled us to illustrate the reproductive number causing a significant widespread issue of the disease. The outcomes of these simulations aid those who are skeptical of vaccination in making thoughtful decisions. The section-wise description of the present work is as follows: The formulation of the COVID-19 model is presented in Section 2. Section 3 covers the basic qualitative properties and results of the proposed model. Section 4 presents the role of basic reproduction numbers, vaccination coverage, and bifurcation analysis. A simulation of the proposed model with constant control measures is given in Section 5. The sensitivity analysis is performed in Section 6. The formulation of the optimal control problem is given in Section 6. A simulation of the optimal control problem estimating the optimal solution is presented in Section 8. Finally, Section 9 presents the conclusion.
2. Modeling the Dynamics of COVID-19 with Multiple Vaccine Doses
We divide the total population into the following compartments: 1. susceptible individuals S; 2. exposed individuals E; 3. individuals with first-time vaccination ; 4. individuals with second-time vaccination ; 5. individuals with booster shots ; 6. infected individuals I; 7. hospitalized individuals ; and 8. R represents the recovered individuals. Therefore, the entire population can be expressed as
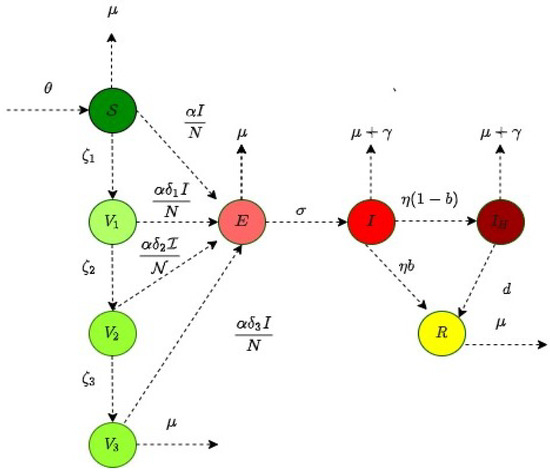
Figure 1.
Flow-Chart of the COVID-19 model with vaccinations (2).
3. Qualitative Analysis of the Model
This section presents necessary mathematical aspects of the proposed COVID-19 transmission model having multiple vaccine compartments. We proceed as follows:
3.1. Positivity and Boundedness
3.1.1. Positivity
Theorem 1.
Given Then, the solution of model (2) are positive for all
Proof.
First equation of the model (2) gives
The integrating factor is given by multiplying the inequality (3) by the integrating factor, we obtain,
The solution of (4) implies
In similar pattern, it can be shown that in the model (2). This implies that are all non-negative for non-negative initial conditions. □
3.1.2. Boundedness
Theorem 2.
The solution of the model (2) are bounded.
Proof.
Adding all the equations of the proposed model (2), we have
Solving the inequality in (5), we have the following steps.
Using the initial condition at implies that
Hence, is bounded by , and by using the comparison theorem [28], we deduce that , if . Therefore, remains the upper bound of the region
. Thus, the region is also positively invariant [29]. □
3.2. Equilibria and the Threshold Parameter of the Model
The COVID-19 compartmental model (2) exhibits two equilibria, namely, the COVID-free equilibrium , denoted as . This equilibrium can be given by the following expressions:
Taking the next generation approach into account [30], the threshold number is formulated as follows:
3.3. Local Stability at COVID-Free Equilibrium Point
Theorem 3.
Proof.
To establish the desired outcome, we need to demonstrate that the Jacobian of the linearized system at the CFE has negative eigenvalues. The matrix can be evaluated as
The eigenvalues of are , and the roots of the 2nd degree equation Here, the coefficients are defined in terms of the basic reproduction number as
Since, and if . Therefore, the well-known Ruth–Hurwitz criteria demonstrate that the system (2) is LAS. □
3.4. Global Asymptotic Stability of (GAS) for Special Case
The GAS of the model at CFE point is provided for a special case. Consider the special case of the model (2) with . The assumption regarding the subsequent parameters is made to facilitate mathematical analysis. The feasible region for the special case of the model (2) is constructed as
It can be shown that is a positive invariant set and attracts the solution of system (2) with respect to the special case. Moreover, the basic reproductive number of the reduced model is as follows:
Theorem 4.
The CFE of the special case of the model (2) with is GAS in whenever,
Proof.
where,
Thus, if further if So, the number of infected individuals becomes zero as Using in the above model, we have and as Thus, using Lyapunov stability theorem, every solution of the given model with non-negative initial condition approaches to as in . Thus, it follows that the system (2) is GAS. □
4. Interpretation of Vaccination Coverages Based on
We provide the critical rate of vaccine coverage that could lead to eradication of the infection, denoted as In a scenario with no vaccine, i.e., when and then is reduced to
After some rearrangement and with can be written as
Thus,
The partial derivative with respect to leads to the following form:
Therefore, and hence, implies Further, if it is important to note that
This interpretation suggests that when the value of is low, and if the effective reproductive number , the disease might not spread extensively provided that the first-dose vaccination coverage is substantial. Similarly, if
After some rearrangement, we have
Thus,
The partial differentiation with respect to yields
Therefore, and hence implies Further if it is important to note that
The above interpretation implies that when the value of is minimal and if the effective reproductive number , there is a possibility of infection elimination if the second vaccination coverage is substantial.
Finally, in a scenario if not only first and second vaccine doses are administrated, but additionally, a booster short is provided, i.e., when then,
Thus,
Taking partial derivative with respect to yields
Therefore, and hence implies . Further, if it is important to note that
This implies that when is minimal and the effective reproductive number , the disease has the potential to be eliminated through the administration of a booster shot to a person who had already received the initial dose.
Backward Bifurcation Analysis
In this subsection, we discuss the existence of backward bifurcation of the system (2). To analyze this, we follow the center manifold theory. If we take as bifurcation parameter then at we have,
The variables in the system (2) are subjected to the following variations so that and Further, using the vector notation . COVID-19 (2) can be written equivalently as where as shown below:
where
The Jacobian matrix evaluated at CFE point with is
The Jacobian matrix has a simple eigenvalue calculated at . The right and left eigenvectors are denoted by and , respectively, where
and,
Furthermore, bifurcation coefficients and of the proposed model (2) evaluated at are calculated as
So we have
The presence of the backward bifurcation in the system depends on the sign of , as indicated in [31]. Specifically, if and , the system will experience a backward bifurcation. In the context of backward bifurcation, the endemic equilibrium and the CFE coexist with one being stable and the other being unstable when . For the COVID-19 model (2), the biological significance of backward bifurcation lies in the fact that the condition is essential, but not solely adequate for mitigating the infection from the community. The outcome depends on the initial population size.
5. Estimating the Time Series Solution
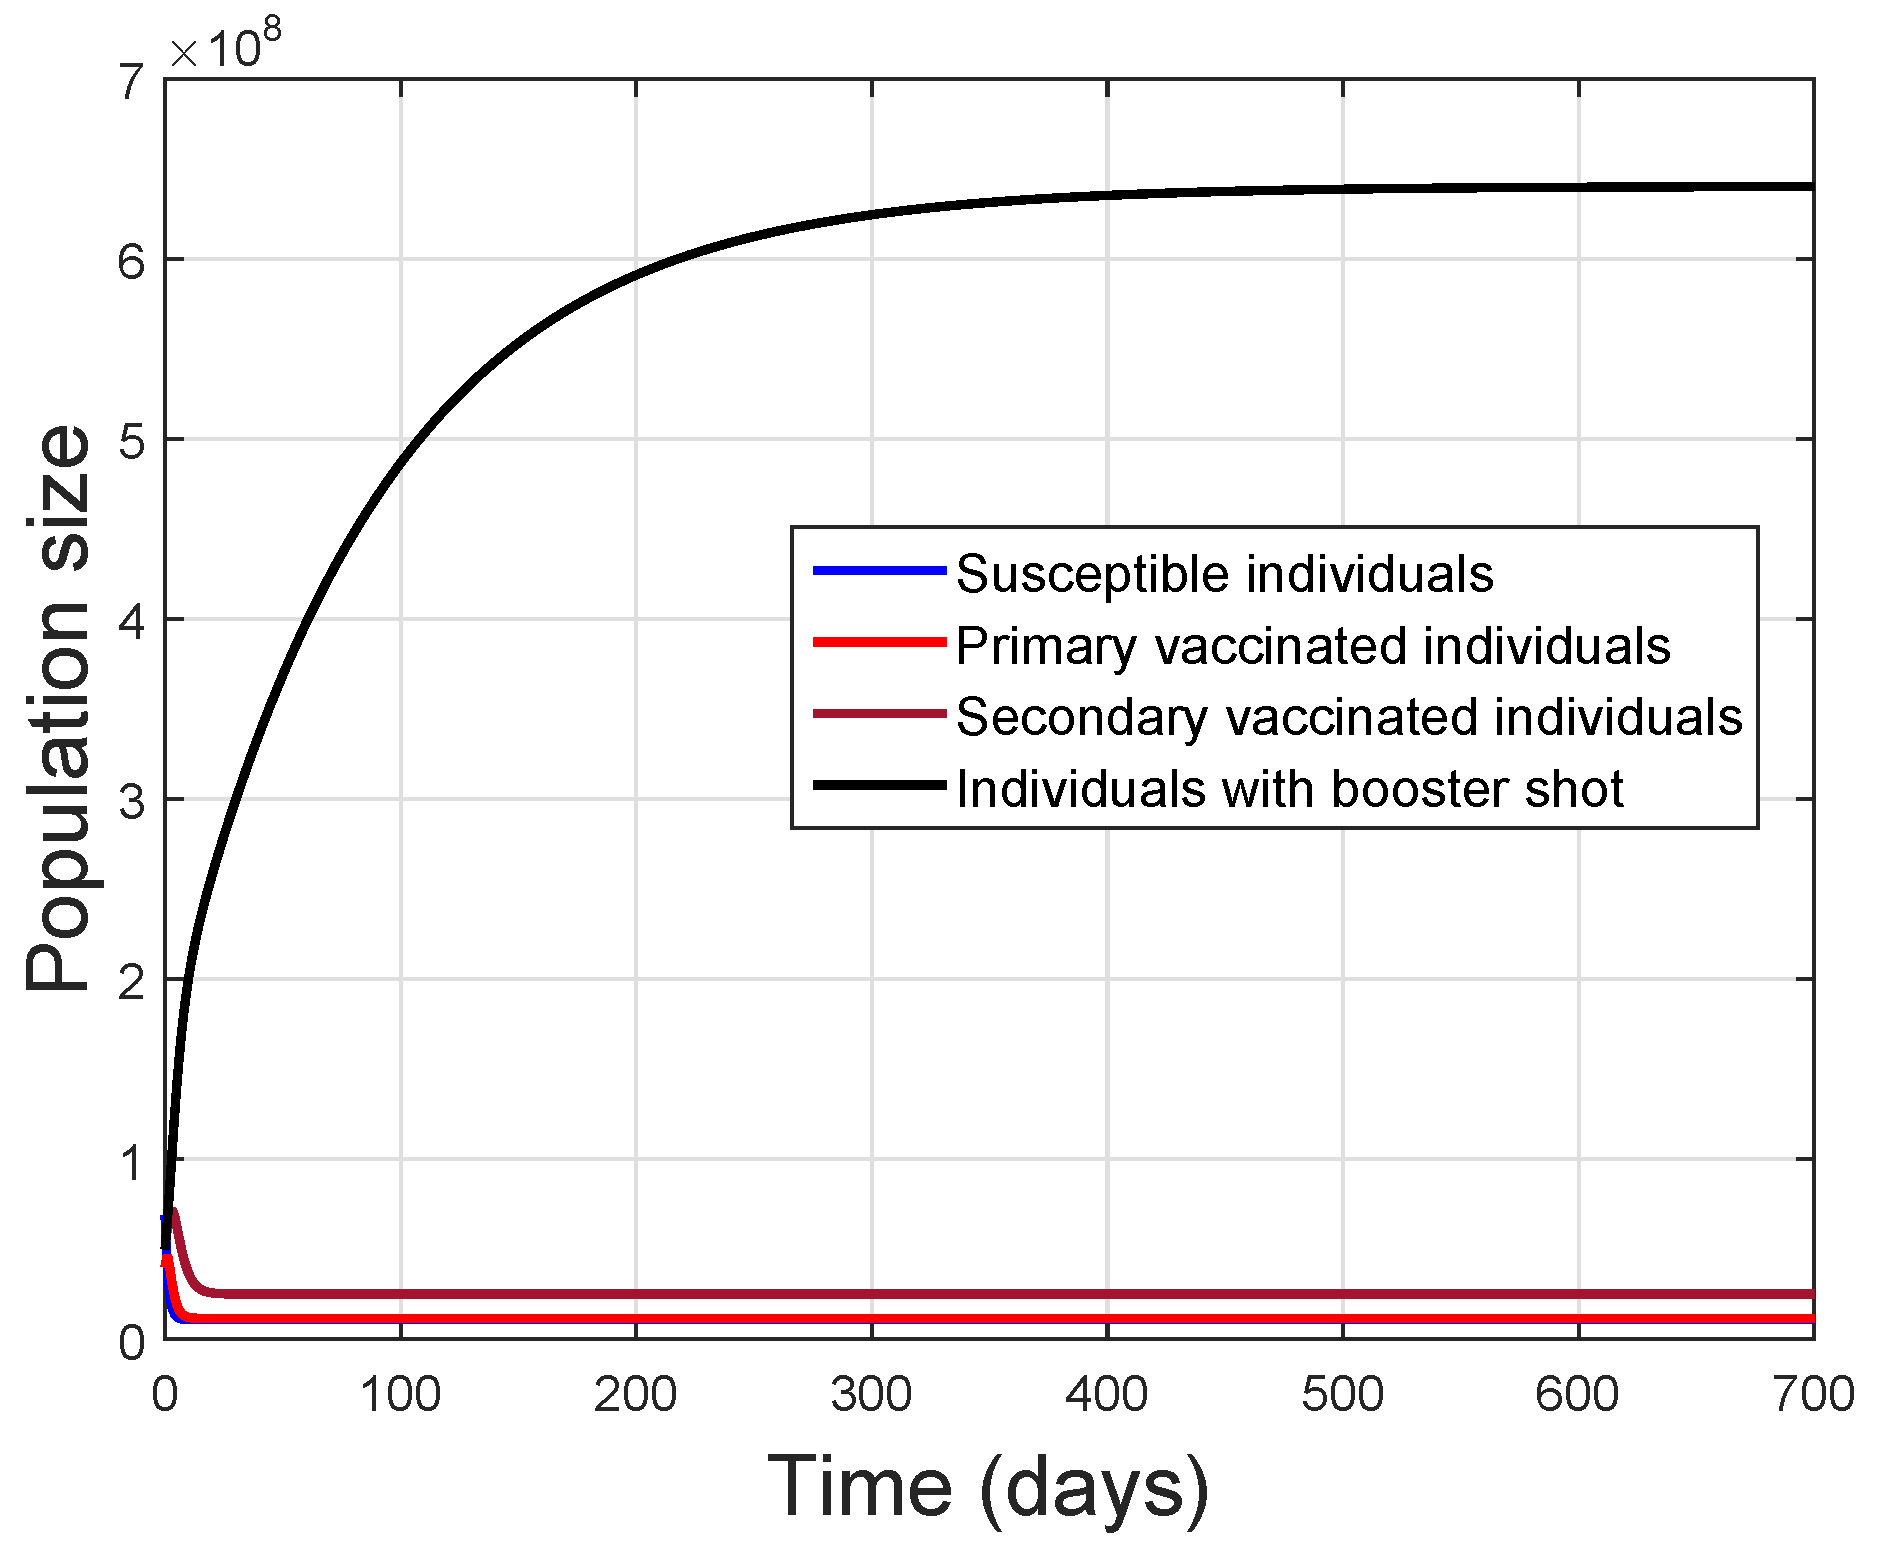
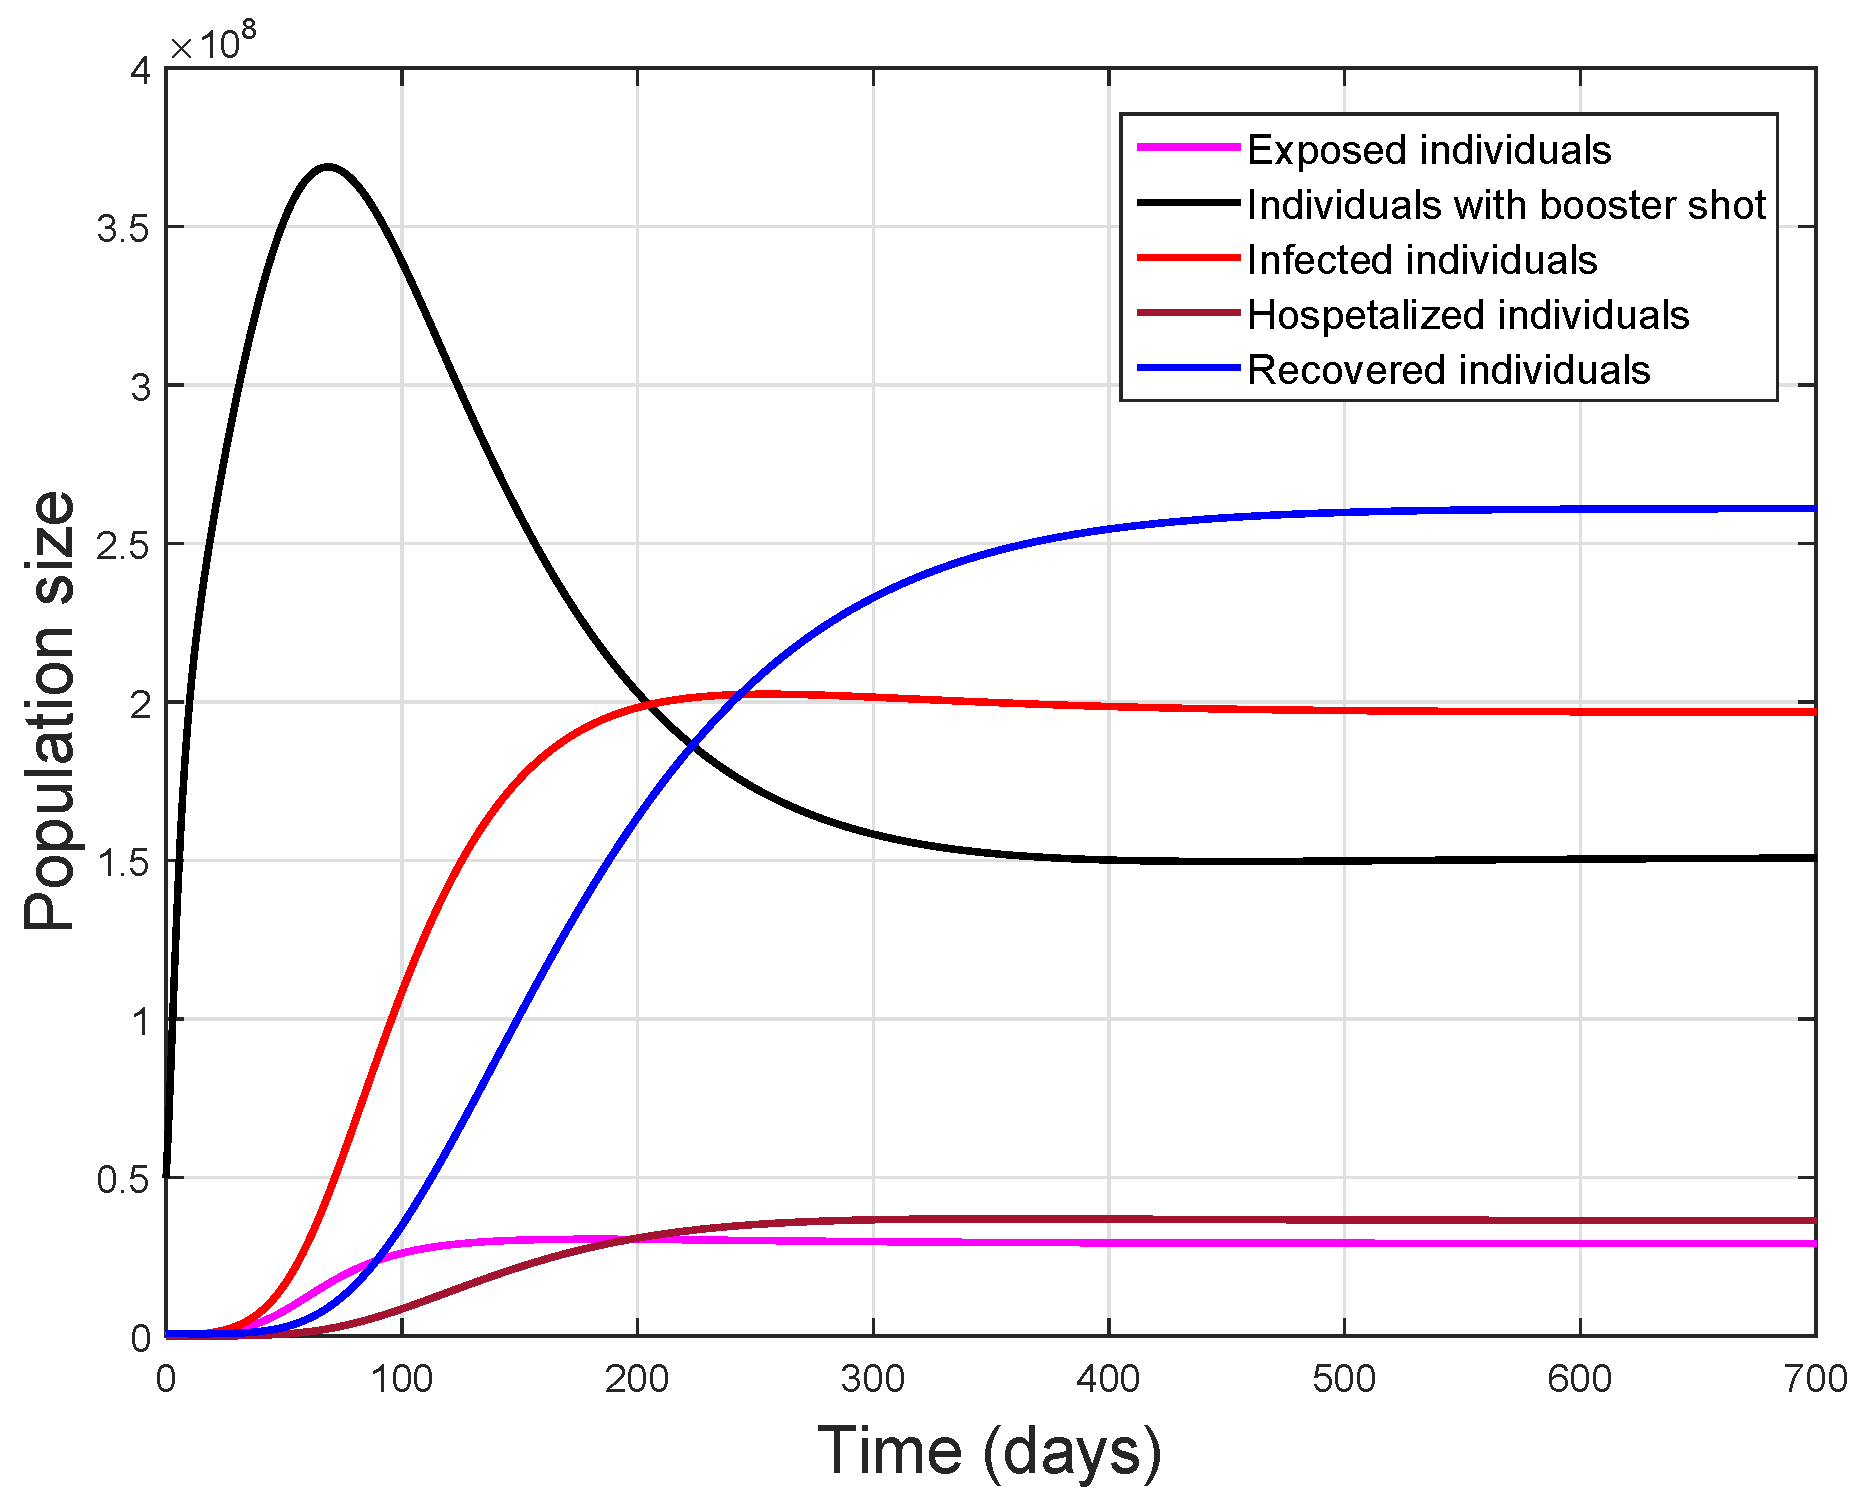
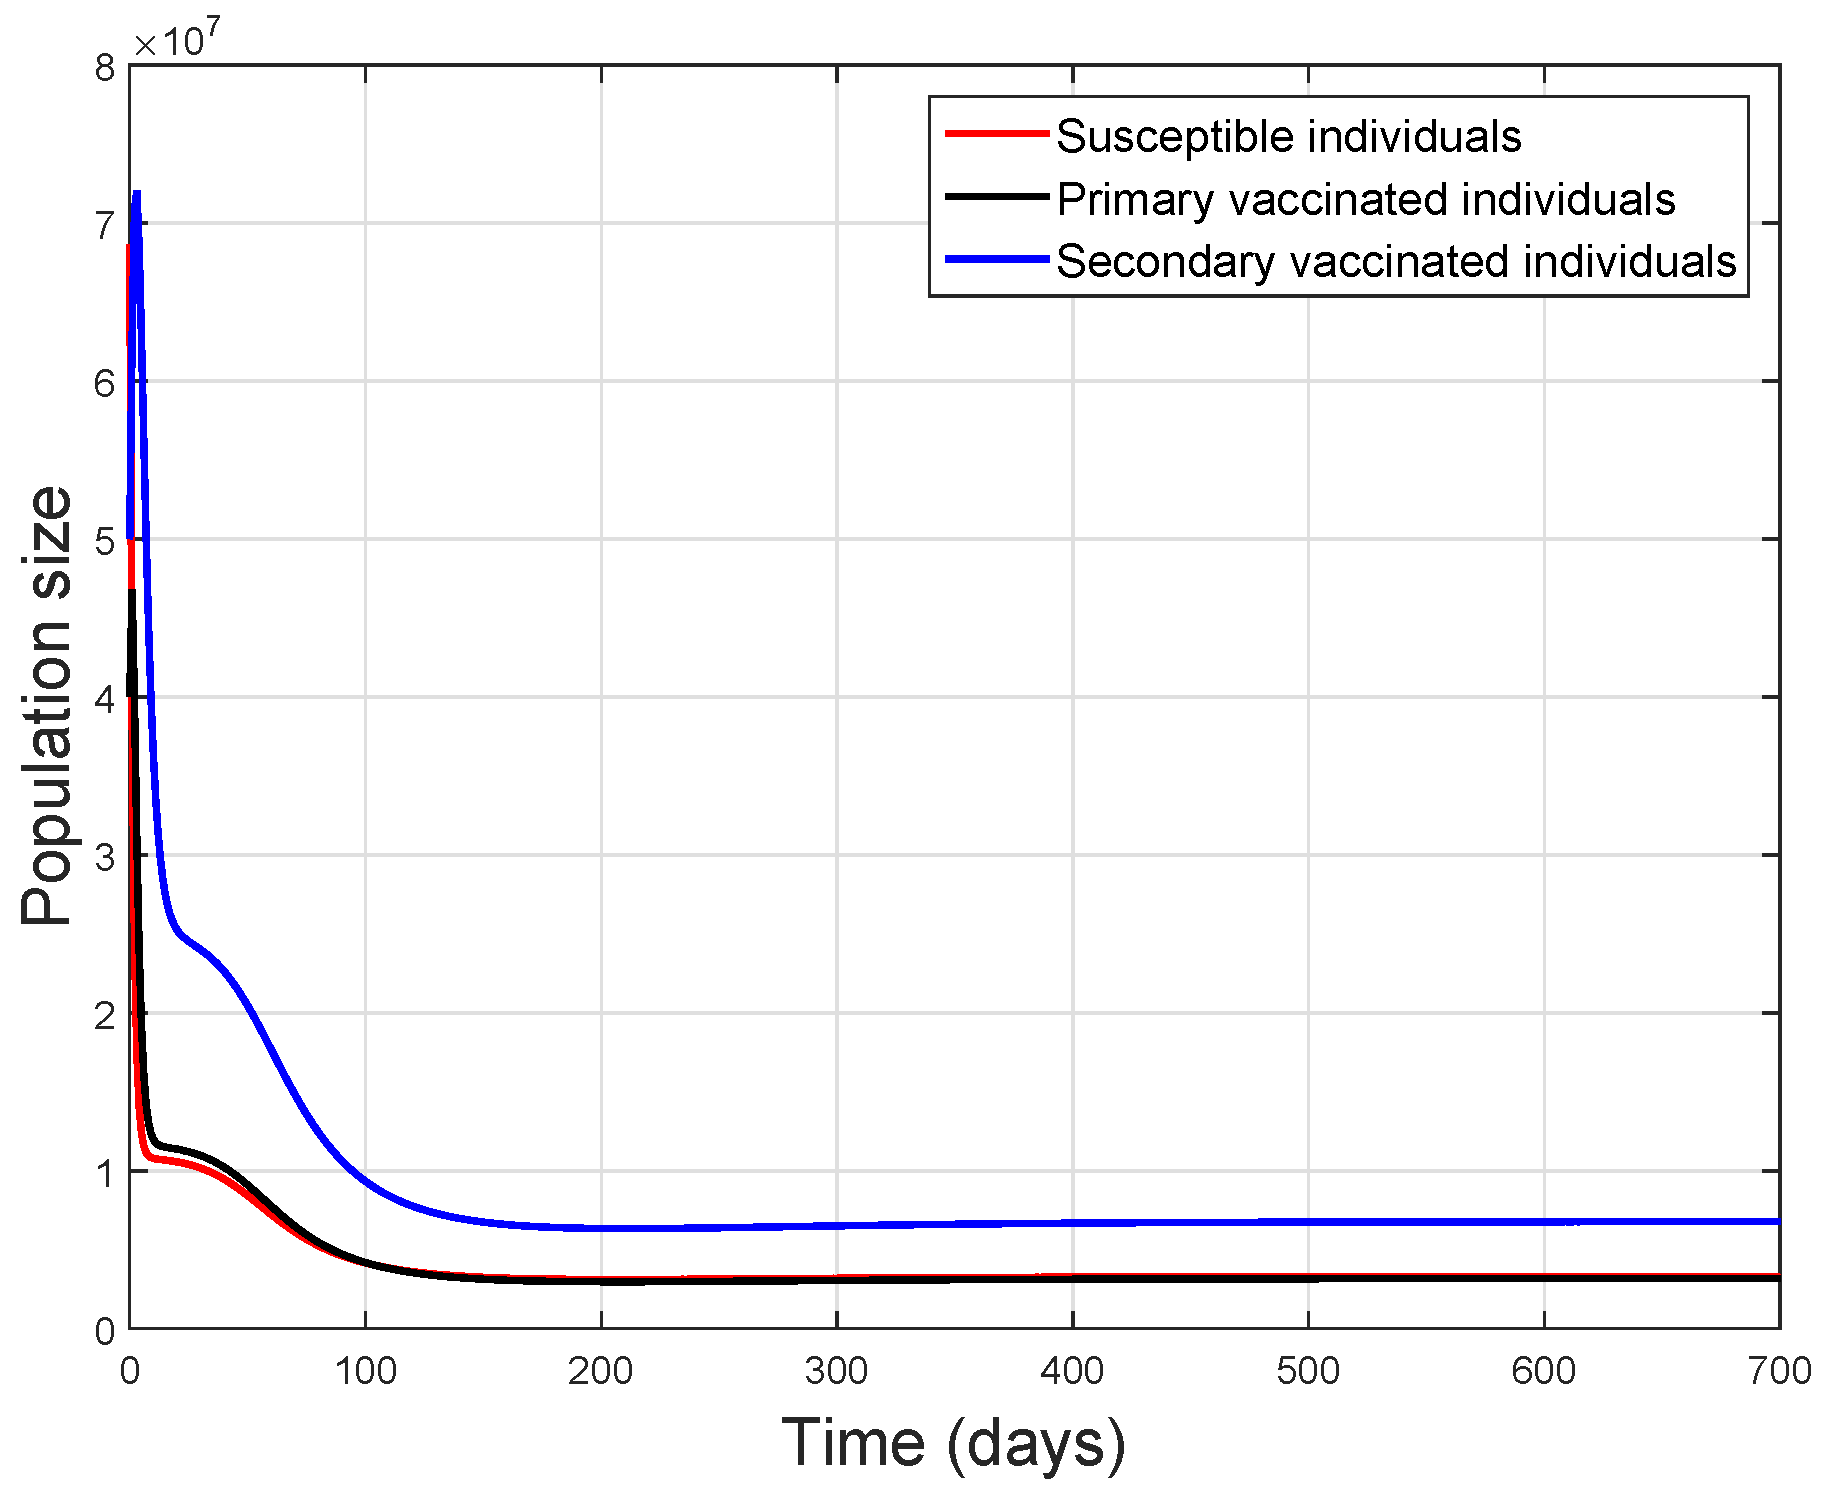
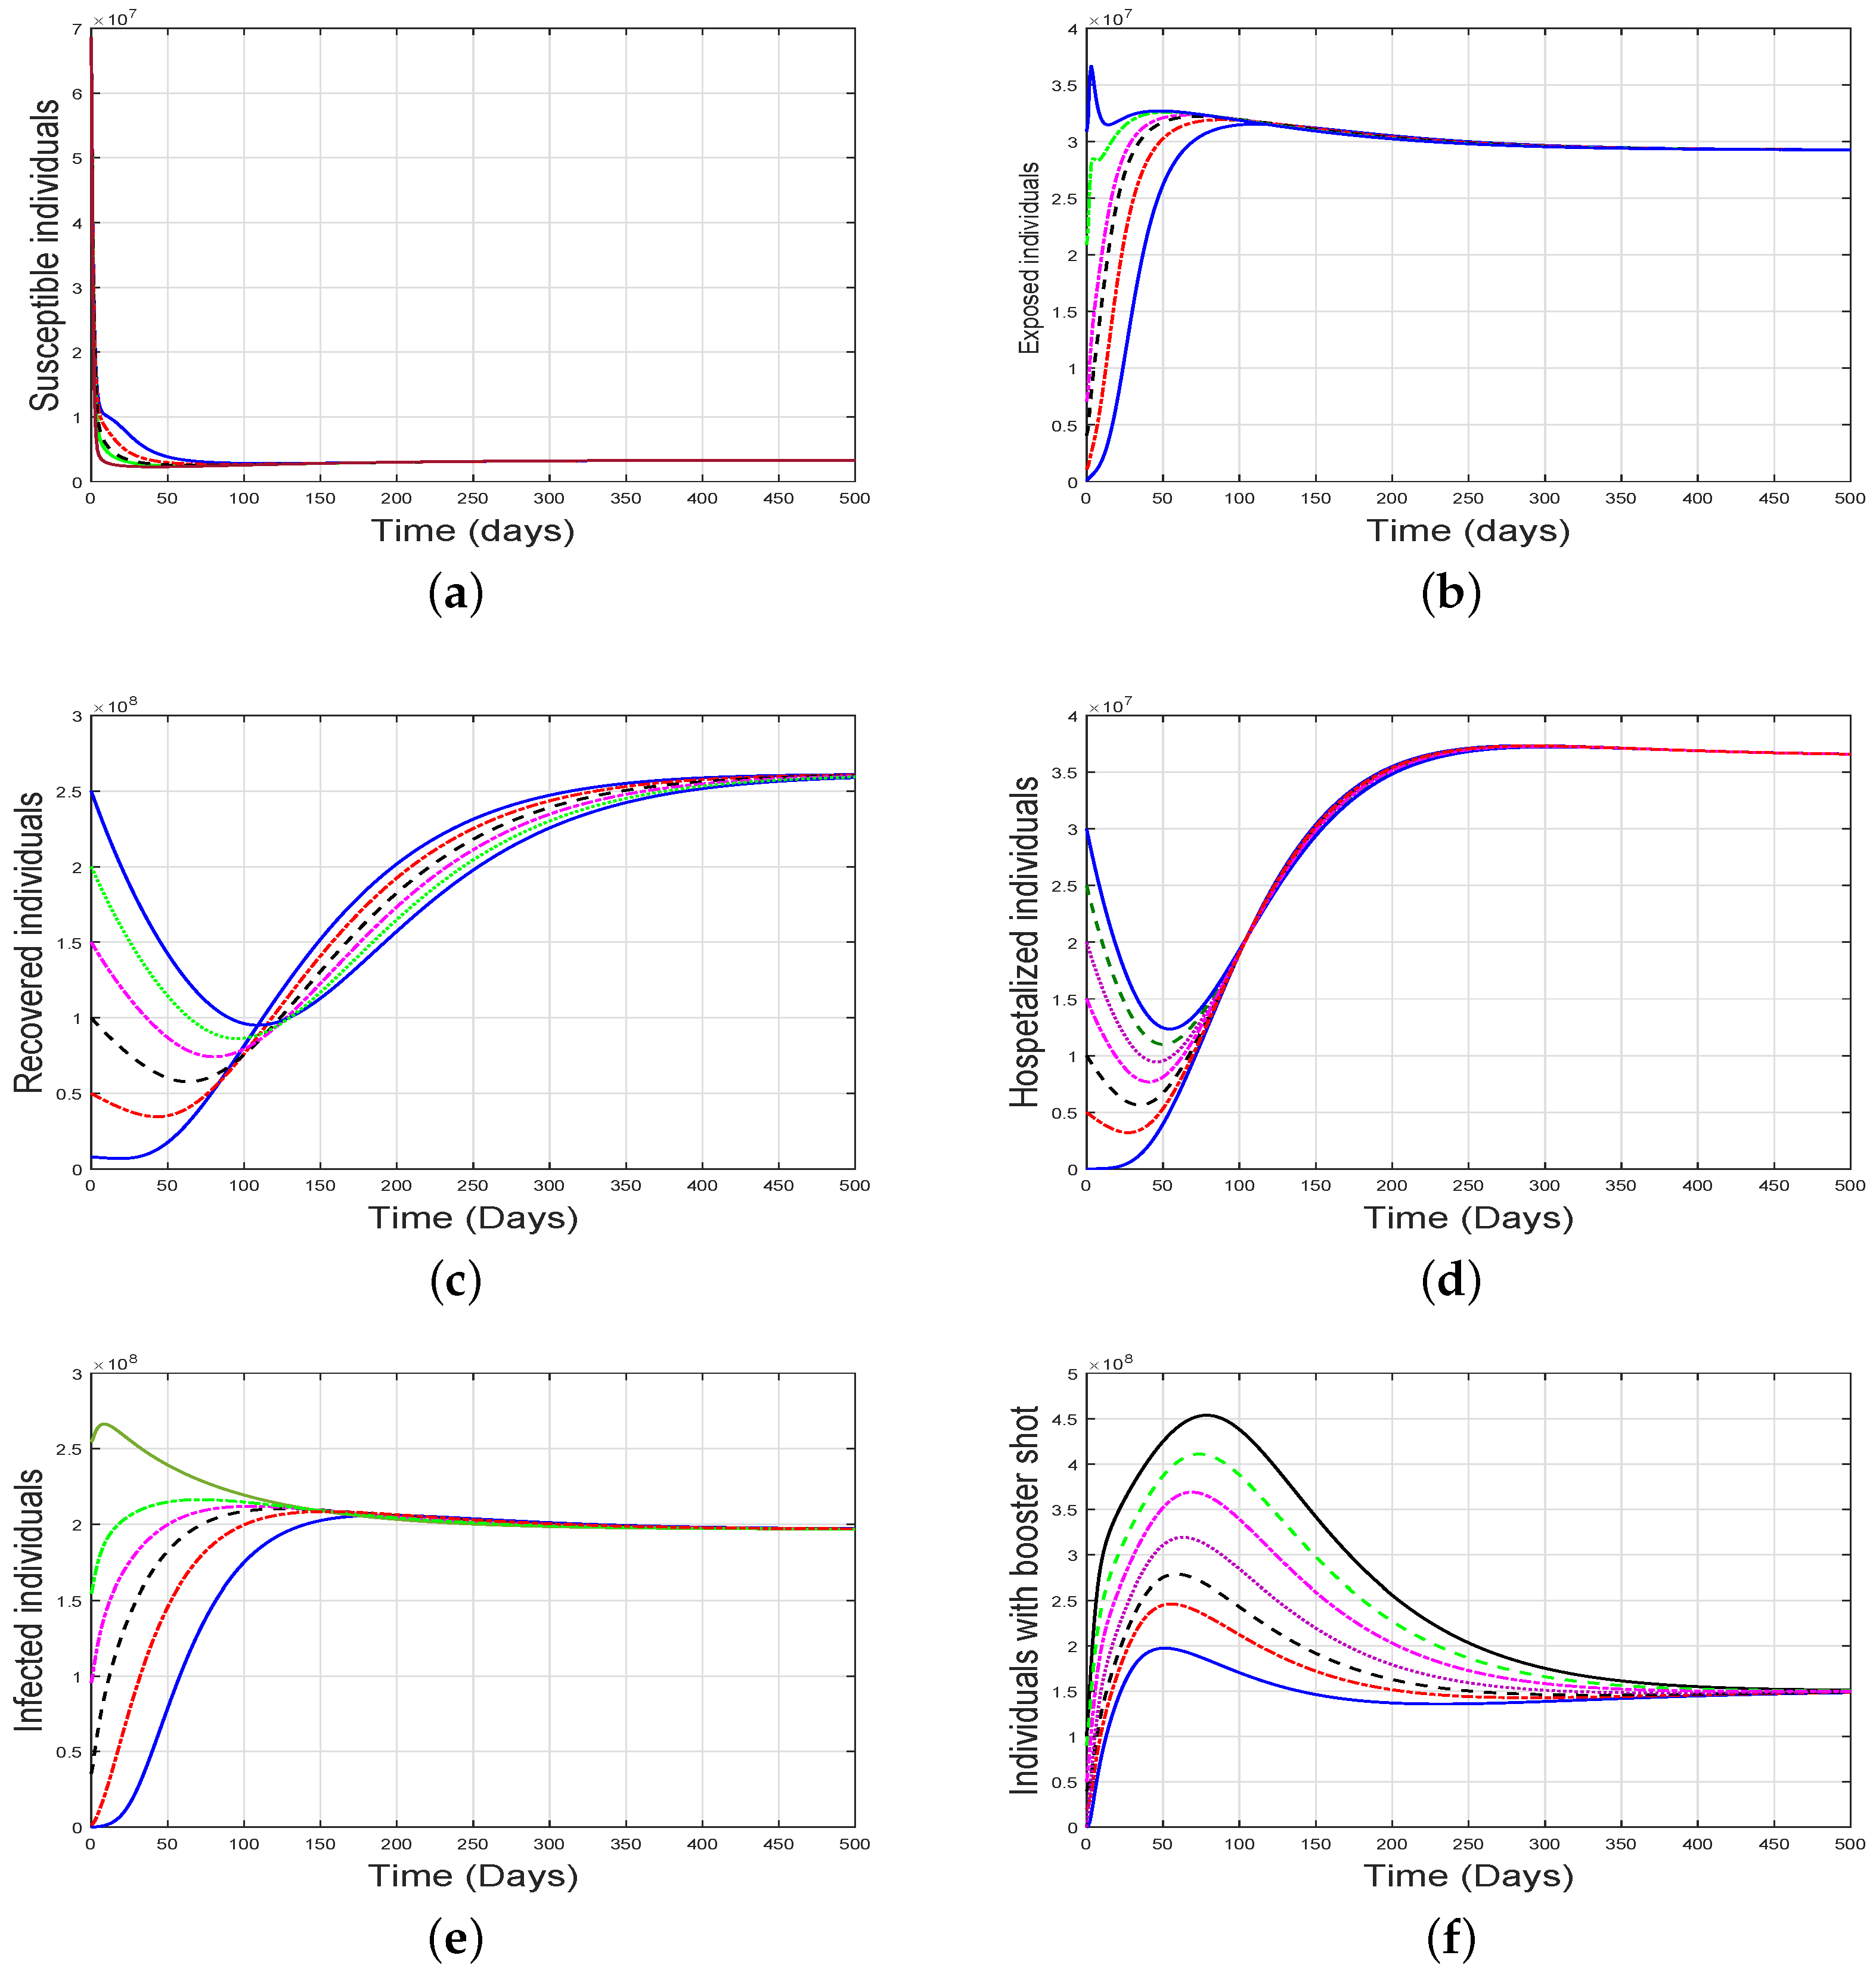
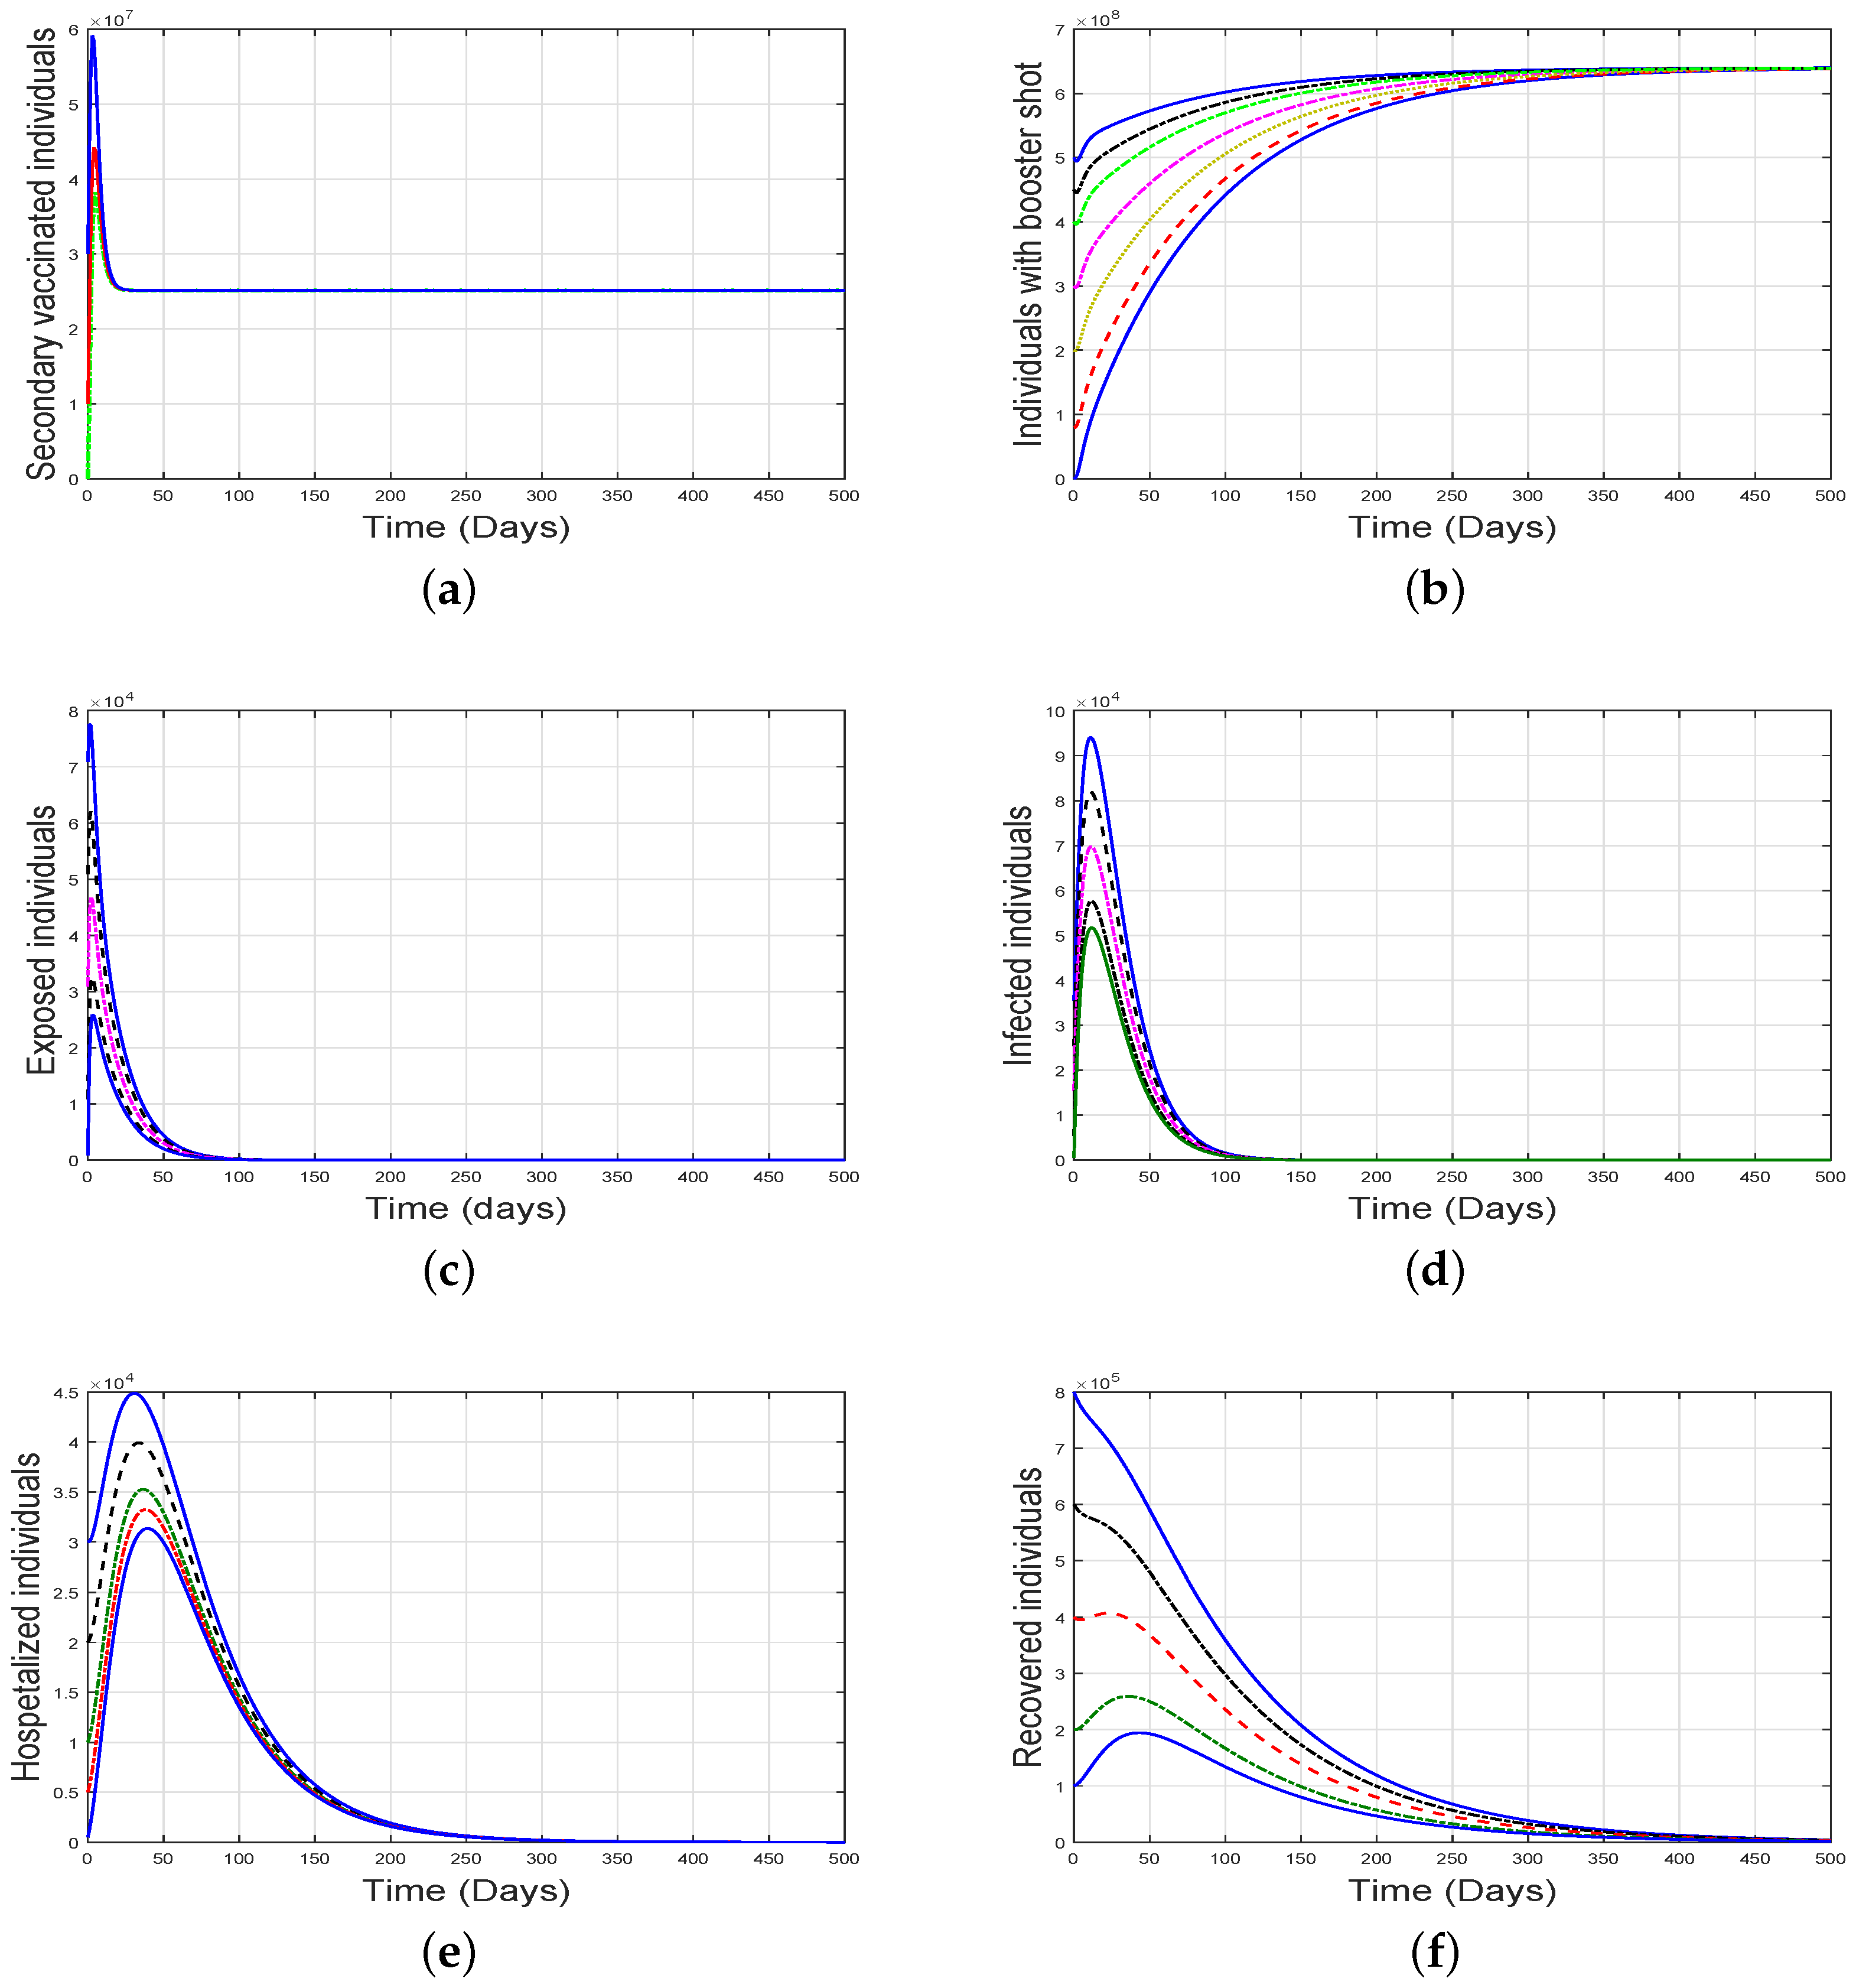
This section focuses on the numerical simulation of the epidemic model (2) to analyze the dynamics of various state variables for and . The model without optimal controls is numerically solved using the well-known Runge–Kutta iterative scheme of fourth order. Simulation is conducted in Matlab version R2022b for the 0–700 days. Initially, the model is simulated with the parameter values given in Table 1 such that , and the resulting plots are depicted in Figure 2 and Figure 3. The figures show that the population curves converge to the COVID-19-free equilibrium state. Similarly, in Figure 4 and Figure 5, a few values of the model’s parameters provided in Table 1 are changed in a way that . These graphical interpretations show that the solution trajectories converge to an endemic state. Moreover, we analyzed the dynamics of the model with different initial values of state variables for and as shown in the Figure 6 and Figure 7, respectively.

Table 1.
Description with numerical values of the model’s parameters.
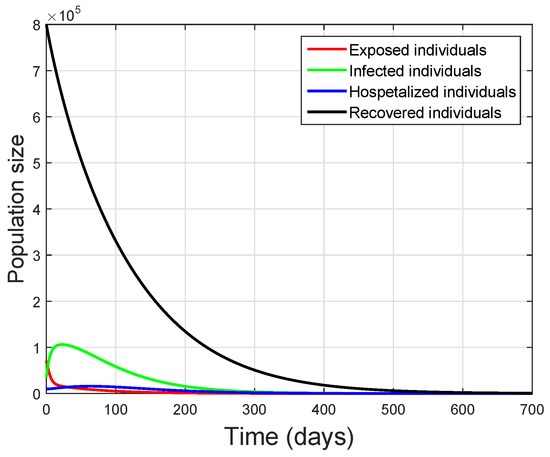
Figure 2.
Graphical results of the proposed model for exposed, infected, hospitalized and recovered compartments when .
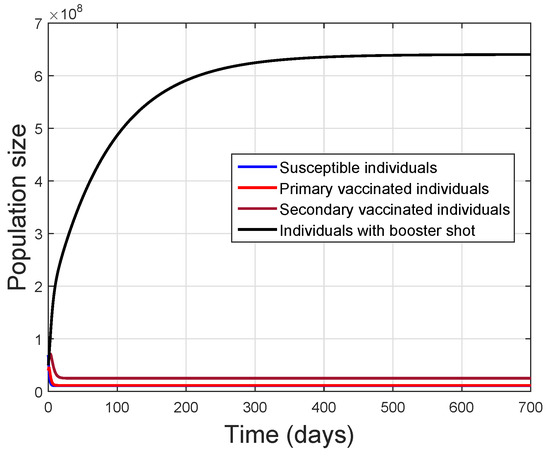
Figure 3.
Simulation of the proposed model for susceptible and vaccinated compartments using .
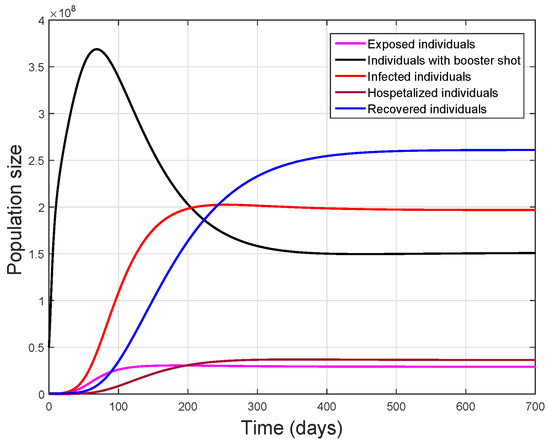
Figure 4.
Simulation of the proposed model for individuals with booster short, exposed, infected, hospitalized and recovered compartments when .
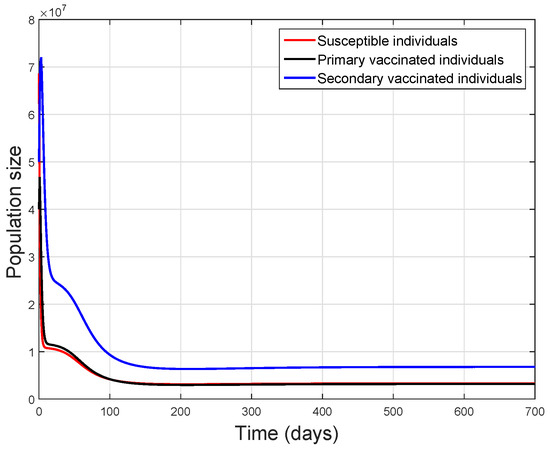
Figure 5.
Simulation of the proposed model for susceptible and primary and secondary vaccinated compartments when .
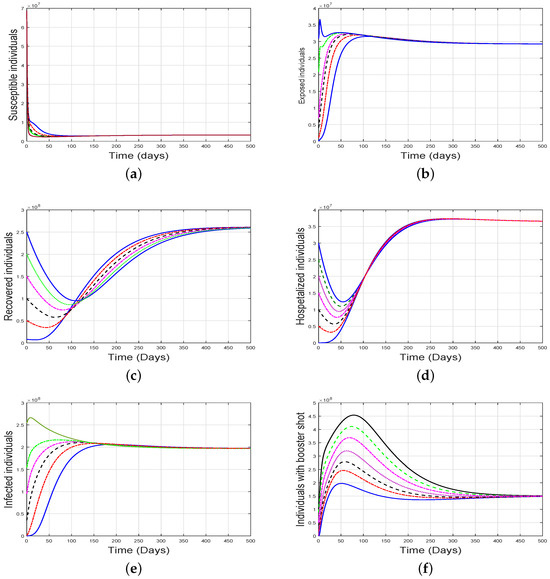
Figure 6.
Simulation of the proposed COVID-19 model with different initial values of the state variables and , where (a) susceptible, (b) exposed, (c) recovered, (d) hospitalized, (e) infected, (f) shows the individuals with booster short. The curves with different colors show the dynamics by choosing different values of the corresponding state variables.
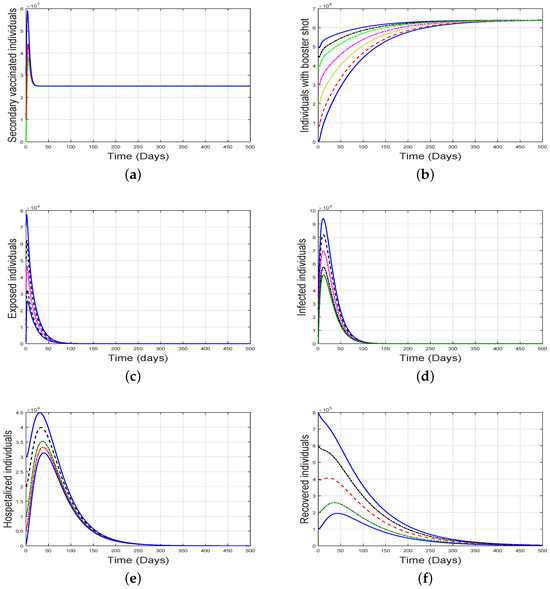
Figure 7.
Dynamics of the COVID-19 model with different initial values of the state variables and , where (a) secondary vaccinated, (b) individuals with booster short, (c) exposed, (d) infected, (e) hospitalized, (f) R] recovered individuals. The curves with different colors show the dynamics by choosing different values of the corresponding state variables.
In the next section, the application of optimal control theory for the mitigation of pandemic is carried out. Before establishing effective optimal controls, we perform the sensitivity analysis to investigate the most influential factors on the transmission of disease.
6. Sensitivity Analysis
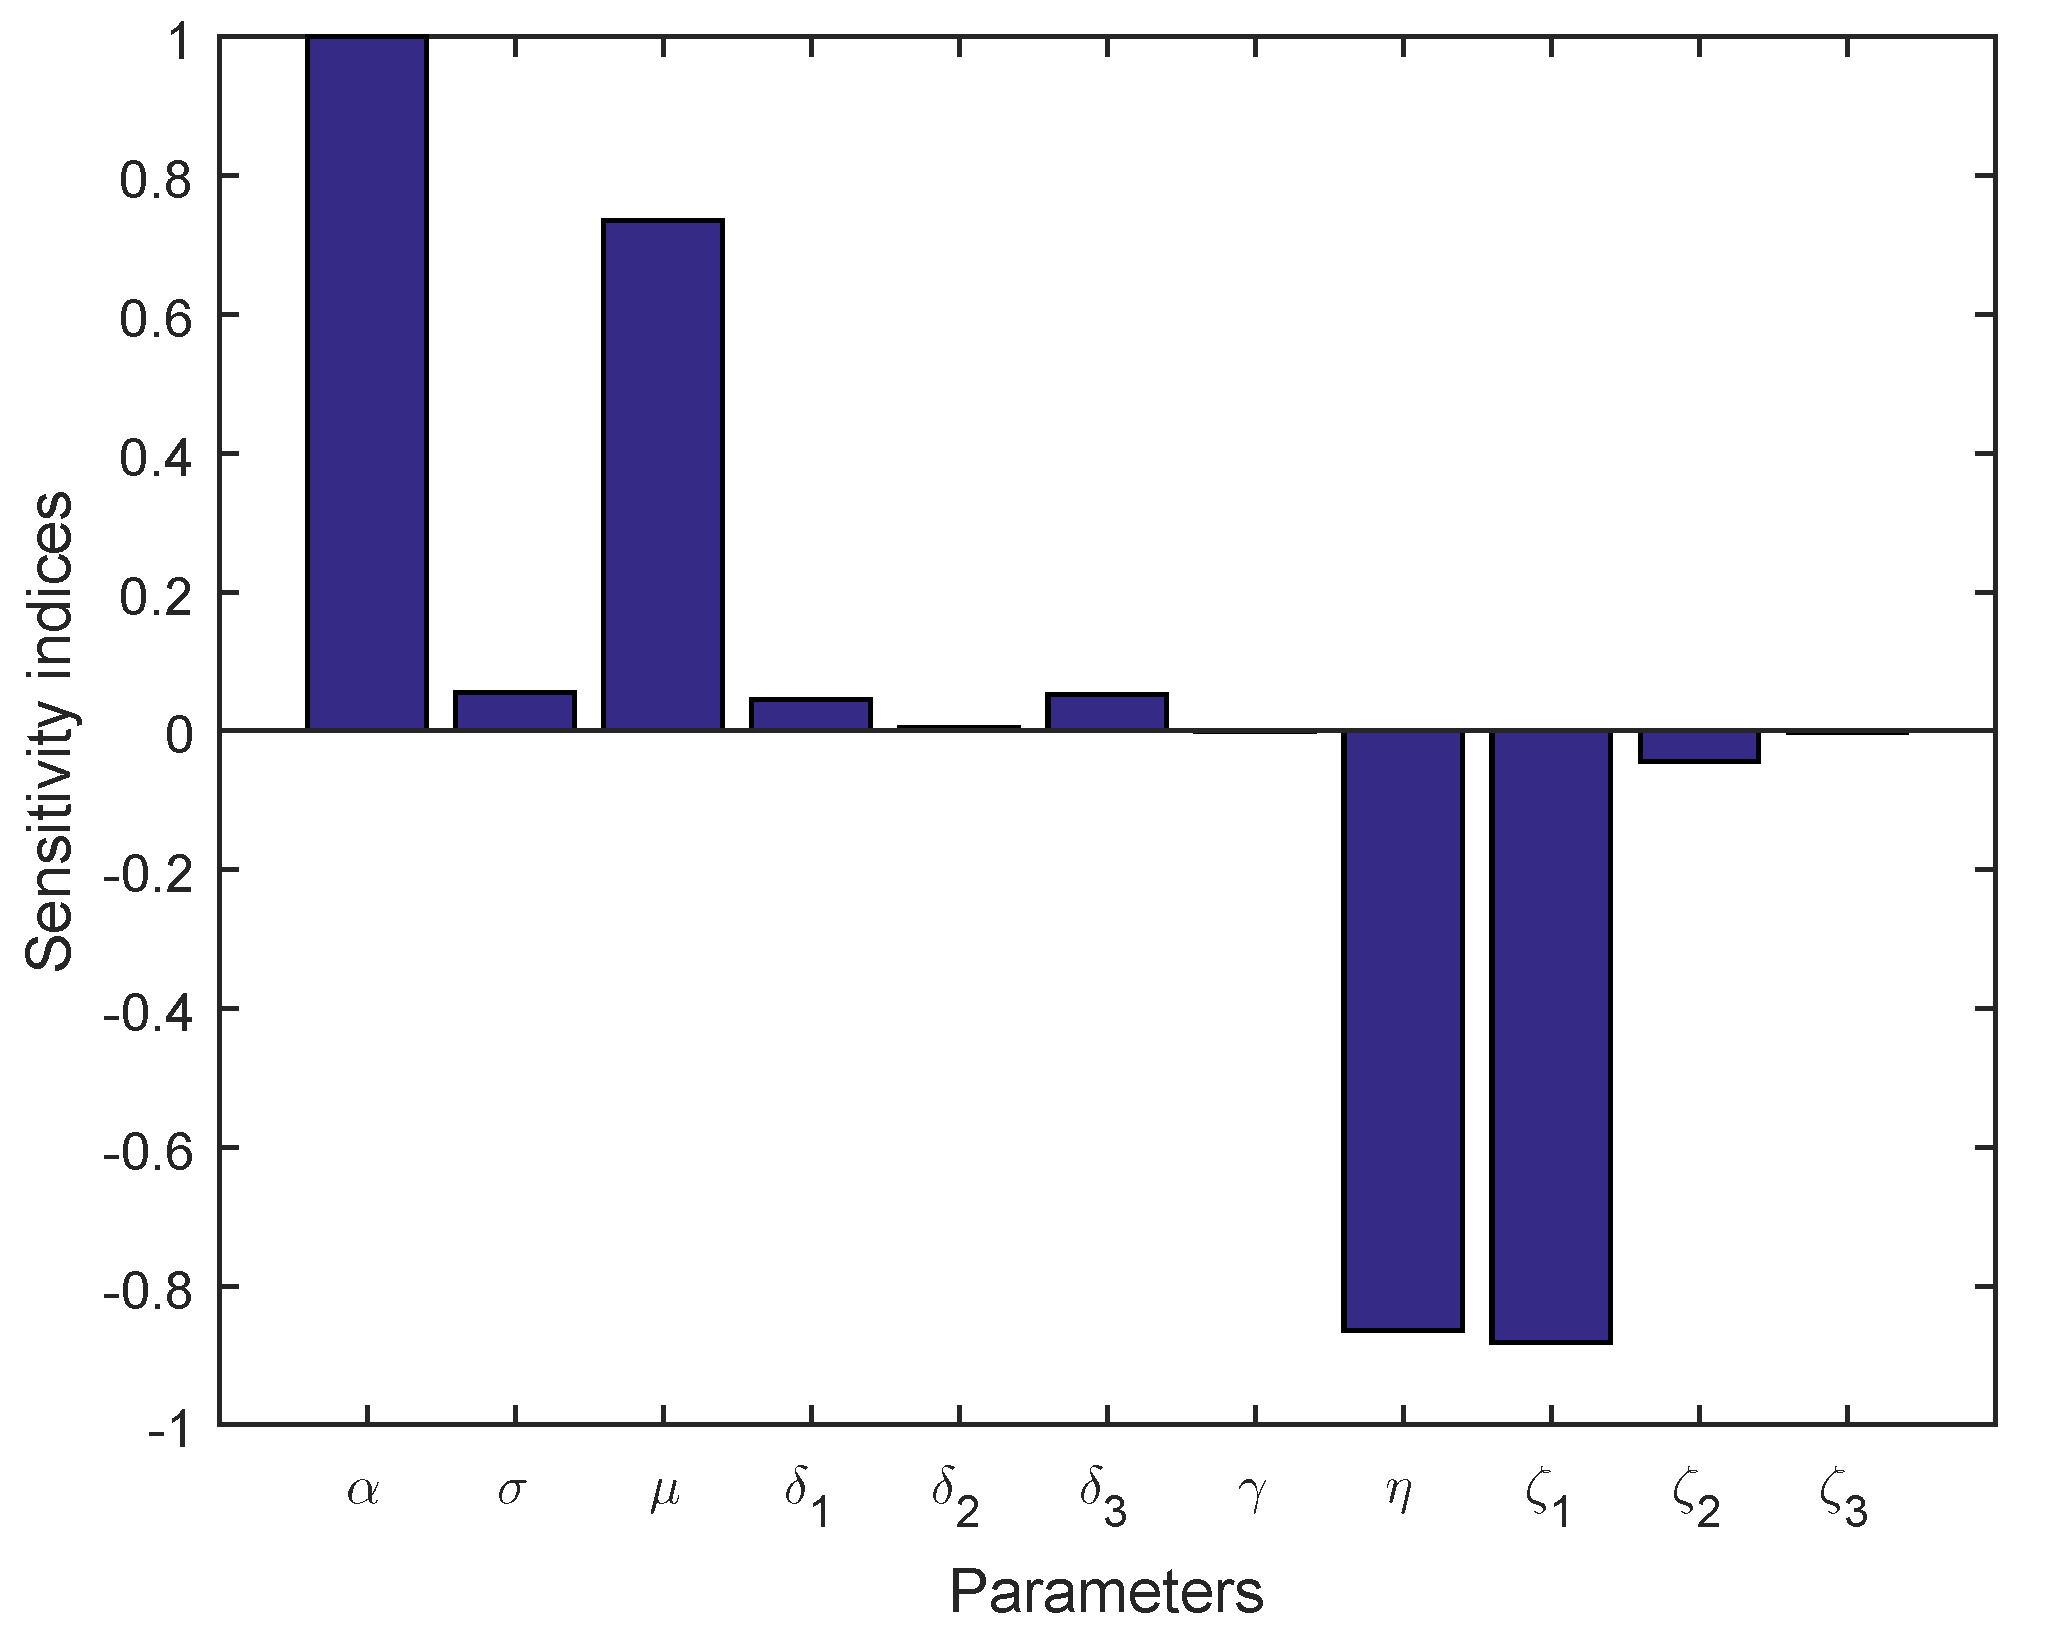
Sensitivity theory is a powerful tool that provides insights into the model’s behavior and helps in better understanding the influence of the variations in the input parameters on the respective output of the model. This technique is used in various fields, including economics, engineering, and biological sciences, to assess the potential factors of the problem under consideration. The analysis examines how small changes in the input values of the model affect the corresponding output. In the epidemiological modeling approach, sensitivity analysis provides valuable insights into identifying the parameters that play a substantial role in influencing disease transmission and control. In this study, we specifically performed sensitivity analysis of some crucial parameters. We employ the well-known normalized parametric scheme based on the forward sensitivity index of the model’s parameters, as described by Chitnis et al. [34]. A positive (or negative) index illustrates that the parameter has a direct (or inverse) effect on .
Definition 1.
The normalized sensitivity index, which is used to quantify the relative change in concerning changes in model’s various parameters, is defined as
Table 2.
Sensitivity index of the selected model’s parameters.
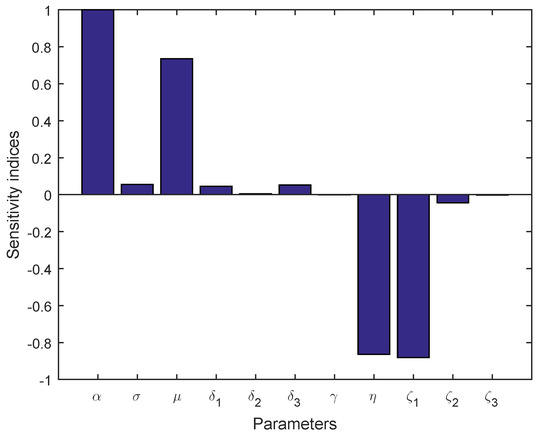
Figure 8.
Bar graph of sensitivity indices of the COVID-19 model.
The significant insights gained from the sensitivity analysis can be helpful in various applications such as
- Identifying potential parameters: This helps identify the input parameter(s) that play a substantial role in influencing disease dynamics.
- This helps understand how uncertainties in input parameters can propagate to uncertainties in the model’s predictions.
- Optimization: In optimization problems, the sensitivity indices of model parameters can guide the setting of appropriate optimal interventions.
- Decision-making: Understanding the sensitivity of the model to various inputs can assist decision-makers in making informed choices.
7. Optimal Control Analysis of COVID-19 Model
In this section, we introduce an optimal control strategy for the model (2). The aim of optimal control is to minimize the COVID-19 disease by providing the following control strategies.
- The first control is used to reduce the number of effective contacts between infected and susceptible individuals.
- The second control is used to enhance the first vaccine dose efficacy.
- The third control is used to reduce the possibility that after 28 days of vaccination, those who received the first dose do not develop immunity to the original virus.
- This control is used to reduce the possibility that after 28 days of vaccination, those who received the second dose do not develop immunity to the original virus.
- The fifth control is used to reduce the possibility that after 28 days of vaccination, those who received the third dose do not develop immunity to the original virus.
- The sixth control is used to enhance the second-time vaccination rate.
- This control is used to enhance the third-time vaccination rate.
By employing the controls mentioned above, this section formulates an optimal control problem that elucidates how time-dependent control strategies contribute to disease eradication. The control model is established in (8). Based on the sensitivity index, the desired controls are selected. Hence, the resulting control model is structured as follows:
with the same initial conditions given in (2). The respective objective functional is described as
where, are the balancing constants associated with the suggested variables of the objective function, are the the cost factors while T represents the final time. We used the quadratic objective functional due to the non-linearity of the intervention considered for the mitigation of the pandemic. For a more comprehensive understanding, please refer to the work and associated references [35,36,37]. Our primary goal is to identify the optimal controls
so that,
The corresponding control set is given by
The Lagrangian and Hamiltonian for the provided control system (8) are shown as and , respectively, and are given as follows:
and
where, for represents the adjoint variables.
Solution of Optimal Control Problem
In this section, the solution to the optimal control COVID-19 as outlined in (8) is established. To achieve this, famous Pontryagin’s principle [38,39] is employed. The desired optimal solution is denoted by . Furthermore, the following are the corresponding necessary optimality conditions used in the solution procedure stated as
The criterias mentioned in (13) and the following theorem has been utilized to derive the solution of the optimal system.
Theorem 5.
The controls and the solution of the control system (8) minimizing the objective functional in the problem, then there exist adjoint variables (co-state variables) . Further, the transversality conditions such that
Furthermore, the associated optimal controls and are given by
8. Estimating the Optimal Solution
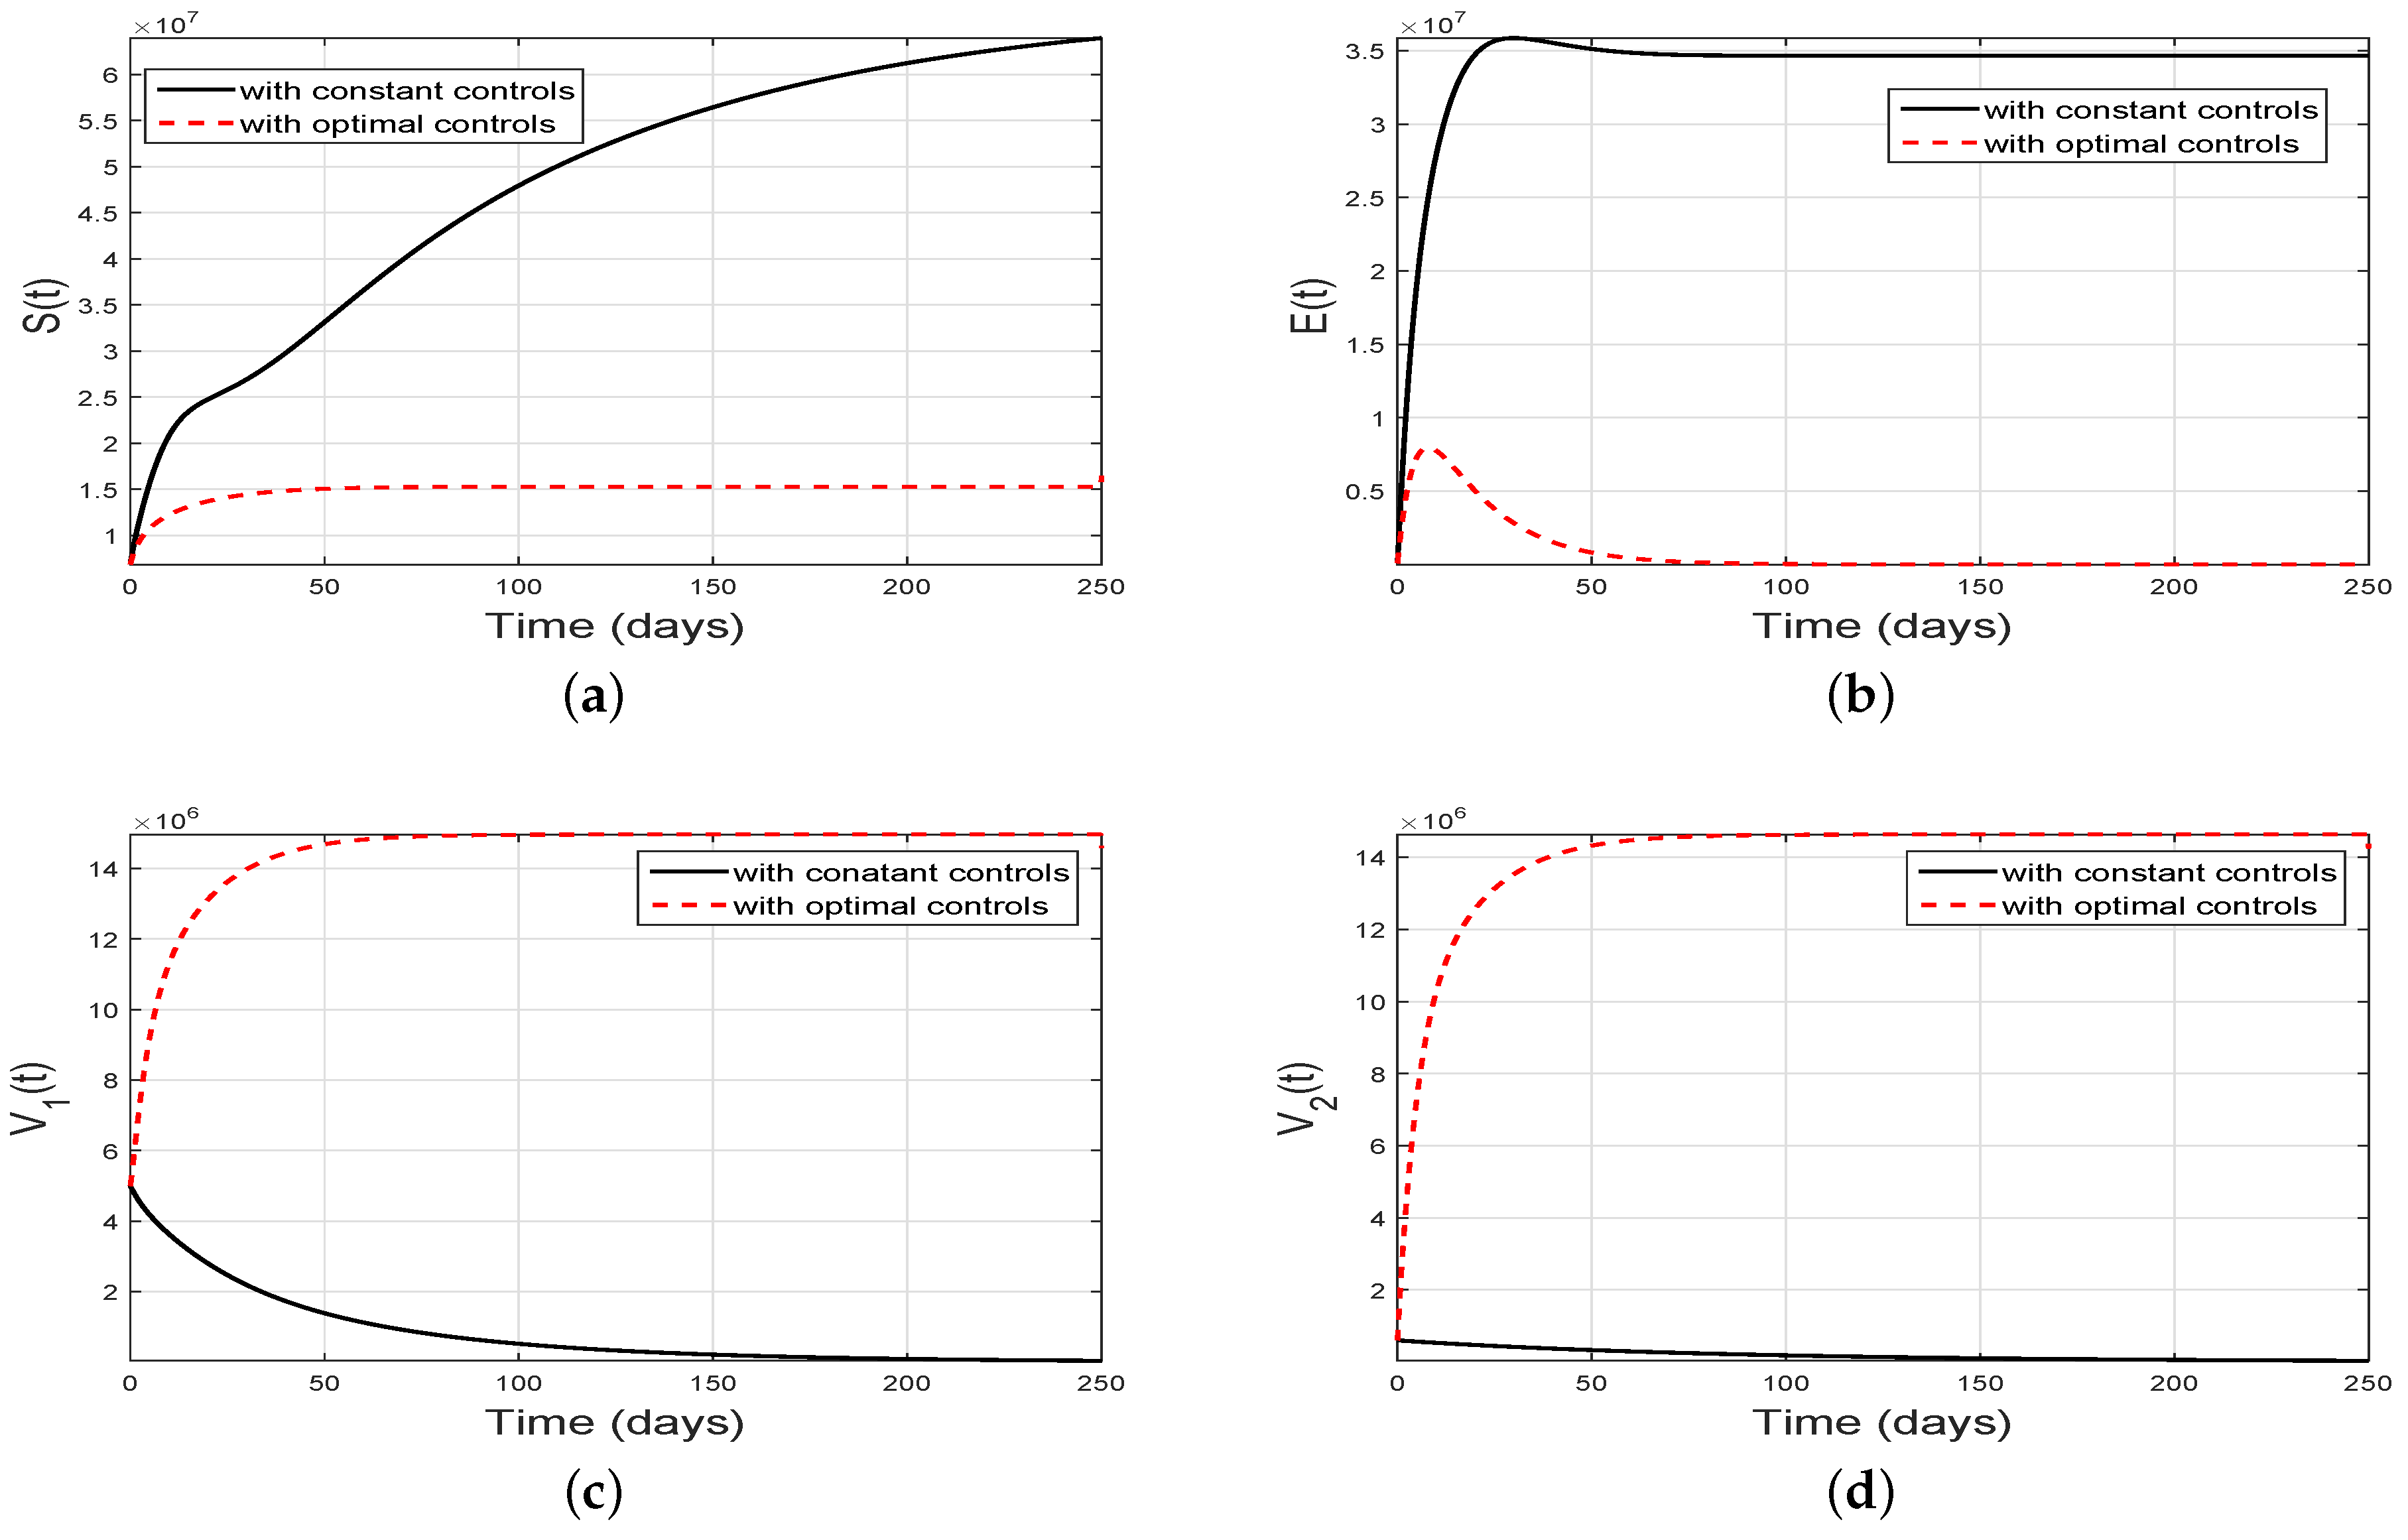
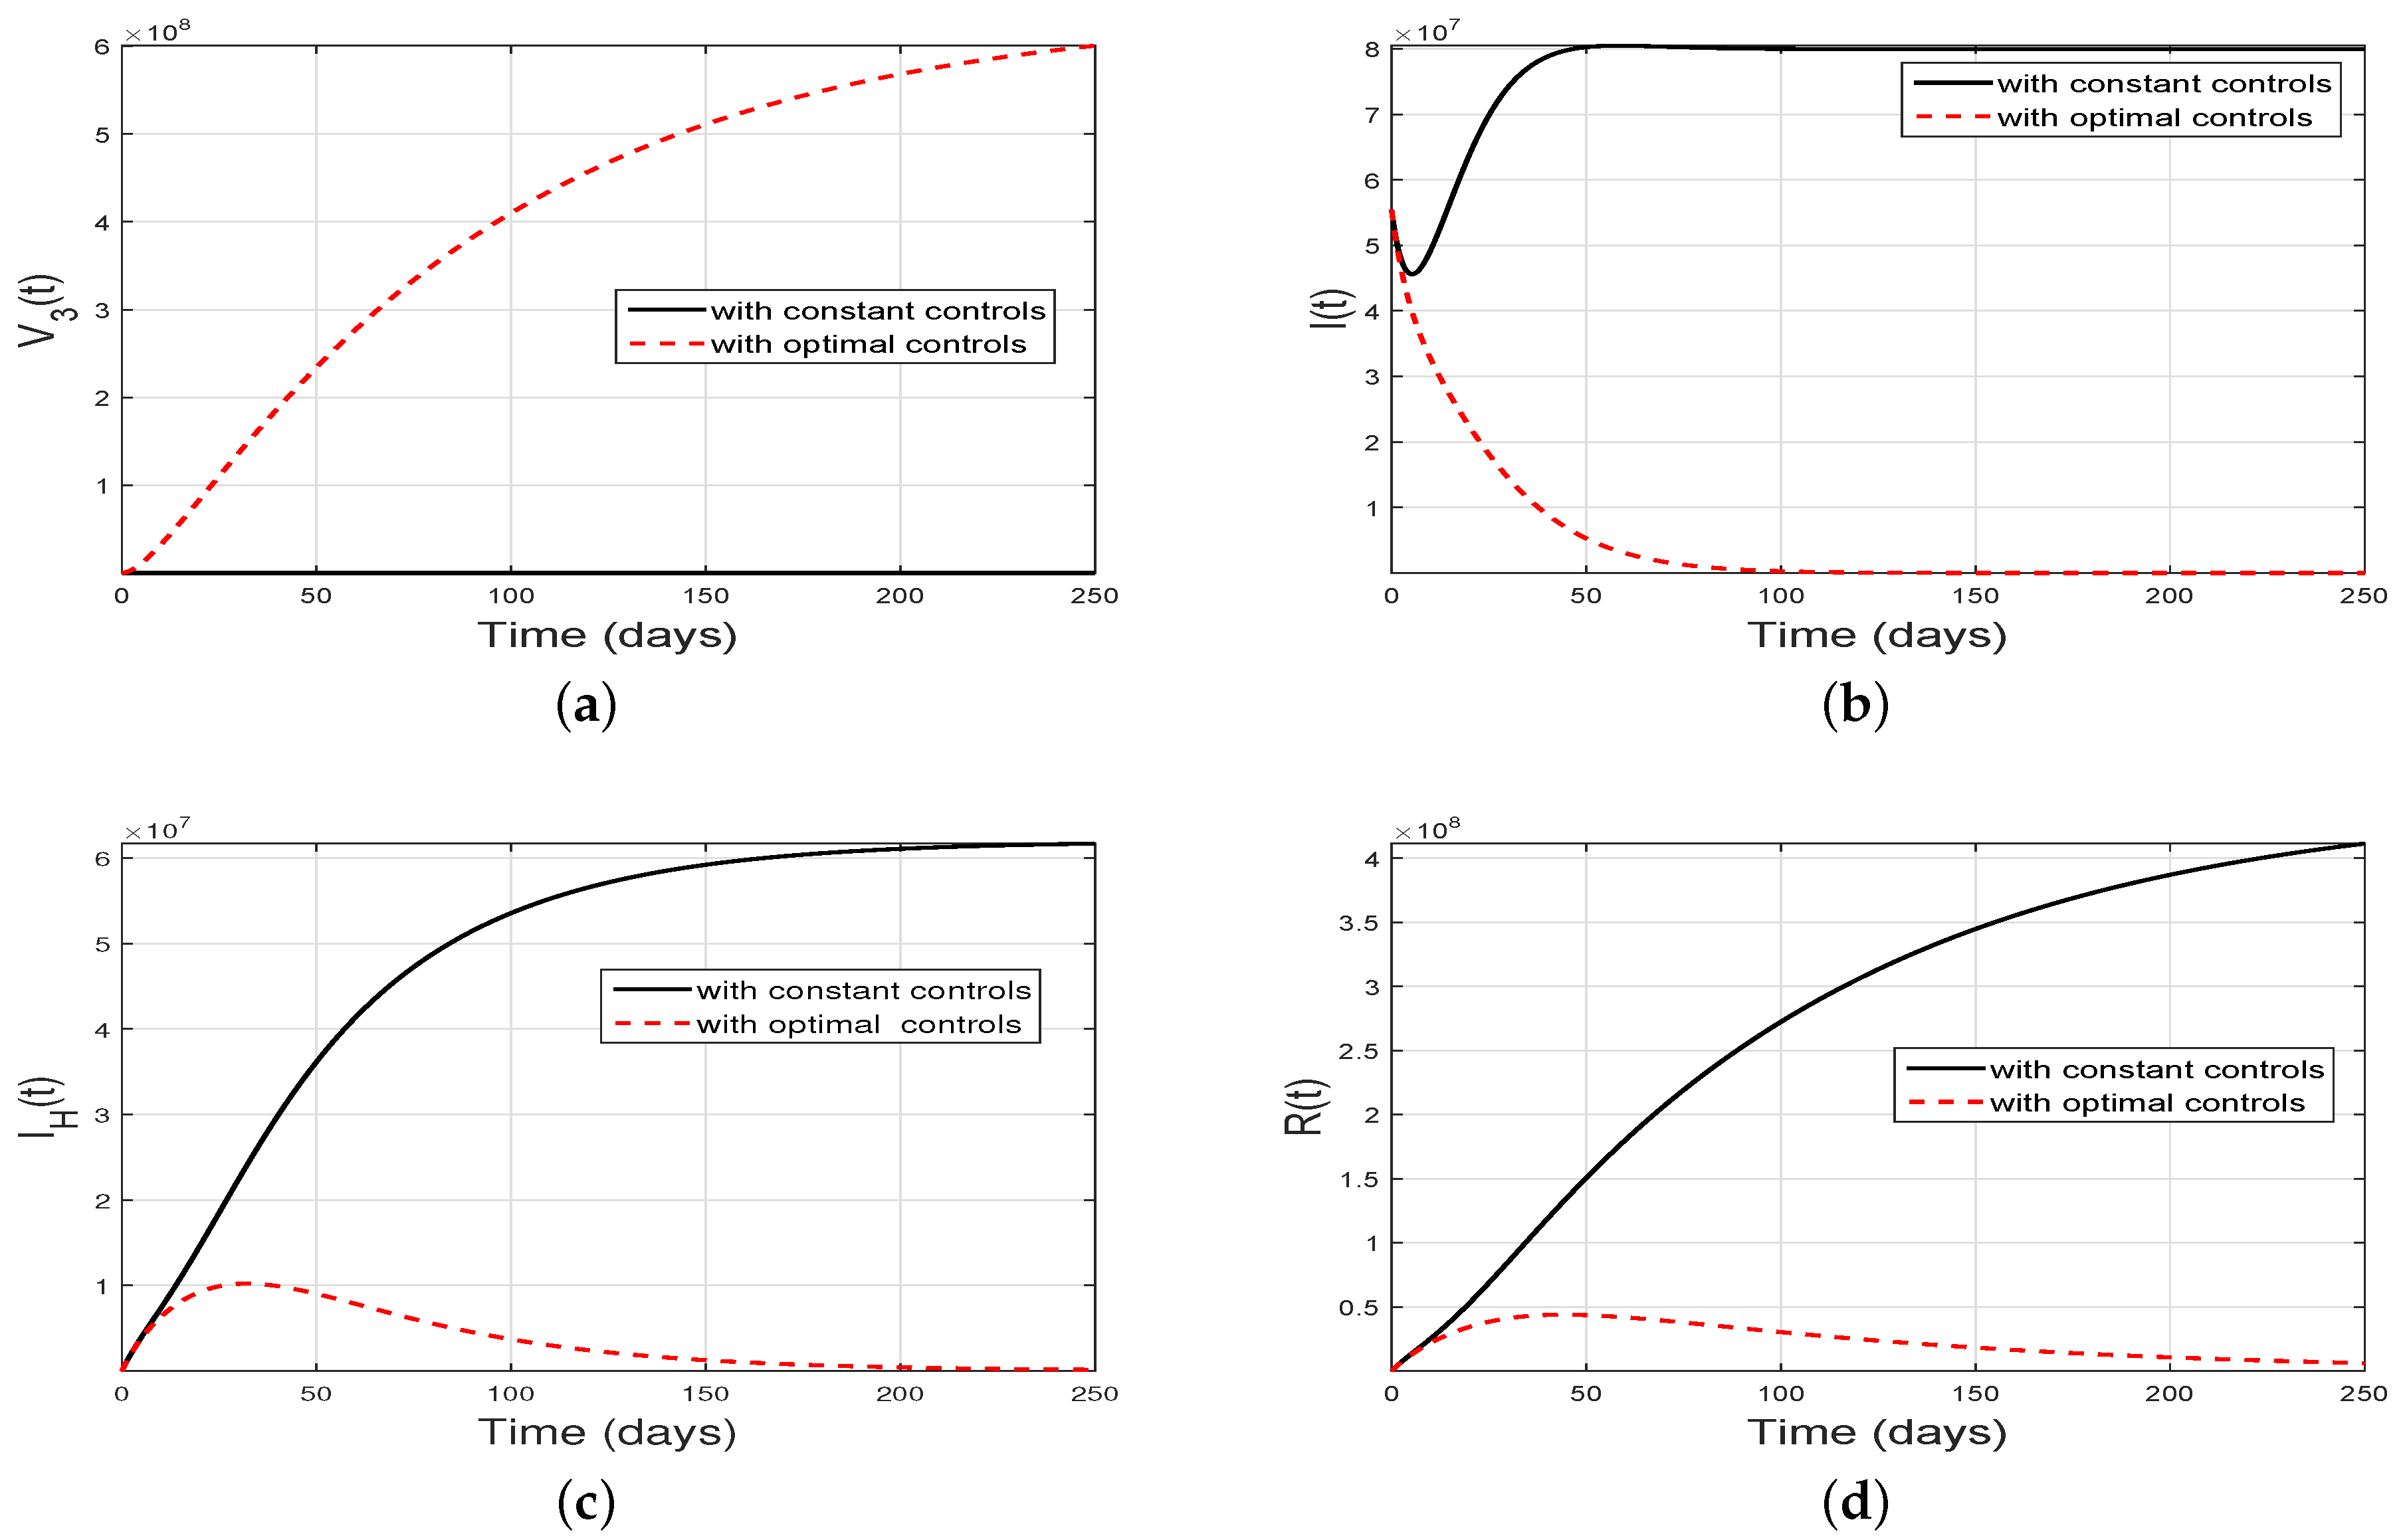
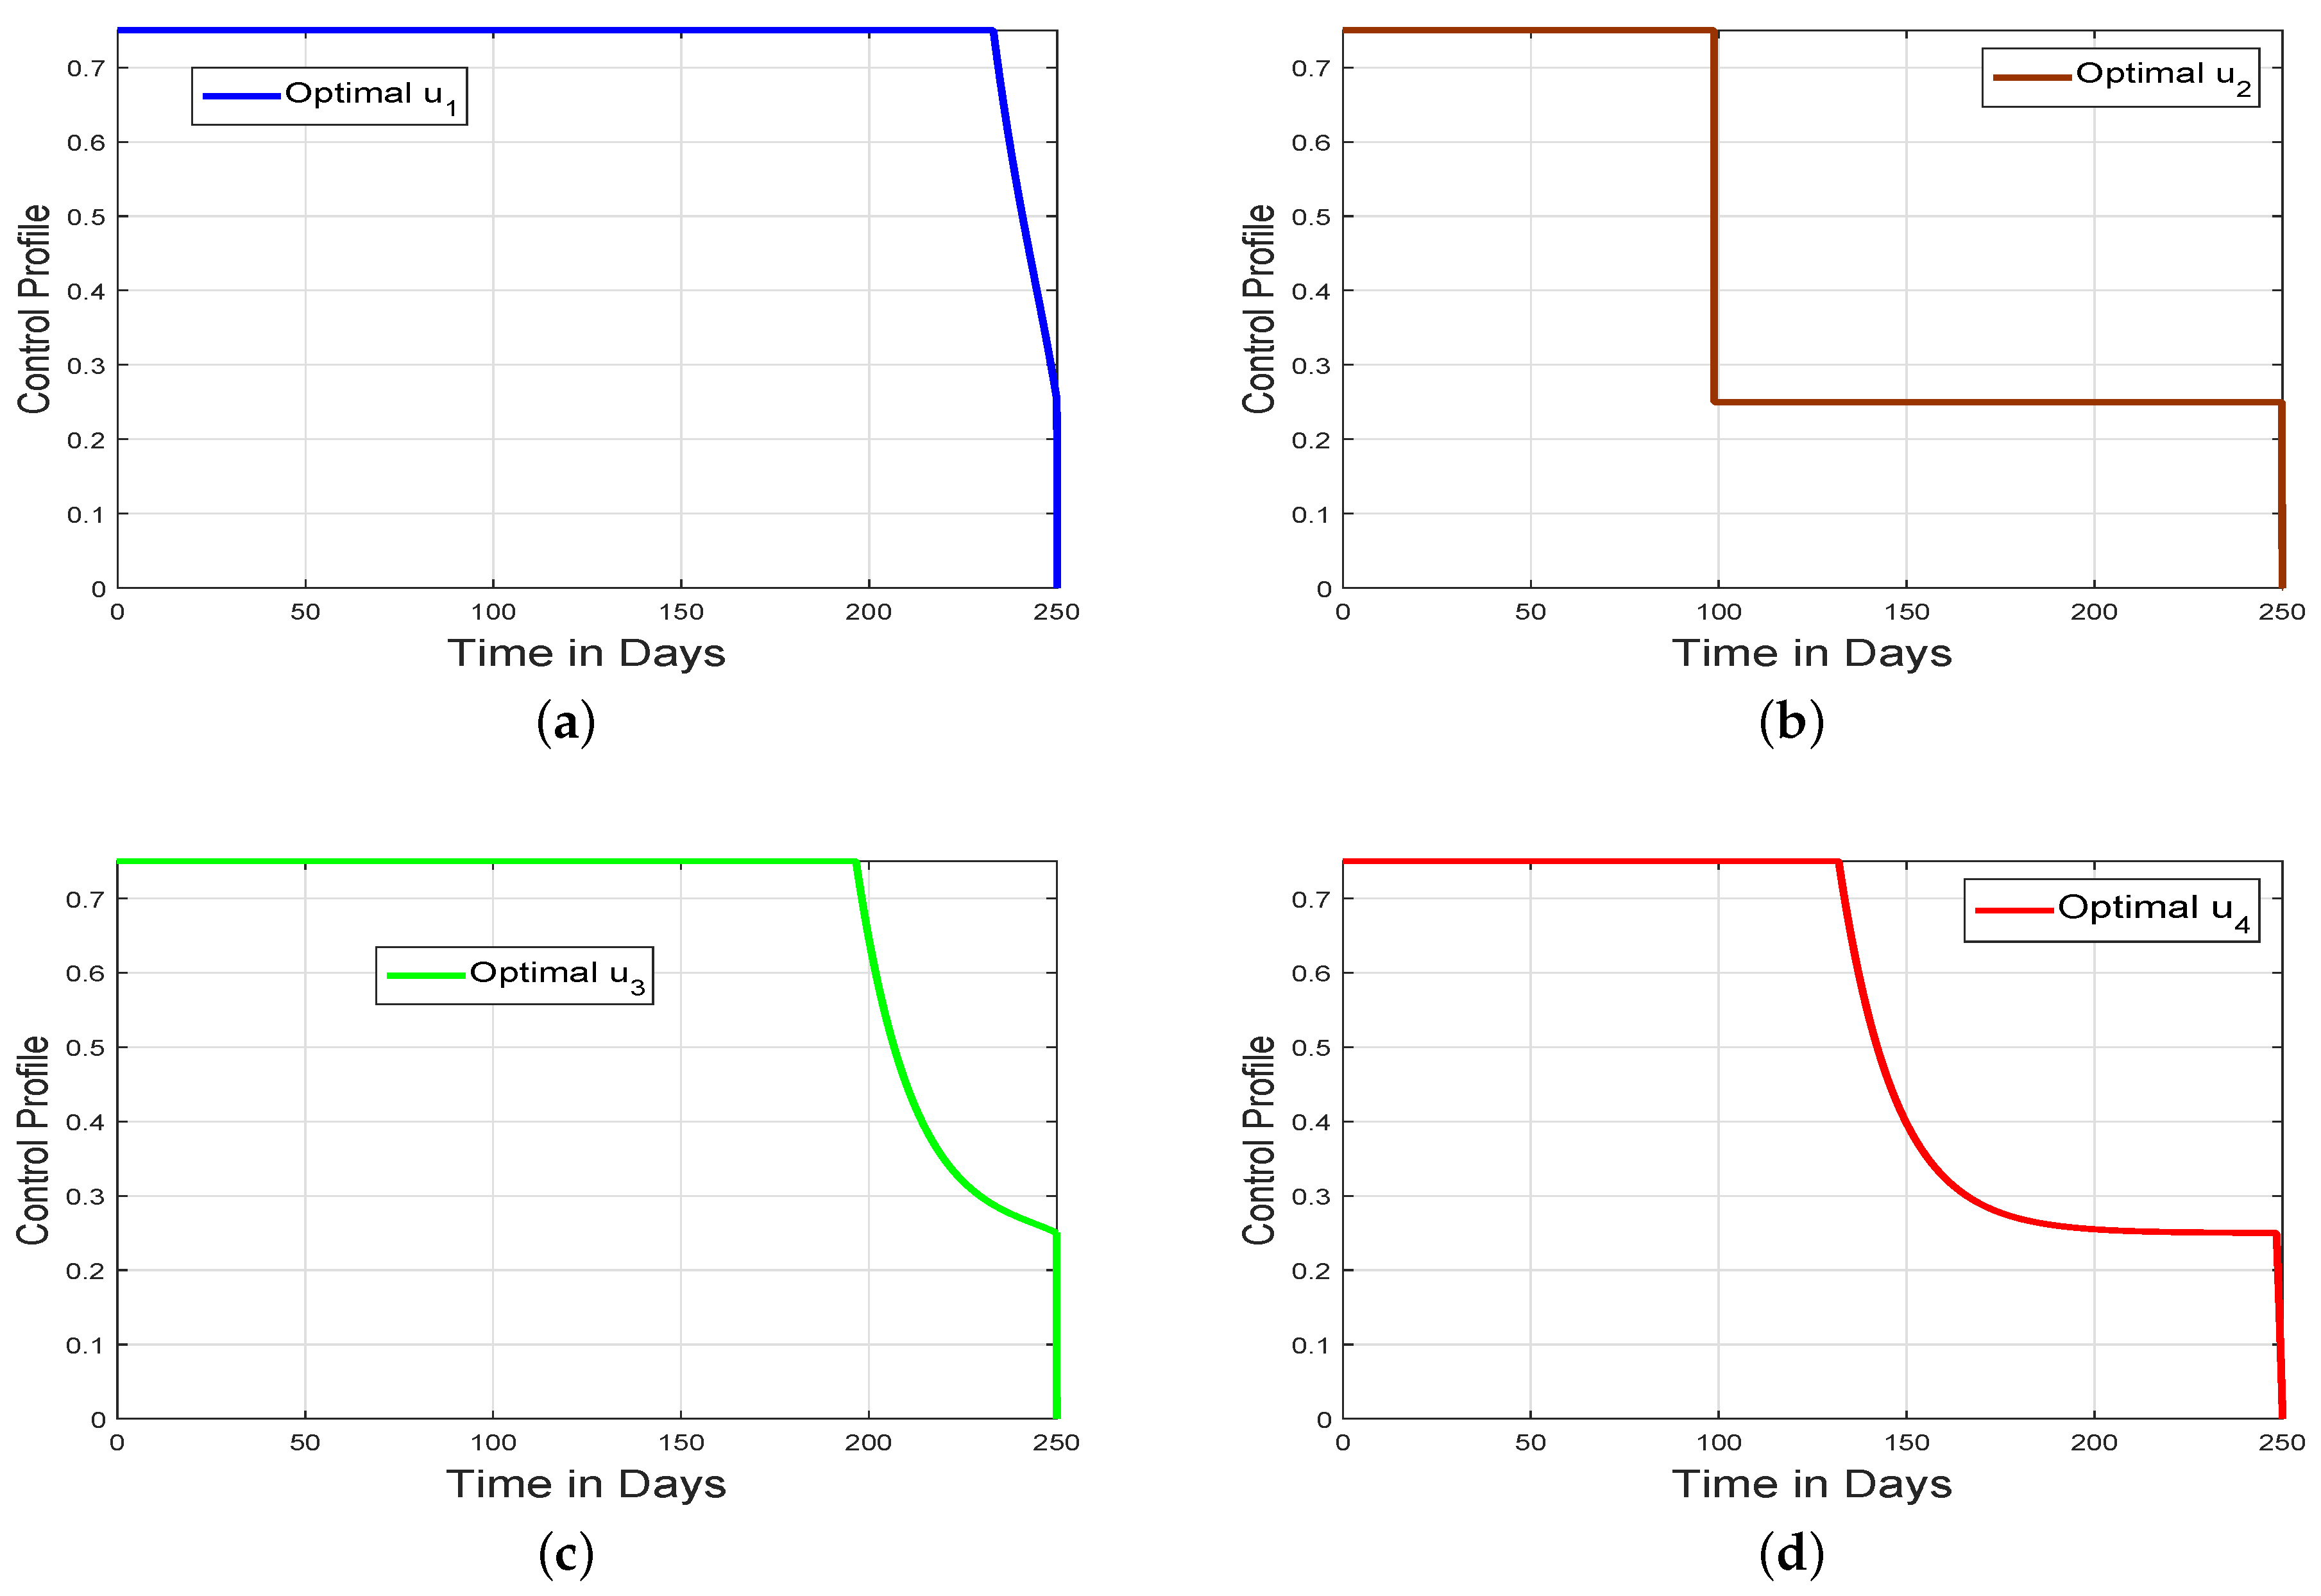
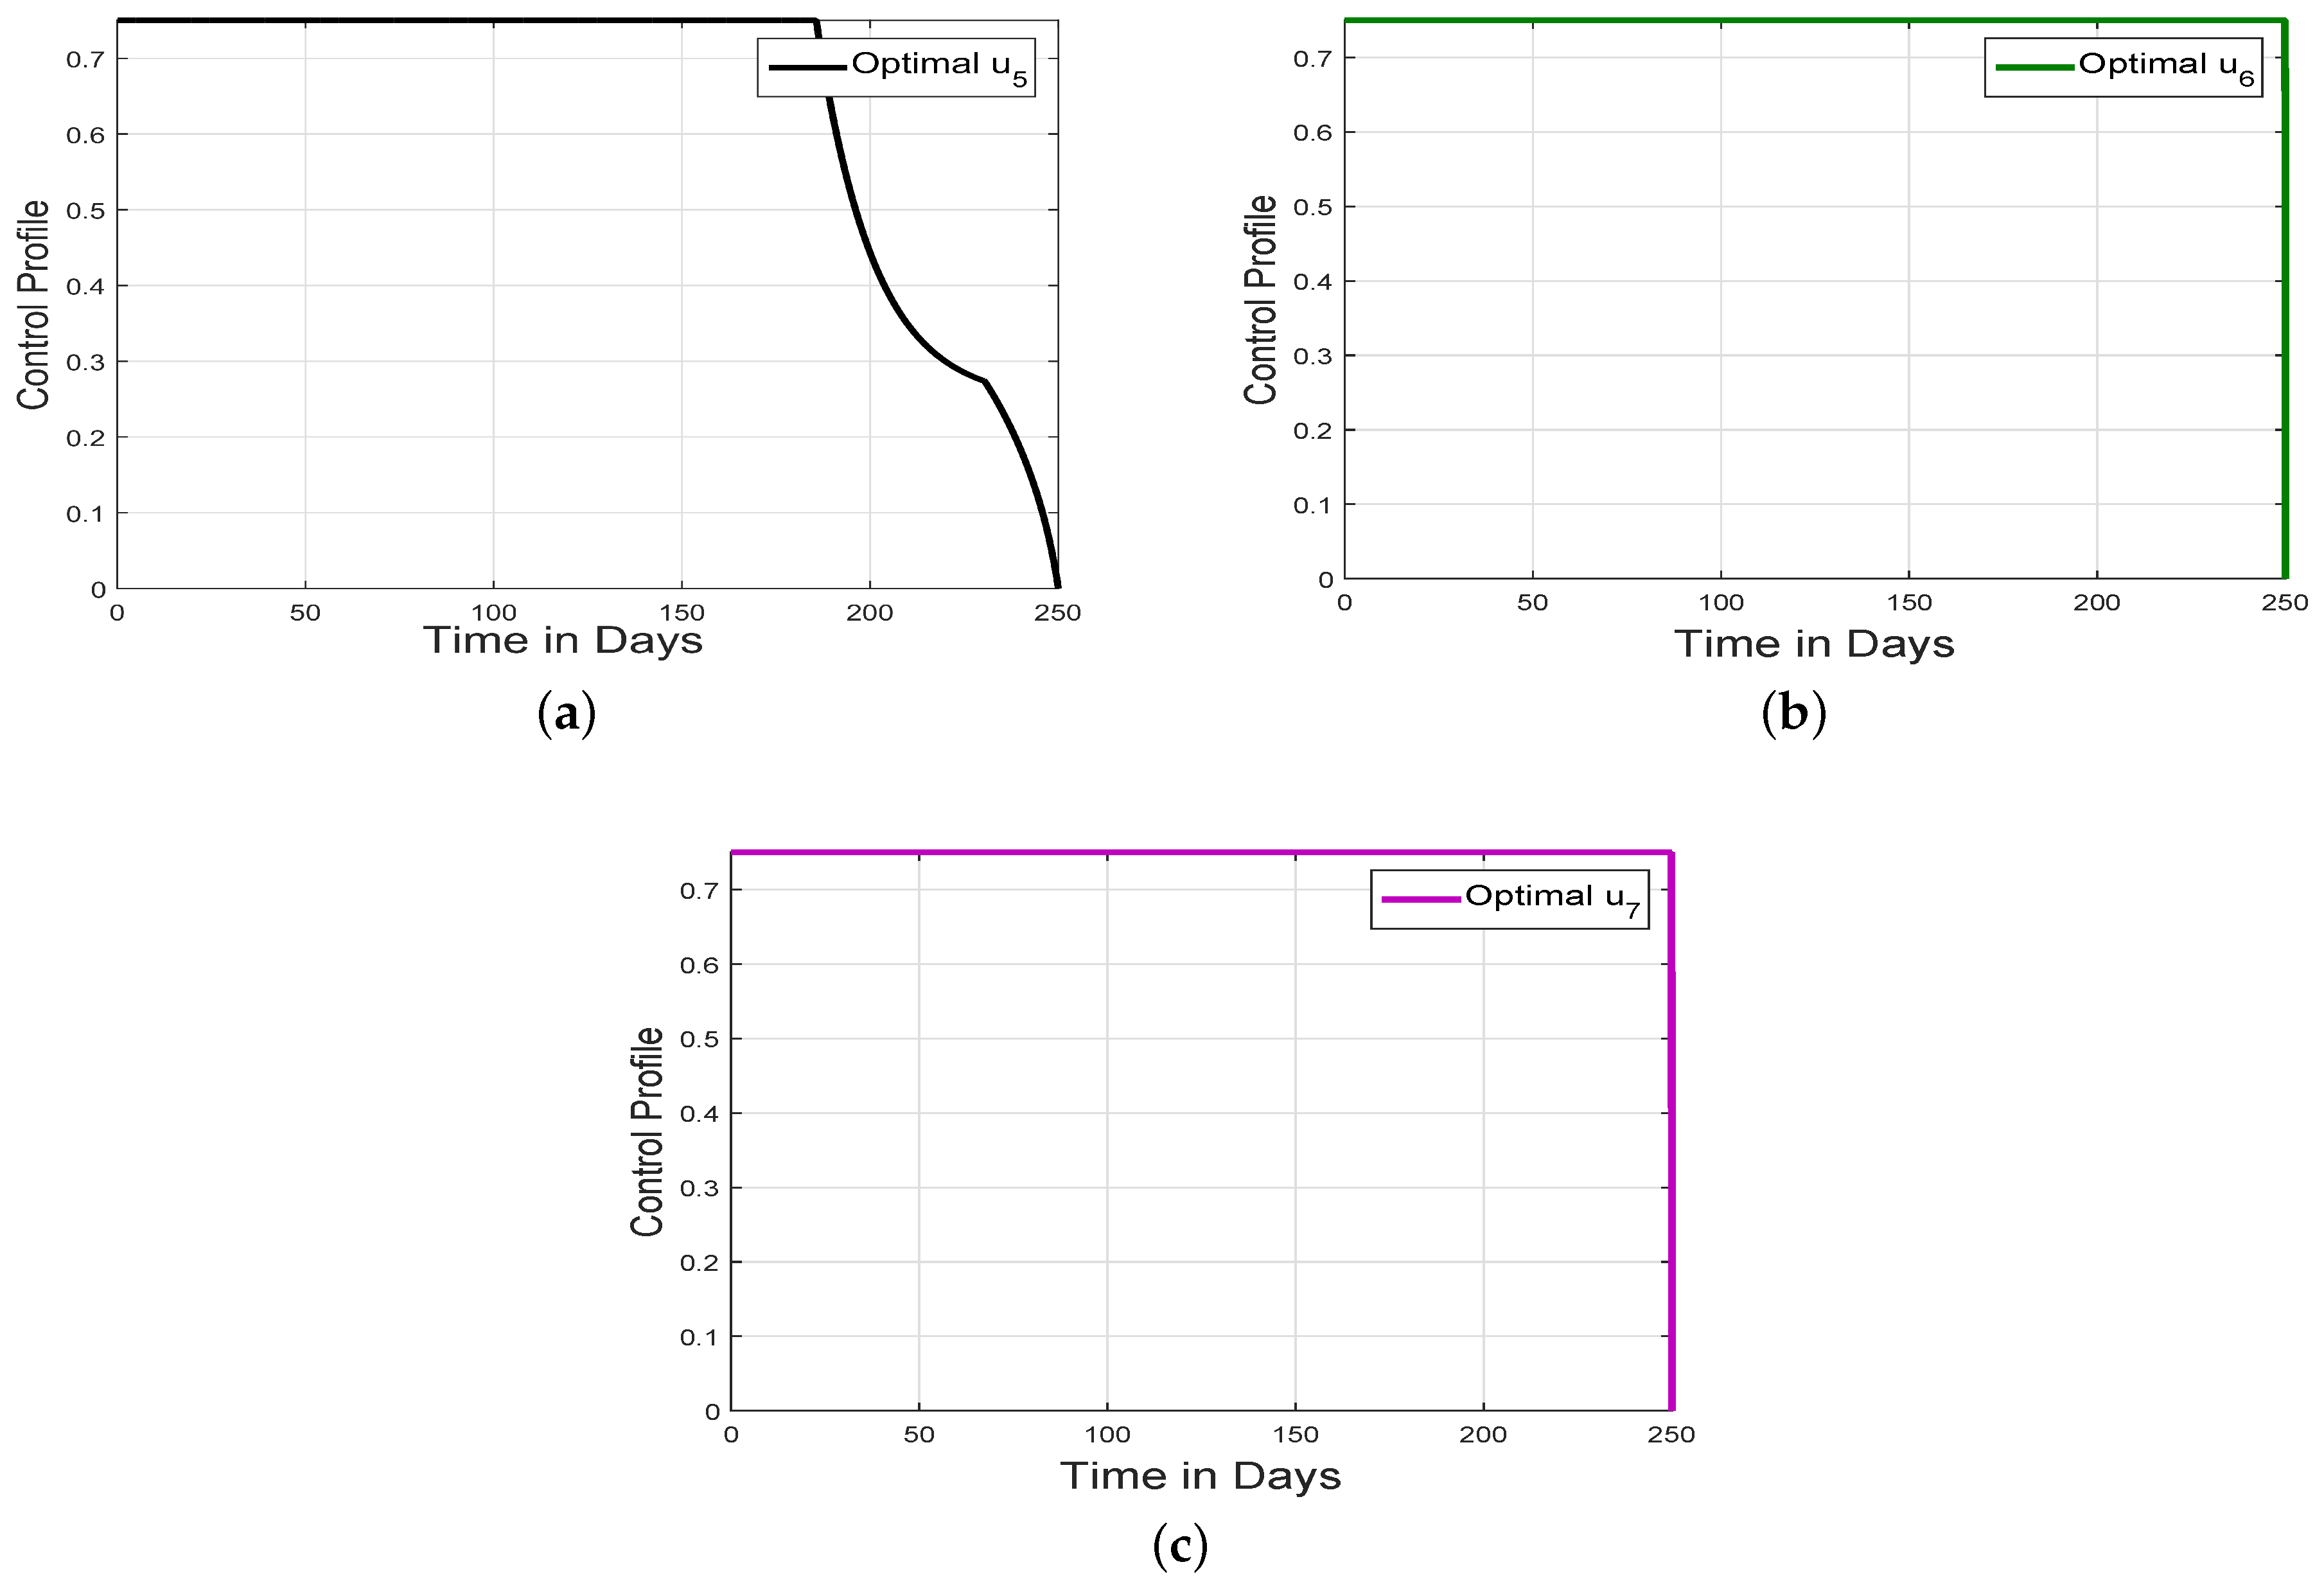
This section aims to analyze the significant impact of the proposed time-varying controls on disease incidence and potential mitigation. For this purpose, the COVID-19 control model is simulated with the aforementioned time-varying control variables to display their impact on the disease dynamics. An effective iterative approach known as RK4 is used to carry out the simulation process. The weights and balancing constants are chosen as and , while the simulation’s parameters are taken from Table 1. It is important to note that the numerical values of weighed and balanced constants are taken for the sake of simulation. The red dashed curves illustrate the dynamical behavior of various populations under varied control measures (implementing all the control measures at the time), while the black solid curves exhibit the changing behavior with constant controls. The dynamics of susceptible, primary vaccinated, exposed, and secondary vaccinated individuals with and without time-varying controls are analyzed in Figure 9, while a similar analysis of individuals with a booster shots, hospitalized, infected, and recovered individuals are presented in Figure 10. Figure 11 and Figure 12 demonstrate the corresponding control profiles. When the suggested optimal controls are actively utilized, the population in the susceptible class reduces while the population in all vaccinated classes increases significantly and reaches its maximum level with time. However, the population in the exposed and infected classes dramatically decreased and vanished after 60 and 90 days, respectively, with the implementation of time-varying controls. Because of averting infection, the populations in the hospitalized and recovered classes also reduced significantly, as shown in Figure 10c,d. The time-varying personal protection control is utilized at the maximum level from the initial time to approximately 220 days and decreases gradually until the end of the considered time level, as shown in Figure 11a. The time-varying control for first-time vaccine efficacy enhancement is initially at the maximum level until the first 100 days and then immediately reduces until the end, as can be seen in Figure 11b. Figure 11c,d and Figure 12a illustrate the intensity of controls , , and evaluating the reduction in the possibility that first, second, and third vaccine doses do not develop immunity to the original viruses, respectively. It can be observed that all of these controls are initially maintained at the maximum level and then gradually reduced until the end of the considered time interval. The implementation level of controls used for the enhancement of second- and third-time vaccinations and are shown in Figure 12b,c, respectively. These controls are implemented at the maximum level from the start to the end of the time level under consideration.
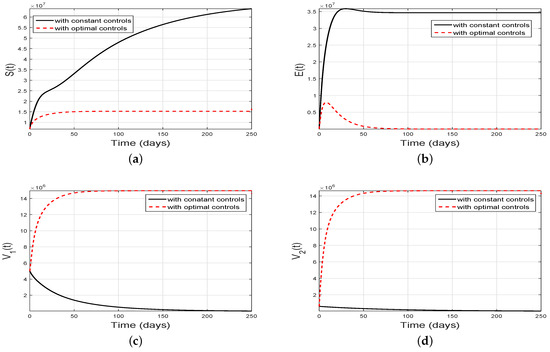
Figure 9.
Simulation of (a) susceptible, (b) exposed, (c) primary and (d) secondary vaccinated individuals in the model (8) with optimal and with constant controls. The constant values of first, second and booster COVID-19 vaccine controls are considered as 0.7, 0.6, and 0.29, respectively.
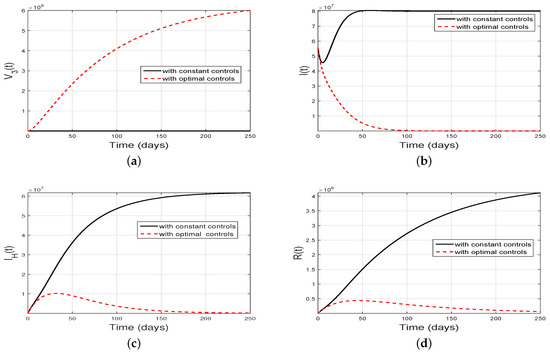
Figure 10.
Simulation of people with (a) booster short, (b) infected, (c) hospitalized and (d) recovered compartment in the model (8) with optimal and with constant controls. The constant values of first, second and booster COVID-19 vaccine controls are considered as 0.7, 0.6, and 0.29, respectively.
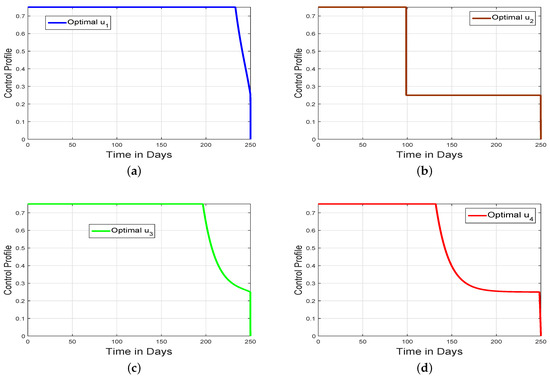
Figure 11.
The corresponding optimal control profiles with controls (a) , (b) , (c) and (d) .
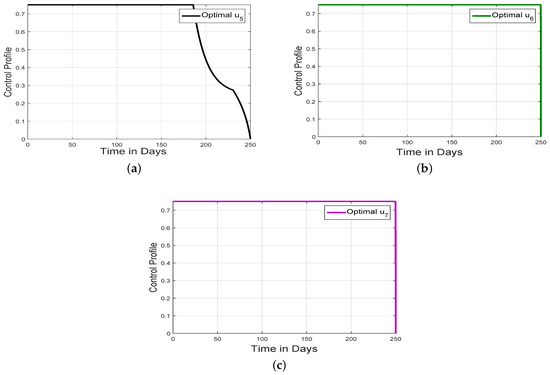
Figure 12.
The corresponding optimal control profiles with controls (a) , (b) and (c) .
9. Conclusions
Vaccination remains one of the most effective preventive interventions and is a critical component in mitigating disease outbreaks. In this study, we developed a novel mathematical model to assess the impact of administering multiple constant and time-varying vaccines, including the first and second doses and booster shots, on infection incidence and persistence. Initially, the necessary mathematical assessment of the model is presented and basic reproduction is calculated. To curb infection, we determined the critical vaccination convergence rate, which is dependent on the reproduction number. Moreover, using backward bifurcation analysis, we concluded that bifurcation depends on the sign of . To measure each parameter’s relative influence on disease spread, the sensitivity indices of the proposed model parameters for the basic reproduction number are tabulated using a normalized approach. Furthermore, we reconstructed the model using optimal control theory to identify the best control strategy for minimizing infection. We introduced seven time-varying controls, where is the personal protection control used for the reduction in effective contacts of infected individuals with susceptible, controls are used for the 1st, 2nd, and 3rd vaccine dose efficacy enhancement. The controls are used to reduce the possibility that after 28 days of vaccination, those who received the first, second, and third doses do not develop immunity to the original virus. Using the well-known Pontryagin’s maximum principle, the necessary optimal conditions are determined. The implementation of the suggested time-varying optimal controls has been found to play a crucial role in effectively minimizing the risk of disease transmission. Moreover, by effectively adjusting vaccination strategies, such as the timing and frequency of doses, the model shows that the spread of the disease can be significantly controlled. These time-varying controls allow for a more adaptive and responsive approach, enabling healthcare authorities to tailor vaccination campaigns on the basis of evolving epidemiological conditions, the emergence of new variants, and the overall vaccination coverage in the population. This flexibility empowers the public health system to optimize vaccination efforts and better control the spread of the infection, ultimately leading to a reduced incidence of the disease and improved public health outcomes.
Author Contributions
Y.L.: Conceptualization, formal analysis, writing—review and editing, S. and L.Z.: Software, methodology, visualization, validation, writing—review & editing, E.A.A.I. and F.A.A.: Conceptualization, supervision, project administration, formal analysis, writing—review and editing, funding acquisition, A.M.H.: Supervision, investigation, funding acquisition, resources. All authors have read and agreed to the published version of the manuscript.
Funding
This project is funded by King Saud University, Riyadh, Saudi Arabia.
Data Availability Statement
Not applicable.
Acknowledgments
Researchers Supporting Project number (RSPD2023R1060), King Saud University, Riyadh, Saudi Arabia.
Conflicts of Interest
The authors declare no conflict of interest.
References
- Andersen, K.G.; Rambaut, A.; Lipkin, W.I.; Holmes, E.C.; Garry, R.F. The proximal origin of SARS-CoV-2. Nat. Med. 2020, 26, 450–452. [Google Scholar] [CrossRef] [PubMed]
- World Health Organization. Novel Coronavirus (2019-nCoV): Situation Report; World Health Organization: Geneva, Switzerland, 2020; p. 11. [Google Scholar]
- Pfefferbaum, B.; North, C.S. Mental health and the COVID-19 pandemic. N. Engl. J. Med. 2020, 383, 510–512. [Google Scholar] [CrossRef] [PubMed]
- Tu, Y.F.; Chien, C.S.; Yarmishyn, A.A.; Lin, Y.Y.; Luo, Y.H.; Lin, Y.T.; Lai, W.Y.; Yang, D.M.; Chou, S.J.; Yang, Y.P.; et al. A review of SARS-CoV-2 and the ongoing clinical trials. Int. J. Mol. Sci. 2020, 21, 2657. [Google Scholar] [CrossRef]
- Guan, W.J.; Ni, Z.Y.; Hu, Y.; Liang, W.H.; Ou, C.Q.; He, J.X.; Liu, L.; Shan, H.; Lei, C.L.; Hui, D.S.; et al. Clinical characteristics of coronavirus disease 2019 in China. N. Engl. J. Med. 2020, 382, 1708–1720. [Google Scholar] [CrossRef]
- Lauer, S.A.; Grantz, K.H.; Bi, Q.; Jones, F.K.; Zheng, Q.; Meredith, H.R.; Azman, A.S.; Reich, N.G.; Lessler, J. The incubation period of coronavirus disease 2019 (COVID-19) from publicly reported confirmed cases: Estimation and application. Ann. Intern. Med. 2020, 172, 577–582. [Google Scholar] [CrossRef]
- World Health Organization. Non-Pharmaceutical Public Health Measures for Mitigating the Risk and Impact of Epidemic and Pandemic Influenza: Annex: Report of Systematic Literature Reviews (No. WHO/WHE/IHM/GIP/2019.1); World Health Organization: Geneva, Switzerland, 2019. [Google Scholar]
- Polack, F.P. Safety and Efficacy of the BNT162b2 mRNA COVID-19 Vaccine. N. Engl. J. Med. 2020, 383, 2603–2615. [Google Scholar] [CrossRef] [PubMed]
- Al-arydah, M. Mathematical modeling and optimal control for COVID-19 with population behavior. Math. Meth. Appl. Sci. 2023, 1–15. [Google Scholar] [CrossRef]
- Al-arydah, M.; Berhe, H.; Dib, K.; Madhu, K. Mathematical modeling of the spread of the coronavirus under strict social restrictions. Math. Meth. Appl. Sci. 2021, 1–11. [Google Scholar] [CrossRef]
- Aatif, A.; Ullah, S.; Khan, M.A. The impact of vaccination on the modeling of COVID-19 dynamics: A fractional order model. Nonlinear Dyn. 2022, 110, 3921–3940. [Google Scholar]
- Zarin, R. Numerical study of a nonlinear COVID-19 pandemic model by finite difference and meshless methods. Partial. Differ. Equations Appl. Math. 2022, 6, 100460. [Google Scholar] [CrossRef]
- Alshehri, A.; Ullah, S. A numerical study of COVID-19 epidemic model with vaccination and diffusion. Math. Biosci. Eng. 2023, 20, 4643–4672. [Google Scholar] [CrossRef]
- Ali, I.; Khan, S.U. Dynamics and simulations of stochastic COVID-19 epidemic model using Legendre spectral collocation method. AIMS Math. 2023, 8, 4220–4236. [Google Scholar] [CrossRef]
- Din, A.; Amine, S.; Allali, A. A stochastically perturbed co-infection epidemic model for COVID-19 and hepatitis B virus. Nonlinear Dyn. 2023, 111, 1921–1945. [Google Scholar] [CrossRef]
- Rahat, Z.; Khan, A.; Yusuf, A.; Sayed, A.-K.; Inc, M. Analysis of fractional COVID-19 epidemic model under Caputo operator. Math. Methods Appl. Sci. 2023, 46, 7944–7964. [Google Scholar]
- Ravichandran, C.; Logeswari, K.; Khan, A.; Abdeljawad, T.; Goamez-Aguilar, J.F. An epidemiological model for computer virus with Atangana-Baleanu fractional derivative. Results Phys. 2023, 51, 106601. [Google Scholar] [CrossRef]
- Lou, J.; Zheng, H.; Zhao, S.; Cao, L.; Wong, E.L.; Chen, Z.; Chan, R.W.; Chong, M.K.; Zee, B.C.; Chan, P.K.; et al. Quantifying the effect of government interventions and virus mutations on transmission advantage during COVID-19 pandemic. J. Infect. Public Health 2022, 15, 338–342. [Google Scholar] [CrossRef]
- Wang, Y.; Wang, P.; Zhang, S.; Pan, H. Uncertainty modeling of a modified SEIR epidemic model for COVID-19. Biology 2022, 11, 1157. [Google Scholar] [CrossRef]
- Liu, P.; Huang, X.; Zarin, R.; Cui, T.; Din, A. Modeling and numerical analysis of a fractional order model for dual variants of SARS-CoV-2. Alex. Eng. J. 2023, 65, 427–442. [Google Scholar] [CrossRef]
- Eikenberry, S.E.; Mancuso, M.; Iboi, E.; Phan, T.; Eikenberry, K.; Kuang, Y.; Kostelich, E.; Gumel, A.B. To mask or not to mask: Modeling the potential for face mask use by the general public to curtail the COVID-19 pandemic. Infect. Dis. Model. 2020, 5, 293–308. [Google Scholar] [CrossRef] [PubMed]
- Agusto, F.B.; Erovenko, I.V.; Fulk, A.; Abu-Saymeh, Q.; Romero-Alvarez, D.; Ponce, J.; Sindi, S.; Ortega, O.; Saint Onge, J.M.; Peterson, A.T. To isolate or not to isolate: The impact of changing behavior on COVID-19 transmission. BMC Public Health 2022, 22, 138. [Google Scholar]
- Watson, O.J.; Barnsley, G.; Toor, J.; Hogan, A.B.; Winskill, P.; Ghani, A.C. Global impact of the first year of COVID-19 vaccination: A mathematical modelling study. Lancet Infect. Dis. 2022, 22, 1293–1302. [Google Scholar] [CrossRef] [PubMed]
- Eyre, D.W.; Taylor, D.; Purver, M.; Chapman, D.; Fowler, T.; Pouwels, K.B.; Walker, A.S.; Peto, T.E. Effect of COVID-19 vaccination on transmission of alpha and delta variants. N. Engl. J. Med. 2022, 386, 744–756. [Google Scholar] [CrossRef] [PubMed]
- Ngonghala, C.N.; Taboe, H.B.; Safdar, S.; Gumel, A.B. Unraveling the dynamics of the Omicron and Delta variants of the 2019 coronavirus in the presence of vaccination, mask usage, and antiviral treatment. Appl. Math. Model. 2023, 114, 447–465. [Google Scholar] [CrossRef] [PubMed]
- Peter, O.J.; Panigoro, H.S.; Abidemi, A.; Ojo, M.M.; Oguntolu, F.A. Mathematical model of COVID-19 pandemic with double dose vaccination. Acta Biotheor. 2023, 71, 9. [Google Scholar] [CrossRef] [PubMed]
- Wang, Y.; Ullah, S.S.; Khan, I.U.; AlQahtani, S.A.; Hassan, A.M. Numerical assessment of multiple vaccinations to mitigate the transmission of COVID-19 via a new epidemiological modeling approach. Results Phys. 2023, 52, 106889. [Google Scholar] [CrossRef]
- Lakshmikantham, V.; Leela, S.; Martynyuk, A.A. Stability Analysis of Nonlinear Systems; M. Dekker: New York, NY, USA, 1989; pp. 249–275. [Google Scholar]
- LaSalle, J.P.; Lefschetz, S. The Stability of Dynamical Systems (SIAM, Philadelphia, 1976); Zhonghuai Wu Yueyang Vocational Technical College Yueyang: Hunan, China, 1976. [Google Scholar]
- Van den Driessche, P.; Watmough, J. Reproduction numbers and sub-threshold endemic equilibria for compartmental models of disease transmission. Math. Biosci. 2002, 180, 29–48. [Google Scholar] [CrossRef] [PubMed]
- Castillo-Chavez, C.; Song, B. Dynamical models of tuberculosis and their applications. Math. Biosci. Eng. 2004, 1, 361–404. [Google Scholar] [CrossRef] [PubMed]
- Akinwande, N.I.; Ashezua, T.T.; Gweryina, R.I.; Somma, S.A.; Oguntolu, F.A.; Usman, A.; Abdurrahman, O.N.; Kaduna, F.S.; Adajime, T.P.; Kuta, F.A.; et al. Mathematical model of COVID-19 transmission dynamics incorporating booster vaccine program and environmental contamination. Heliyon 2022, 8, e11513. [Google Scholar] [CrossRef]
- Kim, Y.R.; Choi, Y.J.; Min, Y. A model of COVID-19 pandemic with vaccines and mutant viruses. PLoS ONE 2022, 17, e0275851. [Google Scholar] [CrossRef]
- Chitnis, N.; Hyman, J.M.; Cushing, J.M. Determining important parameters in the spread of malaria through the sensitivity analysis of a mathematical model. Bull. Math. Biol. 2008, 70, 1272–1296. [Google Scholar] [CrossRef]
- Saif, U.; Khan, M.A. Modeling the impact of non-pharmaceutical interventions on the dynamics of novel coronavirus with optimal control analysis with a case study. Chaos Solitons Fractals 2020, 139, 110075. [Google Scholar]
- Agusto, F.B.; Khan, M.A. Optimal control strategies for dengue transmission in Pakistan. Math. Biosci. 2018, 305, 102–121. [Google Scholar] [CrossRef]
- Saif, U.; Khan, M.A.; Gmez-Aguilar, J.F. Mathematical formulation of hepatitis B virus with optimal control analysis. Optim. Control. Appl. Methods 2019, 40, 529–544. [Google Scholar]
- Pontryagin, L.S. Mathematical Theory of Optimal Processes; CRC Press: Boca Raton, FL, USA, 1987. [Google Scholar]
- Fleming, W.H.; Rishel, R.W. Deterministic and Stochastic Optimal Control; Springer Science and Business Media: Berlin/Heidelberg, Germany, 2012; Volume 1. [Google Scholar]


Disclaimer/Publisher’s Note: The statements, opinions and data contained in all publications are solely those of the individual author(s) and contributor(s) and not of MDPI and/or the editor(s). MDPI and/or the editor(s) disclaim responsibility for any injury to people or property resulting from any ideas, methods, instructions or products referred to in the content. |
© 2023 by the authors. Licensee MDPI, Basel, Switzerland. This article is an open access article distributed under the terms and conditions of the Creative Commons Attribution (CC BY) license (https://creativecommons.org/licenses/by/4.0/).