Abstract
Blockchains are becoming increasingly important in today’s Internet, enabling large-scale decentralized applications with strong security and transparency properties. In a blockchain system, participants maintain and update the server-side state of an application by appending data as blocks onto an immutable, distributed ledger through a consensus protocol within a peer-to-peer network. There has been a significant increase in profit in mining blocks. For instance, Bitcoin miners currently receive over USD 200,000 per mined block. An essential determinant of these rewards is the time it takes to disseminate newly mined blocks across the network. This paper addresses the challenge of optimizing mining rewards by exploring topology design in a wide-area blockchain network utilizing a Proof-of-Work consensus protocol. We show that under low block times, the geographical location of a miner critically impacts the number of successful blocks mined by the miner. We also show that a miner may improve its success rate by increasing its connectivity to the network. However, contrary to the general wisdom that a faster network is always better for a miner, we show that increasing network connectivity (e.g., by adding more neighbors) is beneficial to a miner only up to a point after which the miner’s rewards degrade. This is because when a miner improves its connectivity, it inadvertently also aids other miners in increasing their connectivity. We also present a network-level collusion attack in which a miner can increase its block success rate by becoming part of a tightly connected cluster. Here too, we observe that the mining gains obtained increase with cluster size only up to a point, and decrease thereafter. Our findings highlight that the network topology is a key variable affecting miner performance in PoW blockchains that must not be overlooked. We demonstrate our observations via detailed simulations modeled using real-world measurement data.
MSC:
68R01
1. Introduction
Blockchains have emerged as a secure, transparent and decentralized alternative to centralized systems for implementing important applications such as payments, digital marketplaces and smart contracts [1]. A blockchain operates over a peer-to-peer (p2p) overlay, where each node maintains a replica of an immutable ledger to which transactions (e.g., payments) are recorded as they are made over the network. To function correctly, ledger replicas at different nodes must be in agreement with each other which is achieved using a consensus protocol. Since the introduction of the Nakamoto consensus in Bitcoin in 2008 [2], several alternative consensus algorithms with distinct performance characteristics have emerged in recent years [3,4]. Nevertheless, a number of mainstream blockchains—notably cryptocurrencies—rely on the Nakamoto consensus, also called Proof-of-Work (PoW), for their operation [2,5,6,7].
In PoW cryptocurrencies, new payment transactions are consolidated into blocks and appended to the blockchain in a process called mining. New blocks are generated by nodes (miners) in the p2p overlay which compete to solve a computationally difficult cryptographic hash puzzle for each new block. The computational challenge involved in creating new blocks dissuades attackers from generating incorrect blocks and secures the blockchain. Blocks are mined in sequence with each mined block holding a reference to a unique parent block that was mined before the block. When a miner mines a new block, it broadcasts the block over the p2p network so that other miners can start mining the next block using the received block as a parent.
Miners are rewarded in proportion to the amount of computational effort they put in for mining new blocks [8]. The amount of rewards earned by a miner depends on the number of blocks mined by the miner which have been included in the blockchain. Mining is an expensive undertaking—miners often invest in specialized computational hardware and pay hefty electricity fees to keep their infrastructure running [9]. Thus, miners are incentivized to mine as many valid blocks as possible to maximize their individual payoffs and offset investment cost. Increasing the computational effort (i.e., the hashrate of a miner [10]) is a natural approach to increasing the number of blocks mined, and hence the rewards earned. For a fixed hashrate, a miner’s reward crucially depends on how well connected the miner is to other miners in the p2p network; connectivity affects a miner’s ability to send and receive blocks faster than the other miners over the network [11,12,13]. Recent works have explored various ways, including topology redesigns [14,15,16,17], fast relay networks [18,19,20] and coding or compressing blocks [21,22], to reduce the latency of block propagation in the network. The conventional wisdom here is that it is more desirable for the miners to have a faster network than a slower network, as faster connection allows miners to mine the latest block earlier than the other node, which increases the probability of mining the block and having it accepted by the whole network. A faster network also facilitates a higher rate of mining blocks, which has positive implications for increasing the rate at which payment transactions are confirmed in the blockchain (i.e., the transaction throughput) and reducing transaction confirmation delays [4].
In this paper, we study the impact of the network topology on the mining reward of each miner in PoW blockchains operating over wide-area p2p networks. Miners in these networks are often geographically far away from each other, resulting in 100 s to 1000 s of milliseconds, or more, of propagation delays while broadcasting blocks [12,23]. This delay is significant compared to the time between generating successive blocks (called block time), especially on systems such as Ethereum and Ethereum Classic which have a block time of just a few seconds on average.
Therefore, in these systems the topology of the p2p overlay has a significant effect on the dynamics of block propagation and consequently the rewards earned by competing miners. Even small improvements in network propagation latency can translate to large gains in mining rewards over time for a miner. For example, the top 25 mining pools in Ethereum have on average between 5 and 14% of uncle blocks (a type of a forked block) due to excessive block propagation delays in the network [24,25,26,27,28] (prior to Ethereum’s transition to Proof-of-Stake). As uncle rates are a key indicator of a mining pool’s operational capability, pools invest heavily in their network infrastructure, often subscribing to block distribution networks such as bloXroute [19,29] to hear about and propagate blocks as quickly as possible. The importance of the p2p network in distributing blocks quickly is highlighted by the example where a prominent mining pool (F2Pool) was able to cut down its fork rates by half after improving its network [27].
We consider topology design as a game played between miners, where the number and choice of peers (miners) a miner connects with is the action for each miner and the block mining fees are the reward. Outside of choosing neighbors carefully, we assume that all miners honestly follow protocol for block mining and dissemination. We show a counter-intuitive result, that increasing a miner’s connectivity to the rest of the network does not always benefit the miner. There exists an ‘optimal’ level of connectivity where payoffs are maximized for a miner.
For instance, it is strictly suboptimal for a miner to establish connections to all other miners compared to connecting with a small number of carefully chosen peers, if the average degree of the network is constant (e.g., 50 in Ethereum [30]). The reason we observe reward gains that are non-monotonic with connectivity is that for a miner to maximize its reward, it is not only essential for the miner to be well connected to the rest of the network (to receive and send blocks quickly), but also for the rest of the miners to not be well connected so that they receive blocks more slowly than the miner on average. A miner that increases its connectivity to the rest of the network by increasing its number of neighbors is not only creating new low-latency paths between itself and others, but also indirectly creating new low-latency paths between other miners through itself. On the other hand, a miner that has too few neighbors risks having paths that are of higher latency to other miners. The right balance occurs by choosing an appropriate number and choice of neighbors to connect with. While prior works have studied how a miner’s reward increases with increasing its connectivity to the rest of the network [13,31,32,33,34,35], the counter-intuitive phenomenon of rewards decreasing with increasing connectivity has not been studied to our best knowledge.
Experimentally, we develop an event-driven simulator on Omnet++ [36] to simulate mining and block propagation over a worldwide network of 270 miners to validate our observation. We observe that miners incur unfair rewards on a random topology due to the non-uniform geographical distribution of miners around the world. For example, if 70% of all miners in the world are located in either Europe or North America (services monitoring cryptocurrency networks report this to be the case [37]), then miners in Europe and North America will end up receiving higher than their fair share of rewards while miners in other locations suffer. However, the payoffs to miners in central locations (Europe or North America, in our experiments) degrades if they increase their number of connections beyond a threshold. Miners in remote locations strictly benefit by increasing the number of connections they make.
2. Related Work
The effect of network delay on mining rewards in blockchains has been studied in prior works [31]. For example, Xiao et al. [32] show that a slower network leads to high forking rates, and well-connected miners benefit more under heterogeneous network connectivity. Cao et al. [33] show that with a limited degree bound, high hash power mining pools are incentivized to connect with other hash power mining pools to reduce block propagation delay and increase their mining rewards. Gencer et al. [13] highlight that the top miners are generally more successful in including blocks in the main chain on Bitcoin and Ethereum networks. In Putri et al. [34], the authors look at the effect of network latency on miners executing a selfish mining attack [35]. These works do not consider the effect that the increasing connectivity of a miner has on the connectivity of other miners. A variety of studies utilize neural network methodologies for conducting graph learning tasks within networks [38]. These tasks include symptom recognition [39] and the implementation of graph instance transformers [40].
Enabling faster broadcasting of blocks in the network, even if it does not necessarily result in strict reward improvements, allows blocks to be mined more quickly, thereby increasing the transaction confirmation throughput of the system. Thus, a number of prior works have proposed techniques to accelerate block dissemination. Relay networks such as Falcon [18], Fibre [20] and bloXroute [19] use a network of dedicated servers to transport blocks quickly between distant geographical regions instead of relying on p2p gossip. Kadcast [15] proposes a structured p2p overlay with UDP and forward error correction to achieve a more efficient broadcast compared to Bitcoin’s random topology with TCP links. Perigee [14] and Goldfish [41] present an algorithm to explore and exploit neighbors to search for the best set of neighbors to connect to for optimizing broadcasting delay. Cobalt [42] optimizes the mining rewards from the aspect of a game. DecVi [43] constructs a tree-shaped network topology to facilitate quicker broadcasting. Other innovations, e.g., Bitcoin’s compact block relay [44], also help to reduce broadcast time by reducing the size of each block. Nagayama et al. [45] study how progress in Internet speeds has led to reductions in broadcast time in Bitcoin.
Another line of work considers how miners can make use of the mining protocol and selfishly garner benefit [46,47,48]. Eyal et al. [35] present a selfish mining attack, where the latest block miner can keep the mined block and conduct mining secretly. Their mining records will only be published if they find that others mined the block successfully and beat the block mined later by their hash power and network connections. Empirical analysis of the Bitcoin blockchain shows a large frequency of short time intervals between consecutive blocks, implying that selfish mining may be happening in practice [49]. Lewenberg et al. [50] use game theory tools to analyze how mining pool members may share rewards between themselves. They show that under certain cases participants are incentivized to keep switching between pools.
3. System Model
3.1. Network Model
We model the blockchain network as an undirected graph comprising a set of miners V and communication links (e.g., TCP links as in Bitcoin) E between them [33]. Each miner has an associated hash power . The time it takes for a miner to mine a block on top of a previous block is an exponential random variable with rate (mean ). This time that it takes for a miner to mine a block is independent of the time taken to mine prior blocks. We consider different cases of the hash power distribution, the uniform hash power distribution, random hash power distribution and region-related hash power distribution. Our results can be extended to various hash power assignments in a straightforward way.
When a miner mines a block, it broadcasts the block to all of its neighbors in G. Each link has a latency , which is the time it takes for the block to propagate from u to v (we assume for any edge ) through link . When a miner v receives a block (that has not been previously received) from neighbor u, it spends a time in validating the block, following which it forwards the block to all of its neighbors other than u. If a miner receives a block that it has previously seen, it does not forward the block to its neighbors.
Each miner maintains a local replica of the blockchain based on the blocks it has received so far. Before the mining process starts, we assume that there is a unique genesis block that is known to all miners. For any block b, we call the number of blocks on a path from the genesis block to block b on the blockchain as the height of block b. The genesis block has a height of 0. Following the longest chain protocol, a miner mines a new block on top of the block with the greatest height in its local blockchain. If there are multiple longest chains, then mining is done on top of the earliest-received block from among the blocks having the greatest height. Before a miner can mine a block, if it receives a new block that extends its longest chain height, the miner restarts its mining to mine on top of the newly received block. If a miner successfully mines a new block, it immediately starts mining the next block on top of the new block. We assume that all miners follow protocol, and leave a discussion on various possible adversarial actions that miners can take to future work. We do not model transaction generation and broadcast.
3.2. Reward Model
When a block mined by a miner is included in the longest chain, the miner incurs a reward for mining the block. While a number of factors affect the rewards earned by a miner per block—such as the plaintext size of the transactions in the block, number of unconfirmed transactions currently in the network, height of block, etc.—for simplicity, we assume the reward per block included in the longest chain to be a constant. Using this model as a motivation, we consider a reward model in which the aggregate reward earned by a miner is proportional to the fraction of the blocks mined by the miner in the longest chain. For a miner , we denote by the average fraction of blocks mined by v that are included in the longest chain over a long time horizon, i.e., assuming the following limit exists
where denotes the set of all blocks mined up to time and is the indicator function.
We call a network fair if for all . We call a network unfair if there exists a for which . In a fair network with n miners, for all if they have the same hash power. A network is unfair if there exist miners that have a greater than fraction of blocks mined by them in the longest chain, and others that have less than fraction of blocks in the longest chain. We present how miners can gain an advantage by carefully choosing whom to connect with in the network, and what the affected miners can do to alleviate their disadvantage. (Since , if there exist miners that receive greater than their fair share of rewards, there must exist miners that receive less than their fair share). Outside of choosing neighbors carefully, the miners do not deviate from protocol in any way. Choosing neighbors carefully in a blockchain network (but otherwise following protocol) is not considered adversarial behavior. Hence, the policies we present in this paper are “legal” methods by which miners can obtain an unfair advantage over others.
We also model the costs incurred by miners for electricity, cooling, etc. while mining blocks. If the average cost incurred per mined block (whether or not it is included in the longest chain) is not negligibly small compared to the rewards obtained per block, then a miner is not only interested in maximizing the fraction of blocks it mined that become part of the longest chain, but also in minimizing the fraction of wasted blocks it mined that did not become part of the longest chain. Note that maximizing the fraction of blocks mined by a miner included in the longest chain is distinct from minimizing the fraction of blocks mined by a miner that have been excluded from the longest chain. For a miner , we let be the fraction of blocks mined by v that are excluded from the longest chain over a long time horizon, i.e., assuming the following limit exists:
Depending on the precise values for reward earned by a miner per block in the longest chain, and the cost incurred per mined block, a miner v may be interested in maximizing a weighted difference of its and values. We treat and as separate performance metrics in the topologies that we consider.
3.3. Action Model
Blockchain networks use a decentralized algorithm for constructing the p2p network. We view topology construction as a game between the n miners, and study simple classes of topologies that the miners can construct to maximize their rewards and/or minimize wasted cost. We assume that each miner is located at a fixed geographical location within a wide area (e.g., the world or a large continent). The location of the miners induces an underlying latency between every pair of miners u and v. If u and v have a link between them, we assume that the link has a latency of one time unit. For example, the latency of links is one time unit each, while the latency between nodes a and c along the path is two time units. We assume that a miner u has knowledge about for all , but does not know the latencies between other miner pairs. We provide two control knobs that miners can use to change topology:
- A miner v specifies a degree which allows v to make outgoing connections;
- A miner v specifies the set of miners to which to connect.
We assume that each miner knows the IP addresses of miners in the network and that they always accept connect invitations. As long as two nodes are connected, they do not differentiate whether the neighbors are those who send the invitation or those who accept the invitation during block forwarding.
We consider two settings, non-cooperative and cooperative, by which miners can change topology to their advantage. In the non-cooperative model, miners do not collude. Each miner chooses its neighbors on its own without any assistance from other nodes. In the cooperative model, miners are allowed to collude and choose neighbors preferentially from the miners they are colluding with.
4. Motivation
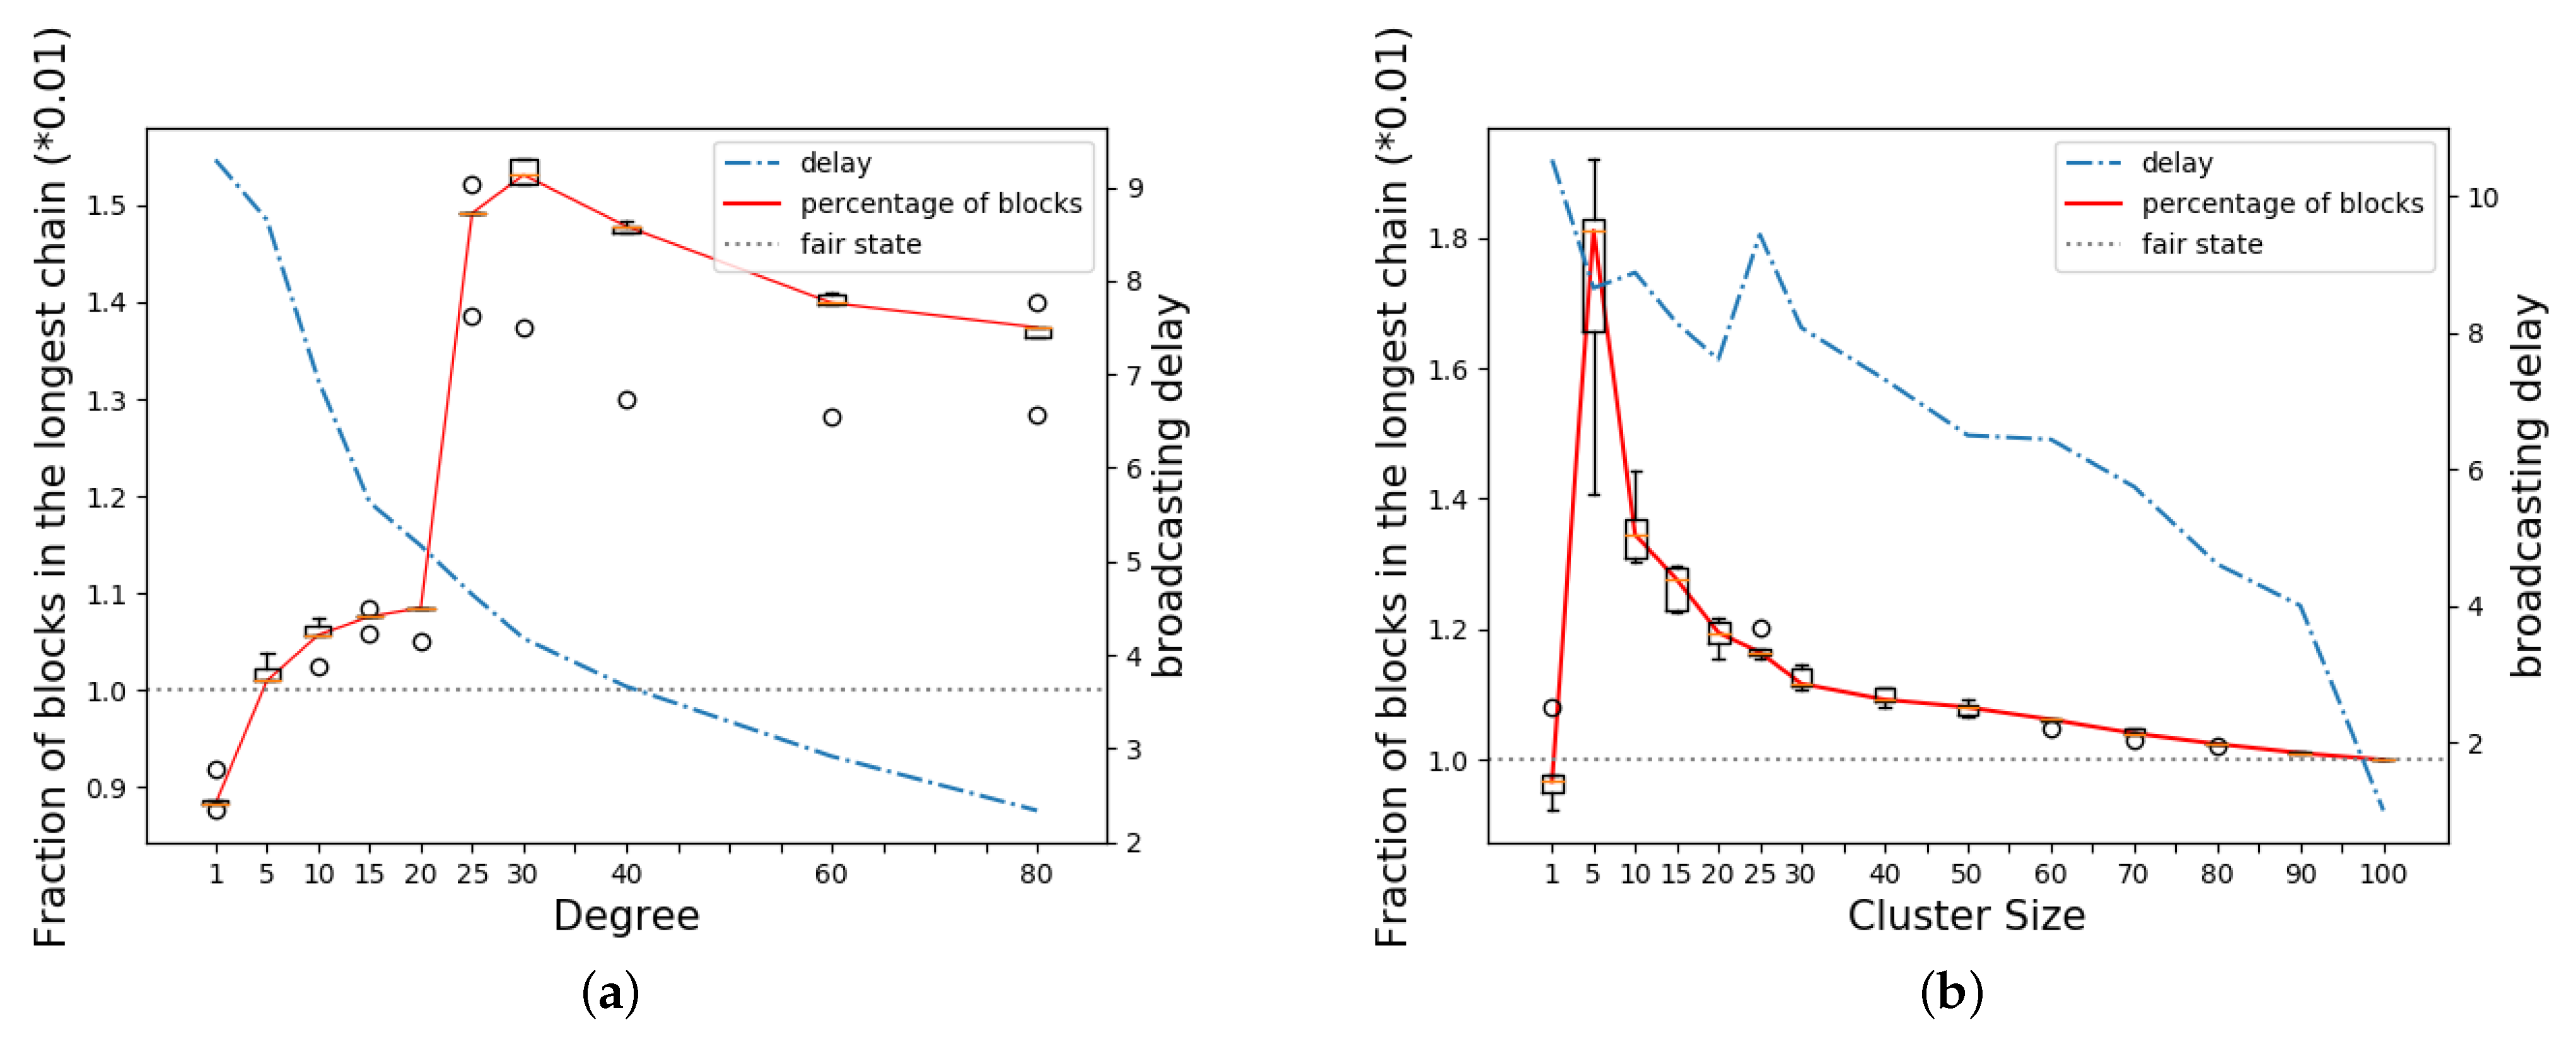
We motivate our results using a simple toy example that illustrates the effect of network topology on mining rewards. We consider a network with 99 nodes connected as a random graph of average degree 4, with each node initiating connections to two random neighbors. Let v be a 100-th node that is looking to maximize its rewards by choosing its neighbors carefully among the 99 nodes in . If a link is present between two nodes , we assume the link has a latency of one time unit. For example, the latency of links is one time unit each, while the latency between nodes a and c along the path is two time units. The block validation delay is set to 0.01 time units. The mining rate of each node u is 1/4000. At this mining rate, blocks are mined once every 40 time units on average which is roughly 10 times the broadcast delay in . In the case of Bitcoin, the time between blocks is set at 10 min, with propagation taking more than 10 seconds. While advancements have improved propagation speed, other networks with shorter block intervals, such as Dogecoin and Litecoin [51,52], also experience challenges. Network propagation delays continue to be a significant factor contributing to block forks which, in turn, impact the distribution of mining rewards [12]. Figure 1a plots the topology for where node v connects to d random neighbors with connections in red. Figure 2a shows the rewards earned by the v, as v’s degree varies from 1 to 80. Each network topology is run until 10,000 blocks are mined in the blockchain. The experiment is repeated five times per topology and averaged over five different random instances of the topology. We see that initially node v’s reward increases as the degree increases. However, once the degree reaches 30, further increase in the degree leads to a decrease in reward performance.
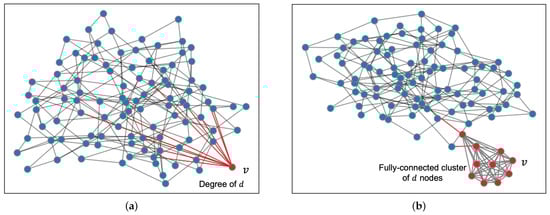
Figure 1.
Example of network topology setting experiments of Section 4. (a) Non-cooperative network; (b) Cooperative network.
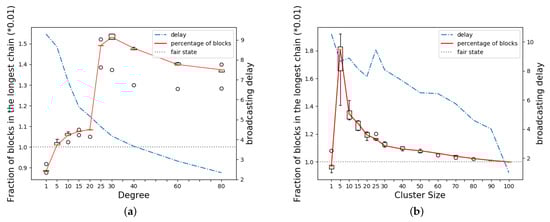
Figure 2.
Fraction of blocks in the longest chain by v in 2 cases. Circle marks represent outliers. (a) Non-cooperative model with increasing number of neighbors; (b) Cooperative model with increasing size of v’s cluster.
In the cooperative miner model, node v may collude with a set of miners to maximize its reward. We consider the same 100-node network connected as a random graph with average degree 4 as before. Next, we choose a cluster of d nodes including v with each node connected to all other nodes in the cluster. The topology of the remaining nodes is set to a random graph of average degree 4. The d-node cluster in red is connected to the remaining nodes in blue through only two edges as shown in Figure 1b. Under this setting, we vary the size of the cluster d and plot the average reward earned by miners within the cluster in Figure 2b. Here too, we observe that as the cluster size increases, initially there is an increase in the reward but after a threshold size the reward starts decreasing.
These observations illustrate a tight tension between increasing connectivity to reduce latency at a node and thereby indirectly helping to increase the connectivity at other nodes. The effect of topology on mining rewards is diminished if the mining rate is set such that the average time between mining consecutive blocks is much larger than the time taken to broadcast a block to a majority of nodes in the network. (Under an approximation, it can be shown that for a network with a given topology and set of underlying latencies, the relative change in a miner’s reward due to the network topology is inversely proportional to the average time between mining consecutive blocks). Dogecoin [51], Litecoin [52] and Monero [53] feature interblock times of approximately 1 to 2 min. This interval is typically only 10 to the broadcast latency; the topology is likely to play a significant role in the rewards obtained. In the remainder of this paper, we have considered settings where the time between mining consecutive blocks is close to () the latency of broadcasting a block over the network for the purpose of clearly highlighting the effects of topology on rewards. Our results hold even at lower mining rates, albeit with relatively smaller differences between the rewards of different miners. More importantly, we believe that a systematic study of these effects (from both performance and security viewpoints) can help inspire a new family of highly efficient network-aware consensus protocols that are much more scalable than today’s blockchain solutions which often treat the network as a blackbox having simple high-level properties (e.g., synchrony).
5. Evaluation
In this section, we present an experimental evaluation to highlight reward bias due to network topology and geographical location in real-world settings. We also present candidate protocols that miners can adopt in order to alleviate the bias and increase their profits.
5.1. Simulation Setup
We conduct our experiments on OMNeT++ 5.6.2, an event-driven simulator [54], by implementing a detailed mining and block propagation model. There are 246 miners in our simulation, with each miner mining blocks, broadcasting messages and maintaining a local replica of the blockchain in a completely decentralized fashion. The model we have used in the simulations builds upon the model described in Section 3.
At the start of the simulation, all the nodes mine the block on top of the genesis block. To simulate mining, each miner has an independent random timer that expires according to an exponential distribution with a default mean of 15 seconds. We first use the same rate for all miners to model uniform hash power across all miners. Later, we set a different rate for all miners but keep a similar mining rate for the total network to model non-uniform hash power distributions. When a miner’s timer expires, it generates a block on top of the block with the greatest height on its blockchain, and broadcasts it immediately to its connected neighbors. When a miner is waiting for its timer to expire, if it receives a new block that extends its current longest chain, it updates its local blockchain and resets the timer to mine on top of the newly received block.
Miners receive and generate messages of different types, each of which causes the state of the miner to be updated as follows.
- *
- A block message has an identifier and a reference to the identifier of the block’s parent. We do not include any transactions in a block message, nor do we model bandwidth limitations in the network. When a miner receives a block message, it first validates the block by verifying that it points to a valid parent block in its blockchain. If the received block is valid and extends the longest chain in the blockchain by one, the miner adds the block to its blockchain. It then resets its exponential timer to mine a new block over the latest received block. We set a duration of 1 ms at each miner for this validation operation. Upon validation, the miner immediately sends out the block message to all of its neighbors except the one it received the block from.
- *
- A miner may also receive a block message, whose parent block is unavailable at the miner’s local blockchain replica. In this case, the miner sends a ‘require’ message back to the sender of the block requesting that they also send the parent block. Meanwhile, the received block is stored within an orphan block list at the miner. We set a duration of 1 ms at each miner for this operation as before. When a miner receives a require message, it sends back the requested block as a ‘response’ message. In case the block message received in response to the require message is also such that its parent block is unavailable, a second require message is sent. This process continues until all blocks from the genesis to the first received block are available.
- *
- If a miner receives a block that is not part of the longest chain, it adds the block to the blockchain and does not relay the block to any of the neighbors.
Miners earn rewards by mining blocks that are included in the longest chain. We measure reward by computing the fraction of blocks mined by a miner that is included in the longest chain, i.e., the values for each miner v as defined in Equation (1). While it is likely that the blockchain replicas at different miners are not completely consistent with each other, it is typically the case that the longest chain except for the last few blocks is consistent across miners. So we discard the last 100 blocks in the longest chain, and collect the fraction of valid blocks among the remaining blocks in the longest chain for each miner. Each experiment is run for a sufficient duration such that more than 100,000 blocks are present in the longest chain at the end of the simulation. This ensures that each miner mines some blocks within the longest chain. For each network topology, we run 10 independent simulations to gather confidence in the reported results.
We consider 246 miners distributed across cities around the world. There are 94 miners from Europe, 83 from North America, 37 from Asia, 12 from South America, 11 from Africa and 9 from Australia [55]. The propagation delay of sending a block from any miner u to miner v is set using latencies of sending pings from city u to city v as measured in the global ping statistics dataset collected on 19 and 20 July 2020 from WonderNetwork [56]. We take half of the average measured ping round-trip times as the propagation delay between the two miners. The median link propagation delay in the dataset is 69 ms. We do not model bandwidth at the miners, and assume block sizes to be small relative to the bandwidth. We have set the delay for validating blocks (i.e., for miner v in Section 3.1) to be a low value of 1 ms, as in reality miners have significant computational power available to them [57]. The primary broadcast delay bottleneck in our experiments is therefore the WAN propagation delay. We will open-source all code and datasets used in the experiments and include a weblink for them in the final version of the paper.
5.2. Results
In the following sections (Section 5.2.1, Section 5.2.2 and Section 5.2.3), we consider various candidate topologies for the network and measure the effect they have on the rewards of miners when they have uniform hash power. The purpose of these experiments is solely to understand these effects—we do not consider how the topologies may be constructed (desirably in a distributed fashion) by the miners or the effect of a dynamically changing topology and leave these issues for future work. Then, we measure our derived topology in the non-uniform hash power network (Section 5.2.4); the purpose of these experiments is to extend our results to a more universal case, and show the effects on the rewards bias from region bias and hash power bias.
5.2.1. Reward Bias on a Random Topology
On a worldwide network, the distribution of miners implicitly creates a clustering in the network, even if the topology is chosen in a geography-independent way (e.g., randomly). So before we provide any optimized topology designs, we first investigate how much benefit/harm miners receive owing to their geography. For this experiment, we consider the 246-miner network outlined in Section 5.1, with link latencies following the WonderNetwork ping dataset. We consider a random topology and the complete graph topology. The random topology randomly picks a fixed number of neighbors for each node. Due to the smaller size of our network, we set an (out-)degree of 6 for each miner rather than 8. Each miner reaches out to six random miners and builds connections to them; it also accepts any incoming connection requests from other miners. The complete graph topology connects each miner to the remaining 245 miners. Thus, each miner has a direct connection to every other miner.
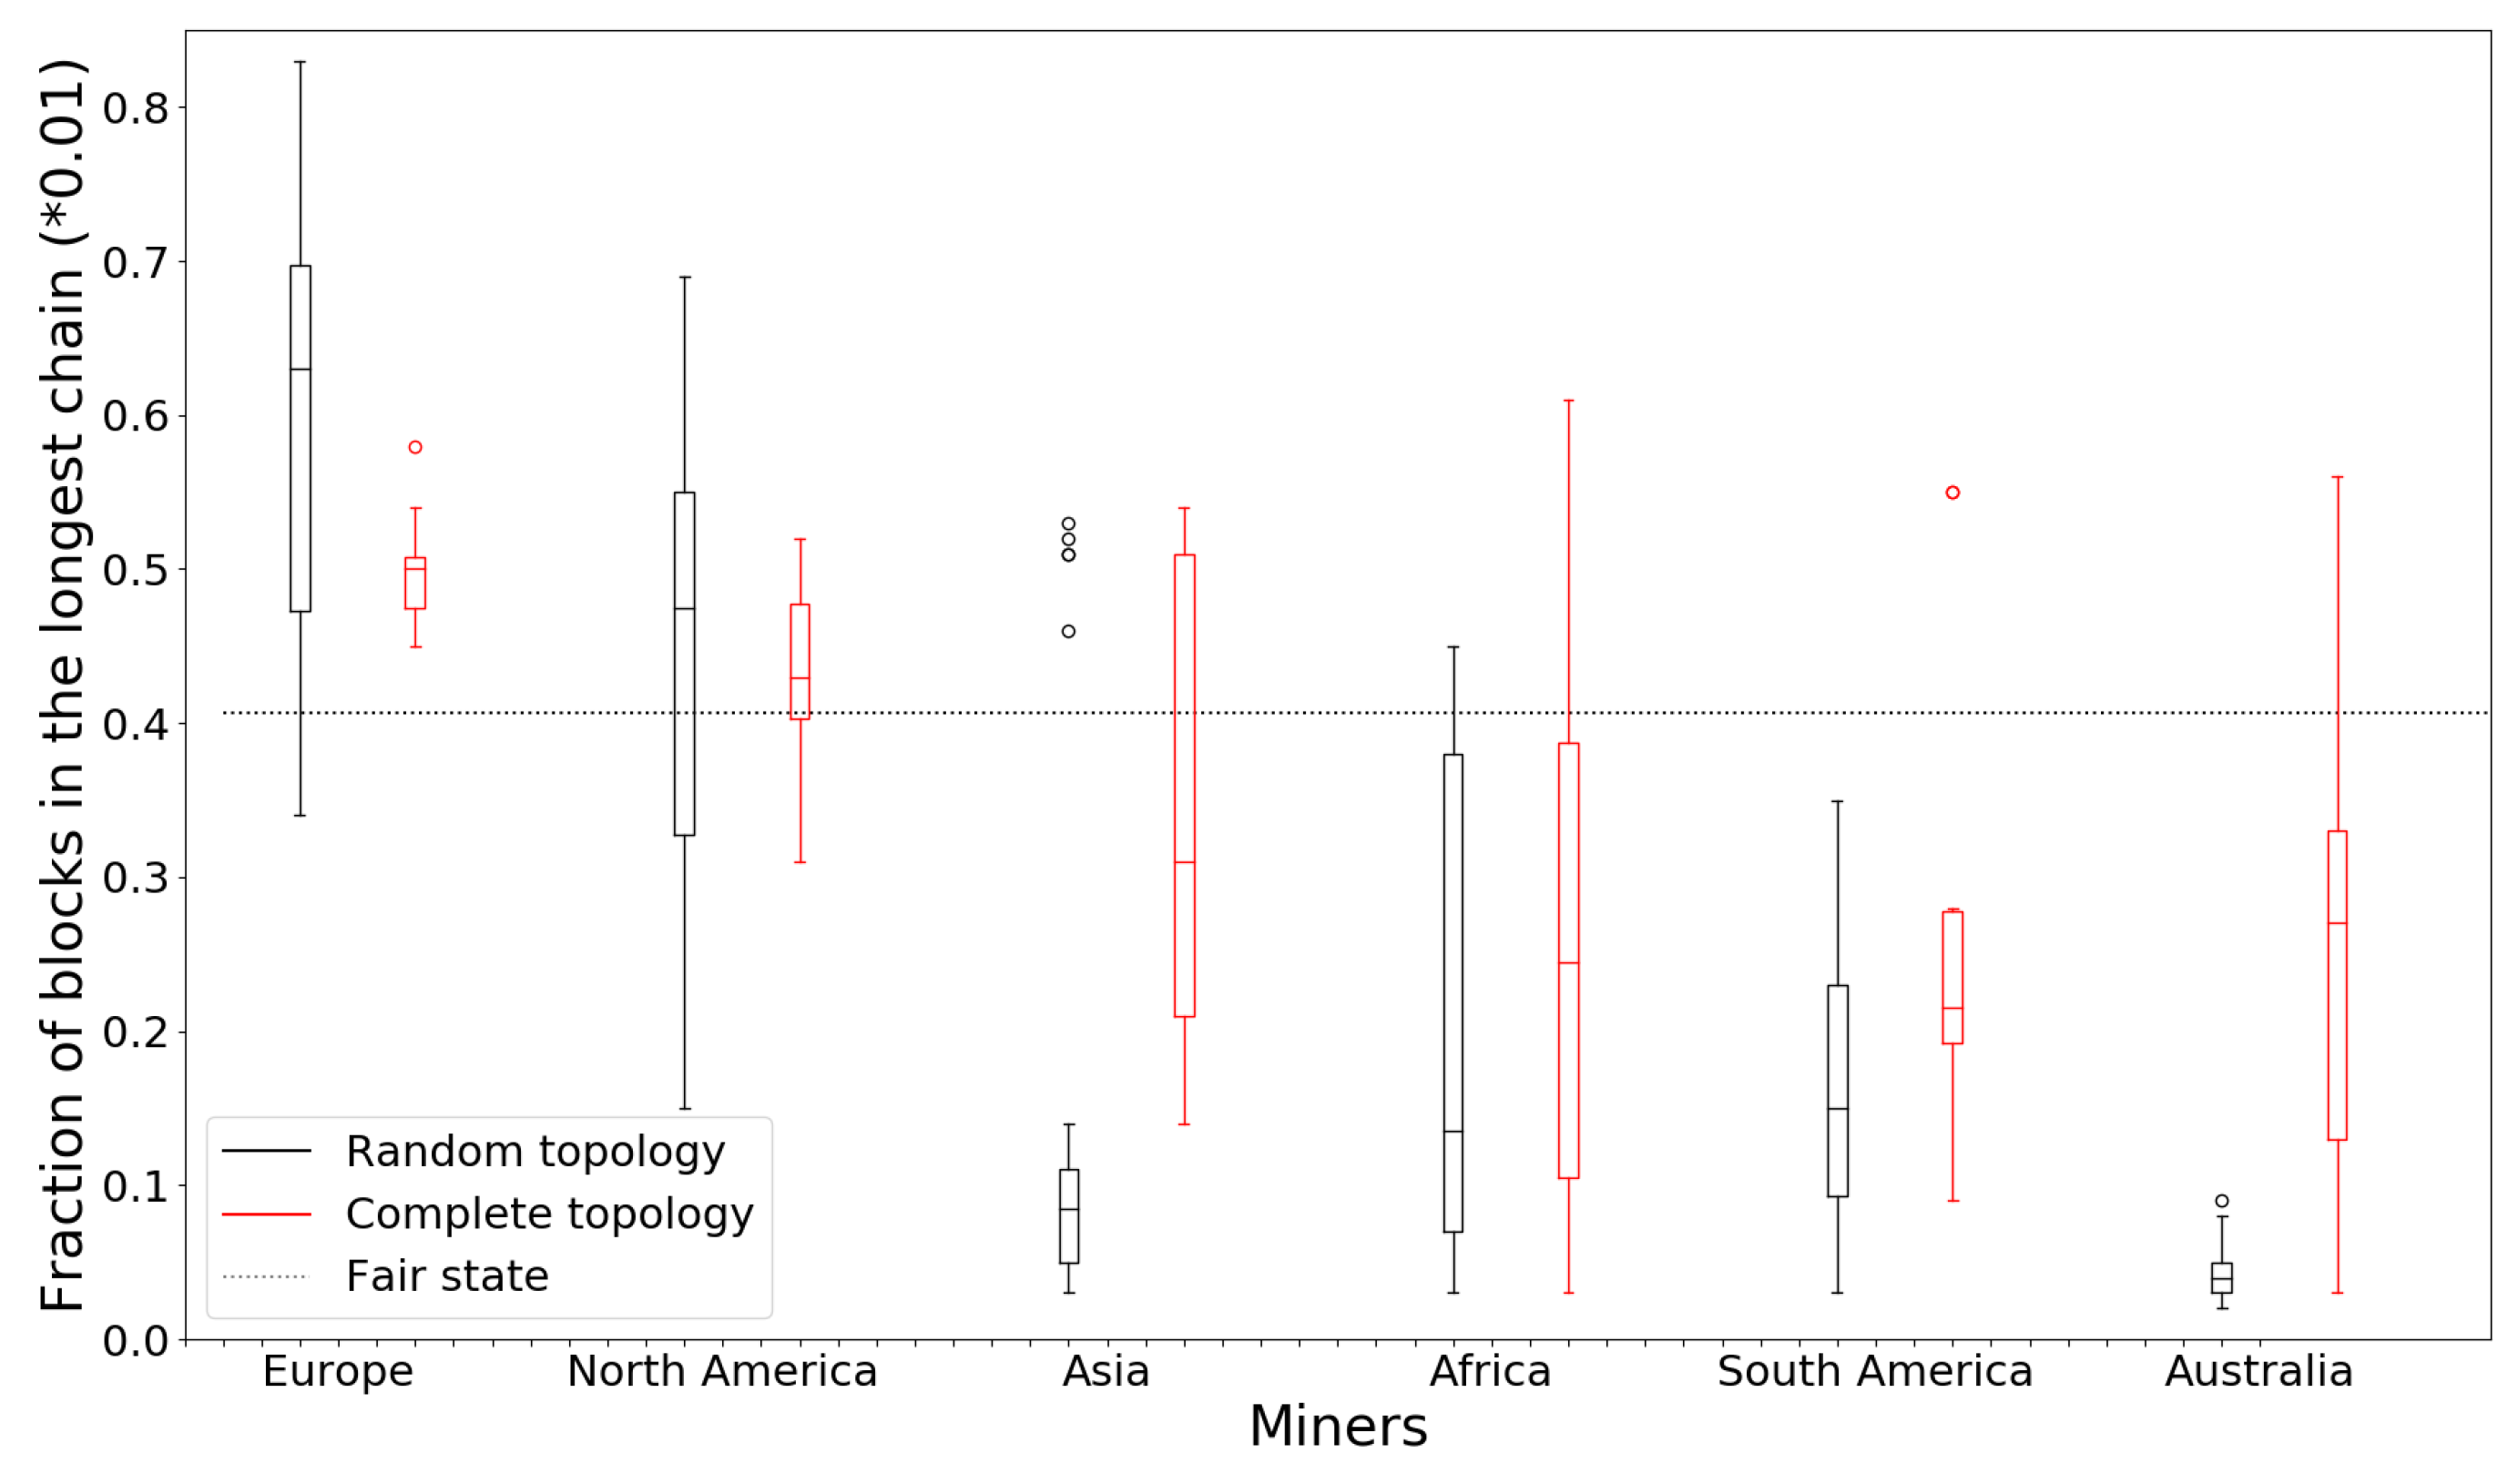
Figure 3 shows the results, where we have the distributions of the fractions of blocks in the longest chain miners on each of the six continents. For brevity, we have randomly chosen 10 miners from each continent and have included only their results in the figure. Due to the limited number of miners (nine) in Australia, we plot only these nine instances. We see that Europe and North America are the dominant clusters (i.e., cluster of tightly connected nodes with significant aggregate hash power). However, most of the European and North American miners obtain a greater fraction than the average hash power (100%/246) while miners on other continents obtain below their fair share in both topologies. In the complete graph topology, Europe and North America obtain power slightly closer to the average, but there is still a large difference between they and other regions.
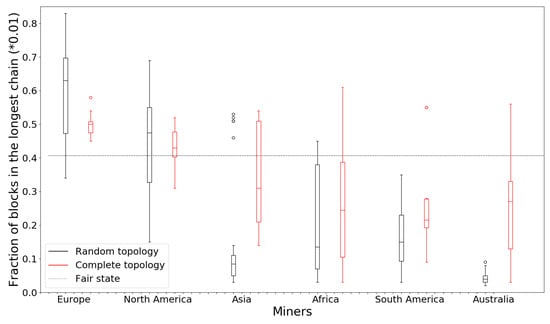
Figure 3.
Fraction of blocks in the longest chain as mined by miners on different continents under random and complete graph topologies. The confidence intervals are omitted for the complete graph results for clarity.
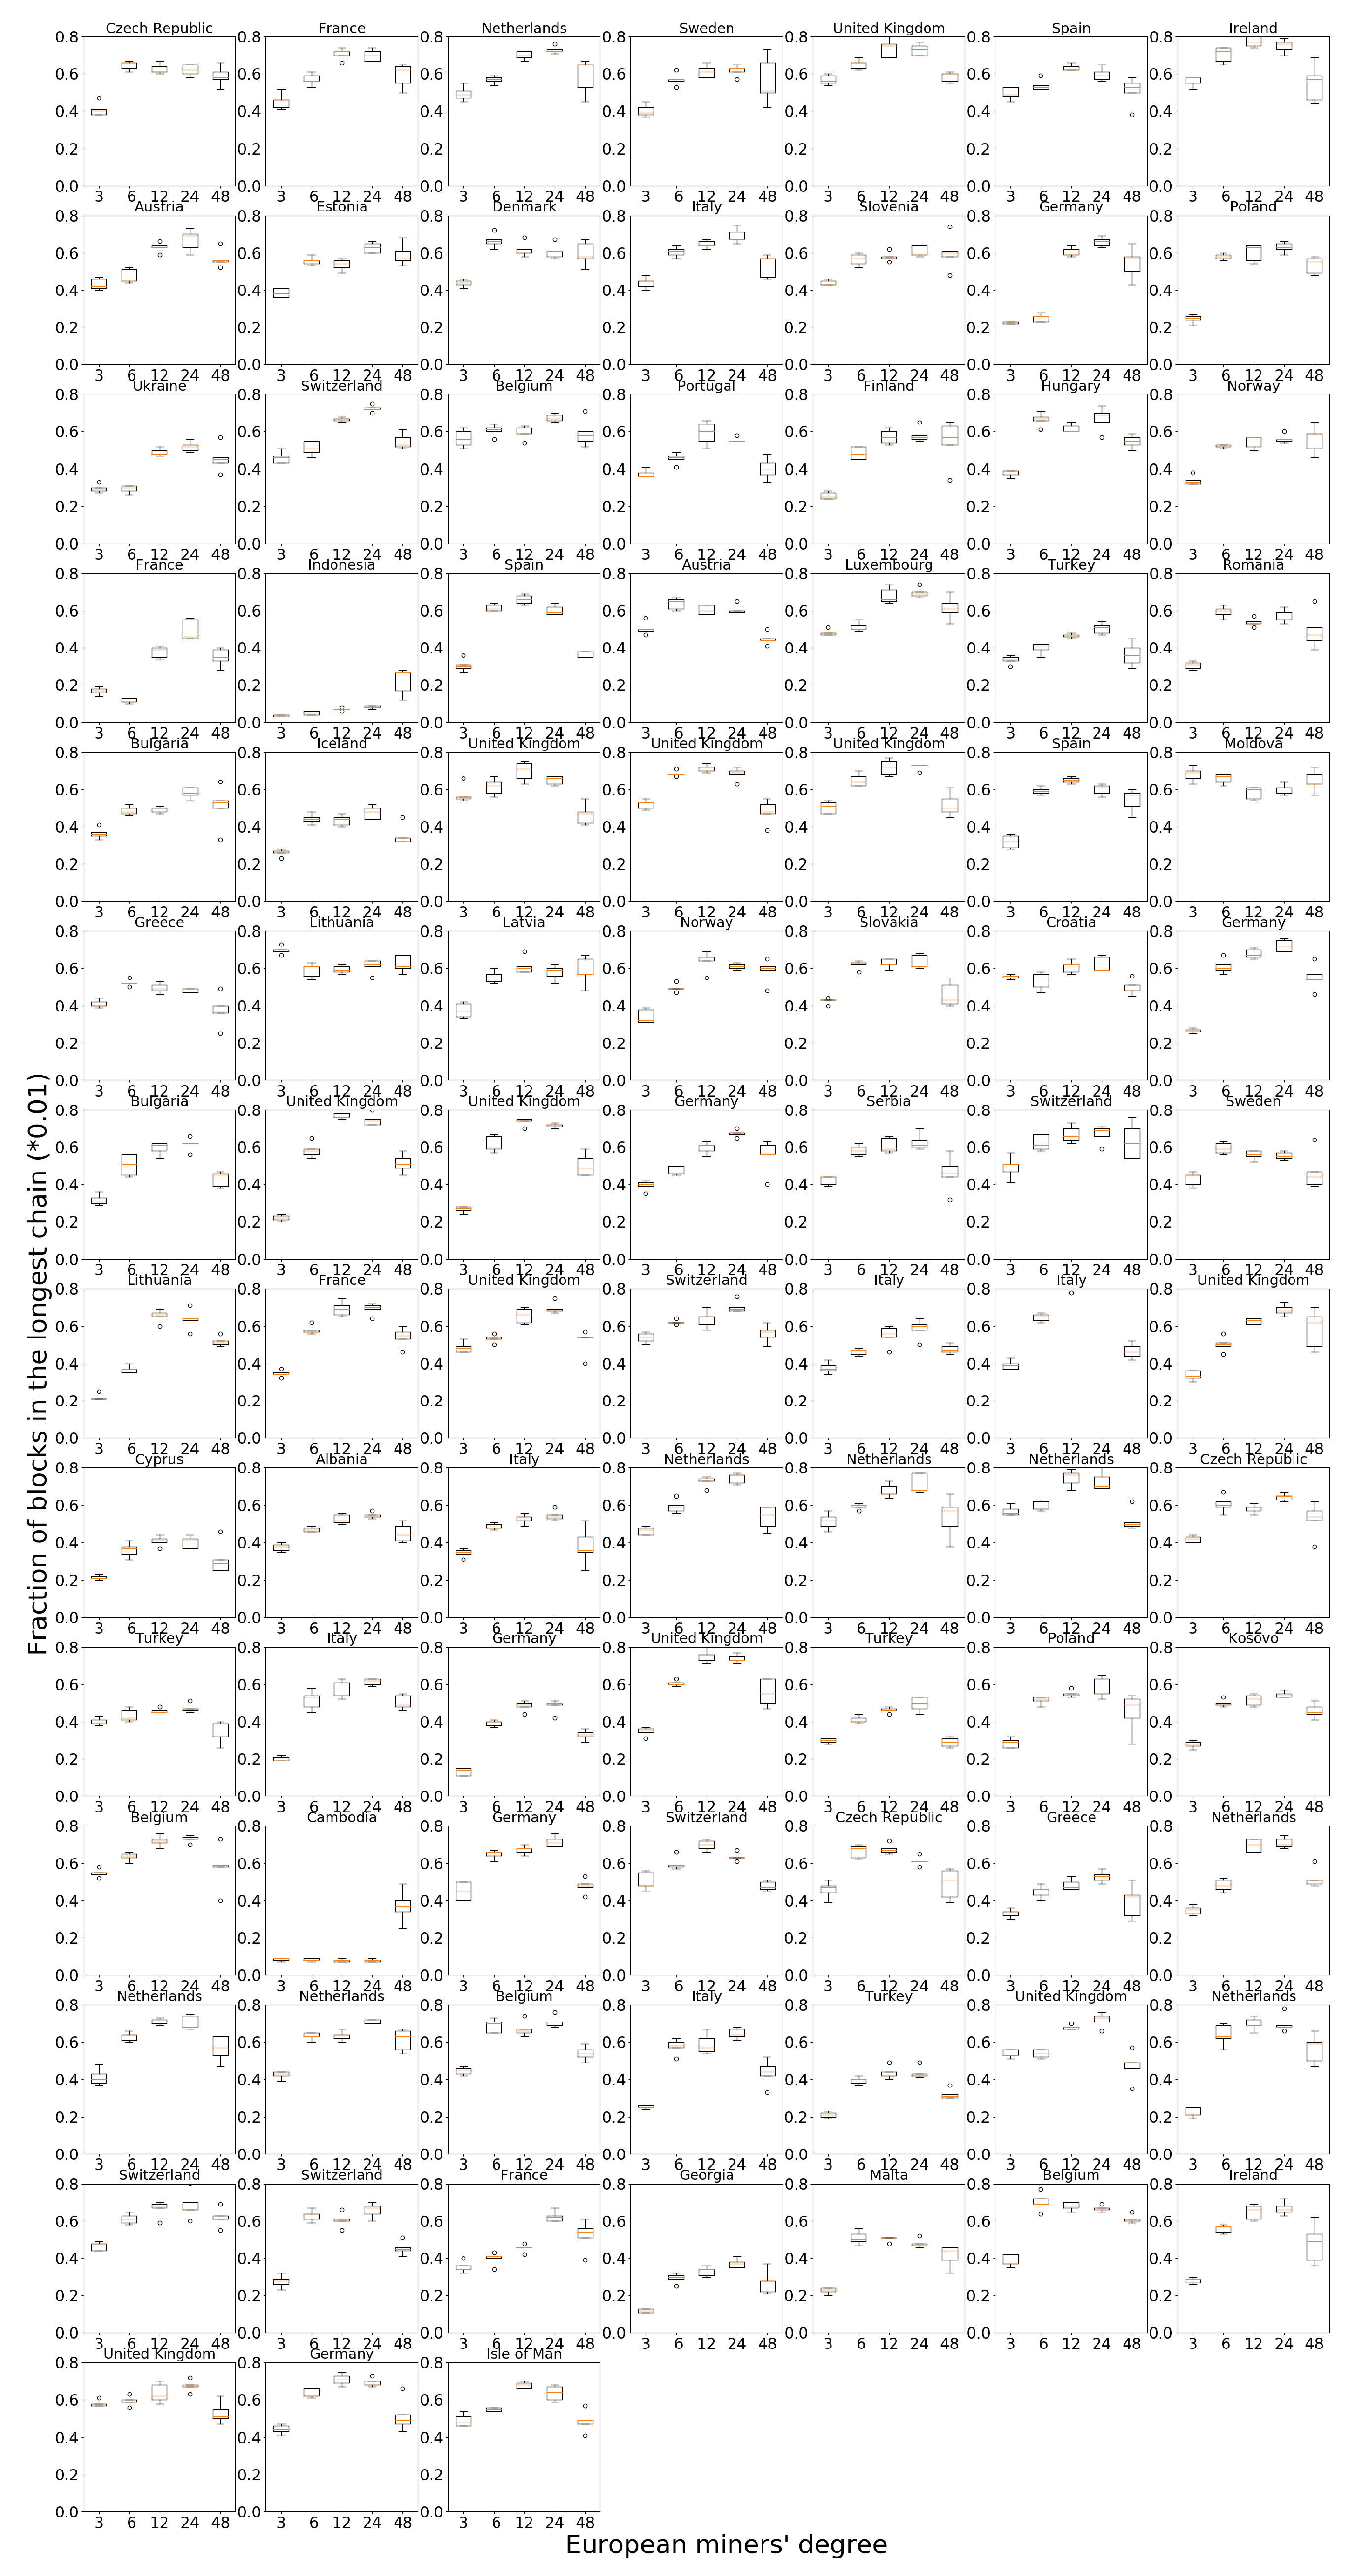
We can explain the difference between Europe, North America and the other regions as follows. As a large cluster with low link delay within the cluster, Europe and North America can receive a higher acceptance rate in their mined blocks, as it corresponds to there being a single dominant cluster in the network. Since Europe has 94 miners and North America has 83 miners, together they have 72% of all miners in the network, which provides strong fraction gains for every miner in the cluster. Figures for all the miners in Europe can be found in Figure 4.
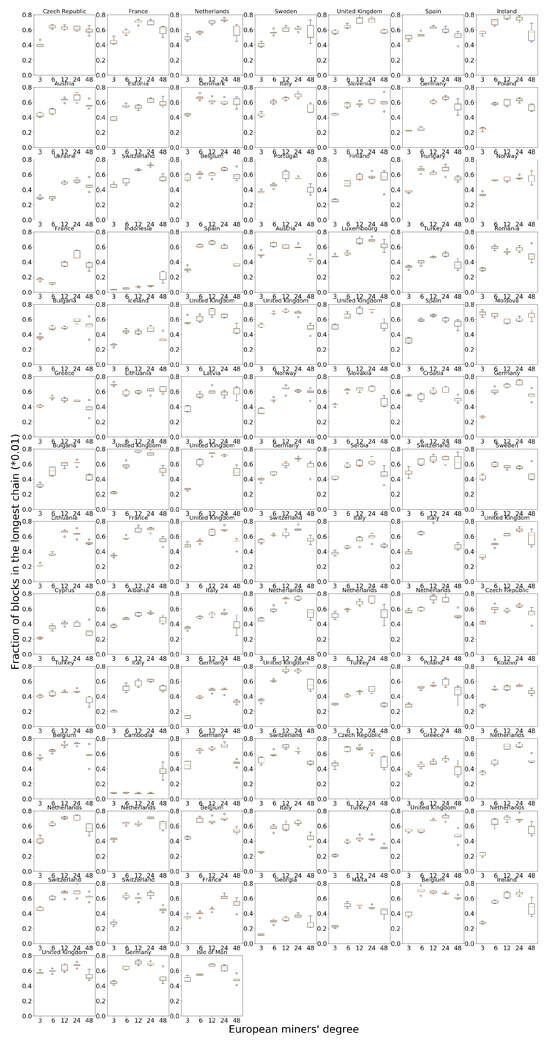
Figure 4.
European node performance when increasing the degree of miners in Europe.
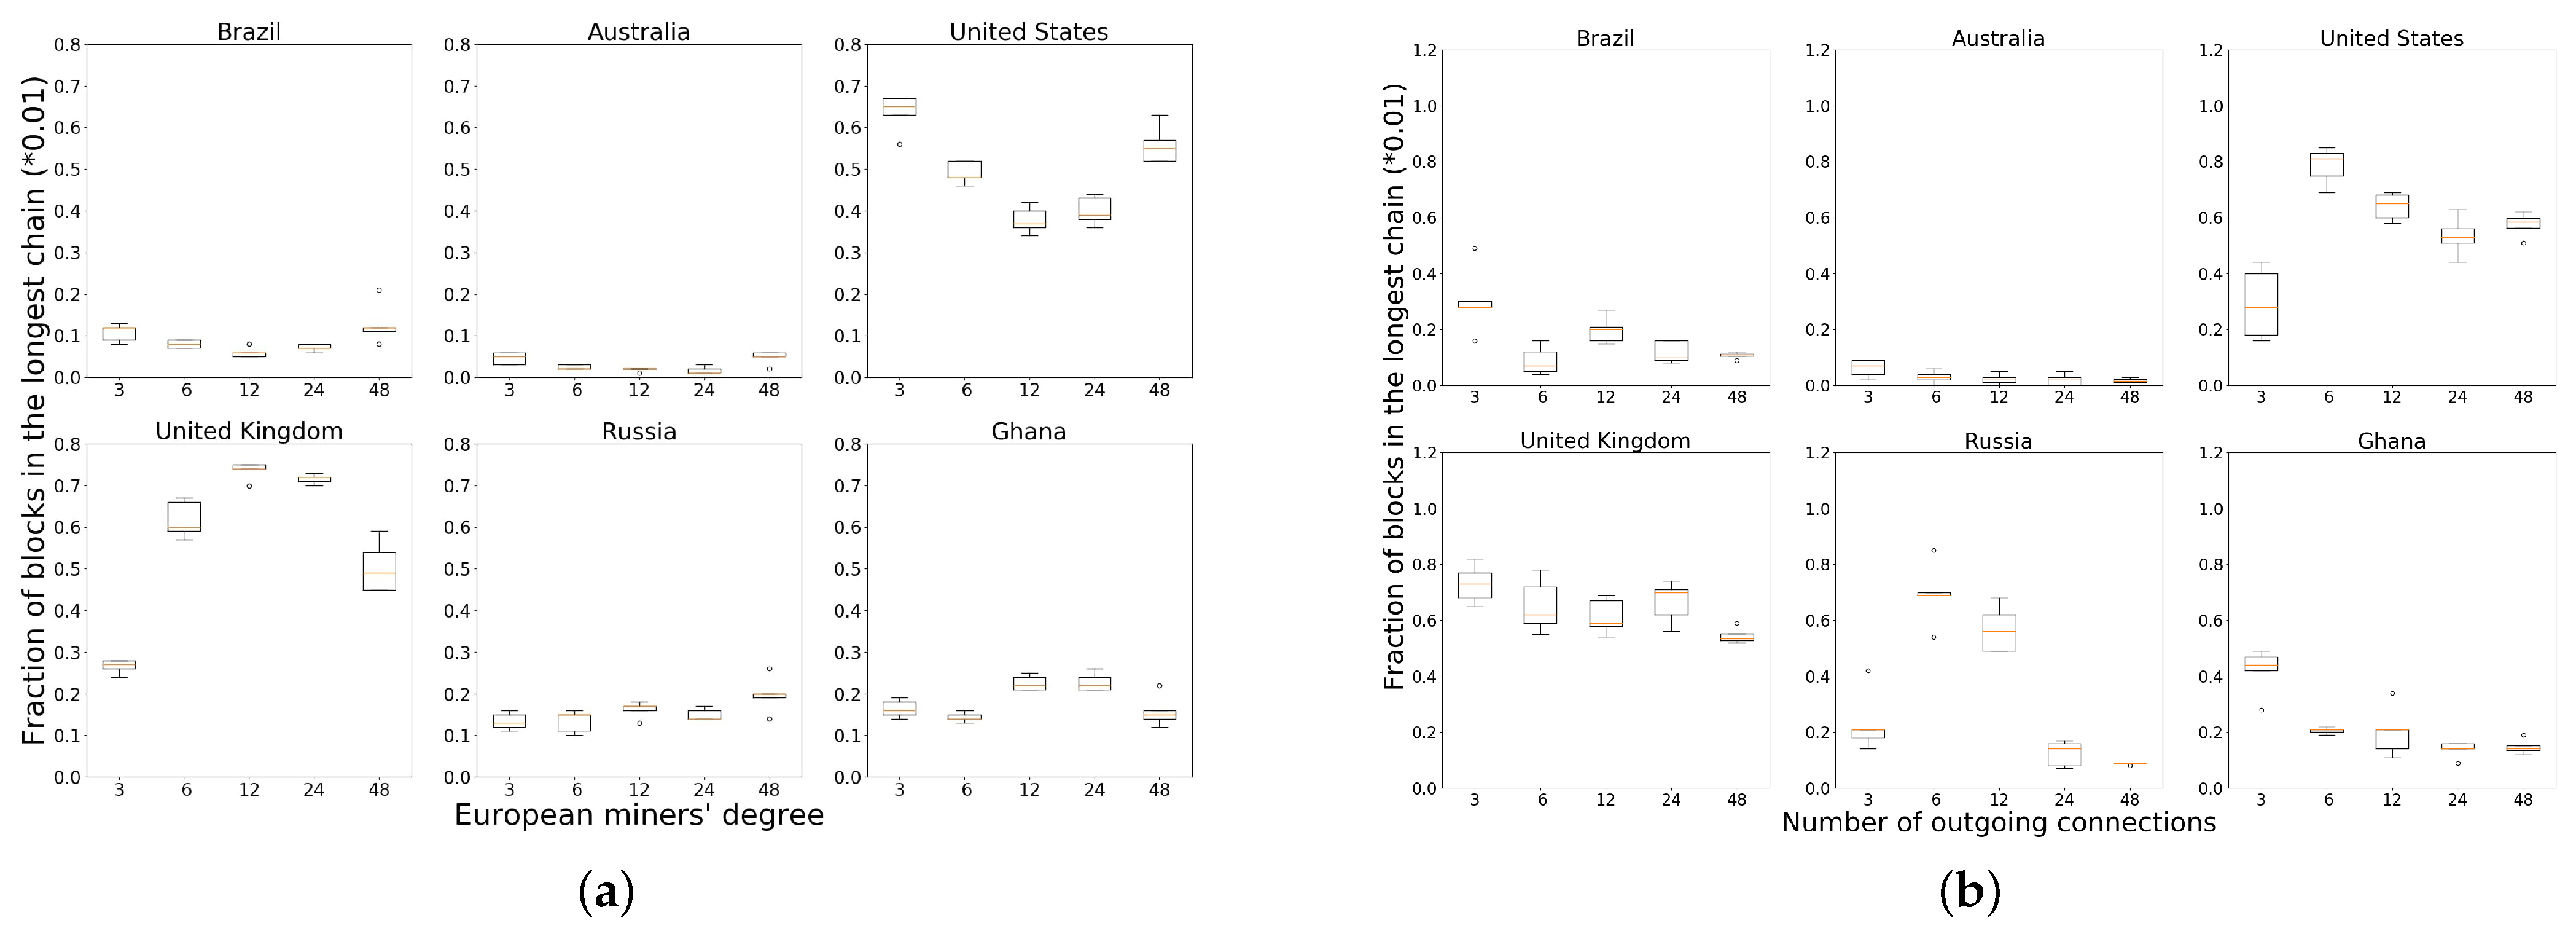
5.2.2. Topologies to Increase Rewards
Geography-induced clustering under a random topology provides a natural advantage to the European and North American nodes. We verify whether increasing the number of neighbors further benefits miners in Europe and North America. By keeping the degree at other miners fixed at six, we increase the number of random connections at European miners to vary as 3, 6, 12, 24 and 48. Figure 5a plots the performance for six randomly chosen miners on each continent. While the performance increases initially with increasing degree, after about 12 neighbors any further increase in number of neighbors hurts the miners.
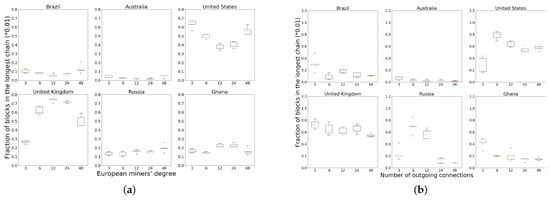
Figure 5.
Reward distribution by random miners when increasing degree of central miners. (a) Increasing the degree of miners in Europe hurt them at high degree; (b) Increasing the degree of miners in Europe and North America.
Since there are two central regions, we also consider a policy where we increase the neighbor degree at both European and North American miners, while keeping the degree of other miners fixed. Figure 5b plots the performance of six nodes as in Figure 5a. Here too, the performance tends to drop with more neighbors.
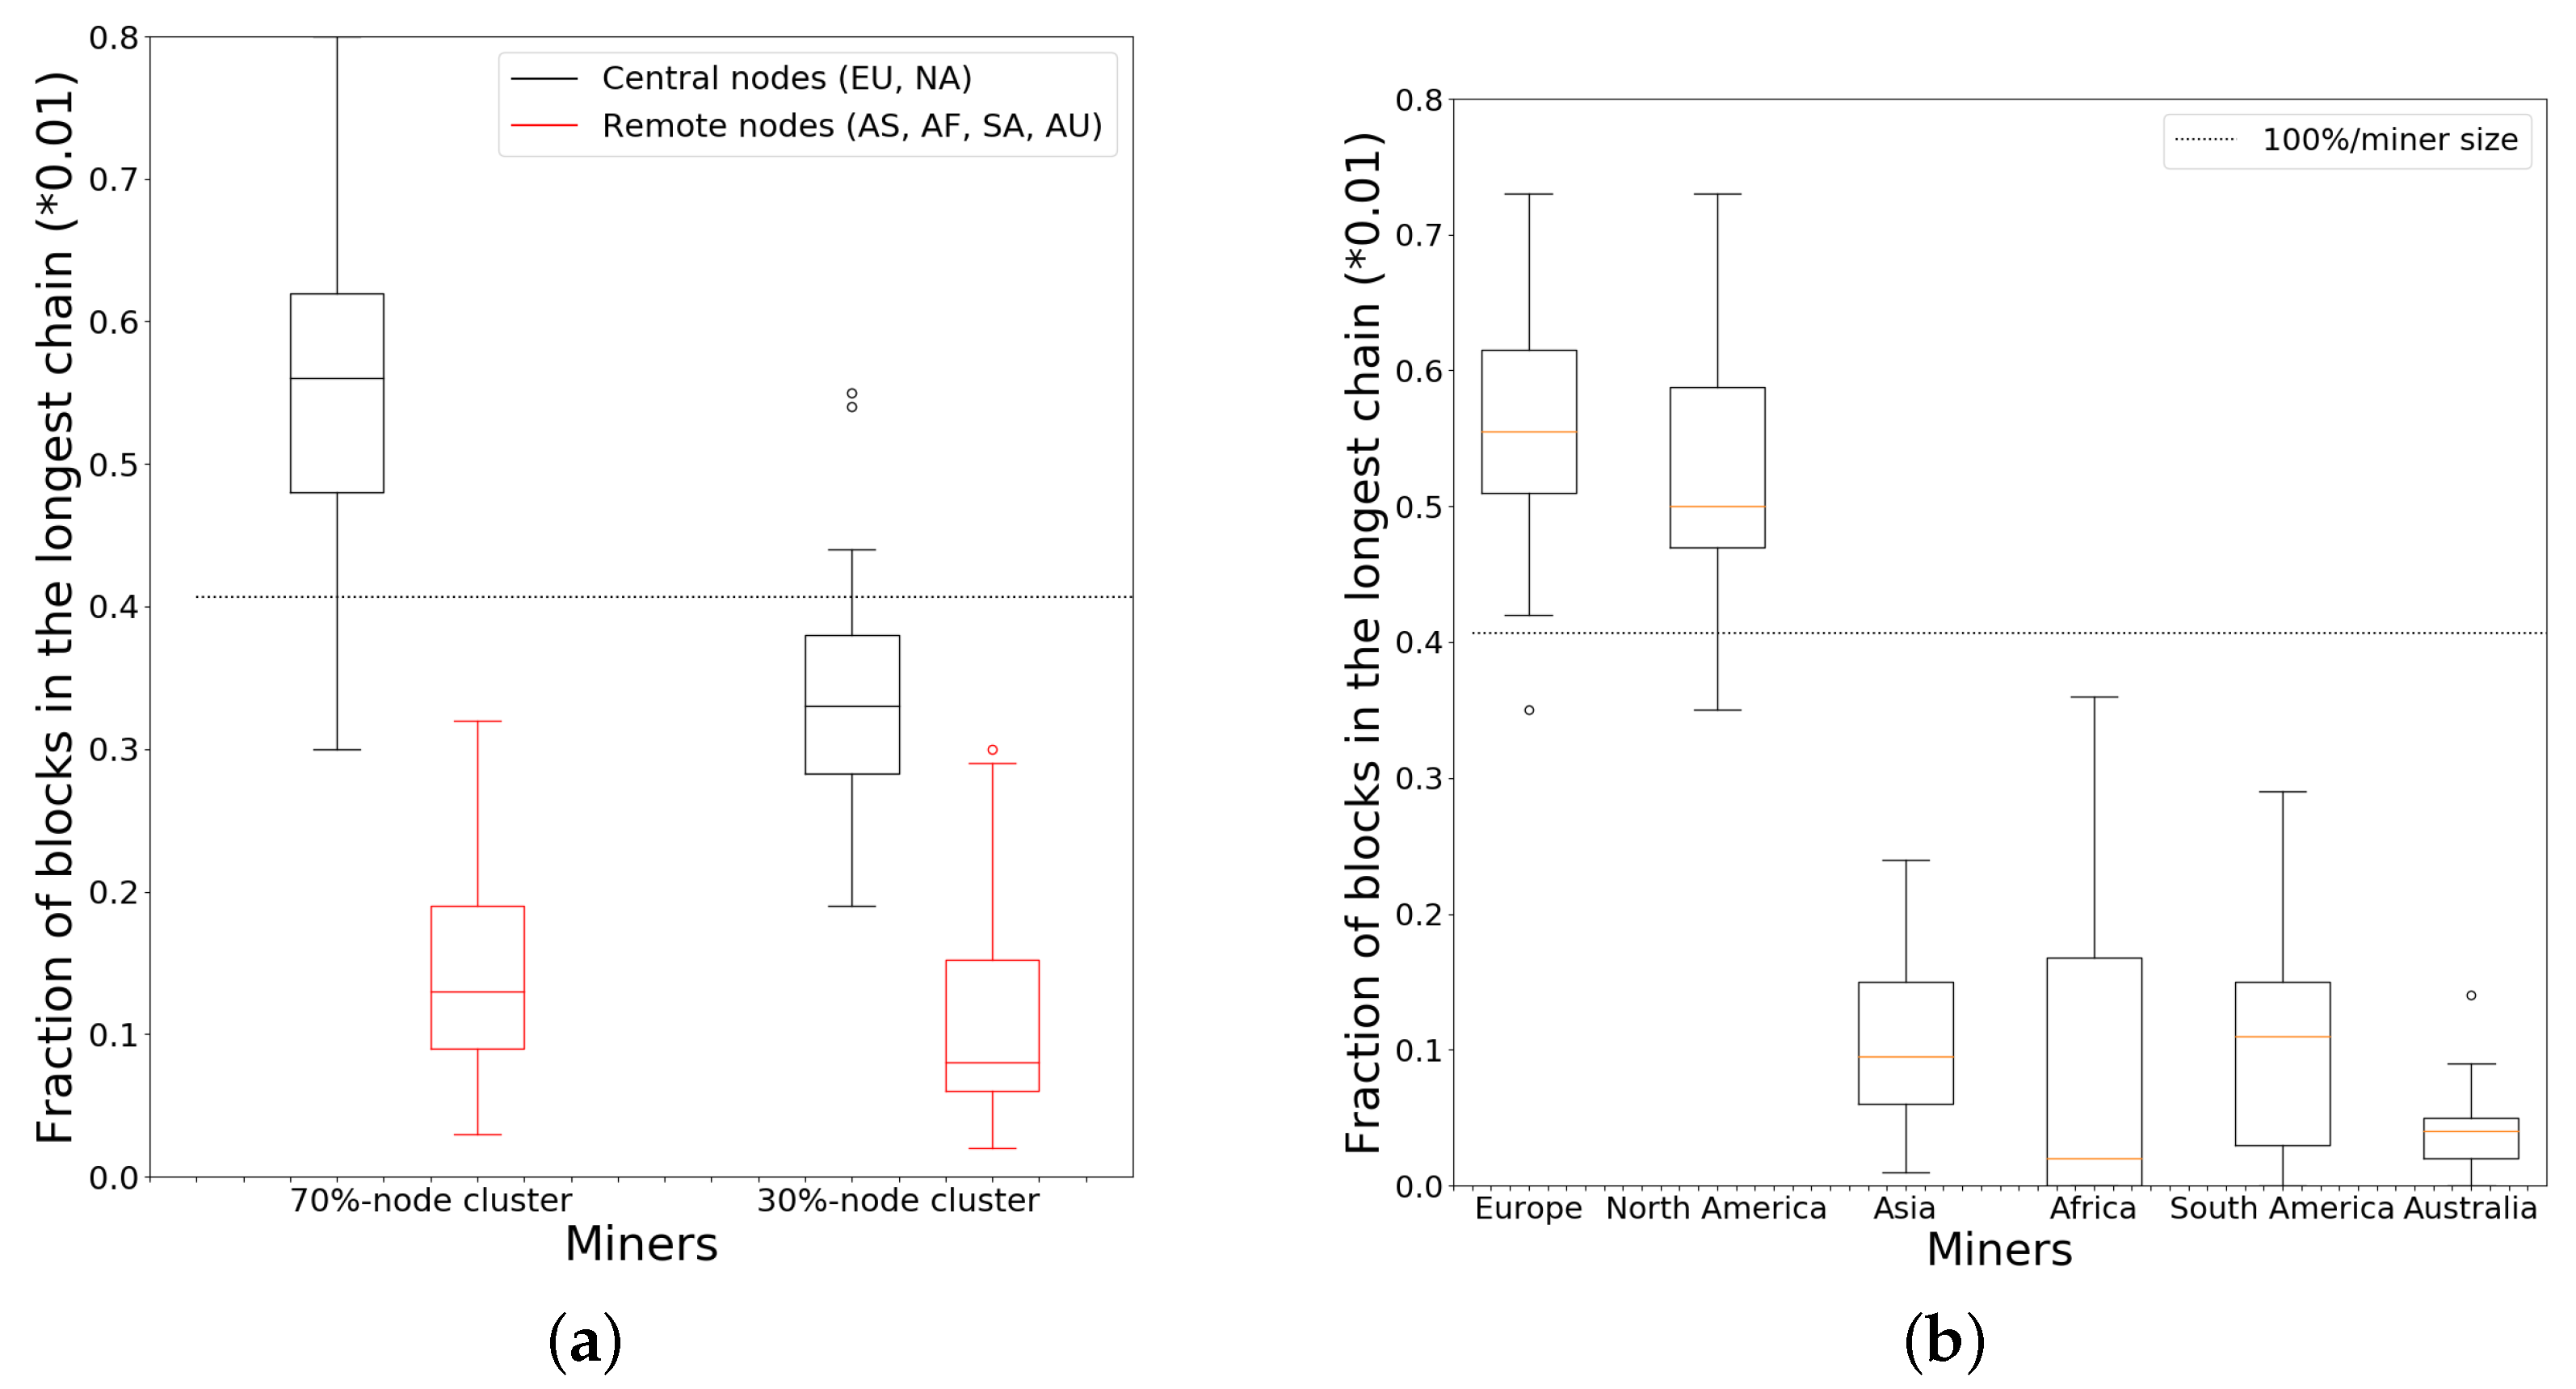
Next, we consider topologies in which a subset of miners are tightly interconnected to form a dominant cluster. We first implement a clustering policy in which nodes are randomly split into two groups, containing 70% and 30% of miners, respectively. The first group is the dominant cluster, while the second group is the non-dominant cluster. We connect each miner to every other miner within its own cluster, whereas we leave only 20 connections overall between the two clusters. Figure 6a shows the results, where we only plot the distribution t of miners from the 70% node cluster and the 30% node cluster. We observe that miners from the large cluster obtain a greater fraction of blocks due to being part of the larger cluster, whereas even European and North American miners have a hard time achieving the average fraction of rewards if they are in the smaller cluster.
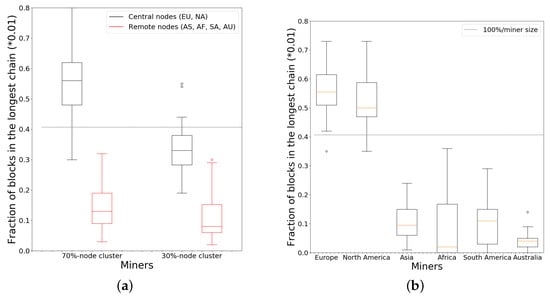
Figure 6.
Fraction of blocks in longest chain mined by miners in the dominant and non-dominant clusters under 2 policies. EU, NA, AS, AF, SA and AU denote Europe, North America, Asia, Africa, South America and Australia, respectively. (a) Random clustering policy; (b) A geography-based clustering policy.
We also consider another clustering policy where we take Europe and North America together as the large cluster and the remaining continents as the small cluster. As before, within a cluster we connect each miner to all other miners in the cluster and leave only 20 connections between clusters. In Figure 6b, the fraction distributions are consistently for miners in the dominant cluster compared to Figure 6a.
5.2.3. Alleviating Reward Bias
In light of the reward biases due to clustering that have been highlighted thus far, a natural question that arises is what can miners negatively affected by the clustering do to lessen the impact of clustering on their payoff. Two potential solutions arise.
- First, if the miner has knowledge about the existence of a dominant cluster in the network, it should attempt to connect to as many miners within the cluster as possible and become a part of it.
- When this is not possible, if the miner has knowledge about other miners that are not included in the dominant cluster it should attempt to connect to as many of those miners as possible to form as large a non-dominant cluster in the network as possible.
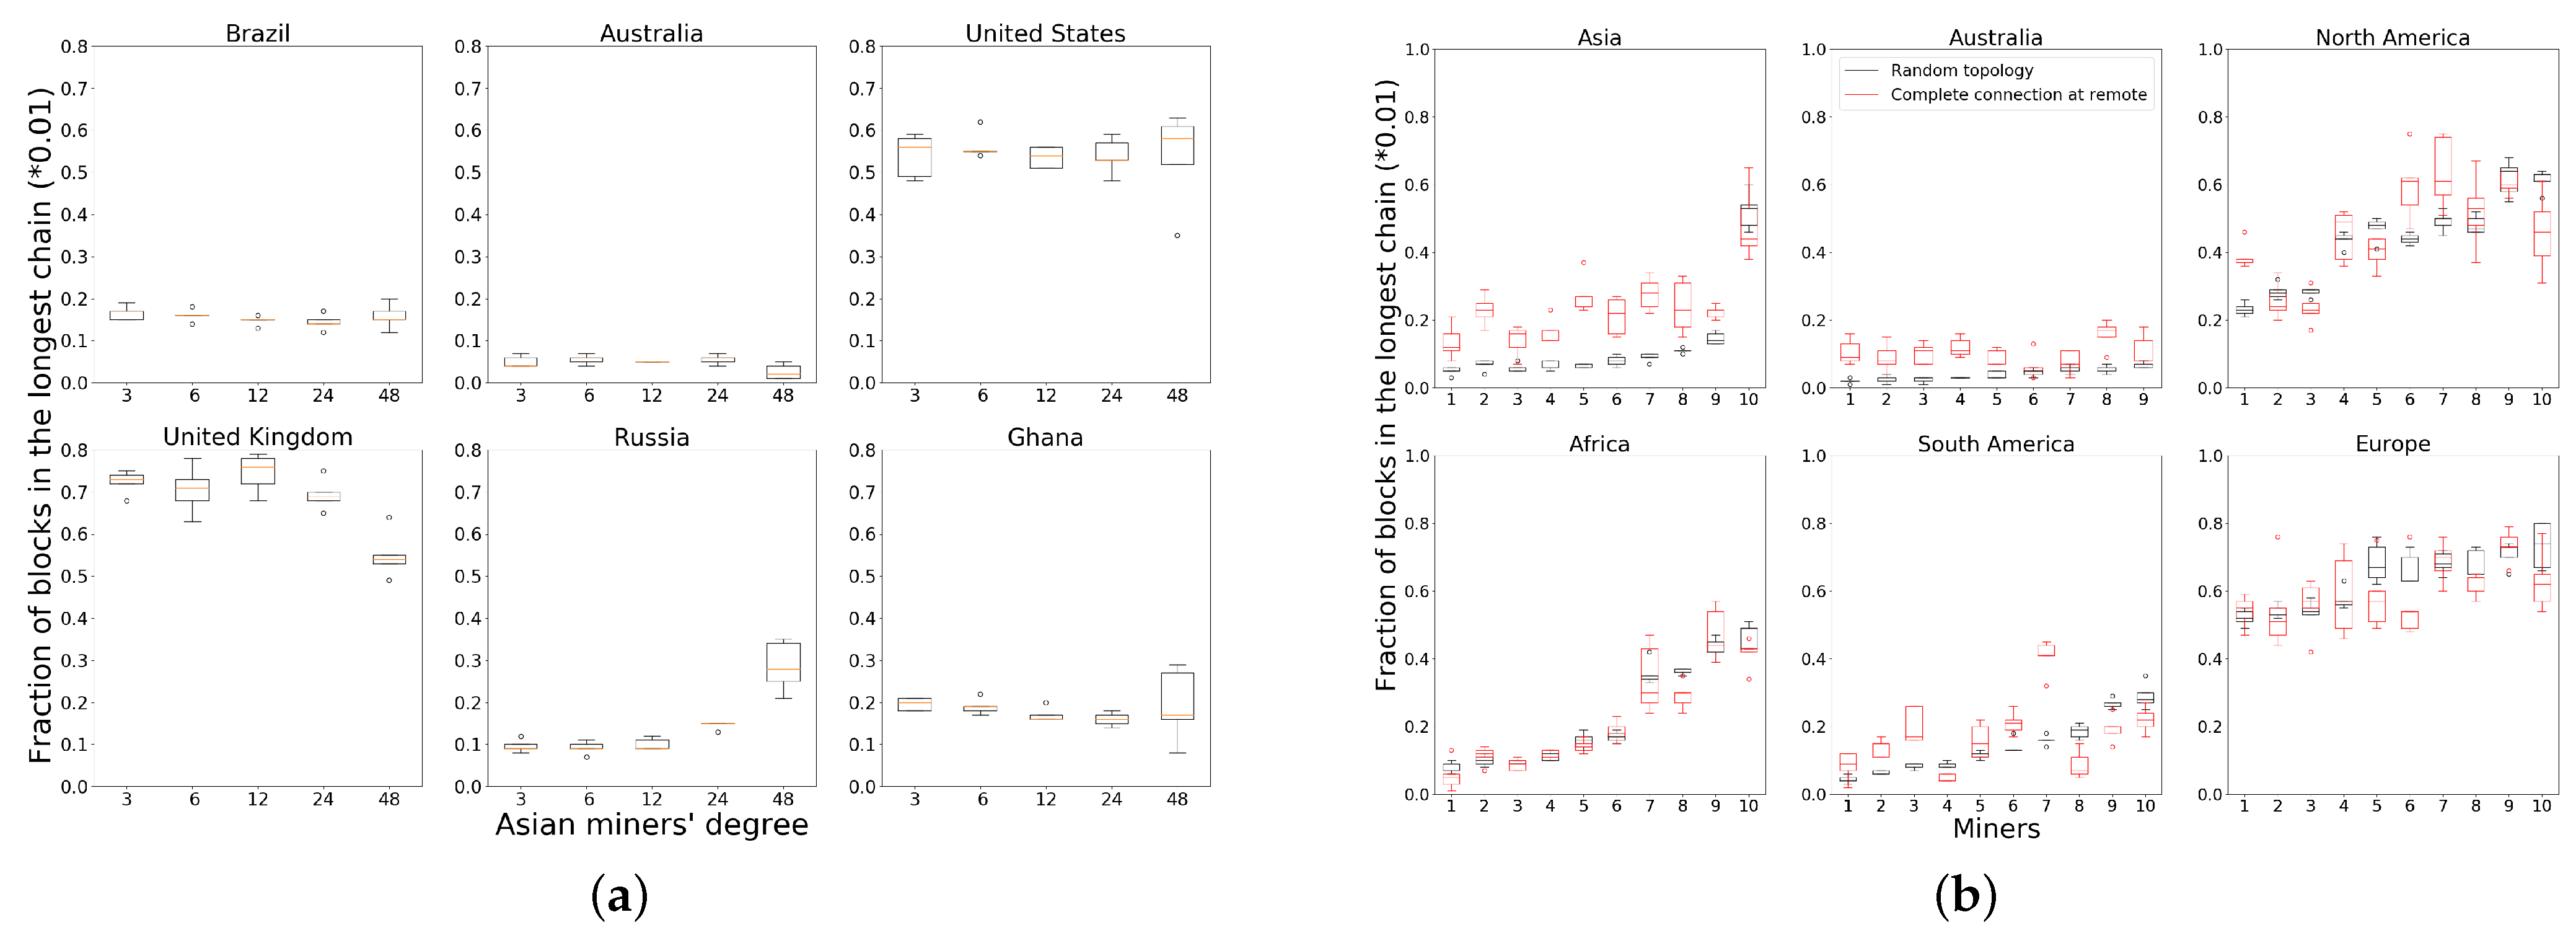
To test these solutions, we conduct experiments where we adjust the neighbors of miners in non-central locations, namely, Asia, Africa, Australia and South America to see if their reward improves. We first focus on miners only in Asia. Due to the relatively small number of Asian miners and relatively large propagation delays to other miners, most Asian nodes receive less than their fraction of hash power in the random topology (Figure 3). By keeping the rest of the network topology fixed (each miner makes six random outgoing connections), we adjust each Asian miner to choose 3, 6, 12, 24 and 48 neighbors across different experimental runs. Figure 7a plots the fraction of rewards obtained by six randomly selected miners on different continents. With an increasing number of neighbor connections, all four Asian nodes receive a higher reward. Miners in Russia and Israel are closer to Europe so they perform better than the other two nodes at first. However, they have a lesser relative performance improvement with 48 outgoing neighbor connections compared with the miners in Japan and India.
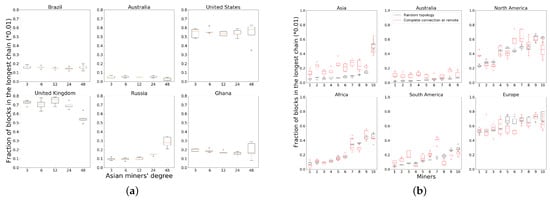
Figure 7.
Reward distribution when increasing degree of remote miners. (a) Increasing the degree of miners in Asia strictly benefits them; (b) Tightly interconnecting miners in non-central regions strictly benefits most of the non-central miners.
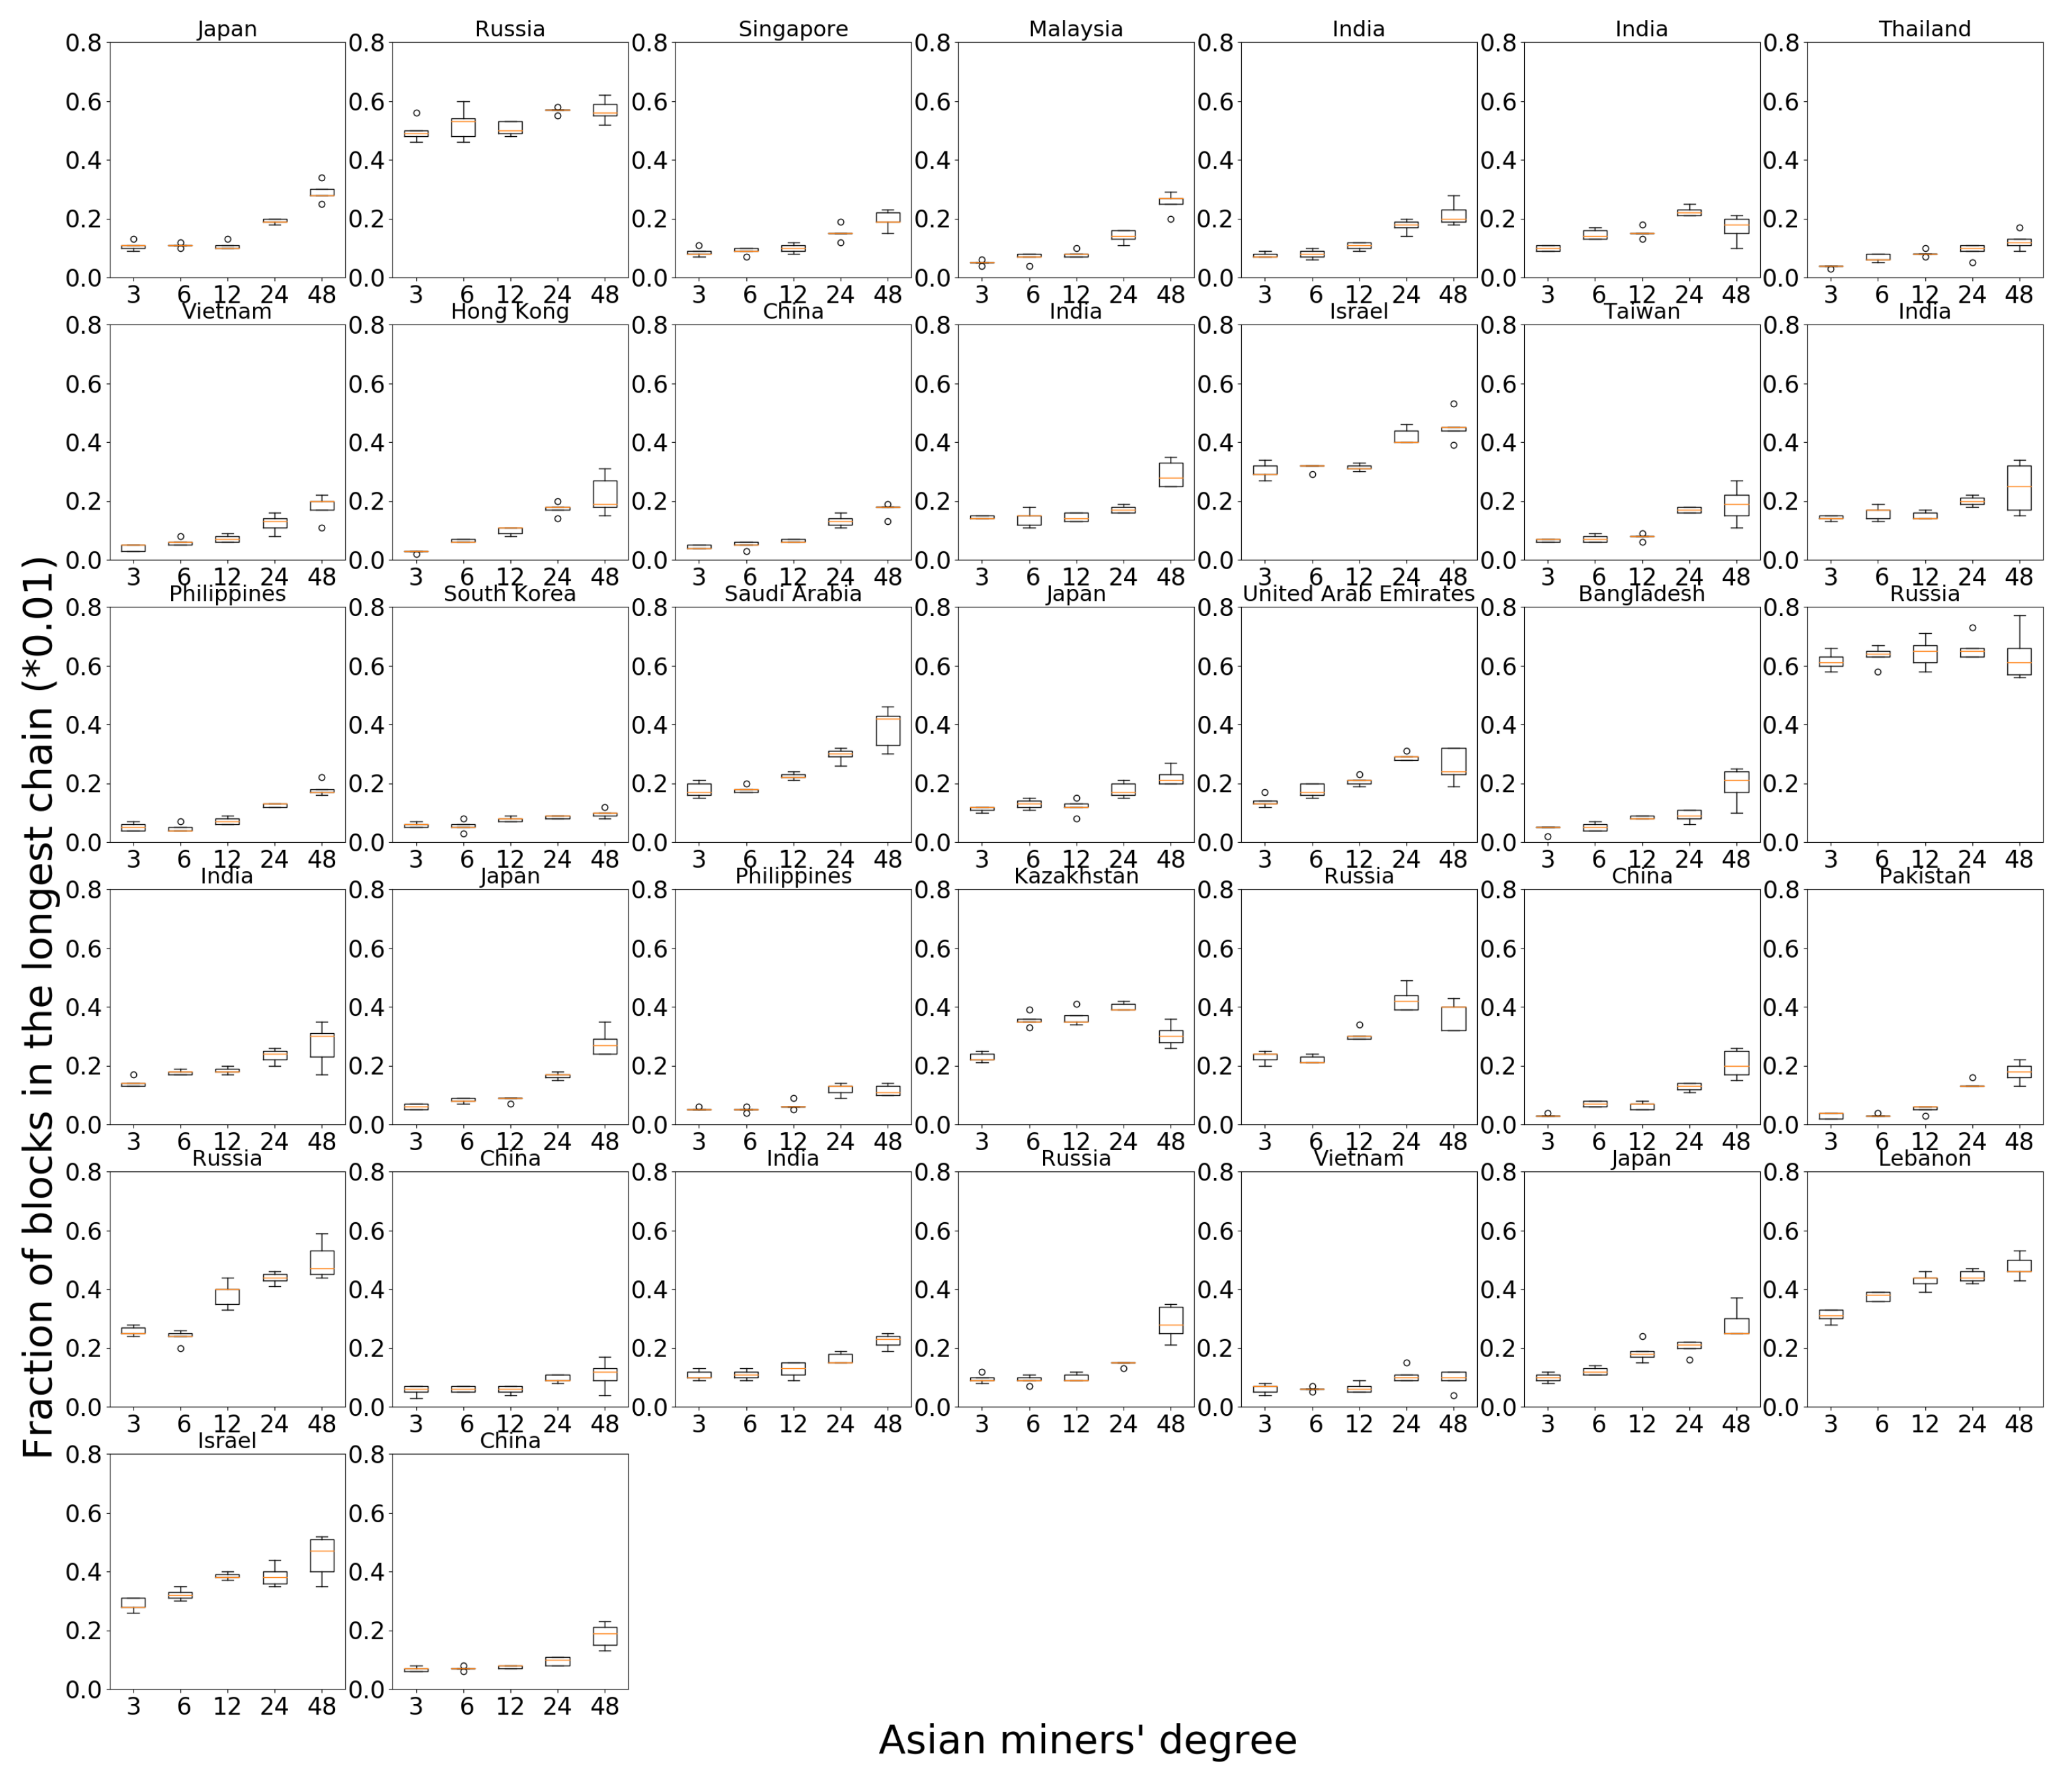
Next, we consider the policy where we take miners on continents except Europe and North America to form a single tightly connected non-dominant cluster. With the neighbors for European and North American miners unchanged, each miner on other continents chooses to connect to every other miner on the other continents. Figure 7b plots the performance for 10 randomly chosen miners from each continent. Asian and Australian miners receive significant benefits compared to the random topology. African nodes are only slightly affected, with performance rather similar to that of the random topology. South American miners exhibit two distinct trends: miners in the north of the continent (closer to North America) which perform well under a random topology see some loss, while miners in the south of the continent receive a performance increase. European and North American miners lose slightly in their reward fractions. Thus, the policy of tightly interconnecting miners in non-central locations benefits most of these miners. Miners in centrally located clusters or those close to the central cluster bear the corresponding loss. Figures for all the miners in Asia can be found in Figure 8.
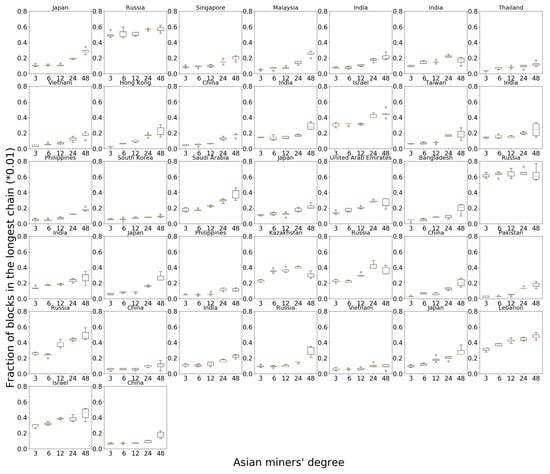
Figure 8.
Asian node performance when increasing the degree of miners in Asia.
Based on the results in Figure 5 and Figure 7, the ideal strategy for each miner varies. Centrally located miners need to limit their connections, as more neighbors hurt them. Miners in non-central regions need to expand their neighborhood size, as the more the better. There is a conflict between these ideal strategies, because when non-central miners increase their number of connections to central miners, it inadvertently also increases the number of connections from the central miners, which hurts the central miners. Therefore, central miners are incentivized to reject these extra connections. The best strategy then for the non-central miners is to connect to the miners that are willing to accept their connection requests. Ultimately, this creates a situation where non-central miners have a large number of interconnection links among themselves, while central nodes enforce a strict control of their connections.
5.2.4. Randomly Distributed Hash Power
We consider a case with non-uniform hash power where each node has various hash power. Similar to the experiments above, nodes mine new blocks based on their highest block and follow the same block forwarding protocol. Miners mine new blocks with the same exponential distribution but the mean of their mining time is based on their hash power, which is randomly picked for the miners. High hash power nodes cost time from a smaller exponential distribution and low hash power nodes take the time from a greater exponential distribution. We tune the hash power distribution so that the total network’s mining rate is close to the above experiments; the expected number of mined blocks is similar to the above experiments in the same period.
We run the experiments on some random topologies. Nodes have randomly picked hash power, and we label the top 20% of hash power nodes as the high hash power cluster in red and the bottom 20% hash power nodes as the low hash power cluster in blue. We run each topology for at least 100,000 blocks and count the valid blocks in the longest chain as their mining rewards. At each continent, we record the fractions of blocks in the longest chain mined by their high hash power nodes and low hash power nodes and plot them in boxplot in Figure 9.
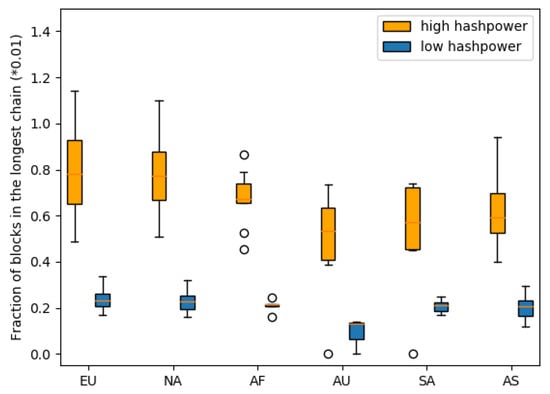
Figure 9.
Reward distributions for high hash power and low hash power in continents.
The central cluster still has the advantage that North American and European nodes have higher rewards than the nodes on the other continents. Nodes on the non-central continents receive fewer rewards, even if they have high hash power, than the low hash power nodes in the central continents. If we consider the high hash power nodes to be several low hash power nodes in the same city, then the non-uniform hash power distribution can be reckoned so as to add more nodes in the map, both on central and non-central continents.
6. Conclusions
We have considered the problem of topology design for maximizing miner rewards in wide-area PoW blockchain networks. A miner may decrease its latency to other miners by carefully choosing its neighbors on the overlay, and/or by increasing the number of neighbors. Contrary to the general understanding that achieving a lower network latency to other miners is strictly beneficial to miners, we have shown the existence of an “optimal” amount of connectivity where a miner receives the most benefit in both non-cooperative and cooperative settings. From our simulations using real-world data, we have observed a network bias among miners worldwide. Miners located in Europe and North America receive higher rewards compared to their counterparts on other continents. For miners outside of Europe and North America, having better network connections can significantly increase their benefits. However, for European and North American miners, there exists an “optimal” level where they may employ strategies to limit connections with miners from other regions to maintain their advantages. Our strategy works for a non-uniform hash power network, where the quantity of hash power and geographical location play pivotal roles in determining the existence of an “optimal” connectivity level that guides miners’ connection strategies.
Designing fully decentralized algorithms that can achieve this optimal clustering is an interesting direction for future work. Miners can assess their state in the current network and adapt their neighbor connection strategy accordingly. Amid network changes, miners can also engage in online learning, allowing for real-time adjustments to their network connections. Generalizing our analysis to arbitrary network topologies is another interesting direction. Our result exposes an inherent weakness in PoW blockchains, where miners can always organize themselves in order to selfishly benefit by denying the fair share of rewards to miners of the non-dominant cluster. Beyond network-level strategies, it would be useful to propose protocol changes (e.g., at the consensus layer) that incentivize miners to obtain their fair share of rewards.
Author Contributions
Conceptualization, Y.M.; Methodology, Y.M. and S.B.V.; Software, Y.M.; Validation, Y.M.; Formal analysis, Y.M. and S.B.V.; Investigation, Y.M.; Resources, S.B.V.; Data curation, Y.M.; Writing—original draft, Y.M.; Writing—review & editing, S.B.V.; Visualization, Y.M.; Supervision, S.B.V.; Project administration, Y.M. and S.B.V. All authors have read and agreed to the published version of the manuscript.
Funding
This research received no external funding.
Data Availability Statement
https://github.com/yifanmao360/Less-is-More, (accessed on 19 November 2023).
Conflicts of Interest
The authors declare no conflict of interest.
References
- Abou Jaoude, J.; Saade, R.G. Blockchain applications—Usage in different domains. IEEE Access 2019, 7, 45360–45381. [Google Scholar] [CrossRef]
- Nakamoto, S. A Peer-to-Peer Electronic Cash System. 2008. Available online: http://bitcoin.org/bitcoin (accessed on 19 November 2023).
- Gilad, Y.; Hemo, R.; Micali, S.; Vlachos, G.; Zeldovich, N. Algorand: Scaling Byzantine Agreements for Cryptocurrencies. In Proceedings of the 26th Symposium on Operating Systems Principle, Shanghai, China, 28–31 October 2017; pp. 51–68. [Google Scholar]
- Bagaria, V.; Kannan, S.; Tse, D.; Fanti, G.; Viswanath, P. Prism: Deconstructing the blockchain to approach physical limits. In Proceedings of the 2019 ACM SIGSAC Conference on Computer and Communications Security, London, UK, 11–15 November 2019; pp. 585–602. [Google Scholar]
- Ethereum. Available online: https://ethereum.org/en/ (accessed on 19 November 2023).
- Dogecoin. Available online: https://dogecoin.com/ (accessed on 19 November 2023).
- Mukhopadhyay, U.; Skjellum, A.; Hambolu, O.; Oakley, J.; Yu, L.; Brooks, R. A brief survey of cryptocurrency systems. In Proceedings of the 2016 14th Annual Conference On Privacy, Security and Trust (PST), Auckland, New Zealand, 12–14 December 2016; IEEE: Piscataway, NJ, USA, 2016; pp. 745–752. [Google Scholar]
- Kroll, J.A.; Davey, I.C.; Felten, E.W. The economics of Bitcoin mining, or Bitcoin in the presence of adversaries. In Proceedings of the 12th Workshop on the Economics of Information Security, Washington, DC, USA, 11–12 June 2013; Volume 2013, p. 11. [Google Scholar]
- Thum, M. The economic cost of bitcoin mining. In Proceedings of the CESifo Forum; ifo Institut-Leibniz-Institut für Wirtschaftsforschung an der Universitat: München, Germany, 2018; Volume 19, pp. 43–45. [Google Scholar]
- Rosenfeld, M. Analysis of hashrate-based double spending. arXiv 2014, arXiv:1402.2009. [Google Scholar]
- Wan, L.; Eyers, D.; Zhang, H. Evaluating the impact of network latency on the safety of blockchain transactions. In Proceedings of the 2019 IEEE International Conference on Blockchain (Blockchain), Atlanta, GA, USA, 14–17 July 2019; IEEE: Piscataway, NJ, USA, 2019; pp. 194–201. [Google Scholar]
- Decker, C.; Wattenhofer, R. Information propagation in the bitcoin network. In Proceedings of the IEEE P2P 2013 Proceedings, Trento, Italy, 9–11 September 2013; pp. 1–10. [Google Scholar]
- Gencer, A.E.; Basu, S.; Eyal, I.; Van Renesse, R.; Sirer, E.G. Decentralization in bitcoin and ethereum networks. In Proceedings of the International Conference on Financial Cryptography and Data Security; Springer: Berlin/Heidelberg, Germany, 2018; pp. 439–457. [Google Scholar]
- Mao, Y.; Deb, S.; Venkatakrishnan, S.B.; Kannan, S.; Srinivasan, K. Perigee: Efficient peer-to-peer network design for blockchains. In Proceedings of the 39th Symposium on Principles of Distributed Computing, Virtual, Italy, 3–7 August 2020; pp. 428–437. [Google Scholar]
- Rohrer, E.; Tschorsch, F. Kadcast: A Structured Approach to Broadcast in Blockchain Networks. In Proceedings of the 1st ACM Conference on Advances in Financial Technologies, Zurich, Switzerland, 21–23 October 2019; pp. 199–213. [Google Scholar]
- Park, S.; Im, S.; Seol, Y.; Paek, J. Nodes in the bitcoin network: Comparative measurement study and survey. IEEE Access 2019, 7, 57009–57022. [Google Scholar] [CrossRef]
- Zhang, Y.; Venkatakrishnan, S.B. Kadabra: Adapting Kademlia for the Decentralized Web. arXiv 2022, arXiv:2210.12858. [Google Scholar]
- Falcon. 2020. Available online: https://www.falcon-net.org/ (accessed on 19 November 2023).
- Klarman, U.; Basu, S.; Kuzmanovic, A.; Sirer, E.G. bloxroute: A scalable trustless blockchain distribution network whitepaper. IEEE Internet Things J. 2018, 8–14. [Google Scholar] [CrossRef]
- FIBRE. 2020. Available online: https://bitcoinfibre.org/ (accessed on 19 November 2023).
- Ozisik, A.P.; Andresen, G.; Bissias, G.; Houmansadr, A.; Levine, B. Graphene: A new protocol for block propagation using set reconciliation. In Data Privacy Management, Cryptocurrencies and Blockchain Technology; Springer: Berlin/Heidelberg, Germany, 2017; pp. 420–428. [Google Scholar]
- Chawla, N.; Behrens, H.W.; Tapp, D.; Boscovic, D.; Candan, K.S. Velocity: Scalability improvements in block propagation through rateless erasure coding. In Proceedings of the 2019 IEEE International Conference on Blockchain and Cryptocurrency (ICBC), Seoul, Republic of Korea, 14–17 May 2019; pp. 447–454. [Google Scholar]
- Croman, K.; Decker, C.; Eyal, I.; Gencer, A.E.; Juels, A.; Kosba, A.; Miller, A.; Saxena, P.; Shi, E.; Sirer, E.G.; et al. On scaling decentralized blockchains. In Proceedings of the International Conference on Financial Cryptography and Data Security; Springer: Berlin/Heidelberg, Germany, 2016; pp. 106–125. [Google Scholar]
- Etherscan: Forked Blocks. Available online: https://etherscan.io/blocks_forked (accessed on 19 November 2023).
- Etherscan: Top 25 Miners by Blocks. Available online: https://etherscan.io/stat/miner?range=14&blocktype=blocks (accessed on 19 November 2023).
- How to Build an Ethereum Mining Pool. Available online: https://medium.com/dragonfly-research/how-to-build-an-ethereum-mining-pool-6be356520b7a (accessed on 19 November 2023).
- The Secret Weapon F2Pool Used to Tackle Its Uncle Rate. Available online: https://medium.com/bloxroute/the-secret-weapon-f2pool-used-to-tackle-its-uncle-rate-1ecb6fe47ef8 (accessed on 19 November 2023).
- A Look at Eth’s Uncle Rate. Available online: https://medium.com/bloxroute/a-look-at-eths-uncle-rate-7eb9013a572e (accessed on 19 November 2023).
- BloXroute. Available online: https://bloxroute.com/ (accessed on 19 November 2023).
- Wang, T.; Zhao, C.; Yang, Q.; Zhang, S.; Liew, S.C. Ethna: Analyzing the Underlying Peer-to-Peer Network of Ethereum Blockchain. IEEE Trans. Netw. Sci. Eng. 2021, 8, 2131–2146. [Google Scholar] [CrossRef]
- Shahsavari, Y.; Zhang, K.; Talhi, C. A theoretical model for fork analysis in the bitcoin network. In Proceedings of the 2019 IEEE International Conference on Blockchain (Blockchain), Atlanta, GA, USA, 14–17 July 2019; pp. 237–244. [Google Scholar]
- Xiao, Y.; Zhang, N.; Lou, W.; Hou, Y.T. Modeling the impact of network connectivity on consensus security of proof-of-work blockchain. In Proceedings of the IEEE INFOCOM 2020—IEEE Conference on Computer Communications, Toronto, ON, Canada, 6–9 July 2020; pp. 1648–1657. [Google Scholar]
- Cao, T.; Decouchant, J.; Yu, J.; Esteves-Verissimo, P. Characterizing the Impact of Network Delay on Bitcoin Mining. In Proceedings of the 40th IEEE International Symposium on Reliable Distributed Systems (SRDS), Chicago, IL, USA, 20–23 September 2021; pp. 109–119. [Google Scholar]
- Putri, B.D.C.; Sari, R.F. The effect of latency on selfish-miner attack on block receive time bitcoin network using NS3. In Proceedings of the 12th IEEE International Conference on Telecommunication Systems, Services, and Applications (TSSA), Yogyakarta, Indonesia, 4–5 October 2018; pp. 1–5. [Google Scholar]
- Eyal, I.; Sirer, E.G. Majority is not enough: Bitcoin mining is vulnerable. In Proceedings of the International Conference on Financial Cryptography and Data Security; Springer: Berlin/Heidelberg, Germany, 2014; pp. 436–454. [Google Scholar]
- OMNeT++ Discrete Event Simulator. Available online: https://omnetpp.org/ (accessed on 19 November 2023).
- Bitnodes Network. 2020. Available online: https://bitnodes.earn.com/ (accessed on 19 November 2023).
- Dong, G.; Tang, M.; Wang, Z.; Gao, J.; Guo, S.; Cai, L.; Gutierrez, R.; Campbel, B.; Barnes, L.; Boukhechba, M. Graph neural networks in IoT: A survey. ACM Trans. Sens. Netw. 2023, 19, 1–50. [Google Scholar] [CrossRef]
- Dong, G.; Cai, L.; Datta, D.; Kumar, S.; Barnes, L.; Boukhechba, M. Influenza-like symptom recognition using mobile sensing and graph neural networks. Proc. Conf. Health Inference Learn. 2021, 291–300. [Google Scholar] [CrossRef]
- Dong, G.; Tang, M.; Cai, L.; Barnes, L.; Boukhechba, M. Semi-supervised graph instance transformer for mental health inference. In Proceedings of the 2021 20th IEEE International Conference on Machine Learning and Applications (ICMLA), Pasadena, CA, USA, 13–16 December 2021; pp. 1221–1229. [Google Scholar]
- Xue, B.; Mao, Y.; Venkatakrishnan, S.B.; Kannan, S. Goldfish: Peer selection using Matrix completion in unstructured P2P network. arXiv 2023, arXiv:2303.09761. [Google Scholar]
- Vedula, A.; Gupta, A.; Venkatakrishnan, S.B. Cobalt: Optimizing Mining Rewards in Proof-of-Work Network Games. In Proceedings of the 2023 IEEE International Conference on Blockchain and Cryptocurrency (ICBC), Dubai, United Arab Emirates, 1–5 May 2023; pp. 1–9. [Google Scholar]
- Wei, J.; Bojja Venkatakrishnan, S. DecVi: Adaptive Video Conferencing on Open Peer-to-Peer Networks. In Proceedings of the 24th International Conference on Distributed Computing and Networking, Kharagpur, India, 4–7 January 2023; pp. 336–341. [Google Scholar]
- BIP-152. 2016. Available online: https://reference.cash/protocol/forks/bip-0152/ (accessed on 19 November 2023).
- Nagayama, R.; Banno, R.; Shudo, K. Identifying impacts of protocol and internet development on the bitcoin network. In Proceedings of the 2020 IEEE Symposium on Computers and Communications (ISCC), Rennes, France, 7–10 July 2020; pp. 1–6. [Google Scholar]
- Bag, S.; Ruj, S.; Sakurai, K. Bitcoin block withholding attack: Analysis and mitigation. IEEE Trans. Inf. Forensics Secur. 2016, 12, 1967–1978. [Google Scholar] [CrossRef]
- Sapirshtein, A.; Sompolinsky, Y.; Zohar, A. Optimal selfish mining strategies in bitcoin. In Proceedings of the International Conference on Financial Cryptography and Data Security; Springer: Berlin/Heidelberg, Germany, 2016; pp. 515–532. [Google Scholar]
- Zhang, M.; Zhang, X.; Zhang, Y.; Lin, Z. {TXSPECTOR}: Uncovering attacks in ethereum from transactions. In Proceedings of the 29th USENIX Security Symposium (USENIX Security 20), Virtual Event, 12–14 August 2020; USENIX Association: Berkeley, CA, USA, 2020; pp. 2775–2792. [Google Scholar]
- Neudecker, T.; Hartenstein, H. Short paper: An empirical analysis of blockchain forks in bitcoin. In Proceedings of the International Conference on Financial Cryptography and Data Security; Springer: Berlin/Heidelberg, Germany, 2019; pp. 84–92. [Google Scholar]
- Lewenberg, Y.; Bachrach, Y.; Sompolinsky, Y.; Zohar, A.; Rosenschein, J.S. Bitcoin mining pools: A cooperative game theoretic analysis. In Proceedings of the 2015 International Conference on Autonomous Agents and Multiagent Systems, Istanbul Turkey, 4–8 May 2015; pp. 919–927. [Google Scholar]
- Dogechain Whitepaper. Available online: https://dogechain.dog/DogechainWP.pdf (accessed on 19 November 2023).
- Lite Coin Whitepaper. Available online: https://whitepaper.io/document/683/litecoin-whitepaper (accessed on 19 November 2023).
- Zero to Monero: First Edition. Available online: https://www.getmonero.org/library/Zero-to-Monero-1-0-0.pdf (accessed on 19 November 2023).
- Varga, A.; Hornig, R. An overview of the OMNeT++ simulation environment. In Proceedings of the 1st iNternational Conference on Simulation Tools and Techniques for Communications, Networks and Systems & Workshops, Marseille, France, 3–7 March 2008; pp. 1–10. [Google Scholar]
- Bitnodes Network Snapshot. Available online: https://bitnodes.earn.com/nodes/ (accessed on 19 November 2023).
- Global Ping Statistics. Available online: https://wondernetwork.com/pings (accessed on 19 November 2023).
- Gervais, A.; Ritzdorf, H.; Karame, G.O.; Capkun, S. Tampering with the delivery of blocks and transactions in bitcoin. In Proceedings of the 22nd ACM SIGSAC Conference on Computer and Communications Security, Denver, CO, USA, 12–16 October 2015; pp. 692–705. [Google Scholar]


Disclaimer/Publisher’s Note: The statements, opinions and data contained in all publications are solely those of the individual author(s) and contributor(s) and not of MDPI and/or the editor(s). MDPI and/or the editor(s) disclaim responsibility for any injury to people or property resulting from any ideas, methods, instructions or products referred to in the content. |
© 2023 by the authors. Licensee MDPI, Basel, Switzerland. This article is an open access article distributed under the terms and conditions of the Creative Commons Attribution (CC BY) license (https://creativecommons.org/licenses/by/4.0/).