Article

Predicting Pump Inspection Cycles for Oil Wells Based on Stacking Ensemble Models

1
School of Mathematics and Statistics, Northeast Petroleum University, Daqing 163318, China
2
Department of Mathematical Sciences, University of South Dakota, Vermillion, SD 57069, USA
3
Department of Statistics, Tamkang University, Tamsui District, New Taipei City 251301, Taiwan
*
Authors to whom correspondence should be addressed.
Mathematics 2024, 12(14), 2231; https://doi.org/10.3390/math12142231
Submission received: 27 June 2024 / Revised: 14 July 2024 / Accepted: 16 July 2024 / Published: 17 July 2024
(This article belongs to the Special Issue Statistical Simulation and Computation: 3rd Edition)

Abstract

:
Beam pumping is currently the broadly used method for oil extraction worldwide. A pumpjack shutdown can be incurred by failures from the load, corrosion, work intensity, and downhole working environment. In this study, the duration of uninterrupted pumpjack operation is defined as the pump inspection cycle. Accurate prediction of the pump inspection cycle can extend the lifespan, reduce unexpected pump accidents, and significantly enhance the production efficiency of the pumpjack. To enhance the prediction performance, this study proposes an improved two-layer stacking ensemble model, which combines the power of the random forests, light gradient boosting machine, support vector regression, and Adaptive Boosting approaches, for predicting the pump inspection cycle. A big pump-related oilfield data set is used to demonstrate the proposed two-layer stacking ensemble model can significantly enhance the prediction quality of the pump inspection cycle.

1. Introduction

Sucker rod jacks are currently one of the most extensively used types of equipment for oil extraction worldwide. In China, about 90% of beam-pumping oil wells use pumpjacks for oil production. During the pumpjack operation, subjective factors, including the load, corrosion, and work intensity, and objective factors, including downhole working conditions and equipment aging, contribute to failures. These failures necessitate equipment shutdowns for inspection and maintenance. The duration of uninterrupted pumpjack operation is defined as the pump inspection cycle. Salvage operations and the replacement of downhole equipment for sudden severe faults not only impact crude oil production but also increase the operational cost and potentially harm personnel. Therefore, the pump inspection cycle can be a critical criterion for effectively assessing oilfield management.
Accurately predicting the pump inspection cycle can enhance production efficiency, extend equipment lifespan, provide safety assurance, and improve production quality. Acquiring the pump inspection cycle ensures timely detection and resolution of issues during normal operation, which stabilizes pump performance and improves production efficiency. First, regular pump inspection and maintenance allow timely identification and resolution of pump-related problems; hence, they can reduce the cost of replacements and repairs due to failures. Next, the pump inspection cycle ensures safe pump operation, minimizes leaks and unexpected incidents, and enhances safety during production. Last, normal pump operation guarantees that the produced oil and gas meet quality standards. In summary, precise prediction of the oilfield pump inspection cycle contributes to safer and more efficient oilfield production, which leads to benefits for both productivity and economic outcomes.

1.1. Literature Review

The downhole portion of a sucker rod pumping system is composed of the sucker rod string, tubing, and pump. Sucker rods, as engineering components subjected to random, alternating loads, inevitably develop various defects, such as cracks, scratches, and corrosion pits during manufacturing, transportation, and usage. The gradual fatigue crack propagation resulting from the surface defects under alternating loads is the primary cause of sucker rod failure during normal service; see Bian et al. [1]. Ulmanu and Ghofrani [2] established predictive models for calculating the lifetime of sucker rods based on fatigue crack propagation theory. Some existing studies used fracture mechanics theories to predict the remaining life of sucker rods. For instance, Zhao et al. [3] employed Monte Carlo simulation to assess the safety reliability of sucker rods and conduct lifetime analysis in conjunction with safety levels. These methods can offer high predictive accuracy and provide valuable guidance for on-site technical personnel in managing rod wear and safety analysis.
The aforementioned fatigue damage mechanics-based methods can have limited accuracy and reliability of predictions for sucker rod pump lifetimes. Machine learning models have improved accuracy in recent years; see Dolby et al. [4]. Hou et al. [5] extracted fault features from a sucker rod pump using the gray matrix–extreme learning machine (GM-ELM) method for fault diagnosis to enhance diagnostic accuracy. Deng et al. [6] used gray correlation analysis to select key influencing parameters and built a relationship model between primary production parameters and pump inspection cycles for sucker rod pumps. The parallel prediction performance comparison for the models of support vector regression (SVR), multiple linear regression, and backpropagation neural networks (BNNs) indicated the SVR model performed best with the highest accuracy of 90.76%. Zhang et al. [7] also leveraged an SVR model to extract static features from oilfield data and employed a convolutional neural network (CNN) to learn dynamic features. By introducing multimodal compressed bilinear pooling to fuse static and dynamic features, they trained a combination of Gaussian mixture model (GMM), gradient boosting decision tree (GBDT), logistic regression, and extreme gradient boosting (XGBoost) models to accurately predict pump inspection cycles. Zhang et al. [7] concluded that the XGBoost model achieved the highest accuracy, reaching 89% among all competitors.
For machine learning methods, the random forests (RF), XGBoost, light gradient boosting machine (LightGBM), Adaptive Boosting approaches (AdaBoost), and SVR are competitive for their performance in both classification and regression tasks. RF is a powerful ensemble learning decision-tree-based method. RF can combine multiple decision trees to make decisions using bagging or bootstrap aggregating algorithms. Training trees can be performed parallelly in RF. Moreover, RF can handle missing data efficiently; see [8,9,10,11,12,13]. XGBoost is another ensemble method. XGBoost uses gradient boosting algorithms to ensemble weak learners sequentially and improve their errors. XGBoost can model complex and nonlinear relationships between features and the response variable. XGBoost can be trained in parallel. Recent studies about using XGBoost can be found in [14,15,16,17,18].
LightGBM, a gradient-boosting framework developed by Microsoft, is a shining example of practicality. Its advantages include faster training speed, lower memory usage, and better accuracy in various scenarios. These benefits make it a valuable tool in the field of machine learning. Applications using LightGBM can be found in [13,19,20,21,22]. AdaBoost is a widely used ensemble learning algorithm. It can be used for both classification and regression tasks. The base learner in AdaBoost is usually a decision tree with only one level, and these are levels used as building blocks for the resulting strong classifier. To implement the AdaBoost algorithm, we weighted errors and used an iterative process to improve the performance sequentially; see [23,24,25,26] for comprehensive applications. SVR is a regression algorithm based on support vector machines; SVR aims to find a hyperplane that can achieve the best fit for data to minimize the margin violations. SVR allows for fine-truing through kernel functions and is particularly useful for processing nonlinear relationships between the response variable with features. Recent studies on using SVR can be found in [27,28,29,30,31].

1.2. Motivation and Organization

The dynamic geological conditions of oilfields significantly impact the working status of oil wells due to erosion caused by subsurface fluid flow, and these changing geological conditions could lead to pump failures. To maintain oilfield production, various parameters, such as water content, pump depth, maximum and minimum loads, oil pressure, casing pressure, stroke, and sucker rod length, are related to the pump’s fatigue and the equipment’s wear and corrosion. Qualitative analysis and statistical models have been used to predict the pump inspection cycles. Improving the quality of qualitative analysis and statistical methods on this topic remains challenging.
Some recent studies have used machine learning models to predict pump inspection cycles. However, these existing studies typically rely on a single machine learning model, and the predictive performance can be optimized further. To overcome this challenge, we use the machine learning methods of decision tree, boosting, and SVR, then combine the machine learning methods with the engineering expertise to select important features. Finally, four machine learning models, including the RF, LightGBM, SVR, and Adaptive Boosting approaches (AdaBoost) methods, are combined for the two-layer stacking ensemble model. Moreover, the parameters of the ensemble model are optimally turned using grid search. The two-layer stacking ensemble model is built to enhance predictive performance with the ridge regression model as the metalearner. This transformation enables quantitative and specific pump inspection cycle predictions, guiding individual good design, extending lifespan, and promoting energy efficiency.
The remaining sections of this study are organized as follows: Section 2 briefly reviews the research methodologies. The proposed two-layer improved stacking ensemble model is introduced in Section 3, and the associated experimental design is provided in Section 4. Section 5 addresses a real-world application, and Section 6 provides some concluding remarks.

2. Machine Learning Methods

In this study, four machine learning models, including RF, LightGBM, SVR, and AdaBoost, are used to construct the proposed two-layer improved stacking ensemble mode. The four machine learning methods are briefly introduced as follows. RF is one stream of the decision tree method; see [32,33]. RF exhibits strong resistance to overfitting and is a suitable machine learning method for modeling high-dimensional data. Multiple decision trees are established to implement the RF method with continuous responses. Then, their predictions are aggregated for regression tasks. Each decision tree in the RF is independently trained based on randomly selected subsamples. The final regression result is obtained by a weighted average of the predictions from multiple trees.
LightGBM maintains effective parallel training, lesser training speed, lower memory consumption, and improved precision; more information can be seen from [34] as well as [35]. A LightGBM employs three computation methods: histogram-based, histogram difference acceleration, and depth-limited leaf-wise growth. The leaf-wise growth strategy with an added maximum depth constraint is adopted to balance the efficiency and prevent overfitting of the final modeling.
The core idea of SVR is to minimize the distance of the farthest sample points from the hyperplane; see [36,37]. SVR is an extension of the support vector machine (SVM) method from classification to regression analysis. SVR follows the concepts of hyperplane and margin of the SVM but uses different definitions. The margin in SVR is defined as an error tolerance called ϵ -insensitive tube. Errors are detected as the deviation of data observations from the hyperplane in the tube without being counted. The hyperplane in the ϵ -insensitive tube can be the best fit possible to the data.
AdaBoost iteratively adds weak classifiers until achieving a sufficiently low error rate or reaching a predefined maximum iteration count; see [38,39]. To implement the AdaBoost algorithm, we can first assign equal weights to all observations in the training sample. Then, some algorithms are repeated to train a weak classifier for the training sample a certain number of times, or the stopping criterion is reached. During the repetitions, the weights are updated. Finally, using a weighted majority vote to combine the predictions from all weak classifiers for making the final prediction.

3. The Two-Layer Improved Stacking Ensemble Model

3.1. The Ensemble Model

We can surpass the performance limits of individual models and elevate overall prediction results using leveraging model ensemble techniques. Ensemble results can represent the best achievable outcome in machine learning. However, implementing ensemble models is challenging. Most ensemble methods assume strong independence between models. This assumption is often not fully reasonable in practical applications. Consequently, the performance of ensemble methods remains uncertain.
Weighted averaging can assign different weights during the averaging process to enhance the overall performance of the final ensemble result; see [40].

3.2. The Stacking Model

The idea behind stacking is to effectively combine multiple weak learners into a stronger one; see [41,42]. This process involves training a model to perform a combination.
Stacking is an ensemble machine learning algorithm to combine the predictions from multiple based models to create a more powerful metamodel. The first step to implementing a stacking model is to train several machine learning models, named base models, using the same data set. Each based model makes predictions on the training data. The second step is to train a metalearner that learns the best combinations of the predictions from the base models. The third step is to make a prediction. The base models generate their predictions on new data. These predictions are then fed into the metalearner, which combines them to produce the final ensemble prediction.
Stacking is an ensemble machine learning algorithm with the following advantage: stacking integrates the capabilities of a wide range of well-performing models by combining their predictions to achieve a better performance than any single model in the ensemble. In this study, the RF and XGBoost algorithms with engineering experience are used for feature selection to screen out the most important features for modeling. The base models are selected through a validation study to identify the RF, LightGBM, SVR, and AdaBoost models as the base models. The optimization process for the base learners involves fivefold cross-training on the four models. Then, the ridge regression is trained as the metalearner on the new features and labels generated from the validation set to result in the final well-trained pump inspection cycle prediction model. The proposed method can be tailored to various topics by selecting appropriate base models and the metalearner. The strength of the proposed two-layer stacking ensemble model is studied with an oilfield data set in Section 5.

4. Design of the Experiment

4.1. Data Set Establishment and Data Preprocessing

The example for this study originates from the pump inspection database of an oilfield block in Daqing, Heilongjiang, China, during 2019–2022. The purpose is to predict the time interval between two pump inspection cycles (the response variable) in days. This data set comprises 35,443 pump inspection cycle records combining eighteen features:
  • Production days: The days that a pumpjack work properly, denoted by d.
  • Water cut: The percentage (%) of water in the oil produced from the pumping well.
  • Pump depth: The depth in meters (m) from the wellhead to the pump.
  • Permeability: The ability in millidarcy (mD) of a rock to allow fluid to pass through under a certain pressure difference.
  • Maximum load: The pumping unit has a maximum load in kilonewton (kN) at the overhang on the upstroke.
  • Minimum load: The minimum load in kilonewton (kN) on the suspension point of the pumping unit during the downstroke.
  • Maximum well deviation angle: The maximum angle in degree (°) between the tangent at the measurement point on the axis of the oil well and the vertical line.
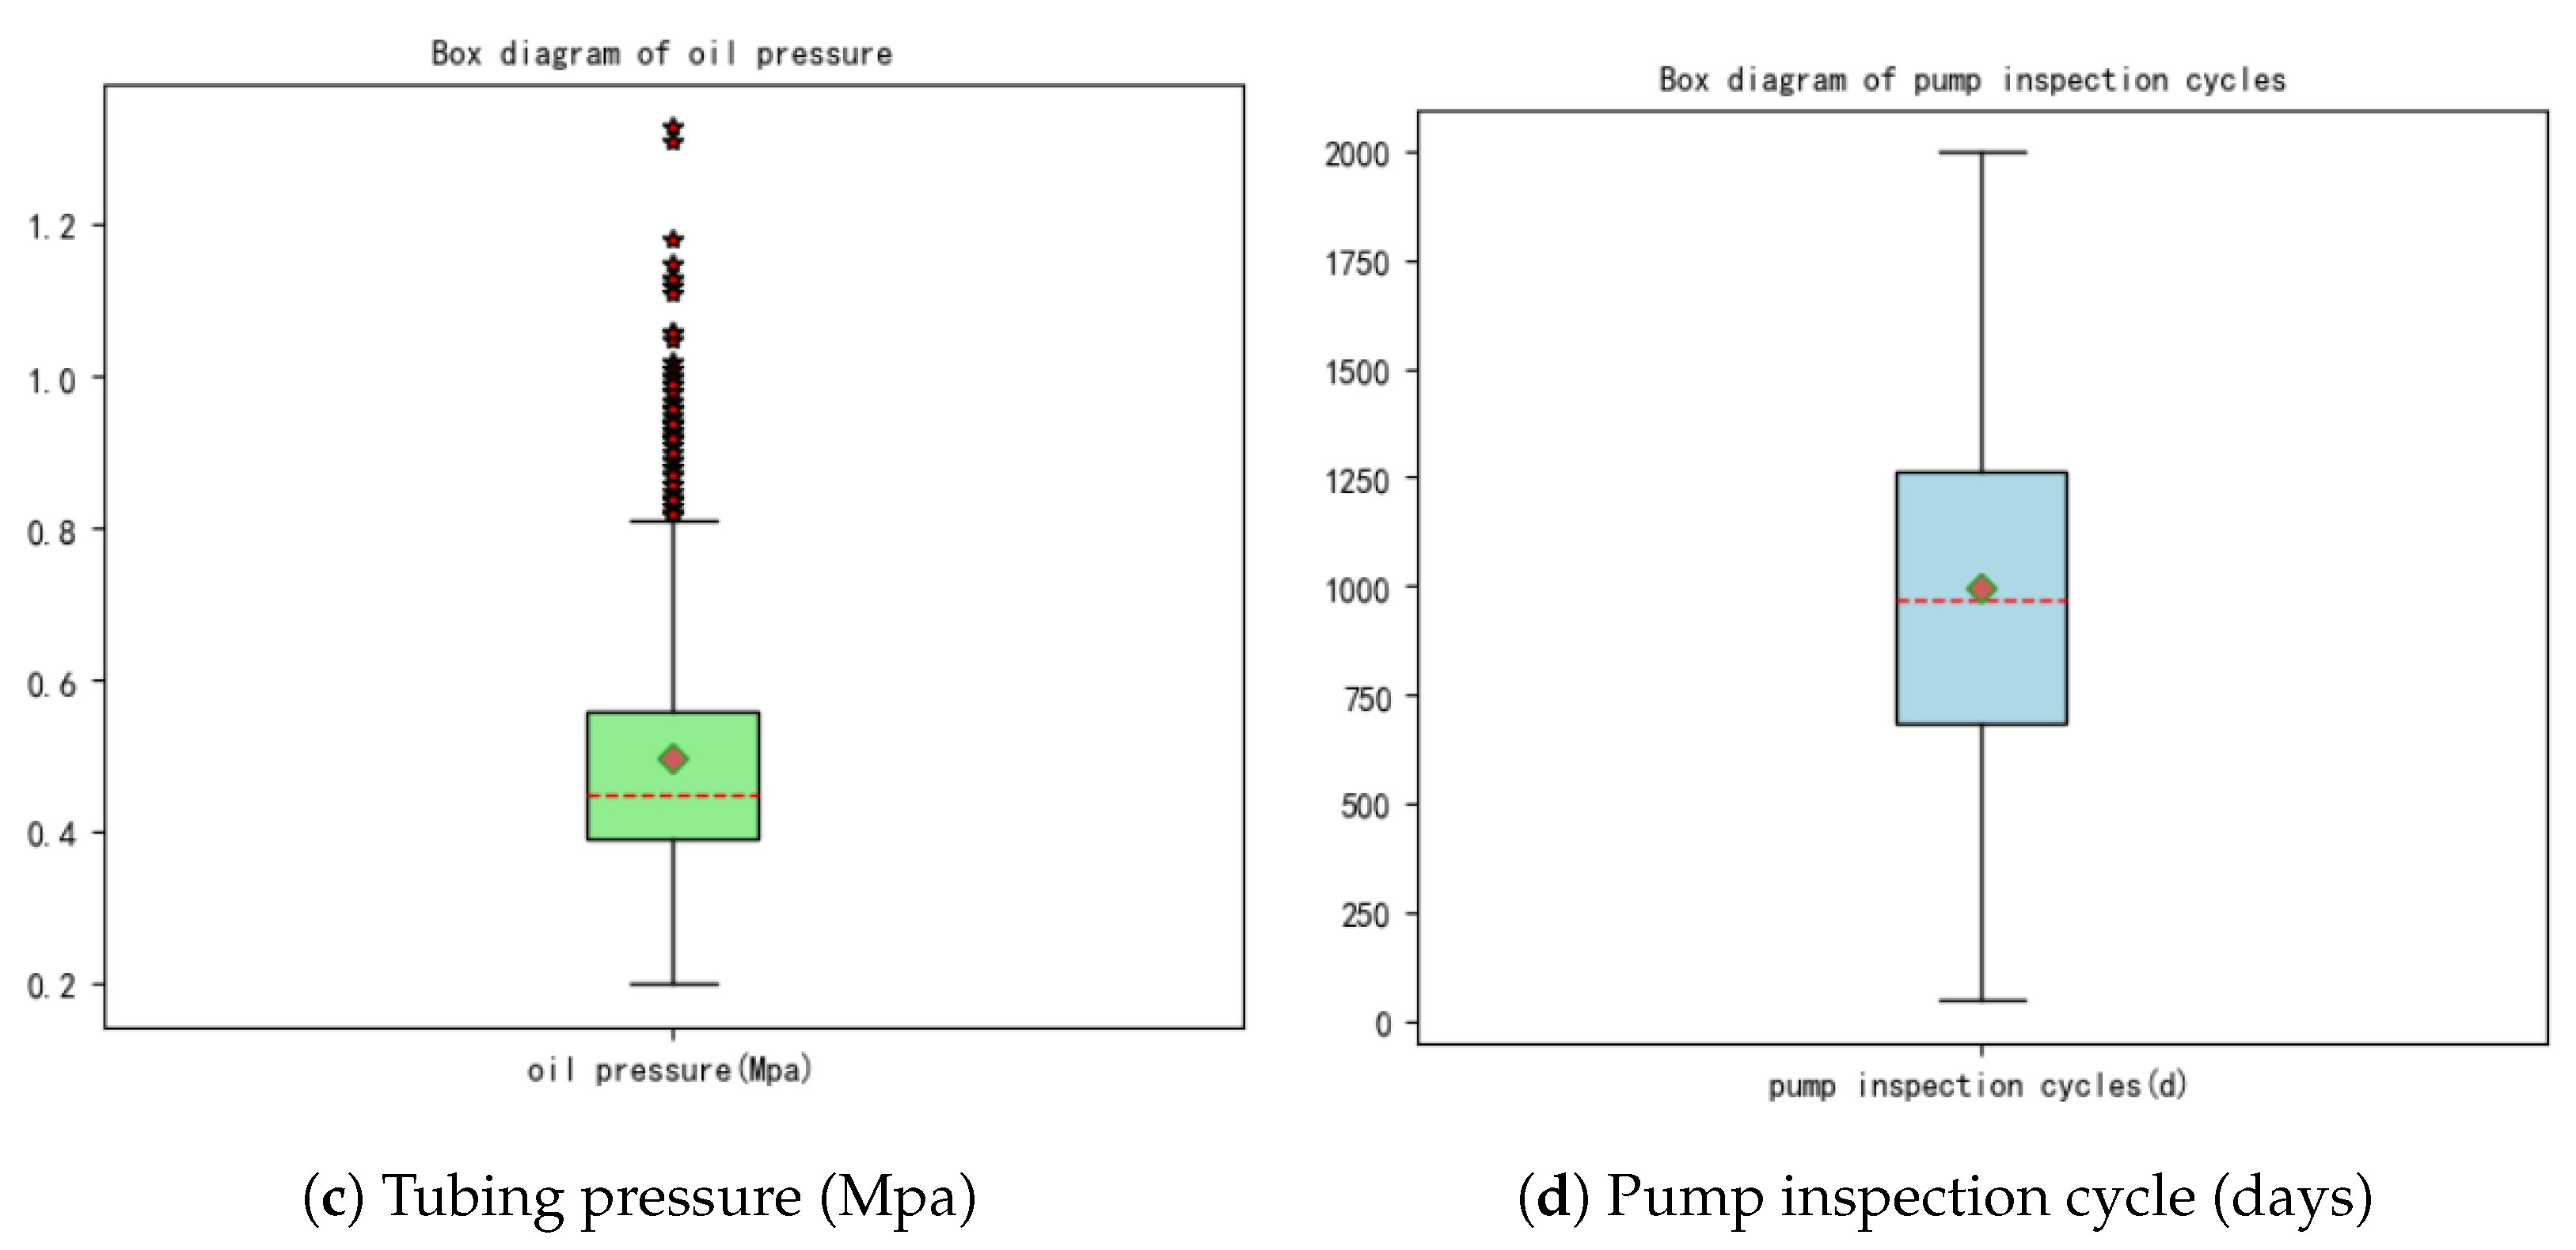
  • Oil pressure: The residual pressure megapascal (MPa) of the oil flow from the bottom of the well to the wellhead.
  • Casing pressure: The residual pressure in MPa that lifts the oil and gas from the we; bottom through the annular space between the tubing and casing to the wellhead.
  • Stroke: The distance in m the piston travels in one up-and-down motion.
  • Stroke count: The number of times the pumping rod reciprocates up and down per minute, denoted by min 1 .
  • Daily oil production: Mean oil production in tons (t).
  • Oil concentration: The polymer concentration in the produced oil (%).
  • Oil viscosity: The polymer viscosity in milligrams per liter ( mg / L ) in the produced oil.
  • Static pressure: The pressure in MPa exerted on an object surface due to the fluid’s weight and the intermolecular forces among the fluid molecules, when the fluid is at rest or in uniform linear motion.
  • Sucker rod length: The total cumulative length in m of all the sucker rods in the oil well.
  • Flow pressure: The pressure in MPa measured in the middle of the oil and gas when the well is normally producing.
  • Tubing length: The total cumulative length in m of all the tubes in the oil well.
Due to the huge number of wells, human recording errors have led to missing, duplication, production tracking, or operation data errors for pump wells. Data preprocessing is needed to address these human recording errors. Additionally, data from oilfield production may contain missing values, which could reduce the accuracy of predictive models. In this study, only nonmissing records are kept in the final data set for modeling.
Field inspections and multiple confirmations with the oilfield revealed issues, such as sensor malfunctions and manual input errors, resulting in data anomalies due to the numerous oil wells and production parameters. We employ box plots to filter out outliers to address data anomalies. The key advantage of the box plot method is its ability to accurately and stably describe the data distribution and identify all possible outliers; see [40]. By removing rows containing extreme values, we ensure that the data used for model training do not include any outliers.
The final step of data preprocessing is scaling to eliminate the influence of different scales among features and enhance comparability. Normalization restricts the processed data to a certain range, making it suitable for comprehensive comparative evaluation. Furthermore, scaling can accelerate gradient descent optimization for optimization in modeling and improving convergence speed.
After data preprocessing, the final data set of pump inspection cycle records is used for modeling. We discuss the data preprocessing in detail in Section 5.

4.2. Feature Selection and Grid Search Method

Feature selection is crucial in machine learning to reduce possible overfitting. Principal component analysis, full search, greedy forward selection, step-wise forward selection, and simplified greedy forward selection methods are broadly used methods for feature selection. Filter, embedded, and wrapper methods are three typical feature selection operations; see [42]. The embedded method described by [43] aims to find the smallest feature subset that retains maximum information by training a model. In this study, we employ two representative embedded methods, which include the RF from [44] and XGBoost from [32]. Given the nonlinear relationships and coupling effects among various oilfield production parameters, we apply RF and XGBoost methods to select important features from the working data set. RF and XGBoost are prominent embedded feature selection techniques. We combine the results from both methods by using weighted averaging to obtain the final feature selection results.
Grid search is an exhaustive search method that specifies parameters to optimize the estimation function through cross-validation; see [32]. By arranging all possible combinations of parameters into a “grid” and evaluating performance using cross-validation, grid search can be one of the best learning algorithms. After trying all parameter combinations, the grid search method returns an appropriate classifier, automatically adjusted to obtain the optimal parameter set.

4.3. Model Establishment

Since the response variable of the pump inspection cycle is continuous, we choose regression models for prediction. In this study, we employ grid search to optimize the parameters of seven machine learning regression models, including multiple linear regression, XGBoost, RF, LightGBM, SVR, AdaBoost, and feedforward neural networks. After feature selection, we use these seven models to make preliminary predictions for the pump inspection cycle and evaluate their accuracy. The results show that the accuracy of the RF, LightGBM, SVR, and AdaBoost exceeds 80% and these four methods are more competitive among all seven competitors. Multiple linear regression and XGBoost exhibit accuracy below 75%, indicating underfitting. The feedforward neural network achieves 100% accuracy on the training set, suggesting overfitting. Consequently, we stack RF, LightGBM, SVR, and AdaBoost with weighting for predicting the pump inspection cycle.
The challenge of stacking four machine learning models is overfitting. Cross-training is an effective optimization method for combining base learners. Here are the summarized considerations for selecting and optimizing the metalearner:
  • The metalearner’s learning space is limited because of data repetition during learning. Complex models could lead to overfitting, while simple models often yield better results, especially those with anti-overfitting characteristics.
  • The training performance of the metalearners with a complex model is often unreliable, making it challenging to optimize them. Therefore, in most cases, we opt for simple models for modeling.
  • Effective metalearners (optimized through hyperparameter tuning) combined with bagging can sometimes enhance the metalearner’s learning capacity.
The high prediction accuracy and good performance from RF, LightGBM, SVR, and AdaBoost make these four methods suitable for stacking.

Model Evaluation

The performance metrics of the root mean squared error (RMSE), mean absolute error (MAE), and R-square ( R 2 ) have been commonly used to asses the performance of machine learning regression models. RMSE ranges from [ 0 , + ) , with a perfect model having RMSE = 0 when predicted values match actual values exactly. Larger errors result in a high RMSE value. MAE also ranges from [ 0 , + ) , with larger errors yielding larger MAE values. R-square measures the goodness of fit of a linear regression model. It represents the percentage of variance in the response variable explained by the features; see Equation (3). R 2 falls within [0, 1], with the value of R 2 close to 1. This fact indicates a better model fit.
RMSE = 1 n i = 1 n ( y i y ^ i ) 2 ,
MAE = 1 n i = 1 n | y i y ^ i | ,
R 2 = 1 i = 1 n ( y i y ^ i ) 2 i = 1 n ( y i y ¯ ) 2 ,
where y ^ i and y ¯ are the predicted value of y and the sample mean of y 1 , y 2 , , y n , respectively.

5. Results and Findings

5.1. Data Preprocessing Results

Python codes are prepared for data preprocessing and implementing the proposed two-layer stacking ensemble model. After carefully checking the data set of 35,443 pump inspection cycles for missing values, a total of 334 missing data points were found from the features of the production days, maximum load, minimum load, oil pressure, casing pressure, and daily oil production. The 334 missing data points account for less than 1% of the overall data and are summarized in Table 1. We removed samples or features with missing values to obtain a complete data set.
After excluding the 334 cases with missing values, we applied box plots to the remaining 35,109 observations for outlier detection. To save pages, only the box plots of the features of water cut, liquid viscosity, and tube pressure, and the response variable of the pump inspection period are given in Figure 1.
In Figure 1d, all pump inspection cycle data points fall within the interquartile range (IQR) boundaries (1.5 times the IQR above the upper quartile and below the lower quartile), indicating no outliers. Figure 1a displays some points below the lower IQR boundary as outliers. Outliers reduce the generalization ability of machine learning models. Therefore, we removed all outliers indicated in Figure 1a, and similarly, we removed the observations exceeding the upper bounds in Figure 1b,c. In total, 1678 abnormal observations were found and removed. After deleting abnormal observations, the final data set contains 33,431 observations for modeling.
The scaling operation with the min-max normalization method in Equation (4) is used to eliminate the dimensionality impact among indicators and enhance comparability.
x = x x min x max x min ,
where x min and x max denote the minimal and maximal values of the vector of ( x 1 , x 2 , , x n ) . Normalized data contribute to faster model training and improved prediction accuracy.

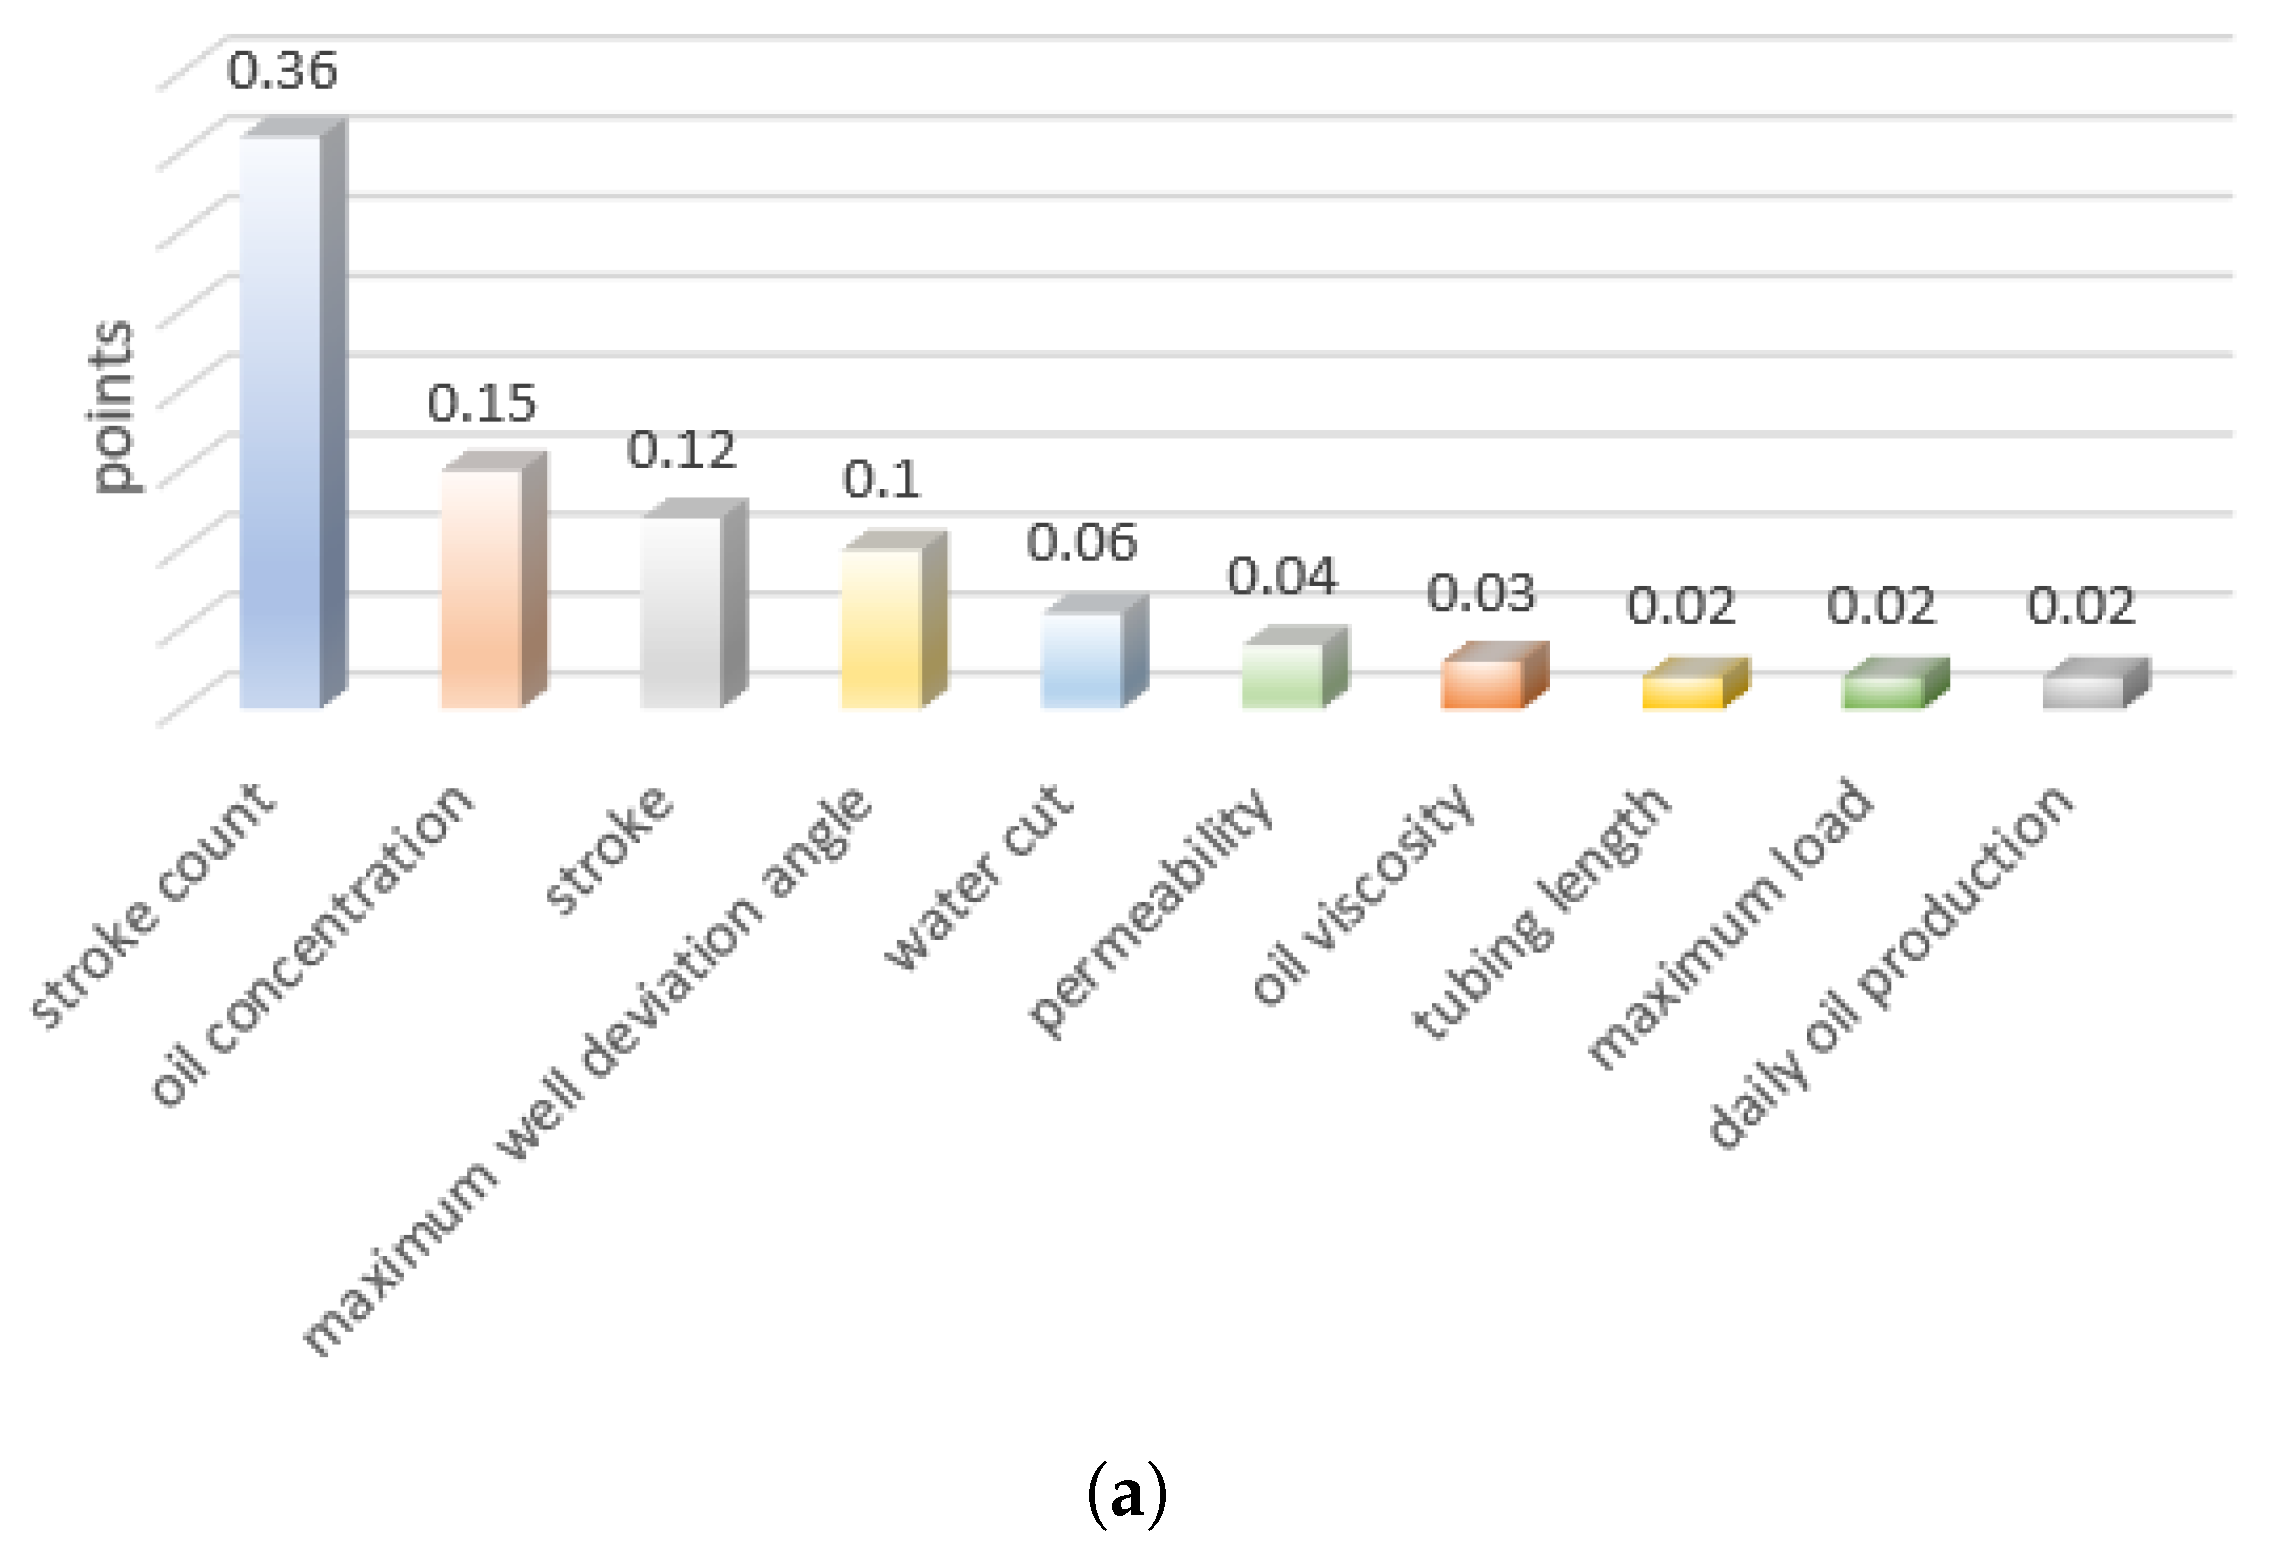
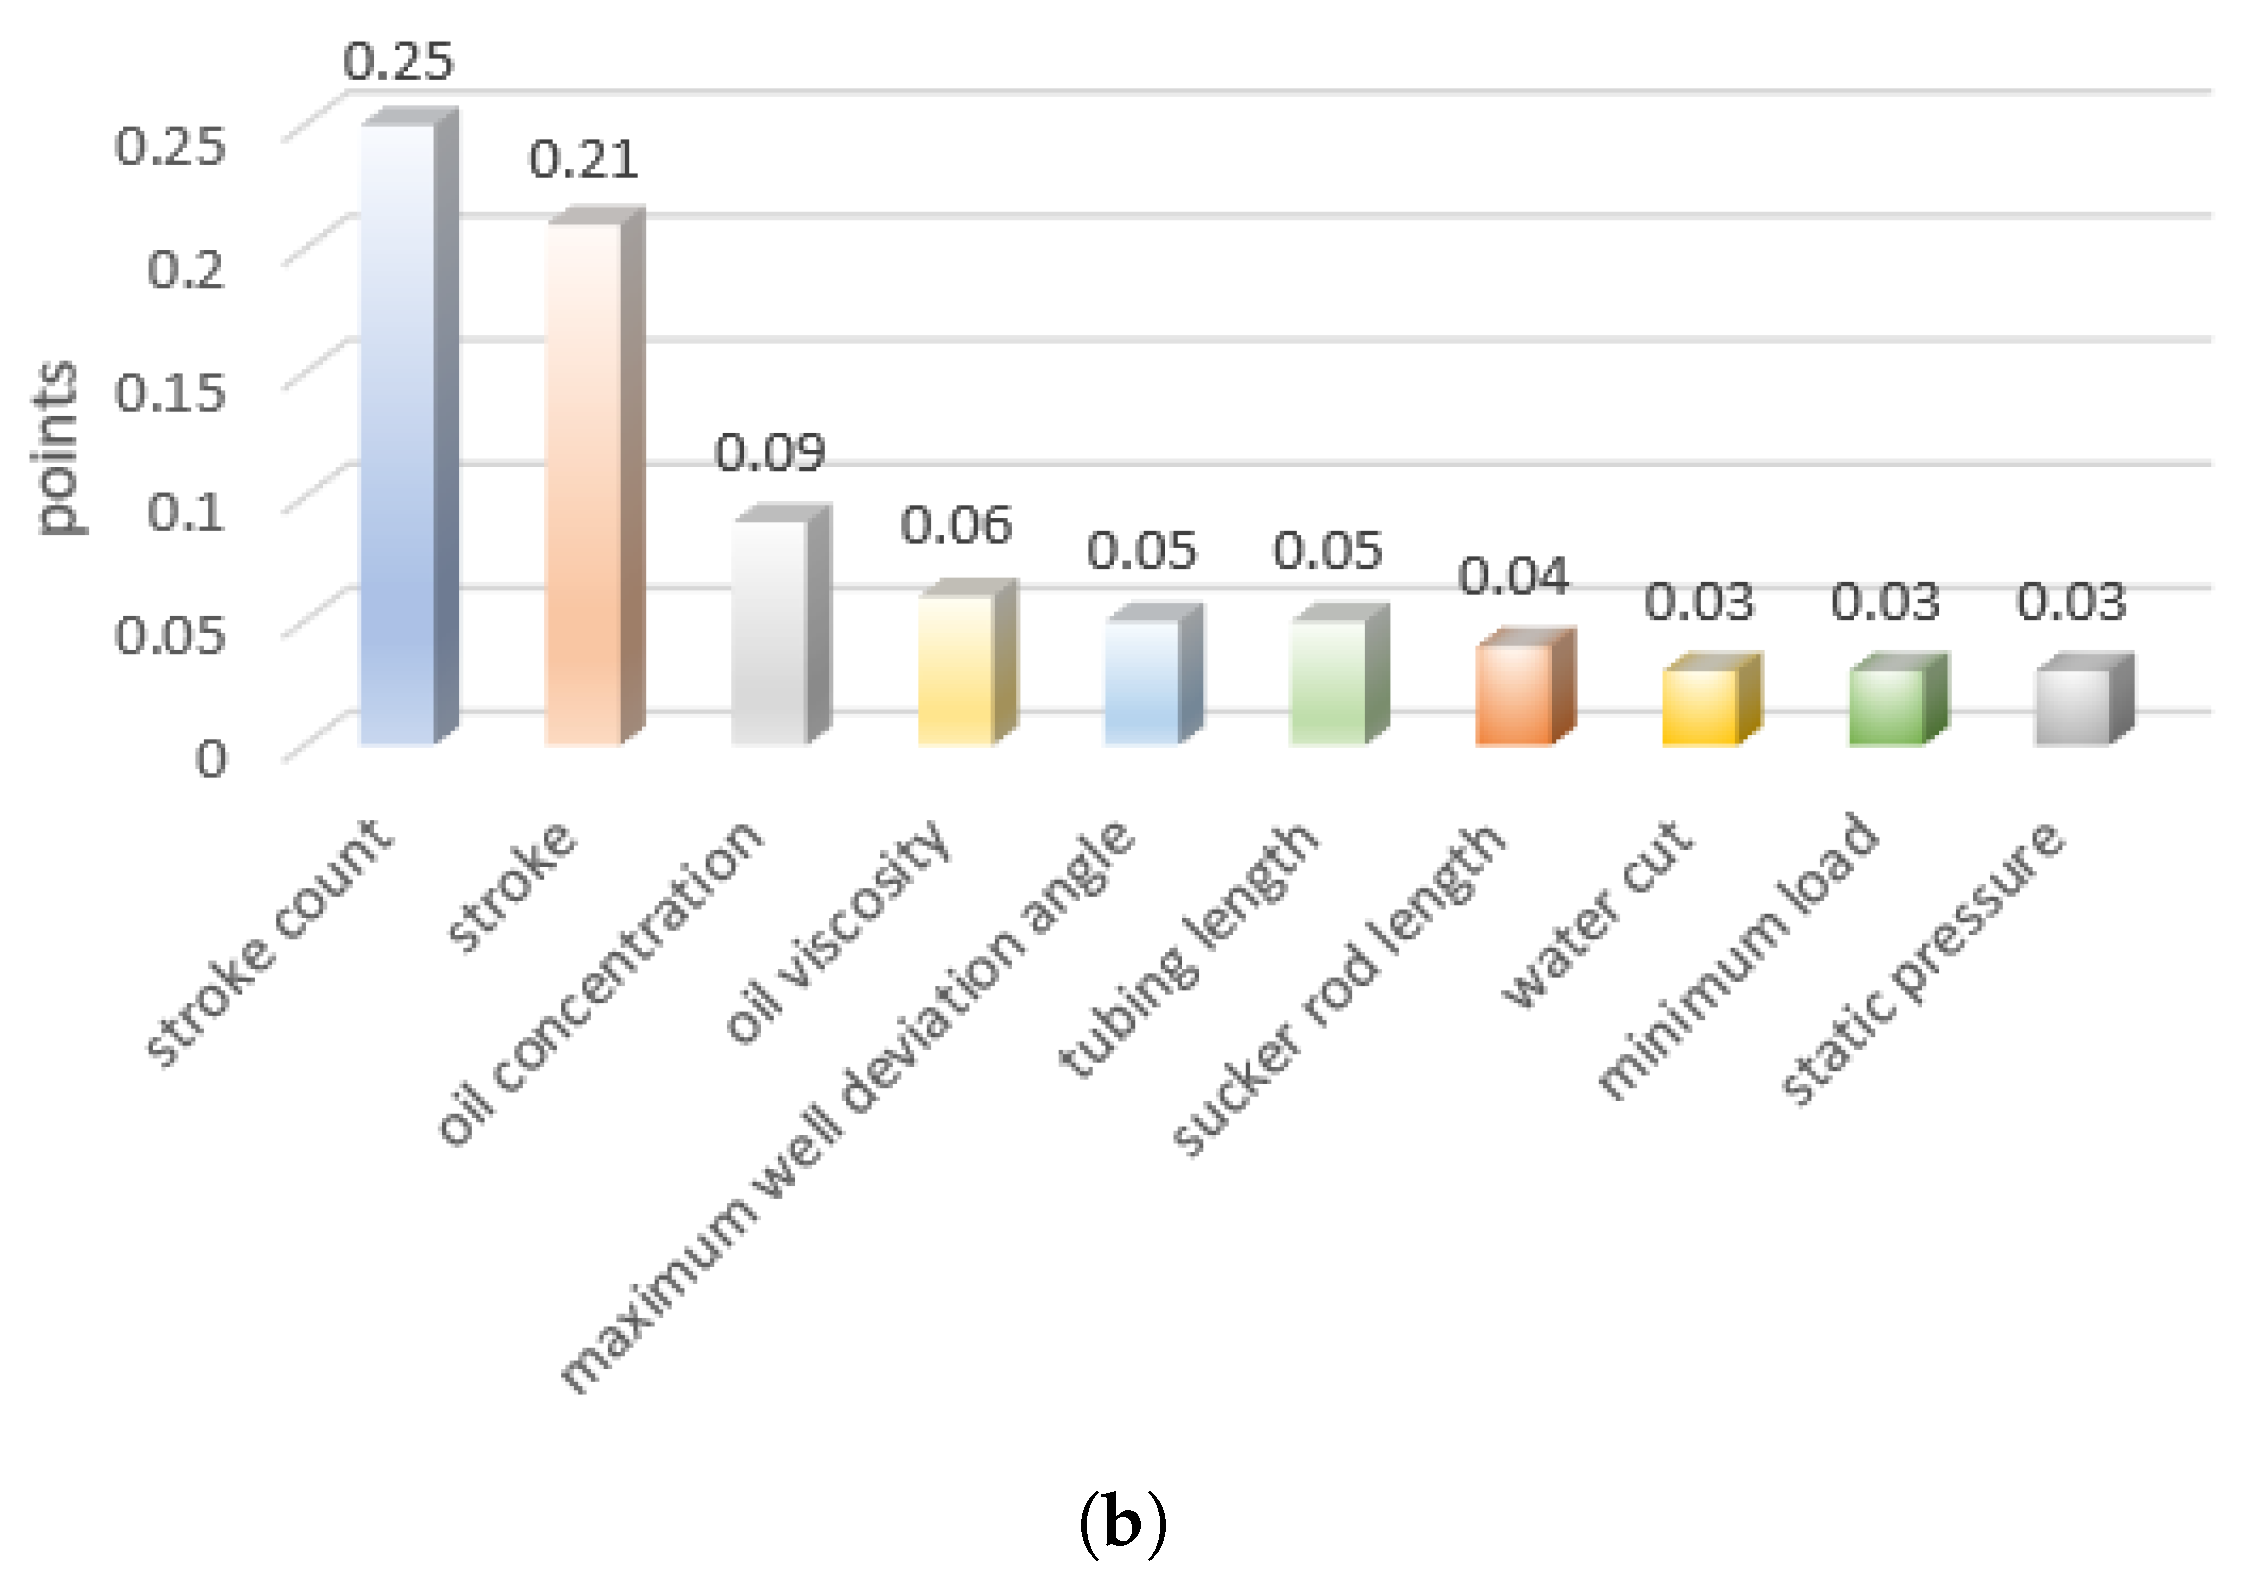
5.2. Feature Selection Results

Embedded feature selection methods can screen out important features for big data with numerous features. Among the embedded feature selection methods, RFs and XGBoost are the two best-performing embedded feature selection techniques. In this study, we initially applied the RF method for feature selection. The model’s output provides importance scores for factors affecting the response variable. The total score is one. The higher the score, the greater the importance of the feature. When the cumulative score exceeds 0.9, the most significant features affecting the response variable are identified. Figure 2a reports ten features with the largest scores obtained using the RF method. Next, the XGBoost algorithm was also used for feature selection. Figure 2b gives ten features with the largest scores. Because two methods were used for feature selection, the final score of each feature was evaluated using the weighted sum in Equation (6):
Score = w 1 x RF + w 2 x XGBoost
where w 1 and w 2 represent the weights for RF and XGBoost, and x RF and x XGBoost are the feature importance scores for RF and XGBoost, respectively. For example, the score for “stroke” is calculated as
Score = 0.5 × 0.36 + 0.5 × 0.25 0.31 ,
where 0.36 and 0.25 are the importance scores for “stroke” in RF and XGBoost, respectively.
Using the weighted method to obtain the score of each feature obtained from the RF and XGBoost methods, we found that the features of stroke count, stroke, oil concentration, oil viscosity, maximum well deviation angle, permeability, tubing length, water cut, and daily oil production are the most important features. The RF and XGBoost methods did not identify the pump depth in the set of the ten most important features. Based on the engineering experience, we include the feature of pump depth into the important feature set. The weighted score ratios of the ten most important features are listed in Figure 3. Figure 3 shows that “stroke count” has the highest weight proportion (31%), followed by oil concentration, maximum well deviation angle, stroke, oil viscosity, permeability, tubing length, water cut, pump depth, and daily oil production. The ten most important features were used to establish the two-layer stacking ensemble model.

5.3. Model Prediction Results

In this study, we used max features = 10,200 (the number of features to apply when checking for the best split) and n estimators = 1200 (the number of trees in the forest) to implement RF in Python codes. The grid search was used to find the optimal parameters, resulting in n estimators = 150 and max features = 120 .
Due to the numerous default parameters in LightGBM, an exhaustive search is time-consuming. Instead, we used cross-validation to select the best parameters. First, we chose a higher learning rate to speed up convergence. Then, we performed a grid search for other parameters, followed by regularization parameter tuning. Finally, we lowered the learning rate to improve accuracy. The optimal parameters were obtained by n estimators = 100 , the number of decision trees, num leaves = 31 , the parameter sets the maximum number of nodes per tree, and learning rate = 0.1 , where num leaves is used to control the complexity of the tree model.
For SVR, the kernel of the sigmoid function was selected, the range of the penalty factor C was specified by ( 0.1 , 1000 ) , and the default value of the kernel coefficient of gamma was kept. Grid search yielded the optimal parameters C = 1000 and gamma = 0.01 .
For AdaBoost, we simultaneously turned the parameters n estimators , the number of base models, and learning rate . Cross-validation led to the optimal parameters n estimators = 100 and learning rate = 0.3 . We manually tuned the random state parameter, which controls the random seed given at each estimator at each boosting iteration. We obtained the best prediction performance occurred at random state = 97 . Table 2 displays the optimal parameter combinations for the four models using grid search methods.
We randomly split the cleaned sample into an 80% training set and a 20% test set for validation. We used the grid-search-optimized RF, LightGBM, SVR, and AdaBoost algorithms to build predictive models for the pump inspection cycle. The R 2 metric was used to evaluate the accuracy of the training and test sets. It is noted that relying solely on one evaluation metric may not comprehensively assess the model if certain features can impact metric stability. Therefore, we also introduced the metrics of MAE and RMSE to comprehensively evaluate model performance. Table 3 displays the validation results of the metrics of RMSE, MAE, and R 2 for the four models based on the training data set.
Among the four models, Table 3 shows that RF achieves the highest accuracy, reaching 90.19%. Moreover, RF had the lowest RMSE and MAE values, indicating it performed best among the individual models. We also note that all four models achieve an accuracy of over 83%, demonstrating high precision and strong generalization ability. Consequently, they are suitable as base models (or base learners) for the stacking ensemble model. To visually showcase their predictive performance, we created a model visualization. The fitting results are depicted in Figure 4. The greater the overlap between actual and predicted values curves, the better the model fit. As shown in the figure, all four models exhibit good fitting performance.
We construct an optimization procedure for the two-layer stacking ensemble model to improve prediction results using the models of RF, LightGBM, SVR, and AdaBoost as base models and ridge regression as the metalearner. The optimization process for the base learners involves fivefold cross-training on the four models. We split the data set into training and test sets, with cross-validation applied only to the training set. We divide the training set each time into five parts: four for model training and one for model validation. By selecting different parts as the validation set in each iteration, we achieve cross-validation across the entire training set, effectively addressing overfitting due to repeated learning from base and metalearners. Figure 5 shows the fivefold cross-training process. The fivefold cross-training of the other three models can be obtained based on a similar process.
The optimization process for the metalearner proceeds as follows:
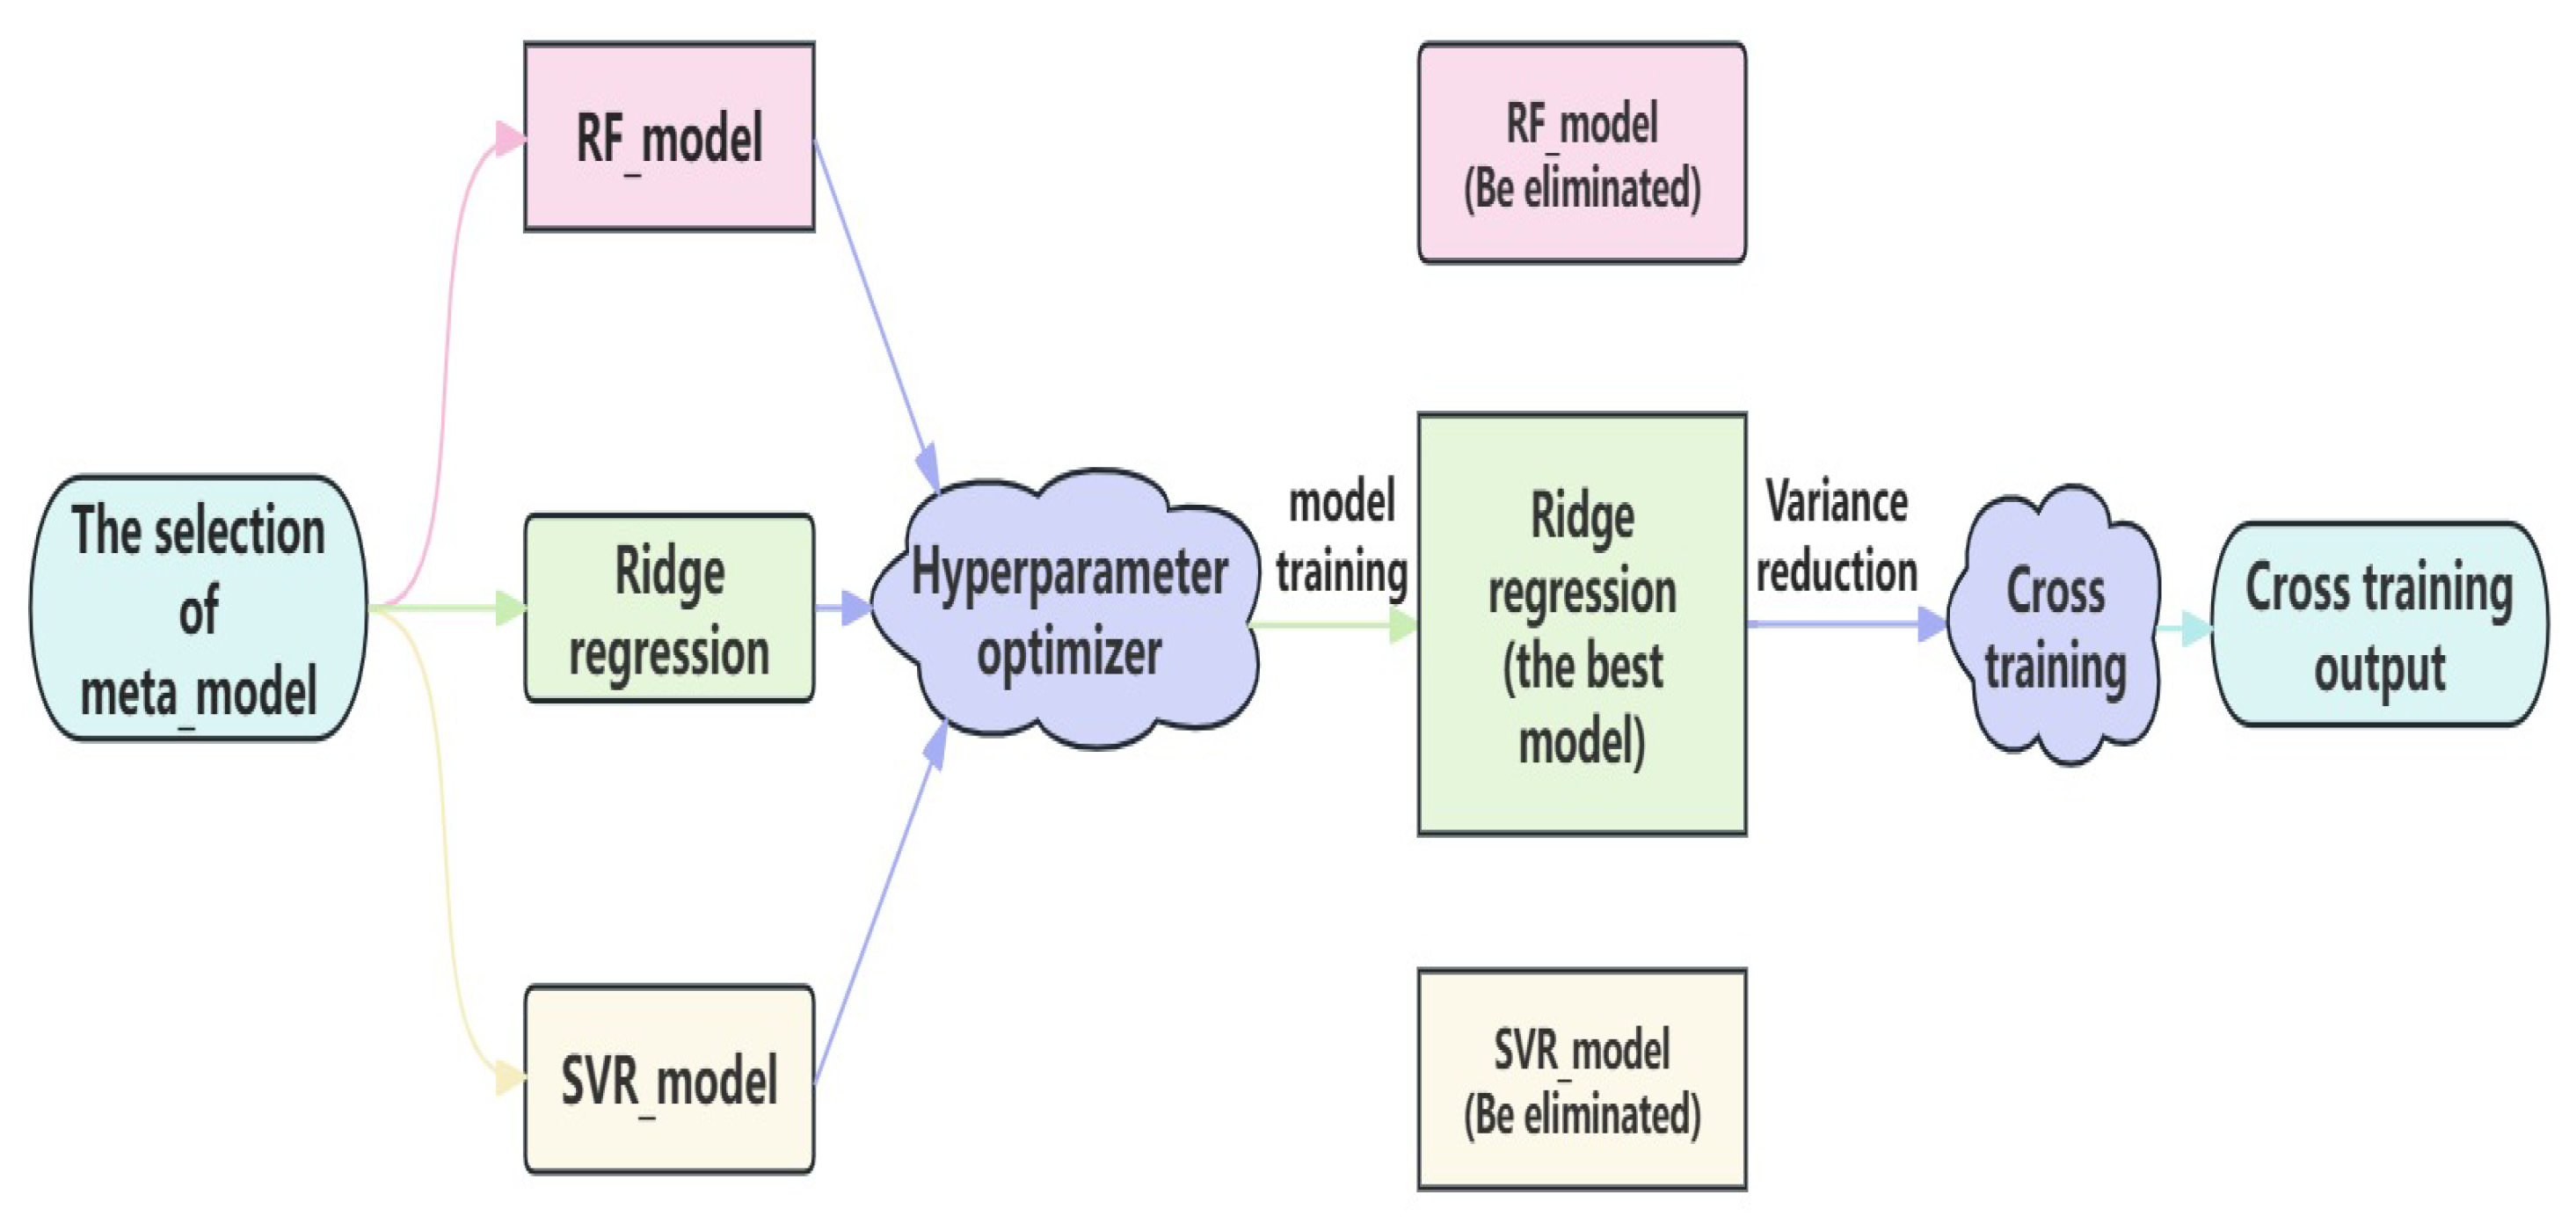
  • We use ridge regression, RF, and SVR as regression models for metalearner training.
  • A hyperparameter optimizer tunes the metalearner’s hyperparameters to obtain the best model.
  • We evaluate the final learning performance of the three models, as shown in Table 4.
Table 4 indicates that ridge regression achieved the highest accuracy. Therefore, we select ridge regression as the metalearner. To reduce variance in the optimal parameter results, we cross-train the metalearner again, following the same process as base model cross-training, resulting in an average prediction from the cross-trained models. The optimization process for the stacking metalearner is illustrated in Figure 6.
The stacking ensemble model prediction process is as follows:
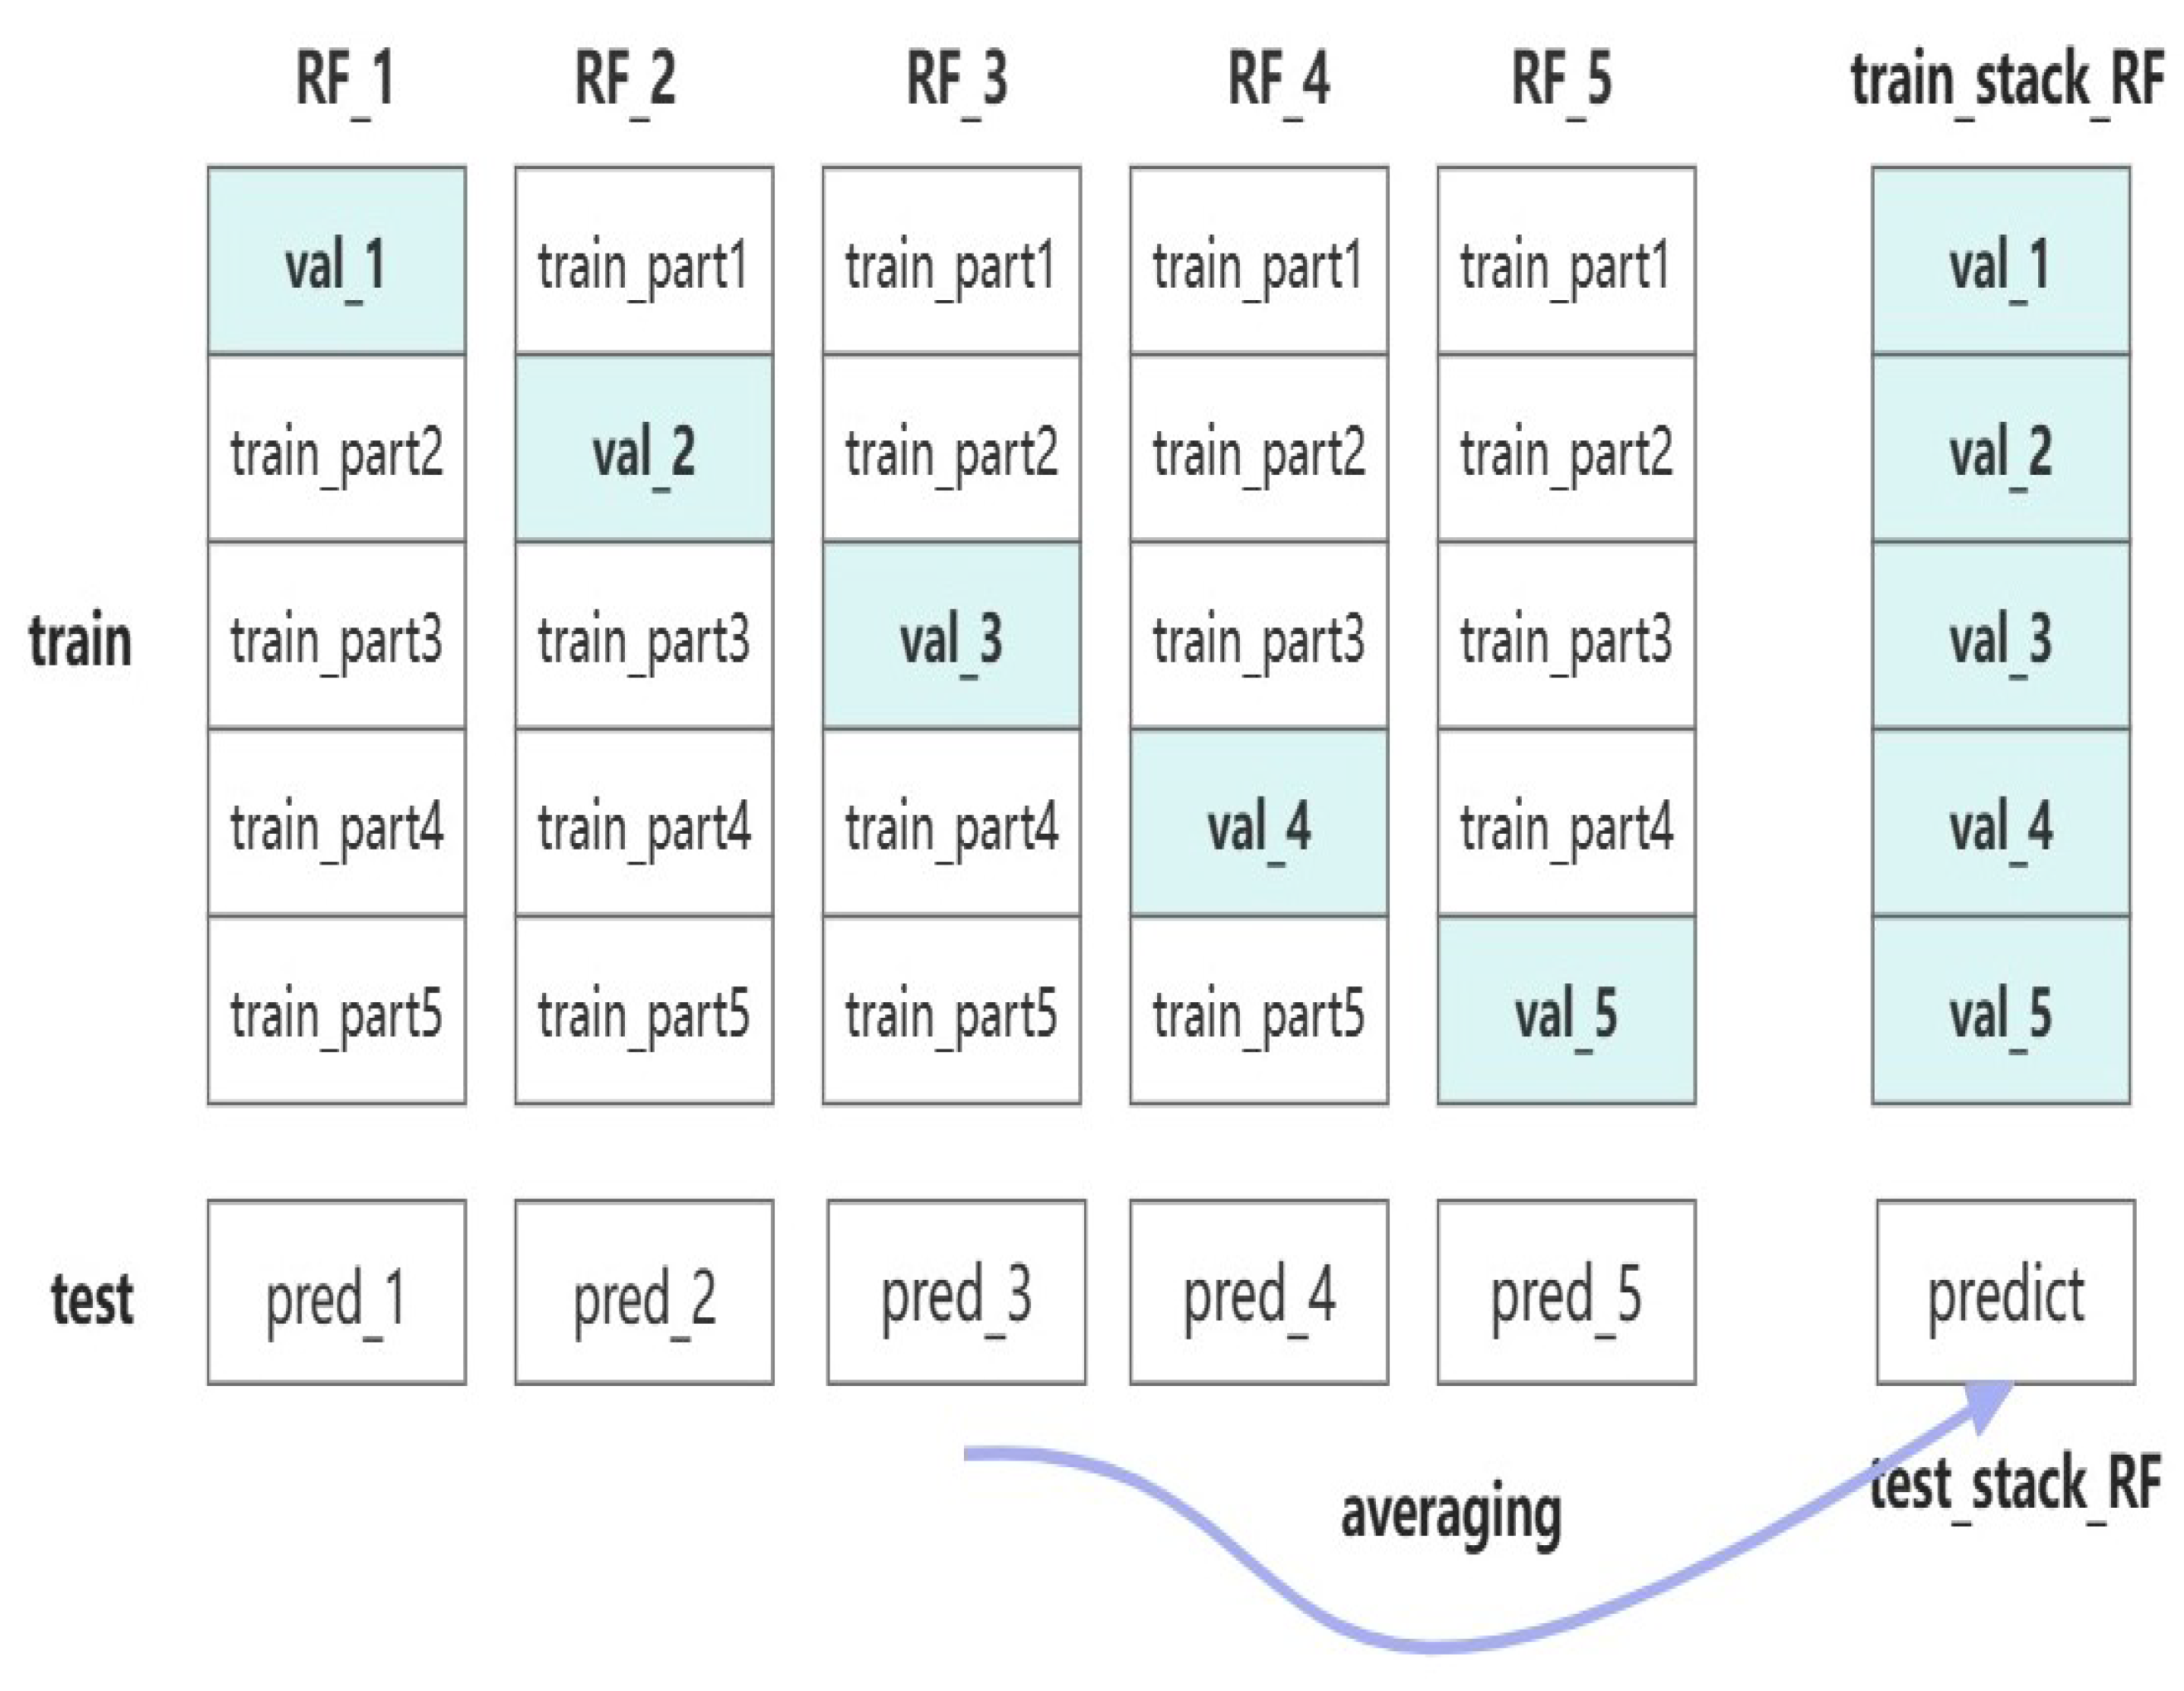
  • The cleaned data are split into training, validation, and test sets. The proportions of the training and test sets are the same as for individual models. We further divide the training set into a 20% validation subset and an 80% training subset. The base models are trained on the training subset, and the trained base models are then used on the validation subset. The validation set predictions serve as input features for the metalearner tested on the test set.
  • The base models are trained and fitted on the training subset. Their predictions on the validation and test sets are stacked to create input features for the metalearner.
  • The metalearner of ridge regression is trained on the new features and labels generated from the validation set. The trained ridge regression model predicts the new features, resulting in the final well-trained pump inspection cycle prediction model. Figure 7 illustrates the stacking ensemble model flow of the proposed two-layer stacking ensemble model.
Similarly, we evaluate the stacking ensemble model’s predictive performance using the metrics of MAE, RMSE, and R 2 , comparing it with the performance of the four individual models, as shown in Table 5.
Table 5 shows that the two-layer stacking ensemble model outperforms the four individual models in all three metrics. While reducing RMSE and MAE, the stacking model achieves improved fitting accuracy compared with RF, LightGBM, SVR, and AdaBoost, with accuracy increases of 1.92%, 3.34%, 5.95%, and 8.87%, respectively. This demonstrates that the two-layer stacking ensemble model can provide more accurate and reliable predictions for the pump inspection cycle. Figure 8 visually displays the fitting performance of the two-layer stacking ensemble model.

5.4. Technical Application

The pump inspection cycles aim to ensure oilfield equipment’s normal operation and production efficiency. Pump inspection cycles refer to the periodic maintenance and repair intervals for pumping units. Regular pump inspections allow timely detection of pump faults and issues, ensuring safe equipment operation and stable production output. Scheduled maintenance also extends the pump’s lifespan, reduces downtime due to failures, and enhances production efficiency and economic benefits. Therefore, reliability analysis of pump inspection cycles is crucial for continuous oilfield production.
Using processed data, we selected a specific period of 9893 oil wells for pump inspection data, resulting in 1102 pump inspection records. The RMSE and MAE based on the data can be obtained by RMSE = 27.72 and MAE = 12.28 . When considering the 5th, 10th, 15th, 20th, and 25th percentiles, the corresponding days for the maximum likelihood estimates (MLE) of x p are 427, 518, 579, 663, and 705 days, respectively. Based on the pump inspection cycle prediction model, we observe that when the pumpjack operates for fewer than 400 days, the probability of sucker rod failure is less than 5%. However, when the pumpjack operates beyond 965 days, the probability of failure reaches 50%. At this point, it’s worth considering whether inspections or focused monitoring are necessary. The optimal maintenance cycle can be determined based on the value of x p . This reliability analysis of equipment provides a basis for subsequent oilfield operations. As data volumes increase over time, it is possible to establish models based on historical dynamic data to calculate the optimal pump inspection cycle under specific operating conditions, reducing inspection costs and offering valuable guidance for future measures. Figure 9 illustrates the gradual trend in pump inspection cycles in days at a Daqing oilfield plant in China from 2020 to 2023.
From Figure 9, the pump inspection cycles at the specific oilfield plant in Daqing city from 2020 to 2023 were 799 days, 834 days, 872 days, and 1005 days, respectively. It is evident from Figure 9 that the pump inspection cycles for oil wells indeed exhibit a gradual changing trend. Using the latest data and effective methods for precise pump inspection cycle prediction is crucial for developing work plans and strategies in the oilfield.

5.5. Discussion

As machine learning technology matures, more researchers are exploring its application in pump inspection cycle prediction. Existing studies often relied on single models for feature selection and prediction. However, a single model can lead to overfitting due to the sole pursuit of model fitting accuracy. To address these shortcomings, this study proposes a feature selection weighted average model and a two-layer stacking ensemble model for predicting the pump inspection cycle and demonstrating the feasibility of this approach.
In previous research, the gray correlation algorithm was commonly used to select the main influencing factors for pump inspection cycles. In 2023, Deng et al. [6] used gray correlation to identify parameters highly correlated with pump inspection cycles as independent variables. While gray correlation analysis provides a ranking of feature relevance, it may not match the training effectiveness of machine learning models due to the complexity of relationships among production parameters. Moreover, the results of gray correlation analysis can be influenced by subjective factors, leading to underfitting. Unlike existing studies, two machine learning algorithms, the RF and XGBoost, are used for feature selection. By calculating the weight proportions of key features and combining model results with the engineering experience in the local oilfield plants, we construct an average-weighted model that balances theory and practice, enhancing feature selection quality. Additionally, Zhang et al. [7] successfully emphasized static and dynamic feature selection using multimodal compressed bilinear pooling, supporting our feature selection approach.
Existing machine learning studies for pump inspection cycle prediction typically rely on single models. Deng et al. [6] separately built SVR, BNN, and multiple linear regression models, with SVR identified as the optimal model based on MAE and mean relative error evaluation. Similarly, Zhang et al. [7] evaluated GMM, logistic regression, GBDT, and XGBoost models using RMSE and R-squared, concluding that XGBoost achieved the highest accuracy of 89%. While single-model accuracy is impressive, each model has inherent limitations. In contrast, ensemble models offer three advantages:
  • Diversity among weak classifiers: The stacking ensemble model combines classifiers with different decision boundaries, resulting in more reasonable boundaries and reduced overall errors.
  • Greater flexibility: Ensemble learning provides flexibility.
  • Improved fit on training data: The stacking ensemble model can outperform individual models on training data while mitigating overfitting risks.
In this study, we construct a two-layer stacking ensemble model using RF, LightGBM, SVR, and AdaBoost as the first layer. All single models have an accuracy exceeding 83%. We select the metalearner of ridge regression as the second layer to prevent overfitting. Both layers undergo cross-training to further reduce overfitting risk. Evaluating the model using RMSE, MAE, and R 2 , our stacking ensemble achieves a peak accuracy of 92.11%, surpassing the best-performing single model (RF) by 1.92%. The RMSE and MAE are also 0.73 and 0.45, respectively, which is much lower than the single models. These results demonstrate that the two-layer stacking ensemble model improves prediction accuracy and generalization ability compared with single models, making the proposed method well suited for pump inspection cycle prediction.

6. Conclusions

This study analyzes a pumpjack data set using mainstream machine learning algorithms, predicts the pump inspection cycle based on the proposed two-layer stacking ensemble model, and assesses the model reliability. Our work includes the following aspects:
  • Combining theoretical analysis, field guidance, and data mining, we analyze the factors affecting pump inspection cycles. We use a comprehensive evaluation model that combines feature selection using RF and XGBoost to identify the ten most significant factors influencing pump inspection cycles.
  • We select RF, LightGBM, SVR, and AdaBoost regression models to predict pump inspection cycles. The results show that RF achieved the highest accuracy of 90.19%, followed by LightGBM with 88.77%, SVR with 86.16%, and AdaBoost with 83.24%.
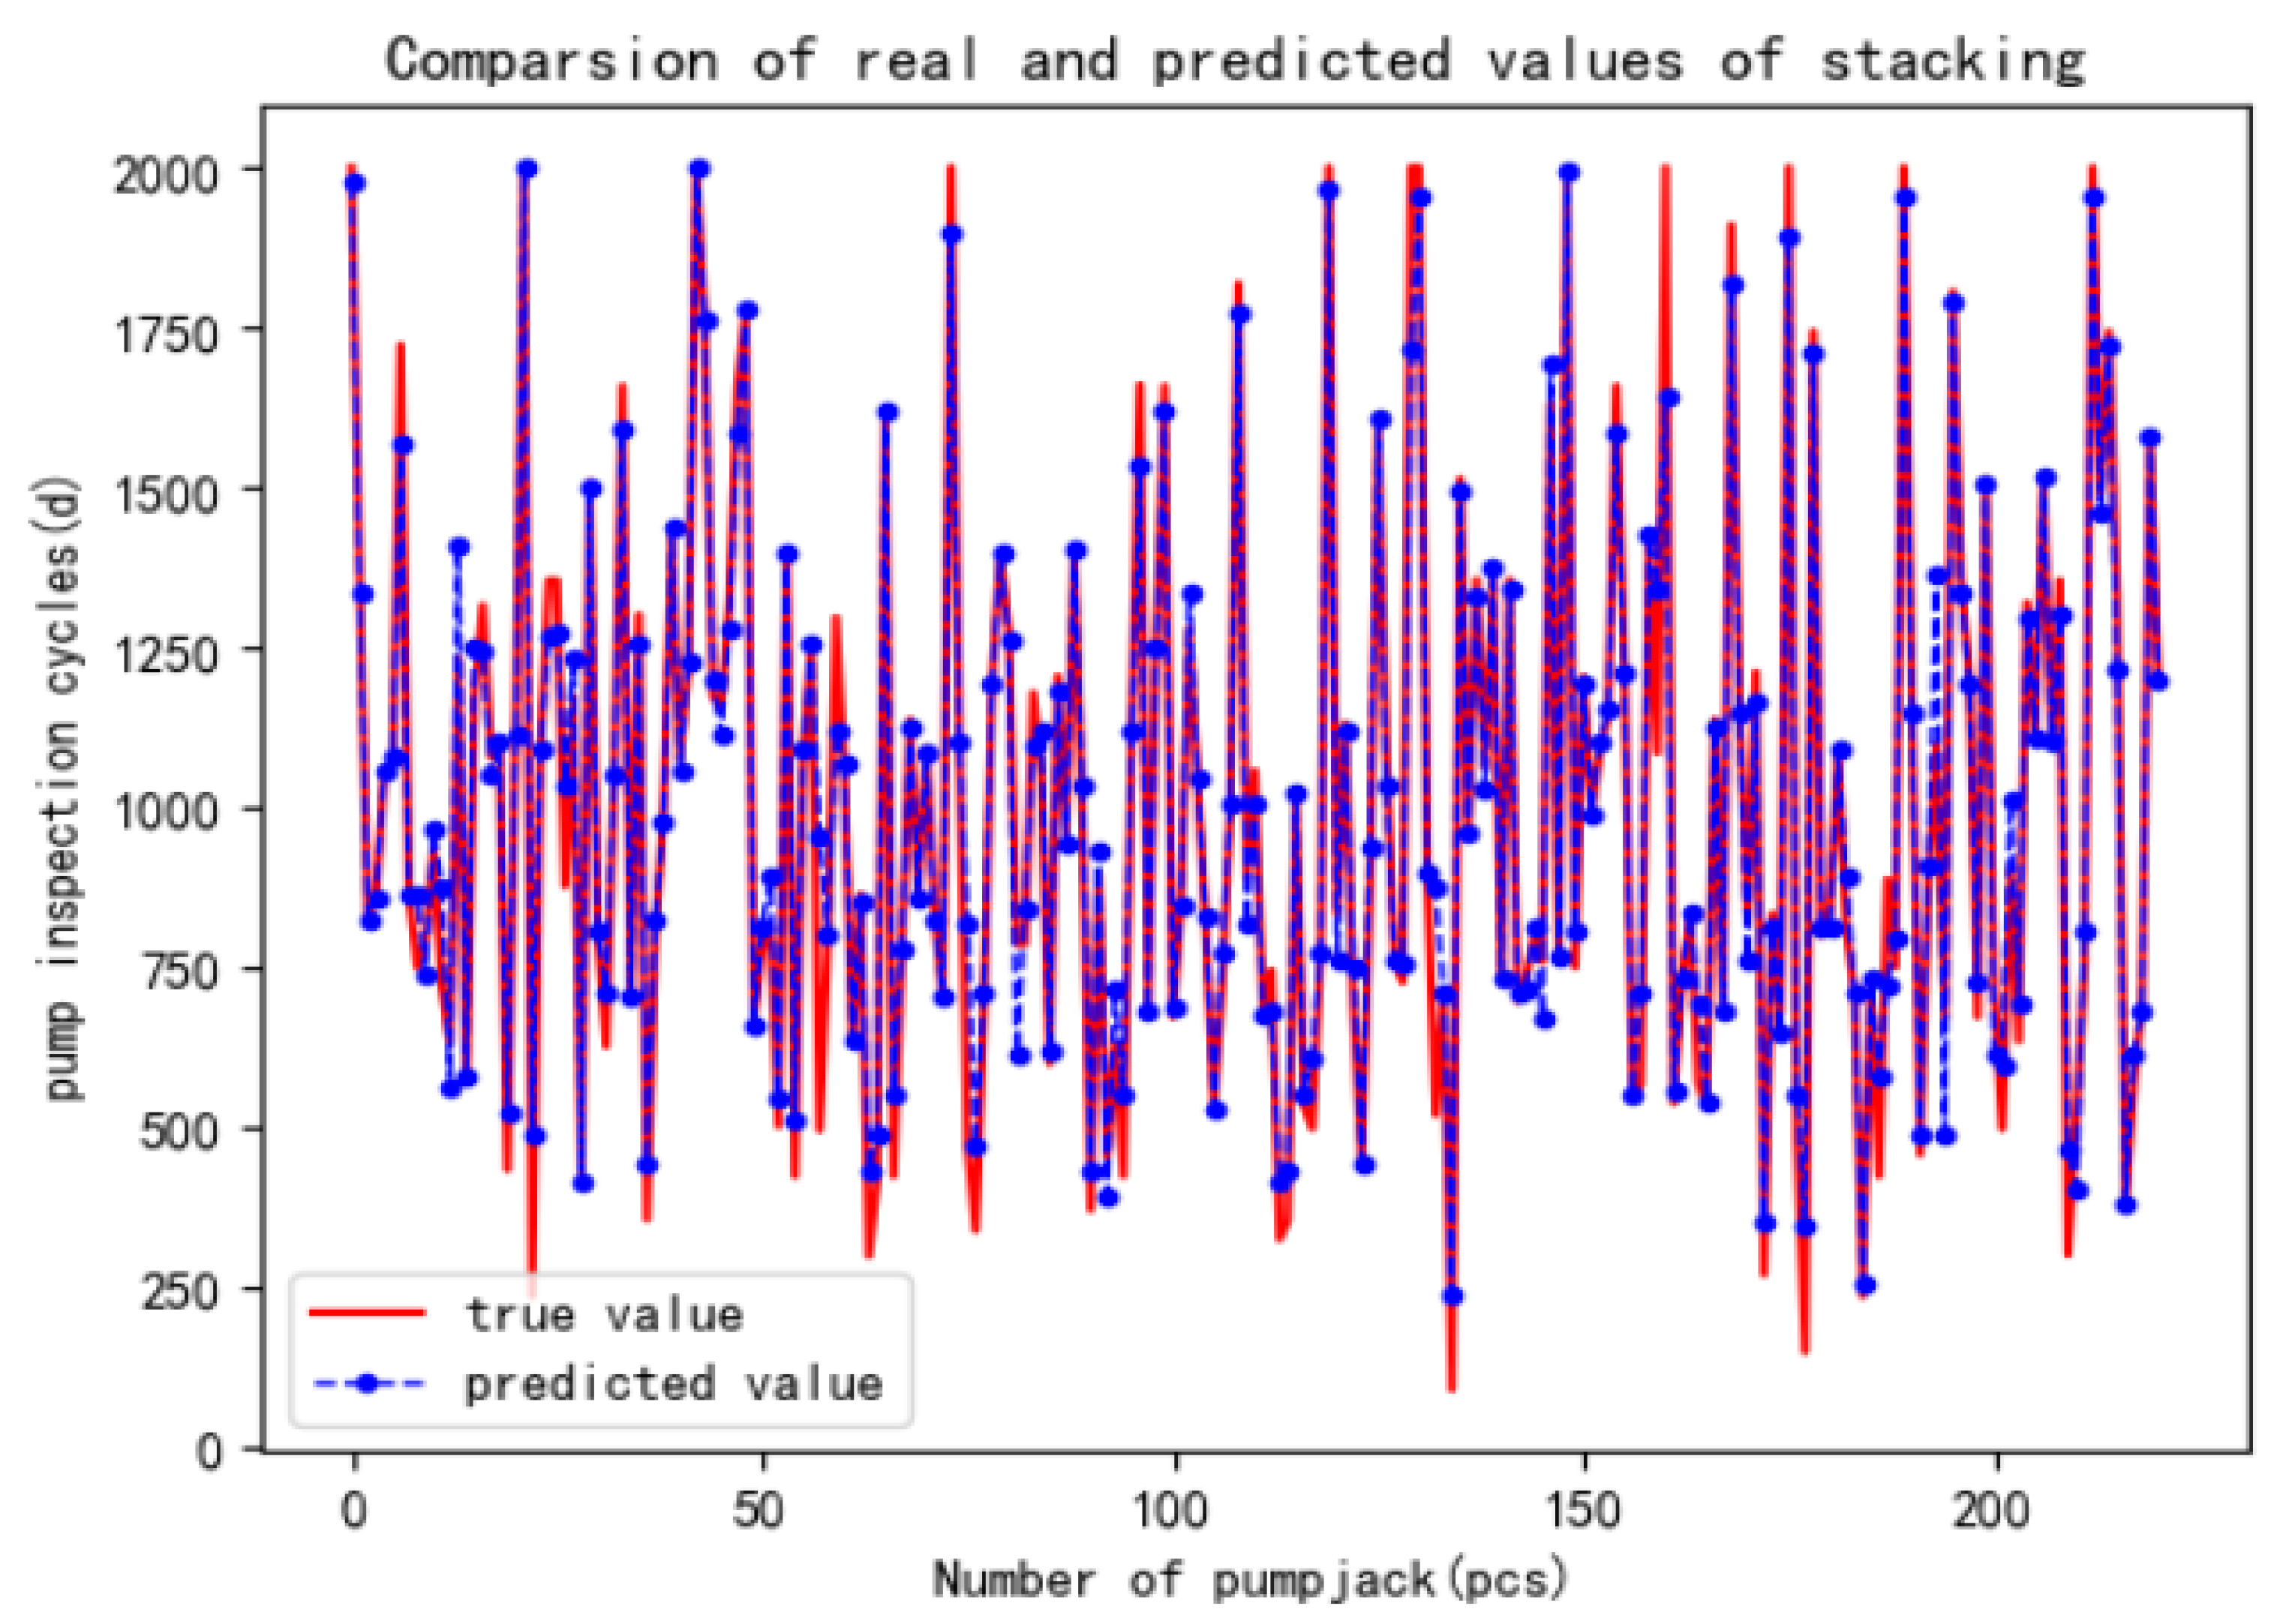
  • We propose a two-layer stacking ensemble model to improve the prediction accuracy of existing methods. The first layer comprises the four models mentioned earlier, and the second layer uses ridge regression as the metalearner to prevent overfitting. Cross-training is applied to both layers. The proposed model achieves an accuracy of 92.11%, outperforming the individual model and demonstrating strong predictive capabilities.
  • By calculating predicted values, we find that the pump inspection cycle’s are 427, 518, 579, 663, 705, and 964 days for the 5th, 10th, 15th, 20th, 25th, and 50th percentiles.
The proposed two-layer stacking ensemble method can enhance the prediction quality for the pump inspection cycle data set. However, the stacking model relies heavily on precise hyperparameter tuning across different algorithms, which is computationally intensive and can lead to suboptimal settings. This complexity heightens the risk of overfitting, especially when the data set may not cover all real-world variations. Additionally, while the ensemble approach leverages individual model strengths, it also amplifies their weaknesses. When using a stacking ensemble model, tuning hyperparameters and a cross-validation check are needed. We must overcome the above difficulties when using a stacking ensemble model for prediction.
This study emphasizes the applications of using a two-layer stacking ensemble model for oilfield data to improve the predicting quality of the pump inspection cycle of the existing studies that were developed based on a single machine learning method. As better justifications for feature selection, existing works include attribute weighting and nonlinear subspace clustering methods, which can be a future study; see the insightful results from Yang and Fountoulakis [45] and Xu et al. [46]. Other deep learning methods could be competitive with the proposed two-layer stacking ensemble model and will be our future work.

Author Contributions

Conceptualization, H.X. and S.Z.; methodology, H.X. and S.Z.; software, S.Z.; validation, H.X. and S.Z.; formal analysis, S.Z. and T.-R.T.; investigation, T.-R.T. and Y.L.; resources, H.X. and T.-R.T.; data curation, H.X.; writing—original draft preparation, S.Z.; writing—review and editing, T.-R.T. and Y.L.; visualization, S.Z. and T.-R.T.; supervision, T.-R.T. and Y.L.; project administration, T.-R.T.; funding acquisition, H.X. and T.-R.T. All authors have read and agreed to the published version of the manuscript.

Funding

This research was funded by the National Science and Technology Council, Taiwan, grant number NSTC 112-2221-E-032-038-MY2; and National Natural Science Foundation of China, grant number 52174060.

Data Availability Statement

The data are unavailable due to privacy or confidentiality restrictions.

Conflicts of Interest

The authors declare no conflicts of interest.

References

  1. Bian, Y.J.; Shi, W.; Lao, J.Y.; Chen, J.; Sun, S.L. The analysis on causes of rupture for a sucker rod made of 20CrMo alloy. Adv. Mater. Res. 2011, 295, 626–630. [Google Scholar] [CrossRef]
  2. Ulmanu, V.; Ghofrani, R. Fatigue life prediction method for sucker rods based on local concept; Verfahren zur Lebensdauerabschaetzung der Tiefpumpgestaenge nach dem oertlichen Konzept. Erdoel Erdgas Kohle 2001, 117, 189–195. [Google Scholar]
  3. Zhao, T.; Zhao, C.; He, F.; Pei, B.; Jiang, Z.; Zhou, Q. Wear analysis and safety assessment of sucker rod. China Pet. Mach. 2017, 45, 65–70. [Google Scholar]
  4. Dolby, J.; Shinnar, A.; Allain, A.; Reinen, J. Ariadne: Analysis for machine learning programs. In Proceedings of the 2nd ACM SIGPLAN International Workshop on Machine Learning and Programming Languages, Philadelphia, PA, USA, 18–22 June 2018; pp. 1–10. [Google Scholar]
  5. Hou, Y.B.; Chen, B.J.; Gao, X.W. Fault diagnosis of sucker rod pump wells based on GM-ELM. J. Northeast. Univ. (Nat. Sci.) 2019, 40, 1673. [Google Scholar]
  6. Deng, J.; Liu, X.; Yang, P. Research on Pump Detection Period Predicting Based on Support Vector Regression. Comput. Digit. Eng. 2023, 51, 1893–1897. [Google Scholar]
  7. Zhang, X.-D.; Wang, X.-Y.; Qin, Z.-X. Pump Detection Period Predicting of Pump Well Based on Feature Fusion. Comput. Mod. 2023, 12, 60–66. [Google Scholar]
  8. Breiman, L. Random forests. Mach. Learn. 2001, 45, 5–32. [Google Scholar] [CrossRef]
  9. Hastie, T.; Tibshirani, R.; Friedman, J.; Hastie, T.; Tibshirani, R.; Friedman, J. Random forests. In The Elements of Statistical Learning: Data Mining, Inference, and Prediction; Springer: Berlin/Heidelberg, Germany, 2009; pp. 587–604. [Google Scholar]
  10. Cutler, A.; Cutler, D.R.; Stevens, J.R. Random forests. In Ensemble Machine Learning: Methods and Applications; Springer: Berlin/Heidelberg, Germany, 2012; pp. 157–175. [Google Scholar]
  11. Fawagreh, K.; Gaber, M.M.; Elyan, E. Random forests: From early developments to recent advancements. Syst. Sci. Control Eng. Open Access J. 2014, 2, 602–609. [Google Scholar] [CrossRef]
  12. Denisko, D.; Hoffman, M.M. Classification and interaction in random forests. Proc. Natl. Acad. Sci. USA 2018, 115, 1690–1692. [Google Scholar] [CrossRef]
  13. Chiang, J.-Y.; Lio, Y.L.; Hsu, C.-Y.; Tsai, T.-R. Binary classification with imbalanced data. Entropy 2024, 26, 15. [Google Scholar] [CrossRef]
  14. Ogunleye, A.; Wang, Q.G. XGBoost model for chronic kidney disease diagnosis. IEEE/ACM Trans. Comput. Biol. Bioinform. 2019, 17, 2131–2140. [Google Scholar] [CrossRef] [PubMed]
  15. Chen, T.; He, T.; Benesty, M.; Khotilovich, V. Package ‘xgboost’. R Version 2019, 90, 40. [Google Scholar]
  16. Asselman, A.; Khaldi, M.; Aammou, S. Enhancing the prediction of student performance based on the machine learning XGBoost algorithm. Interact. Learn. Environ. 2023, 31, 3360–3379. [Google Scholar] [CrossRef]
  17. Li, J.; An, X.; Li, Q.; Wang, C.; Yu, H.; Zhou, X.; Geng, Y.A. Application of XGBoost algorithm in the optimization of pollutant concentration. Atmos. Res. 2022, 276, 106238. [Google Scholar] [CrossRef]
  18. Liu, W.; Chen, Z.; Hu, Y. XGBoost algorithm–based prediction of safety assessment for pipelines. Int. J. Press. Vessel. Pip. 2022, 197, 104655. [Google Scholar] [CrossRef]
  19. Ke, G.; Meng, Q.; Finley, T.; Wang, T.; Chen, W.; Ma, W.; Ye, Q.; Liu, T.-Y. Lightgbm: A highly efficient gradient boosting decision tree. Adv. Neural Inf. Process. Syst. 2017, 30, 1–9. [Google Scholar]
  20. Sun, X.; Liu, M.; Sima, Z. A novel cryptocurrency price trend forecasting model based on LightGBM. Financ. Res. Lett. 2022, 32, 101084. [Google Scholar] [CrossRef]
  21. Li, K.; Xu, H.; Liu, X. Analysis and visualization of accidents severity based on LightGBM-TPE. Chaos Solitons Fractals 2022, 157, 111987. [Google Scholar] [CrossRef]
  22. Yang, H.; Chen, Z.; Yang, H.; Tian, M. Predicting coronary heart disease using an improved LightGBM model: Performance analysis and comparison. IEEE Access 2023, 11, 23366–23380. [Google Scholar] [CrossRef]
  23. Bales, D.; Tarazaga, P.A.; Kasarda, M.; Batra, D.; Woolard, A.G.; Poston, J.D.; Malladi, V.S. Gender classification of walkers via underfloor accelerometer measurements. IEEE Internet Things J. 2016, 3, 1259–1266. [Google Scholar] [CrossRef]
  24. Mauldin, T.; Ngu, A.H.; Metsis, V.; Canby, M.E.; Tesic, J. Experimentation and analysis of ensemble deep learning in IoT applications. Open J. Internet Things 2019, 5, 133–149. [Google Scholar]
  25. Xu, H.; Yan, Z.H.; Ji, B.W.; Huang, P.F.; Cheng, J.P.; Wu, X.D. Defect detection in welding radiographic images based on semantic segmentation methods. Measurement 2022, 188, 110569. [Google Scholar] [CrossRef]
  26. Nafea, A.A.; Ibrahim, M.S.; Mukhlif, A.A.; AL-Ani, M.M.; Omar, N. An ensemble model for detection of adverse drug reactions. ARO-Sci. J. Koya Univ. 2024, 12, 41–47. [Google Scholar] [CrossRef]
  27. Terrault, N.A.; Hassanein, T.I. Management of the patient with SVR. J. Herpetol. 2016, 65, S120–S129. [Google Scholar] [CrossRef] [PubMed]
  28. Sun, Y.; Ding, S.; Zhang, Z.; Jia, W. An improved grid search algorithm to optimize SVR for prediction. Soft Comput. 2021, 25, 5633–5644. [Google Scholar] [CrossRef]
  29. Huang, J.; Sun, Y.; Zhang, J. Reduction of computational error by optimizing SVR kernel coefficients to simulate concrete compressive strength through the use of a human learning optimization algorithm. Eng. Comput. 2022, 38, 3151–3168. [Google Scholar] [CrossRef]
  30. Fu, X.; Zheng, Q.; Jiang, G.; Roy, K.; Huang, L.; Liu, C.; Li, K.; Chen, H.; Song, X.; Chen, J.; et al. Water quality prediction of copper-molybdenum mining-beneficiation wastewater based on the PSO-SVR model. Front. Environ. Sci. Eng. 2023, 17, 98. [Google Scholar] [CrossRef]
  31. Pratap, B.; Sharma, S.; Kumari, P.; Raj, S. Mechanical properties prediction of metakaolin and fly ash-based geopolymer concrete using SVR. J. Build. Pathol. Rehabil. 2024, 9, 1. [Google Scholar] [CrossRef]
  32. Speiser, J.L.; Miller, M.E.; Tooze, J.; Ip, E. A comparison of random forest variable selection methods for classification prediction modeling. Expert Syst. Appl. 2019, 134, 93–101. [Google Scholar] [CrossRef]
  33. Hegde, Y.; Padma, S.K. Sentiment analysis using random forest ensemble for mobile product reviews in Kannada. In Proceedings of the 2017 IEEE 7th International Advanced Computing Conference (IACC), Hyderabad, India, 5–7 January 2017; pp. 777–782. [Google Scholar]
  34. Lei, X.; Fang, Z. GBDTCDA: Predicting circRNA-disease associations based on gradient boosting decision tree with multiple biological data fusion. Int. J. Biol. Sci. 2019, 15, 2911–2924. [Google Scholar] [CrossRef]
  35. Wang, D.-N.; Li, L.; Zhao, D. Corporate finance risk prediction based on LightGBM. Inf. Sci. 2022, 602, 259–268. [Google Scholar] [CrossRef]
  36. Bao, Y.; Liu, Z. A fast grid search method in support vector regression forecasting time series. In Intelligent Data Engineering and Automated Learning–IDEAL 2006: 7th International Conference, Burgos, Spain, September 2006; Proceedings 7; Springer: Berlin/Heidelberg, Germany, 2006; pp. 504–511. [Google Scholar]
  37. Sabzekar, M.; Hasheminejad, S.M.H. Robust regression using support vector regressions. Chaos Solitons Fractals 2021, 144, 110738. [Google Scholar] [CrossRef]
  38. Allende-Cid, H.; Salas, R.; Allende, H.; Ñanculef, R. Robust alternating AdaBoost. In Progress in Pattern Recognition, Image Analysis and Applications, November, 2007; Springer: Berlin/Heidelberg, Germany, 2007; pp. 427–436. [Google Scholar]
  39. Wu, Y.; Ke, Y.; Chen, Z.; Liang, S.; Zhao, H.; Hong, H. Application of alternating decision tree with AdaBoost and bagging ensembles for landslide susceptibility mapping. Catena 2020, 187, 104396. [Google Scholar] [CrossRef]
  40. Ahmadianfar, I.; Heidari, A.A.; Noshadian, S.; Chen, H.G.; Omi, A.H. INFO: An efficient optimization algorithm based on weighted mean of vectors. Expert Syst. Appl. 2022, 195, 116516. [Google Scholar] [CrossRef]
  41. Fan, R.; Meng, D.; Xu, D. Survey of research process on statistical correlation analysis. Math. Model. Its Appl. 2014, 3, 1–12. [Google Scholar]
  42. Chemmakha, M.; Habibi, O.; Lazaar, M. Improving machine learning models for malware detection using embedded feature selection method. IFAC-PapersOnLine 2022, 55, 771–776. [Google Scholar] [CrossRef]
  43. Wang, G.; Fu, G.; Corcoran, C. A forest-based feature screening approach for large-scale genome data with complex structures. BMC Genet. Data 2015, 16, 148. [Google Scholar] [CrossRef]
  44. Yao, X.; Fu, X.; Zong, C. Short-term load forecasting method based on feature preference strategy and LightGBM-XGboost. IEEE Access 2022, 10, 75257–75268. [Google Scholar] [CrossRef]
  45. Yang, S.; Fountoulakis, K. Weighted flow diffusion for local graph clustering with node attributes: An algorithm and statistical guarantees. In Proceedings of the 40th International Conference on Machine Learning, Honolulu, HI, USA, 23–29 July 2023. [Google Scholar]
  46. Xu, K.; Chen, L.; Wang, S. Data-driven kernel subspace clustering with local manifold preservation. In Proceeding of the 2022 IEEE International Conference on Data Mining Workshops (ICDMW), Orlando, FL, USA, 28 November–1 December 2022. [Google Scholar]
Figure 1. Box plots of features.
Mathematics 12 02231 g001aMathematics 12 02231 g001b
Figure 2. Two embedded methods for filtering feature values. The ten features with the largest scores were obtained using the methods of (a) RF and (b) XGBoost.
Mathematics 12 02231 g002aMathematics 12 02231 g002b
Figure 3. Feature weight ratio of the weighted average model.
Mathematics 12 02231 g003
Figure 4. Fitting effect of four models: (a) Comparison of real and predicted values of RF. (b) Comparison diagram of LightGBM true and predicted values. (c) Comparison diagram of SVR true and predicted values. (d) AdaBoost comparison graph between true and predicted values.
Mathematics 12 02231 g004
Figure 5. The fivefold cross-training process of the RF model.
Mathematics 12 02231 g005
Figure 6. The optimization flow chart of the metalearner.
Mathematics 12 02231 g006
Figure 7. The flow chart of the stacking integration model.
Mathematics 12 02231 g007
Figure 8. Fitting effect of the stacking integrated model.
Mathematics 12 02231 g008
Figure 9. The pump inspection cycle of the studied oil production plant in Daqing, Heilongjiang, China.
Mathematics 12 02231 g009
Table 1. Missing value summary.
Feature TypeProduction DaysThe Max. LoadThe Min. LoadTubing PressureCasing PressureDaily Oil Production
quantity1105341253372
Table 2. Results of four model grid search methods.
MethodParametersParameter Definition
RF n estimators = 150 number of basic decision trees
max features = 120 use the maximum number of fields
LightGBM n estimators = 100 number of basic decision trees
num leaves = 31 leaf count
learning rate = 0.1 learn rate
SVR regressor kerne = sigmod kernel type
regresspr c = 1000 Penalty factor
regressor gamma = 0.01 kernel coefficient
Adaboost random state = 97 random seed
n estimators = 100 number of base models
learning rate = 0.3 learn rate
Table 3. Measurement indicators of the four models.
MethodRMSEMAE R 2
RF2.720.9890.19%
LightGBM4.312.1888.77%
SVR4.771.3586.16%
AdaBoost5.133.1283.24%
Table 4. Training results of the three metamodels.
AccuracyRidge RegressionRFSVR
Training96.06%98.73%97.65%
Test91.17%89.61%89.96%
Table 5. Comparison of forecasting performance between stacking and single model.
MethodsRMSEMAE R 2
stacking0.730.4592.11%
RF2.720.9890.19%
LightGBM4.312.1888.77%
SVR4.771.3586.16%
AdaBoost5.133.1283.24%
Disclaimer/Publisher’s Note: The statements, opinions and data contained in all publications are solely those of the individual author(s) and contributor(s) and not of MDPI and/or the editor(s). MDPI and/or the editor(s) disclaim responsibility for any injury to people or property resulting from any ideas, methods, instructions or products referred to in the content.

